1Q 2020 Results Analyst and Investor Update - Folie
←
→
Page content transcription
If your browser does not render page correctly, please read the page content below
1Q 2020 Results

Analyst and Investor Update

May 26, 2020

All figures (€) as at 31 March 2020, unless otherwise stated
Covid-19 Results Financing Property Appendix
1Q 2020 Results
Highlights
Results
Rental income rose by 7.2% to € 62.4 m, driven by organic portfolio growth of recent months and higher occupancy levels.
FFO I stood at € 30.0 m (€ 0.32 per share) on the key date, an increase of 1.4% on the reference value of last year.
Consolidated net income totalled € 33.5 m (2019: € 5.4 m).
Robust balance sheet profile with strong equity ratio of 47.5% and defensive net LTV of 32.5%.
Cash and cash equivalents stood at € 800.3 m (31.12.2019: € 439.1 m) at reporting date.
EPRA NAV (undiluted) at € 38.83 per share (31.12.2019: € 38.36 per share).
Portfolio / Development
Portfolio occupancy rate maintained on high level at 95.2%.
Completion of fully let MY.B development project in Berlin (14,800 sqm) with a total investment volume of € 70 m and transfer to the investment
portfolio in the first quarter of 2020 (yield on cost achieved 7.2%).
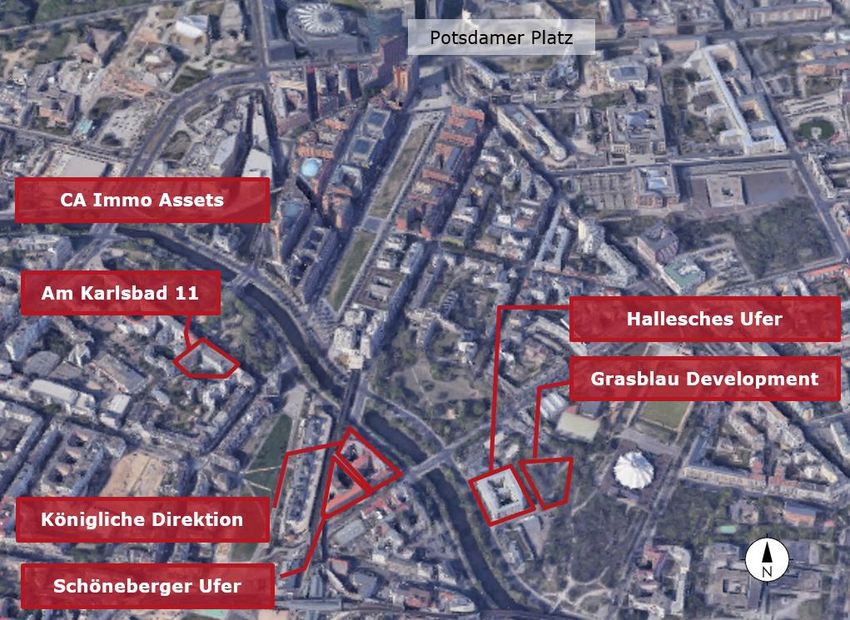
Acquisition of “Karlsbad 11” office property in Berlin (investment volume € 76 m) in excellent location close to Potsdsamer Platz and significant
reversionary rent potential in the medium term.
Financing
End of January 2020 CA Immo successfully placed its inaugural € 500 m fixed rate senior unsecured benchmark bond with a 7-year maturity and an
annual coupon of 0.875%, which has additionally bolstered up the company’s healthy liquidity position and drives a further optimization of the capital
structure.
2
BUSINESS UPDATE / COVID-19
Covid-19 Results Financing Property Appendix
Business Update / Covid-19
Asset management update
Status quo rent collection Rental income split 1 (1Q 2020) Incentives granted to date by type of incentive 2
All office buildings are fully operational for tenants. 3% Deferral
0% 2%
CA Immo’s asset management teams are dealing with Office
5%
Waiver
reasonable tenant requests on a case-by-case basis. 2% 23%
Hotel
1Q 2020 rent collection stood at 97% of invoiced rent. Total support Acceleration of in
granted 2020: 49% place incentives
Including April, rent collection stood at 93% YTD 2. Retail
€ 4.4 m
Rent free in
A number of tenants are invoiced quarterly in advance and Logistics 19% return of
therefore are still within their scheduled payment period. extension
Not yet specified
90% Others 6%
April was the first full month impacted – in particular in
Austria and Romania where there is an official state of
emergency (retail, hotel, and F&B occupiers are exempt from
paying rent). These measures are expected to be relaxed
Incentives granted to date by country 2 Incentives granted to date by category 2
during the month of May in both countries.
The majority of support came in the form of deferred rent,
2% 3%
however, we also agreed to accelerate existing contractual Gastronomy
5% Austria
incentives that had not been used by tenants and granted
21%
rent free in exchange for lease extensions / re-negotiations. Czechia 27% 17% Retail
20%
Lost rent due to mandated closure (e.g. hotel and retail in Germany
Total support Total support Hotel
Austria and Romania) totalled only € 159 k, and we are still granted 2020: Hungary granted 2020:
8%
negotiating with tenants representing € 160 k of invoiced € 4.4 m € 4.4 m Bus & Car Park
8% Poland
rent for the month of April. Operator
No tenant insolvencies have occurred to date and no space Romania Office
19%
was handed back. 19%
Serbia 51%
Legally enforced
Slowdown of new leasing activity but advanced negotiations shutdown
are progressing.
1 Annualised rent 2 As at May 25, 2020 4
Covid-19 Results Financing Property Appendix
Business Update / Covid-19
No major disruptions to development business
Construction sites
No major Covid-19 disruptions have occurred on CA Immo’s active construction sites (no negative impact in terms of increased costs and delays).
Active development projects have actually picked up pace in recent weeks.
Due to good work preparations and implemented hygiene measures, there are no Covid-19 cases to our knowledge.
Development
Financing (on a secured non-recourse basis) has been secured for all projects (both for the construction period and - as regards projects earmarked for
our own portfolio - for a holding period up to 10 years). CA Immo has non-utilized credit lines in the amount of € 300 m fully committed by banks for
active developments under construction, which can be drawn according to construction progress.
On average all active development projects have an average pre-let level of 60%.
No additional development projects are committed at this point and will only be started if all requirements and preconditions are met.
Construction starts envisaged for the second half of 2020 have been postponed (e.g. Campus Freimann in Munich).
Zoning/planning for all pipeline projects and preparation work for new developments is progressing.
5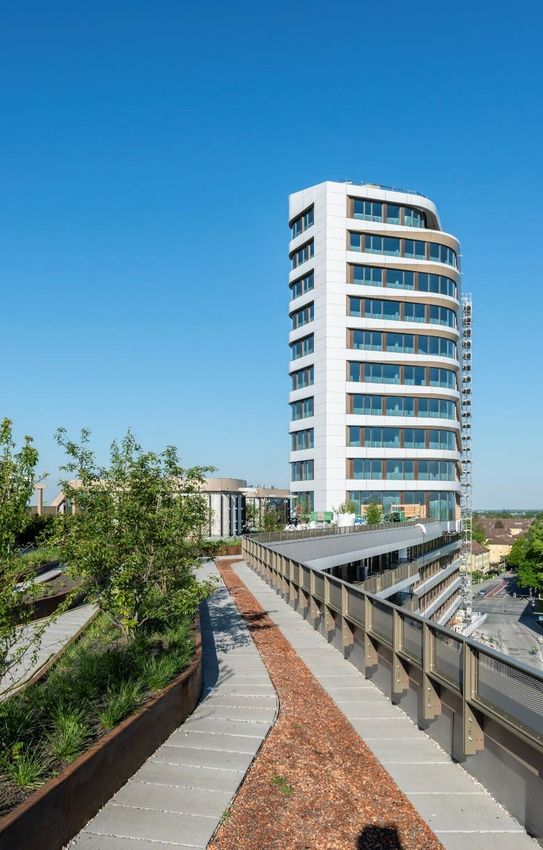
Covid-19 Results Financing Property Appendix
Business Update / Covid-19
Strong balance sheet and liquidity following Benchmark bond issue
Balance sheet and liquidity
As at March 31, 2020 CA Immo’s cash on balance sheet amounted to € 800 m.
CA Immo’s unencumbered asset pool ( € 2.4 bn as at 31 March 2020) will further be extended by the Karlsbad acquisition in Berlin ( € 76 m).
Additional liquidity reserves RCF (€ 45 m) and treasuries ( 5.8 m shares with a value of € 170 m at current share price level).
Diversified funding base with an increasing average debt duration and well-staggered maturity profile with low amounts due over the next two years
(refer to page 22 of the presentation).
Moody’s has confirmed our Baa2 investment grade rating and stable outlook on March 18, 2020.
Measures to preserve liquidity have been put in place (e.g. deferral of non-essential capex/maintenance).
Earnings outlook FY 2020
We are unable to assess conclusively the full impact of the Covid-19-pandemic on our operational business at this time. As restrictive measures on our
core markets continue to ease, we expect greater clarity on the consequences for our tenant base, and on our rental revenue as a result. We therefore
plan to provide an update on our FFO expectation for business year 2020 along with the publication of our half-year results end of August at the latest.
Dividend
For business year 2019, the Management Board might propose a dividend of up to € 1.00 per share.
The profit appropriation proposal reflects the current assessment of the Management and Supervisory Boards. Since neither the duration of the Covid-19
crises nor the further financial, general business and real estate specific impacts can be predicted with certainty, the Management and Supervisory
Boards will evaluate the proposal for decision until the Annual General Meeting on an ongoing basis and reserve the right to modifications.
CA Immo has decided to reschedule its Annual General Meeting from originally 7 May 2020 to 25 August 2020. As a result, the resolution on the
appropriation of net profit for 2019 and a dividend payment will also be postponed.
CA Immo did not apply for any direct state support and none of its staff is on some sort of temporary unemployment schedules (therefore no legal
restrictions linked to dividend payments in Austria).
6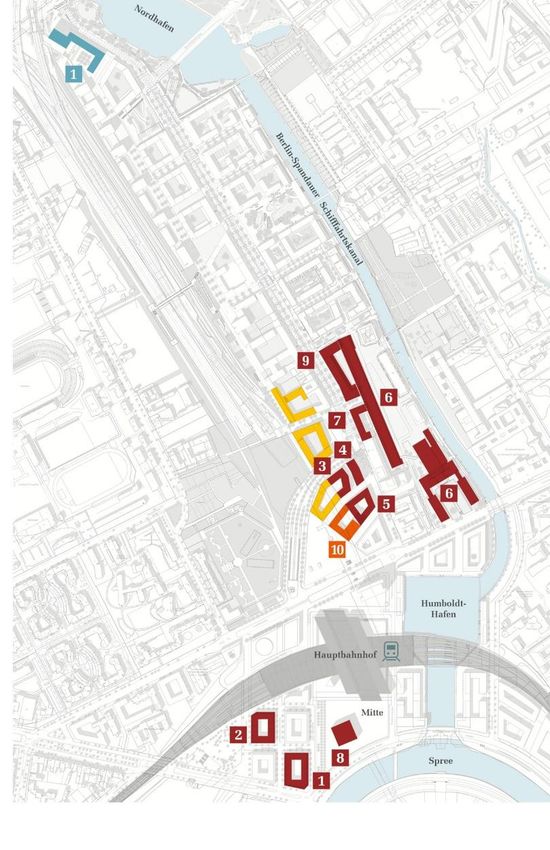
Covid-19 Results Financing Property Appendix
Business Update / Covid-19
Expected strategic implications and CA Immo’s response to it (I)
Expected strategic implications
Uncertainty and wider economic slowdown should translate into flight to safety and back Germany as safe haven with sustained strong transactional
activity in Top 7 - locations for the best office products.
Increasing bifurcation between A- and B-class properties on leasing and transactional side.
Modern Class-A core+ office assets which offer green, sustainable and healthy work environments will be attracting strong interest from investors,
financer as well as occupiers.
We fundamentally believe that there will be continued structural demand for such quality space in the future, in particular by larger corporate
occupiers with an aim to enhance productivity and corporate culture and to fully comply with rising ESG requirements.
More emphasis will be put on safety and health (right ventilation to circulate air flow, contactless entry from street to desk, high sanitation
standards, etc.).
Smart urbanization will remain a strong trend and an effective way to tackle climate change.
Occupiers will more and more rethink their footprint resulting in a structural impact on offices in terms of:
Use (complying with increasingly flexible work approach of tenants, larger common areas and break-out spaces on office floors, etc.).
Technology (full digitalisation of buildings) and
Location (e.g. decentralisation within cities at different touch points, optimised public transport connectivity, etc.).
Interest rates are expected ro remain lower for longer in light of increasing sovereign indebtedness.
Positive yield spread between real estate and sovereign debt should prevail longer than expected pre Covid-19.
High-quality prime office products will continue to see strong investor demand.
7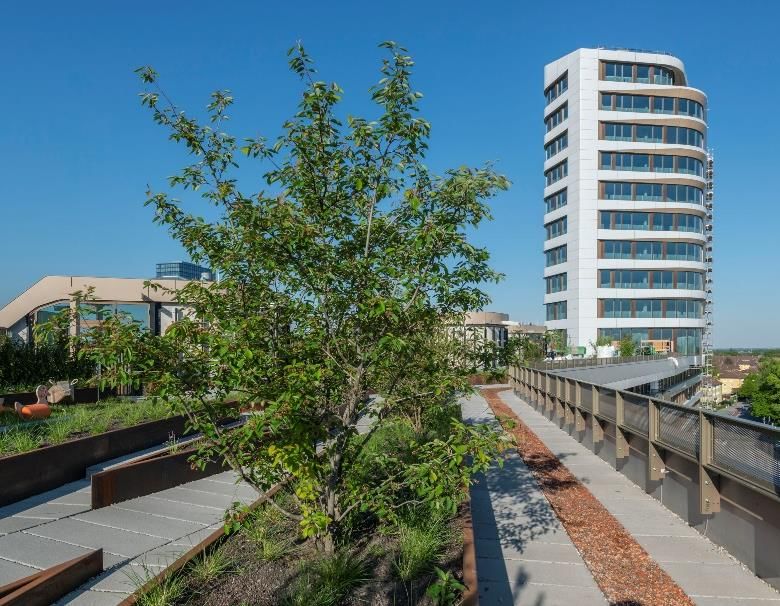
Covid-19 Results Financing Property Appendix
Business Update / Covid-19
Expected strategic implications and CA Immo’s response to it (II)
Strategic positioning
High-quality investment portfolio and tenant base with a rising share in Germany
CA Immo’s portfolio strategy is based on high-quality core+ office assets in terms of both locations and building quality with a clear focus on
fundamentally attractive gateway cities in Germany, Austria and Central and Eastern Europe with positive long-term structural trends.
Focus on inner-city CBD areas with low vacancy rates.
No secondary market exposure.
Highly diversified blue-chip tenant base geared towards the service industry with a meaningful share of tenants attributable to the technology
sector generates a resilient recurring cash flow.
CA Immo’s access to prime assets in Germany and platform strength will secure competitive advantage
Organic capacity and in-house skills to produce state-of-the-art buildings, which target large corporate occupiers and fulfil their requirements.
Ability to adapt with strong in-house competences covering full real estate value chain is a key strength of CA Immo.
Continuous de-risking of platform
We have made major progress over the last 12 months to improve our risk/return profile:
Sale of 7 non-core assets with 27% premium on book values in 2019 (exit of regional CEE, reduction of hotel exposure).
Sale of Immofinanz stake in 2019.
Successfully entered Eurobond market, diversified funding base and improved financing metrics in 1Q 2020.
We will continuously look at opportunities to divest our remaining non-core assets.
Pause on new construction starts for the time being, albeit planning and preparation works are proceeding as planned.
8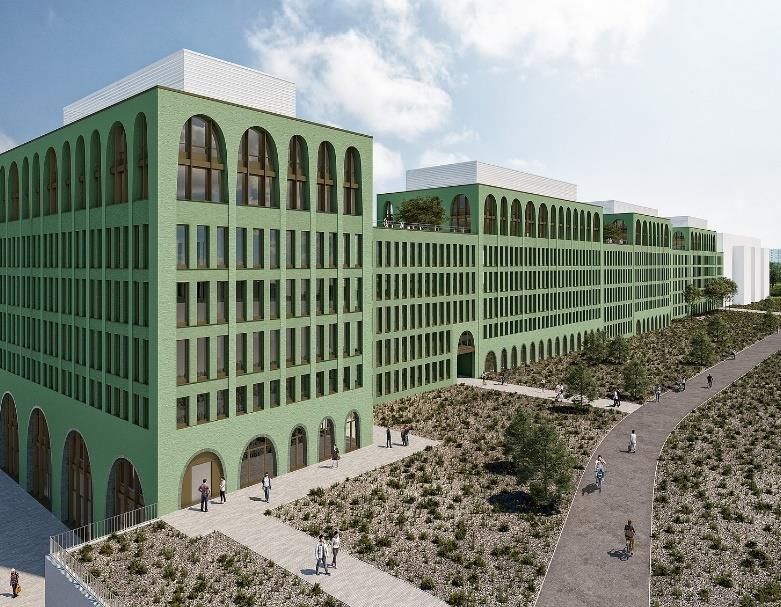
1Q 2020 RESULTS
Covid-19       Results   Financing           Property         Appendix

1Q 2020 Results
Key Metrics

            Key metrics                                                    1Q 2020            1Q 2019                     +/(-)

            Rental income                                  €m                  62.4                   58.3                7.2%

            Net rental income                              €m                  49.6                   46.7                6.1%

            EBITDA                                         €m                  38.8                   38.1                1.8%

            EBIT                                           €m                  26.1                   53.5              (51.1%)

            Earnings before tax (EBT)                      €m                  46.6                   13.7              >100%

            Consolidated net income            1           €m                  33.5                    5.4              >100%

            FFO I                                          €m                  30.0                   29.6                1.4%

            FFO II                                         €m                  15.9                   25.1              (36.5%)

            NAV (IFRS)         2                           €m               3,001.2              2,651.6                 13.2%

            EPRA NAV       2                               €m               3,612.6              3,113.2                 16.0%

            Key metrics per share                                          1Q 2020            1Q 2019                     +/(-)
            Net rental income                               €                  0.53                   0.50                6.1%

            FFO I                                           €                  0.32                   0.32                1.4%

            FFO II                                          €                  0.17                   0.27              (36.5%)

            Consolidated net income            1            €                  0.36                   0.06              >100%

            NAV (IFRS)         2                            €                 32.26                  28.50               13.2%

            EPRA NAV       2                                €                 38.83                  33.46               16.0%

1   Attributable to the owners of the parent 2 Undiluted                                                                                 10
Covid-19 Results Financing Property Appendix
1Q 2020 Results
Solid start into business year 2020
Profit and loss (€ m) 1Q 2020 1Q 2019 yoy Major earnings driver (1Q)
Rental income 62.4 58.3 7.2% 1
1 Rental income increase driven by
Net rental income 49.6 46.7 6.1%
Rental
organicincome increase
portfolio growthdriven by
of recent
Other property development expenses (0.7) (1.5) (53.7%) portfolio expansion in 2018.
months and higher occupancy levels.
Property sales result 1
0.1 0.9 (87.3%)
Incl. IFRS related
Covid-19 16 effects (refer
direct P&Ltoeffect
next
Income from services rendered 2.3 1.9 23.7% page
belowfor details).
€ 0.3 m in 1Q (rent waiver due
Indirect expenses (12.8) (10.4) 22.4% to legally enforced shutdown).
Other operating income 0.3 0.5 (45.7%)
2
EBITDA 38.8 38.1 1.8% Negative value adjustments due to
Depreciation and impairment/reversal (1.2) (1.1) 5.2% the current economic situation in
Result from revaluation
connection with the Covid-19
2 (11.1) 16.1 n.m
pandemic concentrated on directly
Result from joint ventures (0.4) 0.4 n.m. affected properties with the main
EBIT 26.1 53.5 (51.1%) types of use being hotel and retail.
Financing costs (11.4) (9.5) 20.3%
3
Result from derivatives 35.7 (28.2) n.m. Non-cash valuation effects in
3
connection with interest rate
Result from financial investments (1.1) 0.8 n.m.
hedges (€ -5.8 m) and convertible
4 Other financial result (2.8) (2.9) (3.5%) bond (€ 41.5 m).
Financial result 20.5 (39.7) n.m 4
Earnings before tax (EBT) 46.6 13.7 >100% Incl. a one-off effect related to the
buyback of outstanding corporate
Income tax 2
(13.1) (8.3) 57.9%
bonds in the amount of € -5.1 m
Consolidated net income 3
33.5 5.4 >100% (difference between IFRS book
value and repurchase price)
1 Result from trading and construction works + Result from the sale of investment properties 2 Current income taxes + Deferred taxes 3 Attributable to the owners of the parent 11Covid-19 Results Financing Property Appendix
1Q 2020 Results
Development completions and higher occupancy rates drive top line
Key drivers 1Q 2020 rental income bridge (€ m)
Positive top line development driven by organic
portfolio growth of recent months:
Completion of development projects MY.O
(Munich), Bürogebäude am Kunstcampus
(Berlin) and MY.B. (Berlin).
Increase in occupancy in completed offices ViE
(Vienna) and Orhideea Towers (Bucharest) and 49.6
acquired offices Warsaw Spire C, Campus 6.1
(Bucharest) and Visionary (Prague).
Operating margin 1 and portfolio occupancy
sustained at high level.
1Q 2020 rental income (€ m) 1Q 2020 net rental income (€ m) 1Q 2020 operating margin 1 2 (%)
63.0 50.0 80.5%
+7.2% +6.1%
62.0 (79) bps
49.0
80.0%
61.0
48.0
60.0
79.5%
59.0 47.0
58.0
79.0%
46.0
57.0
58.3 62.4 46.7 49.6 80.1% 79.4%
56.0 45.0 78.5%
1Q 2019 1Q 2020 1Q 2019 1Q 2020 1Q 2019 1Q 2020
1 Net rental income / Rental income 2 Adjusted for IFRS 16 effects the NRI margin stood at 91.1% (2019: 92.2%) 12Covid-19 Results Financing Property Appendix
1Q 2020 Results
Accounting treatment of Covid-19 effects
General
Any lease payment, except pure variable lease payments that do not depend on an index or a rate, have to be recognized on a straight-line basis.
Increase in rent and service charge receivables due to outstanding payments.
Rent holiday/reduction due to legal restrictions (hotel, gastronomy, retail)
A rent holiday or reduction due to legal restrictions like force majeure, state of emergency or restrictions in the use of the property reduces the affected
rental income in the respective period direct P&L effect.
Rent holiday/reduction not caused by legal restrictions (office)
In accordance with IFRS 16.81 all incentives in relation to a new or renewed operating lease agreement are considered as part of the agreed net
consideration to be received, irrespective of the incentive's nature or form as well as the timing of payments.
Therefore, such agreements should be recognised as a component of revenue (rental income).
Spread over remaining lease term direct P&L effect (mitigated by recognition on straight-lined basis).
Rent deferral
No effect as only payment is shifted into the future, but total consideration remains unchanged ( increase in receivables) balance sheet effect.
Service charges
Any reduction of service charges (nevertheless if lease or non-lease component) also represent a lease incentive in accordance with IFRS 16.81,
which has to be spread over the remaining lease term.
13Covid-19 Results Financing Property Appendix
1Q 2020 Results
FFO I at € 30.0 m 1.4% above value of 2019
Funds from operations (€ m) 1Q 2020 1Q 2019 yoy Major earnings driver (1Q)
1 1
Net rental income 49.6 46.7 6.1%
Result from services Rental income increase driven by
2.3 1.9 23.7%
organic portfolio growth of recent
Other development expenses (0.7) (1.5) (53.7%) months and higher occupancy
Other operating income
levels.
0.3 0.5 (45.7%)
Other operating income/expenses 1.9 0.9 109.1% 2
Indirect expenses (12.8) (10.4) 22.4%
Financing cost increase mainly driven
Result from joint ventures 0.2 0.1 37.5% by new corporate bond issuance.
2 Financing costs (11.4) (9.5) 20.3%
3
Result from financial investments 0.2 0.3 (32.6%)
Adjusted non-recurring effects
3 Non-recurring adjustments 2.3 1.4 63.1% primarily related to:
FFO I 30.0 29.6 1.4% Development expenses: € 0.6 m
FFO I per share 0.32 0.32 1.4% Financing expenses: € 1.7 m
Property sales result 1
(0.1) 0.9 (113.9%) Administrative expenses:
Current income tax 2
(6.4) (4.0) 60.7% € 0.2 m
Non-recurring readjustments (2.5) (21.2) (88.3%)
FFO II 15.9 25.1 (36.5%)
FFO II per share 0.17 0.27 (36.5%)
1 Incl. at equity property sales result 2 Incl. at equity current income tax 14Covid-19 Results Financing Property Appendix
1Q 2020 Results
Rental income growth offsets higher expenses
1Q 2020 FFO I bridge (€ m)
3
2
1
4
30.0
1 Higher occupancy in acquired office buildings Warsaw Spire C, Campus 6.1 (Bucharest) and Visionary (Prague) and completed development projects
ViE (Vienna) and Orhideea Towers (Bucharest); large scale letting at Erdberger Laende property in Vienna
2 Completion of development projects MY.O (Munich), Bürogebäude am Kunstcampus (Berlin) and MY.B. (Berlin)
3 Higher personnel expenses on the back of increased workforce
4 Mainly driven by new corporate bond issuance
15Covid-19 Results Financing Property Appendix
1Q 2020 Results
Balance sheet as at March 31, 2020
Balance sheet (€ m) 31.03.2020 31.12.2019 +/(-) Comments
Investment properties 4,548.7 4,292.9 6.0% 1
1
Properties under development 619.1 817.1 (24.2%) Completed development projects MY.B
Own-used properties 14.5 15.0 (3.6%) and Cube (both Berlin) were reclassified
Other long-term assets 13.1 12.9 0.9%
into investment properties.
Investments in joint ventures 67.6 67.8 (0.2%) 2
Financial assets 82.9 83.7 (0.9%)
Incl. land reserves in Germany (carried at
Deferred tax assets 1.5 1.8 (17.5%) cost).
Assets held for sale 0.0 0.0 n.m.
3
2 Properties held for trading 63.5 61.3 3.5%
Cash and cash equivalents 800.3 439.1 82.2%
€ 500 m bond issuance and buy-back of
3
outstanding bonds ( € 100 m) reflected.
Other short-term assets 101.4 97.0 4.6%
Total assets 6,312.6 5,888.7 7.2%
Shareholders‘ equity 3,001.3 2,968.0 1.1%
3 Long-term financial liabilities 2,204.1 1,850.9 19.1%
Other long-term financial liabilities 128.7 164.1 (21.6%)
Deferred tax liabilities 479.4 473.0 1.4%
Short-term financial liabilities 302.6 246.5 22.8%
Other short-term liabilities 196.5 186.2 5.5%
Total liabilities and shareholders‘ equity 6,312.6 5,888.7 7.2%
16Covid-19 Results Financing Property Appendix
1Q 2020 Results
Balance sheet metrics as at March 31, 2020
Balance sheet 31.03.2020 31.12.2019 +/(-)
Total assets €m 6,312.6 5,888.7 7.2%
Property assets €m 5,245.8 5,186.4 1.1%
Cash and cash equivalents €m 800.3 439.1 82.2%
Shareholders‘ equity €m 3,001.3 2,968.0 1.1%
Total debt €m 2,506.7 2,097.3 19.5%
Net debt €m 1,704.5 1,656.0 2.9%
Secured debt €m 1,105.6 1,074.0 2.9%
Unencumbered property assets €m 2,409.3 2,370.5 1.6%
Balance sheet ratios 31.03.2020 31.12.2019
Equity ratio % 47.5% 50.4% (286 bps)
LTV % 47.8% 40.4% 734 bps
LTV (net) % 32.5% 31.9% 60 bps
Gearing % 83.5% 70.7% 1,285 bps
Gearing (net) % 56.9% 55.8% 106 bps
Rating 31.03.2020 31.12.2019
Rating (Moody‘s) Baa2 Baa2
Outlook Stable Stable
Total debt / Total assets % 39.7% 35.6% 409 bps
Net debt / Total assets % 27.0% 28.1% (113 bps)
Secured debt / Total assets % 17.5% 18.2% (72 bps)
17Covid-19 Results Financing Property Appendix
1Q 2020 Results
EPRA NAV up 1.2% YTD
Net asset value (€ m) 31.03.2020 31.03.2020 31.12.2019 EPRA NAV per share (undiluted) yoy
diluted undiluted undiluted
40.00
NAV (IFRS equity) 3,001.2 3,001.2 2,967.9 +16.0%
39.00
Exercise of options 203.5 0.0 0.0 38.00
NAV after exercise of options 3,204.7 3,001.2 2,967.9 37.00
36.00
NAV per share 32.16 32.26 31.90
35.00
38.83
34.00
Value adjustments 1 0 0 0
33.00
Own use properties 7.6 7.6 7.5
32.00
33.46
Properties held as current assets 130.8 130.8 127.3 31.00
Financial instruments 0.0 0.0 0.0 30.00
1Q 2019 1Q 2020
Deferred taxes 2 473.0 473.0 466.1
EPRA NAV 3,816.1 3,612.6 3,568.9
EPRA NAV per share 38.29 38.83 38.36 EPRA NAV per share (undiluted) was up 16.0%
yoy and 1.2% since the beginning of the year.
Value adjustments 1
A potentially dilutive effect was taken into
Financial instruments 0.0 0.0 0.0 account as the convertible bond (€ 200 m) was
trading in the money at reporting date.
Liabilities 11.4 (8.4) (99.6)
Deferred taxes 3 (360.5) (357.0) (335.3) The strike price of the convertible bonds stood
EPRA NNNAV 3,467.0 3,247.2 3,133.9 at € 30.17 as at December 31 compared to the
share price of € 30.70, which would translate
EPRA NNNAV per share 34.79 34.91 33.69
into an additional number of shares of 6.6 m.
Number of shares outstanding 4 99,657,313 93,028,299 93,028,299
1 Incl. proportional values of joint ventures 2 Deferred tax assets net of tax goodwill 3 Discounted 4 Excl. treasury shares 18Covid-19 Results Financing Property Appendix
Balance Sheet Ratios
Robust financial profile with strong equity base
Leverage Interest coverage
60.0% 6.0
50.0% 47.8% 5.0
47.5%
40.0% 4.0 3.7 x
3.6 x
30.0% 32.5% 3.0
20.0% 2.0
10.0% 1.0
- -
2016 2017 2018 2019 Q1 2020 2016 2017 2018 2019 Q1 2020
Equity ratio Loan-to-value Loan-to-value (net) FFO I interest cover FFO I net interest cover
Unencumbered assets (€ m) Capital structure
3,000 60.0%
45.0%
2,500 45.9% 50.0% 40.0% 39.7%
35.0%
2,000 40.0% 30.0%
27.0%
25.0%
1,500 30.0%
20.0%
17.5%
1,000 20.0% 15.0%
10.0%
500 10.0%
5.0%
- - -
2016 2017 2018 2019 Q1 2020 2016 2017 2018 2019 Q1 2020
Unencumbered property assets
Total debt / Total assets Net debt / Total assets
Unencumbered property assets / Property portfolio
Secured debt / Total assets
19FINANCING
Covid-19 Results Financing Property Appendix
Financing
Highly successful Benchmark bond issuance in 1Q 2020
Inaugural € 500 m 7-year senior benchmark issue Terms
End of January 2020 CA Immo successfully priced its Issue ratings Baa2 by Moody‘s
inaugural € 500 m benchmark bond with an orderbook Format Senior unsecured, RegS Bearer
more than 4 oversubscribed at final terms. Size € 500 m
The final yield of 0.998% represents the tightest yield Tenor 7 years
ever achieved on an inaugural EUR benchmark bond Net debt/ Total assets (≤ 60%), Secured debt / Total assets
Covenants
offering for an office real estate corporate. (≤ 45%), ICR ≥ 1.8x (EBITDA recurring / Net financing costs)
Coupon (fixed, p.a.) 0.875%
Transaction drives further capital structure
Re-offer yield (p.a.) 0.998%
optimization with positive impact on key financing
metrics.
Debt maturity profile incl. Benchmark bond and buy-back of outstanding bonds (€ m)
Net proceeds of € 100 m (post buy-back of
700
outstanding corporate bonds) additionally bolsters up
600
healthy liquidity position.
500 Repayment of € 100 m of
outstanding bonds € 500 m
Cash tender offer for outstanding corporate bonds new issuance
400
€ 100 m of Benchmark proceeds were used for 300
partial repayment of outstanding bonds carrying
200
interest above CA Immo’s average cost of debt at
100
an offer premium of 10 bps.
0
CB due 2021 (1.875%, € -32.6 m) 2020 2021 2022 2023 2024 2025 2026 2027 2028 2029+
Secured debt (income-producing assets) Secured debt (development assets)
CB due 2022 (2.750%, € -32.6 m)
Corporate bonds Convertible bonds
CB due 2023 (2.750%, € -33.4 m)
21Covid-19 Results Financing Property Appendix
Financing
Well-balanced maturity profile and diversified debt structure
Debt structure 1 Debt maturity profile (€ m)
Well-staggered maturity profile with low amounts due 700
over the next two years. 600
500
Follow-up financings have been secured for
400
construction loans (secured debt developments).
300
100% of bank financings and bonds are euro- 200
denominated
100
Unencumbered property asset pool of € 2.4 bn. 0
2020 2021 2022 2023 2024 2025 2026 2027 2028 2029+
2
Secured debt (income-producing assets) Secured debt (development assets)
Corporate bonds Convertible bonds
Debt structure 1 (€ m) Debt maturity profile (€ m)
Bonds 700
3%
4% Unicredit 600 Secured debt maturities
2021: one prime office in Prague
4% 3% DZ Hyp 500 2022: three prime offices in Berlin
3%
4% 400
Pfandbriefbank
7% Total financial 300
liabilities € 2.5 bn Deutsche Hypo
55%
ING Bank 200
100
17% Bayern LB
0
Deutsche Postbank AG
2020 2021 2022 2023 2024 2025 2026 2027 2028 2029+
Other Austria Germany CEE Corporate bonds Convertible bonds
22
1 Excl. contractually fixed credit lines for follow-up financings of development projects. 2 Follow-up financings have been secured for construction loans of developments for own portfolioCovid-19 Results Financing Property Appendix
Financing
Benchmark bond issuance has further improved capital structure
Key financing metrics 1 Average debt maturity (years) 1
7.0
Benchmark bond issuance in January 2020 has
improved both average cost of debt and average 6.0
debt maturity. 5.2 years
5.0
4.0
Average financing costs incl. interest rate hedges
at 1.6% (excl. 1.4%). 3.0
2.0
Average debt maturity at 5.2 years.
1.0
Interest rate hedging ratio stands at 87%. -
1Q 2019 2Q 2019 3Q 2019 4Q 2019 1Q 2020
Average debt maturity Secured debt maturity Unsecured debt maturity
Hedging ratio (%) Average cost of debt (%) 1
2.20%
13% 2.00%
21%
1.80%
Floating
1.60%
1.56%
Hedging ratio
87% Fixed 1.40%
1.20%
Hedged
1.00%
66% 1Q 2019 2Q 2019 3Q 2019 4Q 2019 1Q 2020
Total all-in cost Secured all-in cost Unsecured all-in cost
23
1 Excl. contractually fixed credit lines for follow-up financings of development projectsPORTFOLIO
Covid-19 Results Financing Property Appendix
Property Portfolio
Key metrics
Property portfolio 31.03.2020 31.12.2019 +/(-)
Gross asset value (GAV) €m 5,245.8 5,186.4 1.1%
thereof investment properties €m 4,563.2 4,307.9 5.9%
thereof investment properties under development 1 €m 619.1 817.1 (24.2%)
thereof short-term assets 1 €m 63.5 61.1 3.5%
Investment portfolio 31.03.2020 31.12.2019 +/(-)
Gross asset value 2 €m 4,563.2 4,307.9 5.9%
thereof Austria % 12.5 13.3 (78 bps)
thereof Germany % 43.5 40.1 343 bps
thereof CEE % 44.0 46.6 (265 bps)
Number of properties # 79 77 2.6%
Gross leasing area (GLA) ‘000 sqm 1,478 1,440 2.7%
Office share % 89.1 88.3 77 bps
Weighted average lease term (WALT) years 4.4 4.2 4.2%
Gross initial yield (GIY) % 5.4 5.5 (7 bps)
Occupancy (economic) % 95.2 96.1 (91 bps)
1 Including land reserves, which in total account for a book value of € 280 m 2 Including own used properties 25Covid-19 Results Financing Property Appendix
Property Portfolio
Gross asset value up 15% yoy at € 5.2 bn
Key metrics (€ m) Portfolio by region and country (book value)
1Q 2020 FY 2019
11% 3% Germany
8%
Gross asset value (GAV) 5,246 5,186
Austria
8%
Germany
Investment properties 1 4,563 4,308 Hungary
51% CEE 10%
Total GAV: € 5.2 bn Total GAV: € 5.2 bn 50% Poland
Investment properties under
619 817 39%
development 2 Czechia
Austria 10%
Short-term assets 2 63 61 Romania
11% 3
Other
Comments Property portfolio split by city and portfolio structure (book value)
1%
GAV growth of 15.0% yoy.
Berlin Investment
7% 7%
Largest single market Germany with 51% (4Q 2019: properties
8% 22% Munich 5%
50%) is expected to grow further by development Vienna Land reserves
3
8%
completions. Budapest
Total GAV: € 5.2 bn Total GAV: € 5.2 bn
Warsaw Active
Active development projects and land reserves 8%
17% Prague development
(partly held as current and non-current assets) projects
10% Frankfurt
account for 11.8% of total property portfolio. Short-term
Bucharest 87% properties
10% 10%
4
Other
1 Including own used properties 2 Including land reserves, which in total account for a book value of € 280 m 3 Partly held as current and non-current assets 4 Serbia, Croatia, Slovakia 26Covid-19 Results Financing Property Appendix
Investment Portfolio
Core office focussed yielding portfolio across key economic centres in CE
Key metrics Investment portfolio split by region and country (book value)
1Q 2020 FY 2019
4% Germany
13%
Gross asset value (€ m) 1 4,563 4,308 9%
Austria
9%
Lettable area (‘000 sqm) 1,478 1,443 CEE Hungary
44% 43%
Total GAV: € 4.6 bn Total GAV: € 4.6 bn Poland
Germany
WALT (years) 4.4 4.2 11%
Czechia
Austria
43%
Office segment share (%) 89 89 Romania
11%
13% Other
Comments Investment portfolio split by city and property type (book value)
GAV growth of 5.9% YTD. 2%
Berlin 4%
7% 6%
Largest single market Germany with 43% (4Q 2019: 22% Munich
9%
40%) is expected to grow further by development Vienna
Office
completions. Budapest
9%
Total GAV: € 4.6 bn Total GAV: € 4.6 bn
Warsaw Hotel
Other usage types only serve to optimise actual strategic
17% Bucharest
real estate and account for a very small proportion of the 11% Other
Prague
total portfolio.
11% 12% Other 89%
Frankfurt
1 Including own used properties 27Covid-19 Results Financing Property Appendix
Investment Portfolio
Core market snapshots
Properties 15 Properties 8
Total area 210,100 sqm Total area 137,200 sqm
Gross initial yield 3.9% Gross initial yield 6.0%
Gross rental income € 38.6 m Gross rental income € 31.2 m
Occupancy (economic) 94.9% Occupancy (economic) 96.4%
WALT 6.7 years WALT 3.3 years
Properties 5
Total area 131,700 sqm
Gross initial yield 5.5%
Gross rental income € 21.7 m
Occupancy (economic) 95.3%
Properties 5 WALT 3.2 years
Total area 39,700 sqm
Gross initial yield 4.5% Properties 11
Gross rental income € 8.0 m Total area 218,600 sqm
Occupancy (economic) 98.9% Gross initial yield 6.8%
WALT 10.3 years Gross rental income € 35.8 m
Occupancy (economic) 93.1%
WALT 3.1 years
Properties 7 Properties 12 Properties 7
Total area 132,800 sqm Total area 217,900 sqm Total area 164,600 sqm
Gross initial yield 3.0% Gross initial yield 5.3% Gross initial yield 7.6%
Gross rental income € 23.5 m Gross rental income € 28.3 m Gross rental income € 30.2 m
Occupancy (economic) 80.8% Occupancy (economic) 91.1% Occupancy (economic) 93.6%
WALT 5.7 years WALT 4.3 years WALT 3.7 years
Includes properties used for own purposes, short-term property assets and the projects MY.O (Munich) and Cube (Berlin), which have been recently transferred to the investment portfolio and are still in the
stabilization phase. 28Covid-19 Results Financing Property Appendix
Investment Portfolio
High occupancy level maintained
Gross initial yield (%) 1 Occupancy (%, ecomomic) 1
9.0 8.5 100.0 98.8
8.0 7.6 98.0 96.4
6.8 95.3 95.2
7.0 96.0
6.0 93.6 93.5
6.0 5.5 94.0 93.1
5.3 5.4
91.5
5.0 92.0
3.9 90.0
4.0
88.0
3.0
86.0
2.0
84.0
1.0
82.0
0.0 80.0
Other Romania Hungary Poland Czechia Austria Germany Total Germany Poland Czechia Romania Other Hungary Austria Total
Gross initial yield (%) 1Q 2020 1Q 2019 +/(-) Occupancy (%, economic) 1Q 2020 1Q 2019 +/(-)
Investment portfolio 5.4 5.8 (36 bps) Investment portfolio 95.2 94.4 75 bps
Austria 5.3 5.3 0 bps Austria 91.5 89.2 232 bps
Germany 3.9 4.5 (63 bps) Germany 98.8 99.0 (25 bps)
Czechia 5.5 6.0 (43 bps) Czechia 95.3 89.3 595 bps
Hungary 6.8 7.2 (34 bps) Hungary 93.1 93.7 (64 bps)
Poland 6.0 6.2 (15 bps) Poland 96.4 96.6 (13 bps)
Romania 7.6 7.3 27 bps Romania 93.6 92.0 159 bps
Other 8.5 8.3 14 bps Other 93.5 94.2 (63 bps)
1Excludes properties used for own purposes, short-term property assets and the projects MY.O (Munich) and Cube (Berlin), which have been recently transferred to the investment portfolio and are still in the
stabilization phase; incl. land leases in Austria (around 106,000 sqm) 29Covid-19 Results Financing Property Appendix
Investment Portfolio
Well-staggered lease maturity profile
Weighted average lease term (WALT) WALT (years)
7.0 6.5
The average WALT to first break is 4.4 years. The 6.0
average WALT to end is 7.5 years.
5.0
4.4
Lease terms vary due to different local market 4.0 3.8
4.0 3.7
practices. 3.3 3.2 3.1
3.0
Strong retention rate across the portfolio.
2.0
CA Immo’s organic growth strategy and the
1.0
corresponding high share of own developments in
its largest portfolio Germany has resulted in a young 0.0
Germany Austria Other Romania Poland Czechia Hungary Total
portfolio age (< 8 years on average) and a longer
remaining lease term.
Lease expiry profile (€ m) 1
Because of the long rental contracts in Germany
90
35%
rising rents can only be captured via new 80
development lettings or in special situations where 70
tenants can be moved within the portfolio. 60
50
Under-rented German portfolio offers additional
40 16%
protection in downside scenarios. 15%
13%
30 11% 10%
20
10
0
2020 2021 2022 2023 2024 2025ff
Austria Germany CEE
1 Annualised rent 30Covid-19 Results Financing Property Appendix
Investment Portfolio
Blue Chip tenant structure with a service and technology focus (I)
Tenant base Tenant industry mix (annualized rent) Top 100 tenants (annualized rent)
Business Services
High degree of blue chip tenants with investment grade
Computers / Hi-
rating. Tech
9.6% 15.6% 14%
Consumer Services
No industry dependency due to diversified tenant 3.6%
& Leisure Public tenants
9.7% Financial Services
structure (> 1,000 tenants in total). 40%
0.3%
100% of 63% of
Manufacturing
Largest tenant PricewaterhouseCoopers accounts for 18.8% annualized rent IG-rated tenants
annualized rent Industrial & Energy
Private Individual
2.9% of annualized rental income. 13.3%
Professional Other tenants
46%
100% of leases across the entire portfolio are Services
12.1% 17.2% Public Sector /
euro-denominated and more than 90% are CPI-indexed. Regulatory Body
Other
Largest tenants Top tenants selection
Top 40 tenants account for 44% and top 100 tenants
account for 63% of total annualized rental income.
Average WALT (to break) of top 40 tenants at 5.9 years
and for top 100 tenants at 5.3 years.
45 of the top 100 tenants have an investment grade
rating and 12 account for the category “Public
sector/Regulatory body”.
31Covid-19 Results Financing Property Appendix
Investment Portfolio
Blue Chip tenant structure with a service and technology focus (II)
Top 40 tenants (annualized rent)
Tenant Industry City %
PWC Professional Services Munich 2.9%
InterCity Consumer Services & Leisure Berlin, Frankfurt 2.5%
Frontex Public Sector / Regulatory Body Warsaw 2.5%
Google Computers / Hi-Tech Munich 2.0%
Morgan Stanley Financial Services Budapest 1.9%
British American Tobacco Manufacturing Industrial & Energy Bucharest 1.9%
KPMG Professional Services Berlin 1.8%
Land Berlin Public Sector / Regulatory Body Berlin 1.8%
TOTAL Manufacturing Industrial & Energy Berlin 1.7%
Robert Bosch Consumer Services & Leisure Vienna 1.6%
Verkehrsbüro Consumer Services & Leisure Vienna 1.6%
Bundesanstalt für Immobilienaufgaben Public Sector / Regulatory Body Berlin 1.5%
Hypoport Financial Services Berlin 1.3%
salesforce Computers / Hi-Tech Munich 1.1%
Accenture Business Services Prague, Warsaw 1.0%
Volksbank Wien Financial Services Vienna 1.0%
ORANGE Computers / Hi-Tech Bucharest 1.0%
Thales Computers / Hi-Tech Bucharest 0.9%
Gleiss Lutz Professional Services Berlin 0.9%
Bitdefender Computers / Hi-Tech Bucharest 0.8%
32Covid-19 Results Financing Property Appendix
Investment Portfolio
Blue Chip tenant structure with a service and technology focus (III)
Top 40 tenants (annualized rent)
Tenant Industry City %
BT Roc Business Services Budapest 0.8%
Deutsche Bahn Consumer Services & Leisure Berlin 0.8%
Meininger Consumer Services & Leisure Frankfurt, Vienna 0.7%
NXP Semiconductors Manufacturing Industrial & Energy Budapest, Bucharest 0.7%
IKEA Consumer Services & Leisure Austria 0.7%
Benefit Systems Consumer Services & Leisure Warsaw 0.7%
DXC Technology Business Services Budapest 0.7%
Indeed Deutschland Business Services Duesseldorf 0.7%
Henkel Manufacturing Industrial & Energy Bratislava 0.6%
Finastra Computers / Hi-Tech Bucharest 0.6%
Centre for EU Transport Projects Public Sector / Regulatory Body Warsaw 0.6%
K&H Bank Financial Services Budapest 0.6%
Prague, Budapest,
Vodafone Computers / Hi-Tech Bucharest 0.6%
NCR Corporation Computers / Hi-Tech Belgrade 0.6%
ICZ Group Computers / Hi-Tech Warsaw, Prague 0.6%
IBM Business Services Budapest 0.6%
Berlinovo Immobilien Gesellschaft Business Services Berlin 0.6%
Computer generated solutions Business Services Bucharest 0.5%
Vienna, Budapest,
Siemens Computers / Hi-Tech Bucharest 0.5%
RA-Micro Computers / Hi-Tech Berlin 0.5%
33Covid-19 Results Financing Property Appendix
Investment Portfolio
Like-for-like performance
Market Fair value Rental income P&L Yield (%) 1 Occupancy (%) 2
1Q 2020 1Q 2019 +/(-) 1Q 2020 1Q 2019 +/(-) 1Q 2020 1Q 2019 +/(-) 1Q 2020 1Q 2019 +/(-)
Austria 515.1 502.8 2.4% 7.1 6.9 2.1% 5.5 5.3 19 bps 93.5 89.2 433 bps
Germany 1,462.8 1,239.9 18.0% 16.5 15.9 3.2% 3.9 4.6 (65 bps) 98.7 99.0 (30 bps)
Czechia 318.9 280.5 13.7% 4.2 4.4 (4.2%) 5.6 6.0 (42 bps) 94.8 89.3 546 bps
Hungary 326.3 299.6 8.9% 6.3 6.3 0.1% 7.2 7.5 (27 bps) 92.7 92.4 32 bps
Poland 389.1 408.9 (4.8%) 5.9 6.1 (2.6%) 6.7 6.5 21 bps 96.5 97.0 (50 bps)
Romania 265.3 265.5 (0.1%) 6.1 5.6 9.7% 7.6 7.4 25 bps 94.6 92.0 265 bps
Other 3
173.5 180.4 (3.8%) 3.8 4.0 (3.7%) 8.5 8.3 14 bps 93.5 94.2 (63 bps)
Total 3,451.0 3,177.6 8.6% 49.8 49.1 1.5% 5.4 5.8 (34 bps) 95.6 94.3 131 bps
1Q 2020 key drivers
Significant increase in balance sheet values due to positive revaluation result in Germany, Czechia and Hungary.
Rental income increased by 1.5% in total, highest increase in Romania by 9.7% mainly due to higher occupancy in Orhideea Towers.
Due to higher balance sheet values in 2020 the total yield dropped by 34 bps.
Occupancy substantially increased in Romania (Orhideea Towers), Czechia (Nile House) and Austria (Erdberger Laende).
1 Annualised rent / Book value 2 Economic (Annualised rent / Rent full occupancy) 3 Serbia, Croatia, Slovakia 34Covid-19 Results Financing Property Appendix
Investment Portfolio
Portfolio Update – Reversionary potential
Case study reversionary potential Europacity Berlin
Due to development completions in Germany within the last 10 years,
on average long rental contracts and the strong rental growth over
recent years in its German core cities, CA Immo holds a significant
reversionary potential in its German portfolio.
CA Immo‘s development completions since 2012 and its concentrated
asset position in Berlin‘s submarket Europacity illustrates the potential,
which at the same time offers protection in downside scenarios.
Between 2012 and 2019, average rental levels rose from
around and below 20 €/sqm to 30-35 €/sqm (depending on location
and fit out).
Average office rents signed CAI Europacity
33.00 7,200 3,800 5,700 16,800 26,600 10,500 24,800 34,100 90,000
31.00 80,000
29.00 70,000
27.00 60,000
25.00 50,000
23.00 40,000
21.00 30,000
19.00 20,000
17.00 10,000
15.00 -
2012 2013 2014 2015 2016 2017 2018 2019 2020
GLA CAI portfolio Europacity (sqm) Weighted average rent signed
Linear (Weighted average rent signed) GLA signed (sqm) 35Covid-19 Results Financing Property Appendix
Investment Portfolio
Portfolio Update – Acquisition
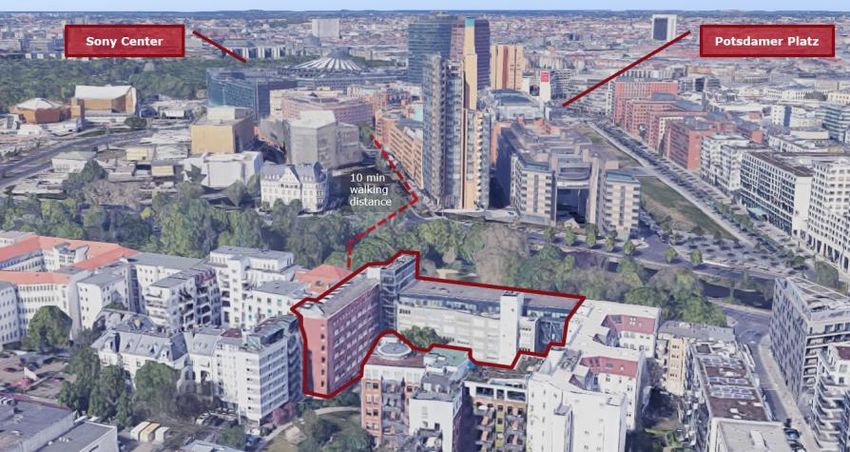
Acquisition of „Karlsbad 11“ office property in Berlin
In the beginning of April 2020 CA Immo has closed the acquisition
of a 10,098 sqm office building in the vicinity of the Potsdamer
Platz in Berlin.
Situated in a well-known, attractive office micro location with
excellent transport connectivity in an upcoming submarket.
With its excellent visibility and strong asset quality the property is a
good complement to CA Immo’s existing Berlin portfolio.
High reversionary potential and future upgrading case where
CA Immo’s team on the ground will be able to generate substantial
value in coming years.
Key metrics
Investment volume € 76 m
GLA 10,098 sqm
# of floors 7 above ground
Occupancy 100%
Tenant structure Multi-tenant
36Covid-19 Results Financing Property Appendix
Investment Portfolio
Portfolio Update – Acquisition
Acquisition of „Karlsbad 11“ office property in Berlin Highlights
Positive Berlin demographics, job growth and
thriving Berlin rental market, in particular for
larger space lots.
Strong local CA Immo asset management
expertise.
Good complement to existing Berlin CA Immo
assets both geographically and financially.
Good asset quality and well maintained condition.
Good divisibility both vertically and horizontally.
Flexible floor plans suitable for open plan and
cellular layouts.
Long-term secured cash flow by government-
owned main tenant.
Downside protection regarding rents and returns
due to quality of central location and asset
characteristics.
High reversionary potential some of which in the
near term (average in-place rent level € 11 per
sqm and month).
Attractive stabilized recurring yield potential.
37Covid-19 Results Financing Property Appendix
Investment Portfolio
Portfolio Update – Leasing
Leasing update 1Q 2020
Region Pre-leases New leases Lease extensions Total leasing In total, approximately 31,700 sqm of
development investment investment (sqm)
rentable effective area was newly let or
projects (sqm) portfolio (sqm) portfolio (sqm)
extended in the first quarter.
New lettings and floor space expansions
Germany - 1,401 1,389 2,790 accounted for 39% of all rental
agreements, while contract extensions
Austria - 5,200 882 6,082
represented 61%.
CEE - 5,894 16,975 22,870
Total - 12,495 19,246 31,742
Leasing case study Volksbank Vienna
End of 2019 and beginning of 2020 Volksbank Wien started to move Erdberger Laende, Vienna
into their new premises in the Erdberger Laende property in Vienna.
The rental area of approximately 14,000 sqm was completely
refurbished beforehand to meet the new tenants needs.
Positive impact on the occupancy rate (refer to like-for-like
performance) and WALT of the Austrian portfolio.
Significant valuation uplift linked to the letting at improved terms was
reflected in last year‘s revaluation result.
38Covid-19 Results Financing Property Appendix
Investment Portfolio
Portfolio Update - Sustainability
Comments Office portfolio certifications 1 (book value)
45 office properties, making up 76% of CA Immo’s office
DGNB Gold
portfolio 1 have been certified according to DGNB, LEED or 15% 18%
BREEAM standards. 2 DGNB Platin
Further investment properties as well as all new office 16% Certified office LEED Gold
13%
developments are certified according to LEED or DGNB or portfolio:
€ 3.1 bn
BREEAM standards (Gold or Platin level). LEED Platin
Developments for the own portfolio, especially in Germany, 13% BREEAM Very Good
lead to a young, state of the art high class investment portfolio 26%
in sought-after locations. BREEAM Excellent
Portfolio composition (book value)
100%
90% 15%
80%
52%
70% 65%
60%
85%
50%
40% 85%
30%
48%
20% 35%
10%
15%
0%
Austria Germany CEE Total
CAI developments Acquisitions
1Total office portfolio value € 4.1 bn 2 Sustainability certifications rate the sustainability and energy efficiency of buildings taking into account different criteria such as ecology, economy, socio-cultural aspects,
39
technology, etc.Covid-19 Results Financing Property Appendix
Investment Portfolio
Portfolio Update - Sustainability
Comments Case study sustainable project development – Hochhaus am Europaplatz, Europacity Berlin
Developments for the own portfolio, especially in Construction of a new 84-metre class A
office-high-rise with 23,000 sqm
Germany, lead to a young, state of the art high
rentable area, close to Berlin’s main
class investment portfolio in sought-after station.
locations. Certification to at least DGNB Gold
All new office developments are certified envisaged.
according to LEED or DGNB standards (Gold or The project will have a primary p.a.
energy consumption below the EnEV
Platin level).
reference benchmarks.
As a owner developer CA Immo takes into account Requirements of the German Renewable
all lifecycle costs of the properties and does not Energies Heat Act will be exceeded by
means of a district heating system that
just maximize the potential sales price.
uses combined heat and power
technology.
Certifications projects under constructions 1
Energy-efficient lighting and CO2 sensors
Project System Category for the automatic monitoring of air
quality to ensure an ideal indoor climate.
Hochhaus am Building control technology that uses
DGNB Gold
Europaplatz (Berlin)
existing environmental energy that is
NEO (Munich) DGNB Gold
used for a battery-free EnOcean wireless
technology.
ONE (Frankfurt) DGNB Platin Comprehensive supply of e-mobility
charging points for cars, motorcycles and
ZigZag (Mainz) DGNB Gold
bicycles.
Large green zones in office areas.
M&M (Prague) LEED Platinum
1 Intended sustainability certifications 40Covid-19 Results Financing Property Appendix
Investment Portfolio
Portfolio Update – Project completion MY.O, Munich
Key metrics
Total investment volume € 101.3 m
Rental area 26,986 sqm
Yield on cost 6.7%
Occupancy 100%
Comments
Total investment volume excl. plot € 85.2 m.
Six to seven storey multi-tenant office
ensemble close to the city center with direct
access to public transport.
Tenants (e.g. Ecovis) will move into the
building in the course of 2020.
Transferred to the investment portfolio end
of 2019.
Assuming full occupancy the estimated FFO
contribution p.a. will be > € 5 m.
41Covid-19 Results Financing Property Appendix
Investment Portfolio
Portfolio Update – Project completion MY.B, Berlin
Key metrics
Total investment volume € 70.4 m
Rental area 14,831 sqm
Yield on cost 7.2%
Occupancy 100%
Comments
Total investment volume excl. plot € 57.9 m.
All rental spaces have been handed over to the
tenants in the beginning of 2020.
The first tenants started to move into their
new premises.
Transferred to the investment portfolio in 1Q
2020.
42Covid-19 Results Financing Property Appendix Investment Portfolio Portfolio Update – Project completion Cube, Berlin Key metrics Total investment volume € 113.2 m Rental area 16,829 sqm Yield on cost 5.9% Occupancy 100% Comments Total investment volume excl. plot € 93.4 m. Forward sale of the property development. Earn-out triggered by successful letting further improves significant development profit. First rental spaces have been handed over to the tenants in the beginning of 2020. All tenants will be able to move into their new premises by mid 2020. Handover to the buyer expected in summer 2020. 43
Covid-19 Results Financing Property Appendix
Investment Portfolio
State of the art architecture fulfilling high ecological standards
Case study Cube, Berlin
Top-notch prime office building with a flexible floor
plan, fully leased and highly profitably forward sold.
Leasing has set new prime standards in the Berlin
Europacity sub-market.
Highest sustainability and connectivity standard:
WiredScore Certification (Platinum) and sustainable
planning and construction through DGNB certification
(Platinum).
Integrating at the edge technologies and digitization
modules (keyless entry, in-house navigation, tracking,
preventive FM, etc.) all connected in the so called
“brain”.
Cube has been awarded being the most intelligent
building in Europe.
Centrally located in front of Berlin’s main station
directly facing the German federal chancellery and
Reichstag.
Excellent connections to long-distance, regional and
local transportation.
44DEVELOPMENT PROJECTS UNDER CONSTRUCTION
Covid-19 Results Financing Property Appendix
Development Projects Under Construction
Development structure
Projects under construction (€ m) Development investment volume for own portfolio & for sale (€ m)
800.0 5.0 744.1
451.0 25.0
9% 13% 700.0
600.0
2%
500.0
20%
Total investment 400.0 817.4
volume:
€ 744 m 300.0 263.1
200.0
100.0
55%
0.0
Invested volume Outstanding Invested volume Outstanding Total investment
(for own portfolio) investment (for (for sale) investment (for volume
Munich Frankfurt Berlin Mainz Prague own portfolio) sale)
NAV contribution projects under construction (€ m) 1
Comments
700
€ 714 m out of the total of € 744 m investment volume of 600
the projects under construction are earmarked for the
500
own investment portfolio.
400
€ 247 m of the total investment volume have already been
300
invested.
200
Total development investment volume does not include
projects in preparation phase. 100
0
One Hochhaus am NEO Mississippi Missouri Park ZigZag Total
Europaplatz House
NAV realized Future NAV contribution (estimated)
1 Based on current forecasts 46Covid-19 Results Financing Property Appendix
Development Projects Under Construction
Project overview
Investment portfolio (projects Investment Outstanding Planned Gross Main Share 2 % Pre-let Scheduled
for own balance sheet) volume investment rentable yield usage completion
(€ m) 1 (€ m) area (sqm) on cost
ZigZag (Mainz) 16.9 8.5 4,695 5.3% Office 100% 0% 4Q 2020
ONE (Frankfurt) 411.0 267.7 68,451 5.4% Office 100% 33% 1Q 2022
Mississippi House (Prague) 42.2 31.6 13,736 6.3% Office 100% 54% 3Q 2021
Missouri Park (Prague) 22.7 17.2 7,024 6.3% Office 100% 0% 3Q 2021
NEO office (Munich) 70.0 11.8 13,605 5.1% Office 100% 33% 1Q 2021
Hochhaus am Europaplatz
151.2 114.3 22,948 5.8% Office 100% 99% 4Q 2023
(Berlin)
Subtotal 714.1 451.0 130,459 5.5%
Trading portfolio Investment Outstanding Planned Gross Main Share 2 % Sold Scheduled
(projects for sale) volume investment rentable yield usage completion
(€ m) 1 (€ m) area (sqm) on cost
NEO residential (Munich) 30.0 5.0 5,831 - Residential 100% - 1Q 2021
Subtotal 30.0 5.0 5,831
Total 744.1 456.1 136,290 5.5%
1 Incl. plot values (total investment volume excl. plot values amounts to € 661.0 m) 2 All figures refer to the project share held by CA Immo 47Covid-19 Results Financing Property Appendix
Development Projects Under Construction
NEO, Munich (Completion in 2020)
Key metrics
Total investment volume € 100.1 m
Outstanding investment € 16.8 m
Rental area 19,436 sqm
Expected yield on cost 1 5.1%
Scheduled completion 1Q 2021
Pre-let ratio 33%
Comments
Total investment volume excl. plot € 82.6 m.
The 60 m high NEO office and hotel tower will
be the new landmark for the expanding
Munich district of Baumkirchen Mitte.
Sale of residential part is signed.
More than 95% of construction works
contracted.
1 Expected yield on cost refers to office part
48Covid-19 Results Financing Property Appendix
Development Projects Under Construction
Mississippi House & Missouri Park, Prague (Completion in 2021)
Key metrics
Total investment volume € 64.5 m
Outstanding investment € 48.7 m
Rental area 20,760 sqm
Expected yield on cost 6.3%
Scheduled completion 3Q 2021
Pre-let ratio 35%
Comments
Total investment volume excl. plot € 54.5 m.
Mississippi & Missouri offices will complete the
River City Campus in Karlin, Prague 8. CA
Immo‘s prime assets Nile House, Danube
House and Amazon Court are also located in
the River City.
Construction has started in 3Q 2019.
The construction will follow the highest
sustainability standards (LEED platinum).
49Covid-19 Results Financing Property Appendix
Development Projects Under Construction
ONE, Frankfurt (Completion in 2022)
Key metrics
Total investment volume € 411.0 m
Outstanding investment € 267.7 m
Rental area 66,451 sqm
Expected yield on cost 5.4%
Scheduled completion 1Q 2022 Formatting
Pre-let ratio 33%
Comments
Total investment volume excl. plot € 380.7 m.
High-rise hotel & office building with a flexible
floor plan and a multi-storey car park &
logistics building.
Hotel anchor tenant NH Hotels.
Co-working operator Spaces (IWG) signed.
More than 70% of construction works
contracted.
50Covid-19 Results Financing Property Appendix
Development Projects Under Construction
Hochhaus am Europaplatz, Berlin (Completion in 2023)
Key metrics
Total investment volume € 151.2 m
Outstanding investment € 114.3 m
Rental area 22,948 sqm
Expected yield on cost 5.8%
Scheduled completion 4Q 2023
Pre-let ratio 100%
Comments
Total investment volume excl. plot € 127.3 m.
Development of a fully pre-leased modern
Class-A high rise office building on the Baufeld
04 site in the heart of Berlin’s Europacity
submarket.
Construction of an 84 m high (21 storey)
high-rise office building.
Pre-lease for 100% of the space of the
building has been signed by KPMG who are
also tenant in the neighboring CAI property.
Construction has started in 4Q 2019.
51APPENDIX
Covid-19 Results Financing Property Appendix
Property Portfolio
Prime locations in all core markets
Property portfolio split by city
(book value)
Berlin Munich
7%
8% 22%
8%
Total GAV: € 5.2 bn
10%
17%
10%
8%
10%
Berlin Munich Frankfurt
Vienna Budapest Warsaw
Prague Bucharest Other
Key facts
Frankfurt Vienna
CA Immo‘s properties
exclusively located in prime
inner-city locations.
Well-connected to
transportation nodes with a
large number of assets within
walking distance to main
stations.
Access to high-quality land
bank in sought-after locations
will increase portfolio in core Standing assets Properties under construction Land reserves
markets.
53Covid-19 Results Financing Property Appendix
Property Portfolio
Prime locations in all core markets
Property portfolio split by city
(book value)
Warsaw Bucharest
7%
8% 22%
8%
Total GAV: € 5.2 bn
10%
17%
10%
8%
10%
Berlin Munich Frankfurt
Vienna Budapest Warsaw
Prague Bucharest Other
Key facts
Prague Budapest
Portfolio focussed on eight
core urban gateway cities
that share favourable long
term structural trends.
Minimum portfolio value of
€ 300 m per city efficiently
managed by local teams to
allow for best management
and high tenant retention.
Standing assets Properties under construction Land reserves
54Covid-19 Results Financing Property Appendix
Investment Portfolio
Largest assets
Skygarden, Munich Kontorhaus, Munich Millennium Towers, Budapest Cube, Berlin My.O, Munich
Value € 278 m Value € 221 m Value € 199 m Value € 147 m Value € 147 m
Occupancy 100% Occupancy 99% Occupancy 96% Occupancy 77% Occupancy 29%
Tenants PwC Tenants Google, Salesforce Tenants Morgan Stanley Tenants DB, Gleiss Lutz Tenants JetBrains
JFK House, Berlin Warsaw Spire B, Warsaw Riverplace, Bucharest MY.B, Berlin Warsaw Spire C, Warsaw
Value € 123 m Value € 113 m Value € 110 m Value € 107 m Value € 105 m
Occupancy 91% Occupancy 100% Occupancy 93% Occupancy 100% Occupancy 96%
Tenants White & Case, Airbus Tenants Frontex Tenants BAT Tenants Hypoport Tenants Benefit Systems SA
55You can also read