2021 Interim Results Presentation - International Public ...
←
→
Page content transcription
If your browser does not render page correctly, please read the page content below
2021 Interim
 Results
 Presentation

September 2021
Important Information
The information in this document has been prepared at the direction of International Public             contract or commitment whatsoever. This document does not constitute a recommendation
Partnerships Limited (“INPP”) solely for use at an information presentation about INPP. This            regarding the securities of INPP.
document and its contents are confidential and may not be distributed, published, reproduced
(in whole or in part) by any medium or in any form, or disclosed or made available by recipients,       The information communicated in this document contains certain statements, graphs and
to any other person. The information contained in this document is not comprehensive and may            projections (“Statements”) that are or may be forward looking. These pieces of information
be partial, incomplete or on its own be at risk of being taken out of context. The information in       typically contain words such as "expects" and "anticipates" and words of similar import. Where
this document was prepared to be supplemental to an oral presentation and can be understood             the Statements are graphical such words are implied in that information through the shape and
only in that context and against a review of other published information of the Company and not         size of graphed information relating to future years. By their nature forward looking Statements
as a free standing document. No offer of, or invitation to acquire, securities is made by this          involve risk and uncertainty because they relate to events and depend on circumstances that
document.                                                                                               will occur in the future. These circumstances may or may not transpire and accordingly no
                                                                                                        reliance or expectation should be formed based on these Statements. This presentation
This document is not intended in any way to be a substitute for a review of the annual and              explicitly does not consider risk associated with INPP and is not intended or to be taken as a
interim report and accounts of INPP and should not be relied on as such.                                comprehensive over view of the activities of INPP.
The information in the section dealing with Pipeline above is indicative only of the range of           This document and the information contained herein, are not for publication or distribution,
opportunities that may be available to INPP in the future in the event that certain projects are        directly or indirectly, to persons in any jurisdiction within the European Economic Area other
awarded to INPP or its Investment Adviser, Amber Fund Management Limited (“AFML”) or its                than the United Kingdom, nor to persons in the United States (within the meaning of Regulation
associated companies, AFML disposes of those investments and INPP acquires those interests              S under the US Securities Act of 1933, as amended (the "Securities Act")) or to entities in
from AFML. The projects listed, the bid status, the estimated funding dates, the investment             Canada, Australia or Japan.
capital requirements and any anticipated returns may all change from time to time before those
projects are available for investment or purchase by INPP and accordingly the final investment          INPP has registered as a self-managed AIF with the UK Financial Conduct Authority but has
characteristics of any opportunity are likely to differ from those shown above.                         not registered or been authorised in connection with the marketing of its ordinary shares in any
                                                                                                        other EEA jurisdiction. This document and the information contained herein are provided for
In the United Kingdom, this presentation is being made and this document is being distributed           information in connection with this presentation and do not constitute offering material in
only to and is directed only at persons who have professional experience in matters relating to         respect of an offer to acquire ordinary shares in INPP. Any decision to acquire ordinary shares
investments who fall within the definition of "investment professionals" in Article 19(5) of, or a      in INPP cannot be made on the basis of this document and must be made on the basis of a
person falling within Article 49(2) (High Net Worth Companies etc) of, The Financial Services           prospectus or other offering document issued by INPP, none of which are currently available.
and Markets Act 2000 (Financial Promotion) Order 2005 of the United Kingdom (all such                   As such, this document and the presentations at which it is issued shall not constitute
persons together being referred to as "relevant persons"). Any person who is not a relevant             marketing within the meaning of the EU Alternative Investment Fund Managers Directive.
person should seek appropriate advice.
                                                                                                        The ordinary shares of INPP have not been and will not be registered under the Securities Act
No representation or warranty, express or implied, is made as to, and no reliance should be             and may not be offered or sold in the United States except to certain persons in offshore
placed on, the fairness, accuracy, completeness or correctness of the information, projections          jurisdictions in reliance on Regulation S.
or opinions contained herein. Neither INPP, its investment adviser, AFML, nor any of INPP's
advisers or representatives shall have any responsibility or liability whatsoever (for negligence       Neither these slides nor any copy of them may be taken or transmitted into or distributed in
or otherwise) for any loss howsoever arising from any use of this document or its contents or           Canada, Australia, Japan or any other jurisdiction which prohibits the same except in
otherwise arising in connection with this document. Without prejudice to the foregoing no               compliance with applicable securities laws. Any failure to comply with this restriction may
responsibility is taken for any errors or omissions in this document. The information set out           constitute a violation of the United States or other national securities laws.
herein may be subject to updating, completion, revision, verification and amendment and such
information may change materially without notice from time to time.
This document has not been approved by the UK Financial Conduct Authority, the Guernsey
Financial Services Commission or other relevant regulatory body. This document does not
constitute or form part of, and should not be construed as, an offer, invitation or inducement to
purchase or subscribe for any securities, it does not constitute marketing or promotional
material, nor shall it or any part of it form the basis of, or be relied upon in connection with, any

2      2021 INTERIM RESULTS PRESENTATION
Overview

Our Approach
Our aim continues to be to deliver long-term benefits for all stakeholders by investing responsibly in public and social
infrastructure
            CONSISTENT AND                              DIVERSIFIED                          RESPONSIBLE
          PREDICTABLE RETURNS                           PORTFOLIO                            INVESTMENT

          Resilient, inflation-linked cash      Investments are spread by both              ‘Hands-on’ asset
                        flows                        sector and geography                 management approach

                                                      Investing in a range of                Integration of ESG
                                                Low   correlationassets
                                                 infrastructure   to other asset
                                                                        providing
         Focus on predictable dividends                                                    considerations across
                                                             classes
                                                    essential public services               investment lifecycle

                Mainly regulated                     Investing in defensive
                                                                                        Asset stewardship drives
           or contractual government            infrastructure assets providing
                                                                                      environmental and social goals
               backed cash flows                    essential public services

                                             POSITIVE MACRO FUNDAMENTALS

           Low interest rates encourage         Secondary market pricing and           New infrastructure is pivotal
            continued investment in the          sustained investor demand             to most 21st century policy
                      sector                        underpins valuations                        initiatives

 Supporters of:

4   2021 INTERIM RESULTS PRESENTATION
HY 2021 Performance and Operational Overview
Continued resilient financial and operational performance from the Company’s investment portfolio

     DIVIDEND                        ▪ Maintained dividend cover at 1.3x1 and continued delivery of dividend growth with two-year dividend guidance reaffirmed
     GROWTH

                                     ▪ The financial and operational performance from the investment portfolio remains underpinned by resilient underlying cash flows
                                       and the Company’s focus on active asset management. The majority of the Company’s investments have continued to perform
    PORTFOLIO                          well and are isolated from ongoing conditions relating to the pandemic
    PERFORMANCE                      ▪ Over the period, the NAV per share reduced from 147.1p at 31 Dec 2020 to 145.1p at 30 Jun 2021 - principally due to the UK
                                       corporation tax increase, strengthening of sterling, payment of 3.68p dividend partially offset by the unwinding of the discount
                                       rates and some minor positive revaluations of certain investments

                                     ▪ The Investment Adviser has continued to work with its public sector partners to ensure that INPP’s assets remain available and
     ACTIVE ASSET                      operational to serve the public, whilst protecting the health and safety of staff and users
     MANAGEMENT                      ▪ The Company’s public sector clients commissioned and funded over 464 contract variations during the period, totalling a
                                       combined value of over £9.3m of additional project work conducted on behalf of the commissioning bodies

                                     ▪ Formally became a supporter of the Task Force on Climate-related Financial Disclosures (‘TCFD’) and put in place direct
     RESPONSIBLE                       alignment of its investment approval processes with the objectives of the Paris Agreement
     INVESTMENT
                                     ▪ Released the first edition of the Company’s sustainability report in July 2021

     INVESTMENTS                     ▪ New asset acquisitions were made with a value in excess of £22m across the social accommodation and digital infrastructure
     AND FUTURE                        sectors. Further investments in the OFTO sector and Angel Trains were announced after the period end
     GROWTH                          ▪ A successful capital raising of £135m, exceeding a target of £100m, post-period end, to fund an attractive investment pipeline
                                     ▪ Corporate Debt Facility renewed in March 2021 for three years with a £250m committed facility and £150m accordion capacity

1.     Cash dividend payments to investors are paid from net operating cash flow before capital activity.

5        2021 INTERIM RESULTS PRESENTATION
Portfolio
Performance
and Valuation

H1 2021 Financial Highlights
 NET ASSET VALUE (‘NAV’) 1                                          DIVIDEND GROWTH 2                                                CASH DIVIDEND        PROFIT BEFORE TAX
                                                                                                                                     COVER3

 £2.4bn
(Dec 2020: £2.4bn)
                           or
                                                                    2.7%                                                             1.3x                 £27.2m
145.1p/share
    (Dec 2020: 147.1p/share)
                                                                    (H1 2020: 2.5%)                                                  (H1 2020: 1.3x)      (H1 2020: £35.4m)

     FIVE-YEAR CORRELATION4                                        PORTFOLIO INFLATION                                               ANNUALISED TOTAL     ONGOING CHARGES
                                                                   LINKAGE5                                                          SHAREHOLDER RETURN
                                                                                                                                     SINCE IPO6

 0.39                                                              0.75%                                                             8.5%                 1.25%
     (Dec 2020: 0.38)                                              (Dec 2020: 0.78%)                                                 (Dec 2020: 8.8%)     (H1 2020: 1.21%)

1.    NAV is defined in the Annual Report and financial statements for the six months ending 30 June 2021.
2.    Future profit projection and dividends cannot be guaranteed. Projects are based on current estimates and may vary in future.
3.    Cash dividend payments to investors are paid from net operating cash flow before capital activity.
4.    Correlation (R) from Bloomberg – Five years to 30 June 2021 – calculation detail available on request.
5.    Projected increase in portfolio return for a 1.00% p.a. increase in the inflation rates assumed in the current valuations.
6.    Bloomberg – share price appreciation plus dividends assumed to be reinvested – from IPO in November 2006 to 30 June 2021.

7        2021 INTERIM RESULTS PRESENTATION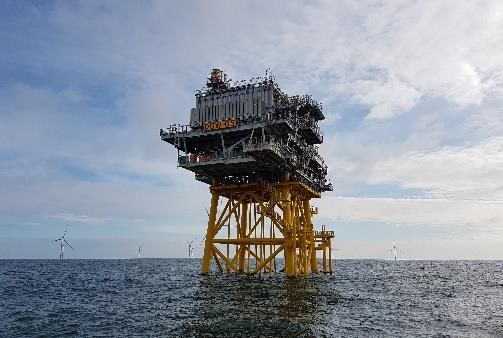
Confidence in Long-Term Revenues from Investment Portfolio
DIVIDEND GROWTH
pence per share
7.74
HY 2021 FY 2021 FY 2022
Forecast Actual
7.36
7.55 DIVIDEND TARGET TARGET
7.18
7.00 DIVIDEND1 DIVIDEND1
6.82
6.65
6.30 6.45
6.15
5.85 6.00
5.25 5.40
5.55 5.70 3.78p 7.55p 7.74p
per share per share per share
2007
2008
2009
2010
2011
2012
2013
2014
2015
2016
2017
2018
2019
2020
2021
2022
PROJECTED INVESTMENT RECEIPTS FROM EXISTING ASSETS 2
£m
350
300
250
200
150
100
50
0
….
.
2021
2022
2023
2024
2025
2026
2027
2028
2029
2030
2031
2032
2033
2034
2035
2036
2037
2038
2039
2040
2041
2042
2043
2044
2045
2046
2047
2048
2049
2050
..
2147
2148
2149
2150
…
1. There can be no assurance that these targets will be met or that the Company will make any distributions at all.
2. This chart is not intended to provide any future profit forecast. Cash flows shown are current projections based on the current individual financial models and may vary in the future. Only investments committed as at 30 June 2021 are included.
8 2021 INTERIM RESULTS PRESENTATION
Valuation Discount Rate Overview
     NAV1                                                             WEIGHTED AVERAGE                                                  WEIGHTED AVERAGE                                                 RISK CAPITAL DISCOUNT
                                                                      RISK CAPITAL                                                      PORTFOLIO                                                        RATE RANGE4
                                                                      DISCOUNT RATE 2                                                   DISCOUNT RATE 3
     £2.4bn
                             or                                       7.29%                                                             6.81%                                                            4.68% - 10.87%
     145.1 p per share

                                                                                                                                                   30 JUN 2021                              31 DEC 2020                                         VARIANCE

 NAV1 PER SHARE                                                                                                                                              145.1p                                   147.1p                                             (2.0p)

 WEIGHTED AVERAGE RISK CAPITAL DISCOUNT RATE 2                                                                                                                7.29%                                    7.52%                                         (23bps)

 WEIGHTED AVERAGE PORTFOLIO DISCOUNT RATE3                                                                                                                    6.81%                                    6.97%                                         (16bps)

 RISK CAPITAL DISCOUNT RATE RANGE4                                                                                                           4.68% - 10.87%                           5.38% - 11.02%                               (70bps) – (15bps)

1.   The Company’s approach to calculating the NAV has been set out on slide 29 of this presentation.
2.   This represents the weighted average of the discount rates used to determine the valuations of the Company’s equity and subordinated debt investments, and excludes its senior debt investments (which represent c.11% of the Investments at Fair value).
3.   This represents the weighted average of the discount rates used to determine all of the Company’s investments.
4.   This range does not include the investments held by the National Digital Infrastructure Fund (‘NDIF’). The lowest rate applies to a UK PPP with a remaining life of less than two years and the highest rate applies to the Company’s investment in Angel Trains.
     As at 30 June 2021, Risk Capital investments represented c.89% of the total Investments at Fair Value.

9         2021 INTERIM RESULTS PRESENTATION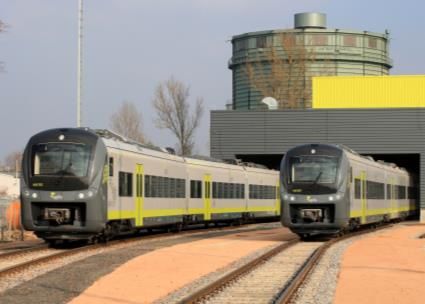
Net Asset Valuation
         £m
     2,500

     2,450                                                                          148.2                           55.2

     2,400           2,384.4                           101.0                                                                                     19.5
                                                                                                                                                                               33.0                          32.6                      2,356.5
     2,350

     2,300

     2,250

     2,200

     2,150

     2,100

     2,050
               NAV at 31 Dec 2020           Change in Government          Change in Investment Cash Distributed to INPP                 Change in Foreign        Change in Macroeconomic                NAV Return 1             NAV at 30 Jun 2021
                                                Bond Yields                   Risk Premia      Shareholders (net of scrip)               Exchange Rates               Assumptions

▪       Discount rates reduced over the period with a net positive £48.2m impact on the NAV. The reductions reflect recent market-based evidence of pricing and
        the lower level of risk within certain forecast cash flows
▪       During the period, a dividend of 3.68p per share was paid to INPP investors consistent with forward guidance provided previously
▪       The net impact of FX rate changes on the NAV, including the mitigating effect of the FX hedging arrangements, was negative £19.5m
▪       Changes to macroeconomic assumptions include (i) an increase in the UK corporation tax rate from 19% to 25% (from 1 April 2023), which accounts for
        £32m of the negative £33m impact, and (ii) a one-year delay in the step up to the long-term deposit rate assumptions
▪       NAV Return (2.8%2 on an annualised basis) was impacted by Diabolo where a more conservative recovery in passenger numbers is assumed (see first
        point above) with smaller impacts attributable to lower than assumed inflation and various asset specific factors

1.     NAV Return represents amongst other things, (i) variances in both realised and forecast in vestment cash flows, (ii) the unwi nding of the discount factor applied to those cash flows, and (iii) changes in the Company’s net assets.
2.     Calculated by dividing the NAV return of £32.6m by the opening NAV of £2,384.4m and converting the result to an annual figure.

10           2021 INTERIM RESULTS PRESENTATION
2021 Portfolio Review
Cadent is an essential UK gas distribution business with four geographic monopolies, serving c.50% of UK gas customers

         No exposure to                                                Owned by a highly
                                    Inflation-linked revenues                                                                       Cadent is piloting the use
     commodity or demand                                            experienced consortium            Strong and experienced
                                    regulated by Ofgem using                                                                         of hydrogen to support
      risk and well insulated                                         of global investors,               management team
                                        the RIIO framework                                                                               future resilience
         from GDP trends                                                 including INPP

INVESTMENT UPDATE                                                                                           RESPONSIBLE INVESTMENT
▪     In December 2020, Ofgem published its final determination (‘FD’) for the five-year regulatory          ▪   Cadent continues to play a role in
      period which commenced in April 2021. Cadent subsequently exercised its right to appeal                    supporting the UK Government’s net zero
      Ofgem’s FD to the CMA                                                                                      target and is working on several projects
                                                                                                                 designed to demonstrate the feasibility and
▪     In August 2021, the CMA announced its provisional findings which were overall positive for
                                                                                                                 safety of using its existing gas infrastructure
      Cadent in comparison to the FD. Nevertheless, there are areas on which Cadent will continue to
                                                                                                                 to distribute cleaner fuel in the future
      work with stakeholders to ensure the CMA’s final decision (due October 2021) is in the best
      interests of all its stakeholders                                                                      ▪   The publication of the Hydrogen Strategy, in
                                                                                                                 August 2021, marks the beginning of the
▪     As the provisional findings were issued after 30 June, the Company has used Ofgem’s FD in its
                                                                                                                 next stage for the development of the UK’s
      cash flow forecasts. Accordingly, the CMA’s announcement could, other things being equal, have
                                                                                                                 hydrogen economy and is positive news for
      a modestly positive impact on the Company’s valuation of its investment in Cadent
                                                                                                                 Cadent
▪     Cadent continues to believe that the UK’s extensive gas infrastructure will play a key role in the
      transition to net zero by facilitating the use of greener gases in the future and recent government
      policy announcements continue to support the work that Cadent is doing                                 PRIMARY SDGS
▪     The critical nature of Cadent’s assets coupled with its inflation-linked, regulated revenue stream
      make Cadent an attractive long-term investment

12     2021 INTERIM RESULTS PRESENTATION
Tideway is building a 25km ‘super-sewer’ under the River Thames to create a healthier environment for London
Bespoke regulatory Government support Climate-resilient asset
Long-term investment arrangement with Inflation-linked revenues provides protection in a constructed with the
with a 120-year design life permitted rate of return on regulated by Ofwat range of downside purpose of cleaning up the
capital fixed until 2030 scenarios River Thames
INVESTMENT UPDATE RESPONSIBLE INVESTMENT
▪ Good progress continues to be made with construction work 68% complete as at 30 June 2021 ▪ Tideway will significantly reduce polluting
▪ Progress has been made on discussions with Ofwat regarding enhanced sharing ratios of Covid costs discharges in a typical year in the River
with the proposed measures the subject of a public consultation run by Ofwat during the period. The Thames by c.37m cubic metres
consultation closed in May 2021 and Tideway expects the cost-sharing measures to be formally ▪ Tideway continues to drive
implemented via modifications to its license before the end of 2021 improvements in delivering the project in
▪ The forecast cash flows continue to assume a £4.1bn construction cost and a handover date of 31 a sustainable way. For example,
March 2025. A prudent assessment of the expected Covid cost-sharing measures is also reflected Tideway’s ‘More by River’ initiative has
within the valuation avoided 550,000 HGV journeys, saving
14,500 tonnes of CO2e and avoiding an
▪ Progress towards system commissioning and handover is an increasing area of focus and, as estimated 11 serious road collisions
commonly undertaken by major projects at this stage of delivery, Tideway has been working with
stakeholders over the past few months on a thorough review of the remaining activities to provide
clarity on the schedule to completion PRIMARY SDGS
▪ The results of this review were published by Tideway post-period end and confirm the appropriateness
of the existing schedule dates with only a minor cost increase of c.1% with no material financial impact
on investors
13 2021 INTERIM RESULTS PRESENTATIONDiabolo is a strategic rail transportation asset linking Brussels Airport with Belgium’s national rail network
Covid has led to lower
Revenues linked to than projected passenger 100%-owned with influence Long duration asset with
Inflation-linked over project operations, Board
passenger numbers have numbers although c.26 years of the
revenues representation and asset
protective mechanisms historically numbers have management concession remaining
exceeded expectations
INVESTMENT UPDATE RESPONSIBLE INVESTMENT
▪ Diabolo has continued to be impacted by the restrictions on international travel and national lockdowns
▪ Well-planned and coordinated
implemented as a result of the Covid-19 pandemic. Passenger numbers remain depressed
transport infrastructure forms part of
▪ €24m of additional capital was committed to the project in December 2020 with €10m invested at that international net zero carbon
time; the remaining €14m remains available to protect Diabolo’s liquidity position and ensure compliance strategies
with its debt covenants
▪ Diabolo enables airport users to
▪ The extent and timing of any further cash injections will depend upon the trajectory of the recovery in travel to the airport by electric train
passenger numbers over the coming months and years. The latest traffic forecast report assumes a rather than by road
return to pre-Covid passenger numbers by 2024; this assumption indicates that the remaining €14m
commitment should be sufficient
PRIMARY SDGS
▪ Whilst forecast cash flows have been updated to reflect the latest advice from the technical adviser, the
valuation of our investment in Diabolo has not materially changed over the period (excluding the impact of
the change in FX rates)
▪ More positively, the duration of our investment with the concession not expiring until 2047, the high levels
of historic passenger use and our ability to influence revenues via the passenger fare adjustment
mechanism, all give us confidence in the future performance of this investment
14 2021 INTERIM RESULTS PRESENTATIONAngel Trains is the UK’s largest rolling stock leasing company owning more than 4,000 vehicles
Experienced Revenues derived from
Diversified asset base Enhanced governance
Over 20 years of leasing trains to TOCs,
supporting adaptability to management team with a rights with board
operating history some underpinned by
market conditions strong track record representation
government guarantees
INVESTMENT UPDATE RESPONSIBLE INVESTMENT
▪ INPP made its original investment in Angel Trains in 2008. It has been a successful investment for ▪ Angel’s business plan reflects the
INPP delivering both capital growth and strong yield ambition of the UK transport
decarbonisation plan
▪ In September 2021, INPP, as part of a consortium, agreed to acquire a further c.5% shareholding in
Angel Trains taking its shareholding to 10% and providing it with further governance rights through ▪ The product management team within
direct board representation Angel Trains has developed a
decarbonisation road map which focuses
▪ Following completion of the c.£98m investment, which is expected to occur later in September 2021,
on new propulsion technologies that
the Company’s investment in Angel Trains will, other things being equal, be the third largest holding in
eliminate classic diesel propulsion or
its portfolio by value
reduce its impact
▪ Angel Trains has a diversified fleet, the majority of which is made up of electric multiple units and its
business plan supports the decarbonisation of the UK transport system PRIMARY SDGS
▪ The Company has a positive view of opportunities within the rail sector as it plays a key role in the
long-term trends towards modal shift and net zero targets, supported by the UK government’s aims
and commitments as set out in the William-Shapps Plan for Rail and the Decarbonising Transport plan
15 2021 INTERIM RESULTS PRESENTATIONOther Asset Management Updates
OFTOs
▪ INPP’s offshore transmission investments have performed excellently over the period. Revenues have been largely
unaffected by the Covid-19 pandemic as assets have continued to remain available and meet performance
standards
▪ Ofgem has begun consulting stakeholders on its approach to dealing with the OFTO regime once the contracted
revenue period comes to an end (typically after c.20-25 years). The earliest expiry of an OFTO’s contracted
revenue period within the INPP portfolio is 2030. In July 2021, Ofgem released its first decision document covering
the initial steps in establishing the process for extending, where appropriate, the contracted revenue period
▪ Ofgem intends to publish a further consultation on the policy framework in November 2021 and the Company, PRIMARY SDGS SUPPORTED
through its Investment Adviser, will continue to actively engage with Ofgem and industry stakeholders on this
consultation and will seek to keep investors informed of any material developments
▪ Post-period end, the Company reached financial close on its eighth OFTO (Beatrice), taking the transmission
capacity of INPP’s OFTO investments to 2.1GW which is equivalent to the energy needs of c.1.8 million homes
▪ The Company is currently preferred bidder on two further OFTOs (Rampion and East Anglia One)
BeNEX
▪ Revenues generated through the contractual leasing of rolling stock and through direct investments in TOCs
▪ BeNEX has seen only a limited financial impact from the pandemic as only a minority of annual revenues
(currently less than 20%) are linked to passenger numbers and compensation for the loss of revenues continues
to be provided by the relevant German authorities
▪ During the first six months of 2021, two concessions were re-won further reducing the risk profile of the business
PRIMARY SDGS SUPPORTED
16 2021 INTERIM RESULTS PRESENTATIONOther Asset Management Updates
Availability-based PPPs Digital Infrastructure
▪ PPP projects account for 33% of the Company’s portfolio (by ▪ In July 2017, the Company committed to invest up to £45m in
investment fair value) UK digital infrastructure alongside the UK Government, through
NDIF
▪ Notwithstanding the reduction in use of many public service
buildings during the period, revenues have been largely unaffected ▪ During the period, an additional £14.2m was invested into one
owing to their availability-based nature of NDIF’s existing investments, toob, a UK full fibre broadband
provider. Following this latest investment, no further material
▪ For those investments measured by availability and performance, investments are expected to be made by INPP into NDIF
during the period, the availability of those assets was 99.7%
▪ The Company’s commitment to digital infrastructure will help to
▪ In some instances, facilities were repurposed to help support the transition the UK to full-fibre at a time when reliance on digital
wider community whilst protecting the health and safety of staff infrastructure has never been greater
and users
PRIMARY SDGS PRIMARY
SUPPORTED SDGS
SUPPORTED
17 2021 INTERIM RESULTS PRESENTATIONCommitted to Responsible Investment
The Company continues to demonstrate its leadership in responsible investment and made good progress against its three
responsible investment policy objectives during the period
H1 2021 progress
Drive Sustainable Growth Integrate ESG Advance Environmental and Social Progress
▪ Reached financial close on sustainably ▪ Established INPP Board ESG Committee ▪ Initiatives underway to drive sustainability
designed and built new headquarters for performance improvements across the
▪ Delivered first stand-alone edition portfolio
South-East Hesse Police in Offenbach
sustainability report, building on the
▪ BeNEX re-won two concessions which will already comprehensive approach taken ▪ Directly engaging with investments to
result in an additional 23 electric train units in the annual report enhance data capture and disclosures in
and nine battery electric train units line with converging best practice
▪ Investment Adviser awarded Best
▪ Beatrice OFTO reached financial close Corporate Sustainability Strategy1
post-period end
Next steps
2021 2022
▪ Continue to develop comprehensive baseline investment data to ▪ Enhance climate change disclosures in line with TCFD
prepare for EU Sustainable Finance Disclosure Regulation (‘SFDR’),
▪ Enhance disclosures in line with emerging SFDR and SDR
Taxonomy and UK Sustainability Disclosure Requirements (‘SDR’)
requirements
▪ Consider whole-life impact of construction and identify ways to
▪ Define sector specific targets against ESG objectives
minimise impacts
▪ Consider enhanced metrics and disclosures in relation to
▪ Developing KPI workstream alongside emerging standards/regulation
biodiversity, diversity and inclusion
1. ESG Investing Awards 2021.
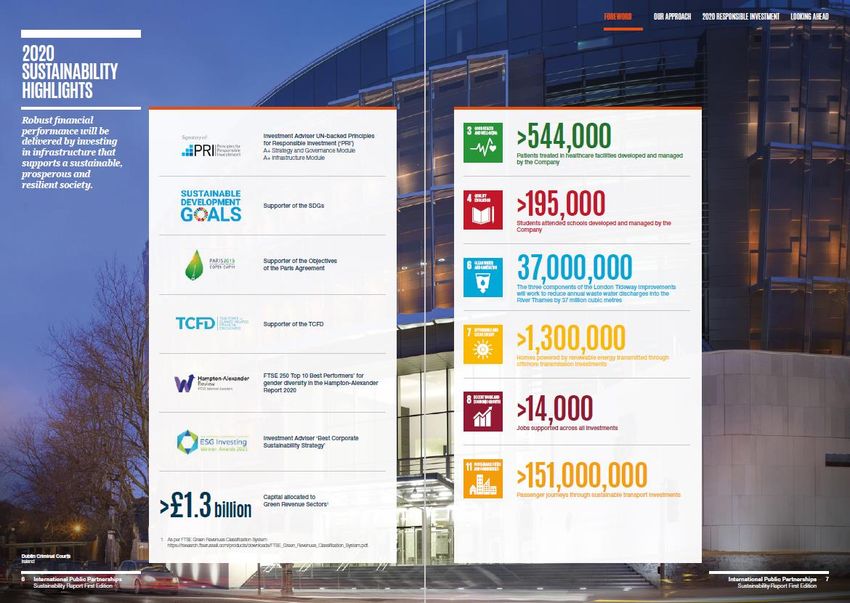
18 2021 INTERIM RESULTS PRESENTATIONSustainability Report In 2021, the Company released its inaugural Sustainability Report. This report provides a detailed overview of the Company’s approach to sustainability and ESG integration The Sustainability Report is available here. 19 2021 INTERIM RESULTS PRESENTATION
Looking Forward
Pipeline Overview
 COMMITTED PIPELINE
 KNOWN COMMITMENTS                                                       LOCATION                  INVESTMENT TENOR                      ESTIMATED INVESTMENT 1                                               ESTIMATED TIMING

 Diabolo                                                                  Belgium                        c.26 years                                   c.£12m                                     Contingent on passenger numbers

 Angel Trains                                                                 UK                 Operational business                                 c.£98m                                                         Q3 2021

 Rampion and East Anglia One OFTOs                                            UK                      c.20-21 years                               Up to £130m                                                        H2 2021

     FUTURE AREAS OF INVESTMENT 2
     The Company has a large number of opportunities currently under examination in its longer-term pipeline

                                                                                                                                                                                                                OTHER ESSENTIAL
            SOCIAL INFRASTRUCTURE                                             REGULATED UTILITIES                                        TRANSPORT AND MOBILITY
                                                                                                                                                                                                                INFRASTRUCTURE

     ▪   Education                                                  ▪ OFTOs                                                        ▪ Government-backed                                             ▪ Digital connectivity
     ▪   Health                                                     ▪ Distribution and                                               transport including:                                          ▪ Energy management
     ▪   Justice                                                      transmission                                                        ▪ Light rail
     ▪   Other social accommodation                                 ▪ Direct procurement                                                  ▪ Regional rail

                           UK                                             EUROPE                                                    AUSTRALIA                                                        NORTH AMERICA

1.    Represents the current estimate of total future investment commitment by the Company.
2.    These represent areas of possible investment under current examination. The Company is not limited to only these areas of future investment and is likely to invest in other areas from time to time in accordance with its Investment Policy.

21       2021 INTERIM RESULTS PRESENTATION
Summary and Outlook
▪ Investment portfolio is expected to continue to be resilient
RESILIENT ▪ We will continue to actively manage and mitigate risk
PORTFOLIO
▪ Strong inflation linkage continues to provide protection to projected returns in the event of a higher
inflation environment
▪ ESG considerations are integrated across the investment lifecycle
RESPONSIBLE
INVESTMENT ▪ The Company intends to evolve its sustainability reporting and align its disclosures with the
recommendations of the TCFD
▪ Increased infrastructure spending is widely acknowledged by governments as having a key role to play
in driving the economic recovery, creating jobs and addressing challenges such as those posed by
climate change
SUPPORTIVE
▪ Pressure on public finances should result in a greater role for private capital in infrastructure
POLICIES investment
▪ Our large investment origination team is well placed to capitalise on a strong pipeline of investment
opportunities
22 2021 INTERIM RESULTS PRESENTATIONAppendices
Responsible
Investment
Responsible Investment Impact
The Company supports the 2030 Agenda for Sustainable Development adopted by the UN Member States in 2015. Alignment
with the SDGs is a key part of the Company’s approach to ESG integration

Through the effective management of ESG risks and potential negative impacts, the Company believes its portfolio positively supports the
objectives of the SDGs. The chat below shows the portion of the portfolio1 which supports each of the SGDs noted

1.   Based on percentage of Investments at Fair Value as at 30 June 2021.

25      2021 INTERIM RESULTS PRESENTATION
Investment Integration
 In line with the Principles for Responsible Investment, INPP identifies and integrates ESG factors into all aspects of
 investment, development and management decision making and analysis

 ▪   INPP does this by identifying and managing the issues that are most relevant to our investments across the investment lifecycle
 ▪   The Company’s ESG process has five stages, which are seamlessly integrated into the investment process
 ▪   This incorporates material ESG aspects, including climate change

26   2021 INTERIM RESULTS PRESENTATION
Contribution to the Sustainable Development Goals
The Company supports the 2030 Agenda for Sustainable Development adopted by the UN Member States in 2015. Alignment
with the SDGs is a key part of the Company’s approach to ESG integration. The Company contributes towards the SDGs in
two main ways: the positive impact investments have on sustainable development and our focus on managing investments
sustainably
The Company’s investments support the targets set by the SDGs. Examples include:

27   2021 INTERIM RESULTS PRESENTATION
Portfolio Overview
and Valuation
Valuation Methodology
     NAV CALCULATION 1                                                                                           ADDITIONAL VALUE DRIVERS
     ▪      ‘Sum-of-the-parts’ aggregation of the present value of
                                                                                                                 We believe additional value may exist additional to that
            each of the Company’s investments plus other balance
                                                                                                                 captured in our valuation process. These items are not
            sheet items                                                                                          captured within the formal NAV assessment:
     ▪      The highly predictable nature of future cash flows justifies
            a discounted cash flow valuation of the Company’s
            investments
                                                                                                                                                        Size and risk
                                                                                                                       High degree of                  diversification
     ▪      NAV is externally reviewed as part of each year-end audit
                                                                                                                      inflation-linkage                   premium
     ▪      The Company reports two weighted average discount
            rates:
                 A ‘Risk Capital’2                                    An overall ‘Portfolio’
                  discount rate                                           discount rate
           for use as a comparable to                                which includes both Risk                           Possibility of                 Possibility of
           those funds that only invest                             Capital and the Company’s                                                           future cost
          in infrastructure Risk Capital
                                                                                                                          additional
                                                                     senior debt investments
                                                                                                                        investments3                 savings on PPPs
     ▪       The majority of the Company’s portfolio is invested in
             concessions or licenses with finite lives and the value
             of these investments should be expected to amortise
             over time
1.       See Interim Report and financial statements for the half year ended 30 June 2021 for NAV methodology.
2.       Risk Capital includes both equity and subordinated shareholder debt.
3.       Other than those contractually committed as at the valuation date.

29          2021 INTERIM RESULTS PRESENTATION
INPP’s Top 10 Investments
% INVESTMENT % INVESTMENT
STATUS AT % HOLDING AT PRIMARY SDG
NAME OF INVESTMENT LOCATION SECTOR FAIR VALUE AT FAIR VALUE AT
30 JUN 2021 30 JUN 20211 SUPPORTED
30 JUN 2021 31 DEC 2020
Gas
UK Operational 7% Risk Capital 16.5% 16.5%
Distribution
UK Waste Water Under Construction 16% Risk Capital 9.3% 9.1%
Energy
Lincs OFTO UK
Transmission
Operational 100% Risk Capital 7.7% 7.6%
Belgium Transport Operational 100% Risk Capital 7.5% 7.8%
Energy 100% Risk Capital
Ormonde OFTO UK
Transmission
Operational
and 100% senior debt
4.8% 5.0%
Australia Transport Operational 33% Risk Capital 3.9% 3.9%
Germany Transport Operational 100% Risk Capital 3.5% 3.2%
UK Transport Operational 5% Risk Capital 3.0% 3.1%
Military
US Military Housing2 US
Housing
Operational 100% Risk Capital 2.8% 2.8%
Energy 100% Risk Capital
Robin Rigg OFTO UK
Transmission
Operational
and 100% senior debt
2.3% 2.4%
1. Risk Capital includes both equity and subordinated shareholder debt.
2. Includes two tranches of subordinated debt into US military housing.
30 2021 INTERIM RESULTS PRESENTATIONInvestments at Fair Value
£m
2,500
2,450
2,400 47.2
22.3 87.1 22.5
2,345.4 33.0
2,350 48.0 2,320.3
2,300 2,280.6
2,250
2,200
2,150
2,100
Investments at Fair Investments Investment Rebased Investments Portfolio Return1 Change in Discount Change in Foreign Change in Investments at Fair
Value at 31 Dec 2020 Distributions at Fair Value Rates Exchange Rates Macroeconomic Value at 30 Jun 2021
Assumptions
▪ Investments made during the period were funded through the reinvestment of surplus operating cash and the Company’s corporate debt facility
▪ Distributions from underlying investments were in line with the forecast set at the start of the period providing strong cash dividend coverage
▪ Portfolio Return (4.3%2 on an annualised basis) captures broadly the same items as the NAV Return with the principal exceptions being fund-level
operating costs and portfolio working capital movements
▪ The breakdown of the change in discount rates can be seen on slide 9
▪ The changes in the FX rates and other macroeconomic assumptions are explained slide 10 albeit the FX impact seen in this slide is pre-hedging whereas
the FX impact seen on slide 10 is post-hedging
1. Portfolio Return represents, amongst other things, (i) variances in both realised and forecast investment cash flows and (ii) the unwinding of the discount factor applied to those future investment cash flows.
2. Calculated by dividing the Portfolio Return of £48.0m by the Rebased Investments at Fair Value of £2,280.6m and converting the result to an annual figure.
31 2021 INTERIM RESULTS PRESENTATIONPortfolio Analysis 1
SENIOR DEBT
CONSTRUCTION
11%
LATER STAGE 9%
INVESTOR3
32%
44%
MODE OFRevenue type and service providers
PORTFOLIO BY REVENUE TYPE 1 INPP SERVICE PROVIDERS 1
DIGITAL OTHER - ANGEL TRAINS,
INFRASTRUCTURE
3 DOWNER &
BENEX AND NDIF
OTHER ROLLING SPOTLESS
4
STOCK
3% 8%
7% 9%
INFRABEL NV
PPPs WITH VAN PUBLIEK RECHT
REVENUE RISK
3
7%
MECHANISMS
10% 1%
5% MITIE2
REGULATED 21%
INVESTMENT
2,3
– OFTOS 4%
47% REGULATED ENGIE
INVESTMENTS
3% HUNT MILITARY
COMMUNITIES
3%
G4S
2%
2% OCS
2%
AMEY
33% 1%
HONEYWELL
INTERNATIONAL
AVAILABILITY-BASED
7% KIER
PPPs 2 26%
REGULATED 2
OTHERS
INVESTMENT -
3
CADENT & TIDEWAY
1. Based on percentage of Investments at Fair Value as at 30 June 2021. 1. Based on percentage of Investments at Fair Value as at 30 June 2021.
2. These Availability-based PPPs include an insignificant amount of third-party income risk. 2. These include both Risk Capital and senior debt investments. Of the amount shown, senior debt represents the
3. Includes investments in Diabolo Rail and US Military Housing. following: Mitie (1.0%), Others (2.0%), and OFTOs (7.7%).
4. Includes investments in Angel Trains and BeNEX. 3. These Risk Capital investments operate with no significant exposure to any one service provider or delivery partner.
33 2021 INTERIM RESULTS PRESENTATIONValuation Sensitivities and Discount Rate Trends
ESTIMATED IMPACT OF CHANGES IN KEY VARIABLES ON 30 JUNE 2021 NAV OF 145.1p PER SHARE PORTFOLIO INFLATION
LINKAGE1
Discount rates +/-1% -13.2 15.8
Inflation +/- 1%
Foreign Exchange +/-10%
-12.2
-3.8 3.8
14.2
0.75% p.a.
(Dec 2020: 0.78% p.a.)
Deposit rates +/-1% -1.3 1.4
Tax rates +/-1% -0.8 0.7
+ change - change
Lifecycle +/-10% -0.7 0.7
-18.0 -12.0 -6.0 0.0 6.0 12.0 18.0
HISTORICAL WEIGHTED AVERAGE RISK CAPITAL DISCOUNT RATE
10%
8%
6%
4%
2%
0%
Dec-10 Jun-11 Dec-11 Jun-12 Dec-12 Jun-13 Dec-13 Jun-14 Dec-14 Jun-15 Dec-15 Jun-16 Dec-16 Jun-17 Dec-17 Jun-18 Dec-18 Jun-19 Dec-19 Jun-20 Dec-20 Jun-21
Weighted Average Government Bond Yield Weighted Average Investment Premium
1. Projected increase in portfolio return for a 1.00% p.a. increase in the inflation rates assumed in the current valuations.
34 2021 INTERIM RESULTS PRESENTATIONProjected Cash Flows Under a +100bps Inflation Scenario
Projected annual cash flows available for dividends (+100bps inflation) 1
(£m)
400
350
300
250
200
150
100
50
0
2021
2022
2023
2024
2025
2026
2027
2028
2029
2030
2031
2032
2033
2034
2035
2036
2037
2038
2039
2040
2041
2042
2043
2044
2045
2046
2047
2048
2049
2050
Cash Available for Dividends - Base Case Increase compared to Base Case
▪ This inflation scenario assumes all investments experience an annual rate of inflation equal to 100bps more than the relevant inflation
assumption used in the 30 June 2021 valuations
▪ Annual cash flows available for dividends are shown up to and including 2050 for illustrative purposes. Annual cash flows available for dividends
represents the forecast investment receipts less the forecast operating costs
▪ Scenario is conservative as it only considers cash generated in each period and ignores existing cash balances. In addition, certain current
investments are expected to generate cash flows beyond the 2050 timeline shown
1. This chart is not intended to provide any future profit forecast. Cash flows shown are projections based on the current individual asset financial models and may vary in future. Only investments committed as at 30 June 2021 are included.
35 2021 INTERIM RESULTS PRESENTATIONMacroeconomic Assumptions
ASSUMPTION JURISDICTION 30 JUN 2021 31 DEC 2020
UK 2.75% RPI/2.00% CPIH 2.75% RPI/2.00% CPIH
Australia 2.50% 2.50%
INFLATION RATES Europe 2.00% 2.00%
Canada 2.00% 2.00%
US1 N/A N/A
UK 1.00% 1.00%
Australia 2.00% 2.00%
LONG-TERM
Europe 0.50% 0.50%
DEPOSIT RATES2
Canada 1.50% 1.50%
US1 N/A N/A
GBP/AUD 1.84 1.77
GBP/EUR 1.16 1.11
FOREIGN EXCHANGE RATES
GBP/CAD 1.72 1.74
GBP/USD 1.38 1.37
UK 19.00% / 25.00% 19.00%
Australia 30.00% 30.00%
TAX RATES3 Europe Various (12.50%-32.28%) Various (12.50%-32.28%)
Canada Various (23.00%-26.50%) Various (23.00%-26.50%)
US1 N/A N/A
1. The Company’s US investment is in the form of subordinated debt and therefore not directly impacted by inflation, deposit and tax rate assumptions.
2. The portfolio valuation assumes actual current deposit rates are maintained until 31 December 2023 before adjusting to the long-term rates noted in the table above from 1 January 2024. The 31 December 2020 valuation assumed the long-term rates
noted in the table above would apply from 1 January 2023.
3. Tax rates reflect those substantively enacted as at the valuation date or those that could reasonably be expected to be substantively enacted shortly after the valuation date.
36 2021 INTERIM RESULTS PRESENTATIONPortfolio Information
INVESTMENTS MADE DURING THE SIX-MONTHS TO 30 JUNE 2021
PRIMARY SDG
INVESTMENT LOCATION OPERATIONAL STATUS AMOUNT INVESTMENT DATE
SUPPORTED
OFFENBACH POLICE CENTRE GERMANY Operational £8.1m1 June 2021
TOOB UK Operational £14.2m April 2021
TOTAL £22.3m
INVESTMENTS MADE AFTER PERIOD END
PRIMARY SDG
INVESTMENT LOCATION OPERATIONAL STATUS AMOUNT INVESTMENT DATE
SUPPORTED
BEATRICE OFTO UK Operational £49.8m July 2021
ANGEL TRAINS UK Operational c.£98m September 2021
ASSETS UNDER CONSTRUCTION
CONSTRUCTION DEFECTS % INVESTMENT PRIMARY SDG
INVESTMENT LOCATION COMPLETION DATE COMPLETION DATE STATUS FAIR VALUE SUPPORTED
Behind original
TIDEWAY UK 20252 2028 9.3%
schedule3
TOTAL 9.3%
1. GBP translated value of investment.
2. Scheduled handover date. Source: Tideway Annual Report 2020/2021.
3. Handover is currently scheduled for March 2025, which is 12 months later than the original schedule. The delay can largely be attributed to the impact of Covid-19.
37 2021 INTERIM RESULTS PRESENTATIONCash Generation and Operating Costs
30 JUN 2021 30 JUN 2020
SUMMARY CASH FLOW (£m) (£m) NOTES
Opening cash balance 44.3 45.6
Cash from investments 87.1 82.9 Increase reflects the further growth and maturity of the portfolio
Corporate costs (for ongoing charges ratio) (14.7) (14.6)
Other corporate costs - -
Net financing costs (3.3) (2.1) Increase reflects the renewal and utilisation of the CDF during the period
Net operating cash flows before capital 69.1 66.2
activity
Cost of new investments (22.3) (11.7) Increase due to the level of investment activity during the period
Investment transaction costs (0.1) (0.5)
Net movement of corporate debt facility 17.6 (7.7) Drawdowns made to fund new investments in the period
Dividends paid (55.2) (51.5) Cash dividends paid net of scrip
Closing cash balance 53.4 40.4
Cash dividend cover 1.3x 1.3x
38 2021 INTERIM RESULTS PRESENTATIONGearing and Investment Life
TIDEWAY
ASSET LEVEL DEBT
CADENT 9%
▪ Asset level debt is non-recourse to the Company
OFTOS
17%
PPP & OFTOS 21%
▪ Generally fixed-term, fixed-rate debt
▪ Principal generally amortised over the life of the project
▪ Structure is intended to minimise risk
9%
REGULATED INVESTMENTS – CADENT & TIDEWAY OPERATING
BUSINESSES –
▪ Reflecting the long-term nature of the assets, debt generally PPP
BENEX,
44%
comprises both bank facilities and bonds of varying maturity ANGEL TRAINS
& NDIF
dates. Debt will normally be refinanced upon maturity
▪ UK regulators (INPP’s assets are regulated by Ofgem and
COMPANY LEVEL DEBT
Ofwat) provide a regulated return which includes an element
intended to compensate for debt costs ▪ INPP renegotiated its corporate debt facility in March 2021 with the
following terms:
▪ INPP’s regulated assets benefit from possessing amongst the
▪ £250m facility with a £150m ‘accordion’ maturing in March 2024
lowest cost of debt compared to their peers in the sector
▪ Margin of 165bps over EURIBOR for Euro drawings and 170bps
over SONIA for Sterling drawings
OTHER – E.G. ANGEL TRAINS & BENEX
▪ Rachet mechanism on the commitment fee such that the it varies
▪ Contracted debt generally supported by fixed rate leases and in between 50bps and 90bps depending on the level of utilisation
some cases underpinned by government support packages
▪ At 30 June 2021, £56m was cash drawn, leaving £194m available for
▪ Changes in uncontracted cost of debt should be passed on to use
end consumers
INVESTMENT LIFE
▪ Weighted average investment life of 32 yrs vs. weighted average debt
tenor of 30 yrs (31 Dec 2020: 32 yrs vs. 30 yrs respectively)
39 2021 INTERIM RESULTS PRESENTATIONAbout Amber Infrastructure
Specialist fund manager
Amber manages or advises seven co-mingled funds and other managed accounts. Of these, seven are closed-ended unlisted structures

              AMBER FUND                                                     FOCUS                         HIGHLIGHTS                         PARTNERS                     SIZE
                                                                                                        15-year track record;
                                                                      Long-term public                                                                                 £2.7bn
                                                                                                      FTSE 250-listed investment              Listed investors
                                                                    infrastructure assets                                                                             market cap1
                                                                                                             company

                                                                                                         First dedicated Digital              HM Treasury
                                                                    Digital infrastructure                                                                              £100m
                                                                                                     Infrastructure fund in Europe           Private investors

                                                                                                                                         Mayor of London Greater
                                                                   Energy efficiency, and             First dedicated UK Energy
                                                                                                                                         London Authority (GLA)        £110m1
                         *                                         decentralised energy                      Efficiency fund
                                                                                                                                                   EIB

                                                                   Energy efficiency,                 Follow-on appointment to               Mayor of London
                                                                decentralised energy and             manage the second London                     GLA                  £500m2
                                           *
                                                                      renewables                           efficiency fund                  Commercial banks

                                                              Urban regeneration, district          Largest industrial and business        Scottish Government
                                                                                                                                                                           £95m
                                            *
                                                                  heating and CHP                   real estate investor in Scotland3               EIB

                                                                       Greenfield -                                                          Cornerstoned by
                                                                                                      Enhance key infrastructure
                                                                  Transport, Energy and                                                 Government-backed financial    €923m4
                                                                                                        across the CEE region
                                                                         Digital                                                               institutions
                                                                Supercore / regulated                                                     Co-mingled account for
     SAIF5                                                   projects with an allocation to            First of its kind structure        Korean investors (incl.       €200m
                                                                       core plus                                                               insurance)

1.   As at 30 June 2021.
2.   Investor funds under management including available contingent facilities.
3.   Since 2011, based on industrial and business real estate which does not rely on pre-letting.
                                                                                                                                                                       *
4.   As at June 2021. Initial closings have been running since February 2020.

41      2021 INTERIM RESULTS PRESENTATION
Amber’s extensive international track record and presence
Amber has offices and personnel across Europe, North America and Australia
Helsinki
UNITED KINGDOM
EUROPE
▪ Cadent Gas Distribution
▪ Federal German Ministry of Education
▪ Thames Tideway Tunnel
and Research Headquarters
▪ Angel Trains
▪ Dublin Courts (Ireland)
▪ OFTO portfolio (8 investments)
▪ Diabolo Rail Link (Belgium)
▪ Building Schools for the Future Portfolio
Edinburgh ▪ BeNEX Rail (Germany)
(47 investments)
▪ Pforzheim Schools (Germany)
▪ NHS-Lift assets (33 investments)
▪ Brescia Hospital (Italy)
▪ Local government infrastructure (8 investments)
▪ Offenbach (Germany)
▪ Priority Schools Aggregator London
▪ Amiens Hospital (France)
▪ JESSICA Fund Assets
Brussels Warsaw ▪ Service Terminal Rotterdam (Netherlands)
▪ Schools PFI (8 investments, 177 schools)
▪ National Digital Infrastructure Fund
▪ UK battery storage Prague
CENTRAL AND EASTERN EUROPE
▪ UK later living accommodation ▪ Cargounit (Poland)
Munich
Paris Vienna ▪ Greenergy Data Centers (Estonia)
▪ Enery (Bulgaria, Czech Republic, Slovakia)
AUSTRALIA
NORTH AMERICA ▪ Orange Hospital Darwin
US Military Housing (Various, US)
▪ ▪ Long Bay Forensic & Prison
Durham Consolidated Courthouse (Ontario)
▪ Hospitals
Alberta Schools (Alberta)
▪ ▪ Royal Melbourne
Partnership with Hunt Companies provides
▪ Showgrounds
Amber with access to large (1,500 ▪ Reliance Rail
Calgary employees) ▪ NSW Schools 2 Sydney
and highly specialised Hunt workforce ▪ Royal Children’s Hospital
New York across 46 states ▪ Gold Coast Light Rail Melbourne
San ▪ Circle Power investment (renewables
Francisco platform) ▪ Victorian New Schools PPP
▪ US utility platform ▪ iseek
42 2021 INTERIM RESULTS PRESENTATIONContacts
Contact Details
AMBER FUND MANAGEMENT                           FTI CONSULTING (PR & COMMUNICATIONS)
Director, INPP: Giles Frost                     Senior Director: Ed Berry
Telephone: +44 (0)20 7939 0550                  Telephone: +44 (0)20 3727 1046
Email: Giles.Frost@amberinfrastructure.com      Email: Edward.Berry@fticonsulting.com

Investment Director: Chris Morgan               Director: Mitch Barltrop
Telephone: +44 (0)20 7939 0550                  Telephone: +44 (0)20 3727 1039
Email: Chris.Morgan@amberinfrastructure.com     Email: Mitch.Barltrop@fticonsulting.com

Investor Relations: Erica Sibree
Telephone: +44 (0)20 7939 0550                  NUMIS SECURITIES (BROKER)
Email: Erica.Sibree@amberinfrastructure.com
                                                Corporate: Hugh Jonathan
Investor Relations: Amy Edwards                 Telephone: +44 (0)20 7260 1345
Telephone: +44 (0)20 7939 0550                  Email: H.jonathan@numis.com
Email: Amy.Edwards@amberinfrastructure.com      Sales: James Glass
                                                Telephone: +44 (0)20 7260 1369
Chief Executive Officer: Gavin Tait             Email: J.Glass@numis.com
Telephone: +44 (0)20 7939 0550
Email: Gavin.Tait@amberinfrastructure.com       Research: Andrew Rees / Ewan Lovett-Turner
                                                Telephone: +44 (0)20 7260 1217 / 1254
Financial Controller: Muhammad Anwer            Email: A.Rees@numis.com / E.Lovett-Turner@numis.com
Telephone: +44 (0)20 7939 0550
Email: Muhammad.Anwer@amberinfrastructure.com

44   2021 INTERIM RESULTS PRESENTATION
You can also read