PIONEERING TECHNOLOGY - H1 Report 2020
←
→
Page content transcription
If your browser does not render page correctly, please read the page content below
PIONEERING TECHNOLOGY
H1 Report 2020
Highlights
                                                                                                            Unit      H1 / 2020    H1 / 2019    Change

 Revenue                                                                                                   kEUR         31,178       16,378        90%

 Total operating revenue                                                                                   kEUR         32,062       18,330        75%

 Cost of materials                                                                                         kEUR        (14,011)     (10,680)       31%

 Cost of materials ratio (in % of total operating revenue)                                                     %           (44)         (58)     14 pts

 Personnel costs                                                                                           kEUR        (17,405)     (17,624)        1%

 Personnel cost ratio (in % of total operating revenue)                                                        %             54           96    (42) pts

 EBITDA                                                                                                    kEUR         (6,010)     (18,907)       68%

 EBITDA-Margin (in % of total operating revenue)                                                               %           (19)        (103)     96 pts

 Consolidated net result                                                                                   kEUR        (12,498)     (30,795)       59%

 Earnings per share                                                                                         EUR           (0,63)       (1,56)      60%

 New order intake      *
                                                                                                           kEUR         13,679       20,767       (34)%

 Backlog – Machine related*                                                                                kEUR         19,249       14,644        31%
 *
     refers to the sale of machines including any service offerings, does not include stand-alone service contracts

SLM Solutions | To the shareholders | Group interim management report | Interim consolidated financial statements and notes                            2
Content

Briefing Note by the CEO                                                                                                4

Group Management Report                                                                                                 6
Basis of the Group                                                                                                       6

Economic and Business Report                                                                                             9

Opportunity and risks report                                                                                           12

Forecast                                                                                                               13

Consolidated Financial Statements and Related Notes                                                                   14
Consolidated Income Statement (January 1 to June 30, 2020)                                                             15

Consolidated Statement of Comprehensive Income (January 1 to June 30, 2020)                                            16

Consolidated Income Statement (April 1 to June 30, 2020)                                                               17

Consolidated statement of comprehensive income (April 1 to June 30, 2020)                                              18

Consolidated Balance Sheet                                                                                             19

Consolidated Cash Flow Statement (January 1 to June 30, 2020)                                                          20

Consolidated Statement of Changes in Group Equity                                                                      21

Notes to the Consolidated Annual Financial Statements (IFRS) (January 1 to June 30, 2020)                              22

Affirmation by the Legal Representatives                                                                               26

Imprint                                                                                                                27

SLM Solutions | To the shareholders | Group interim management report | Interim consolidated financial statements and notes   3
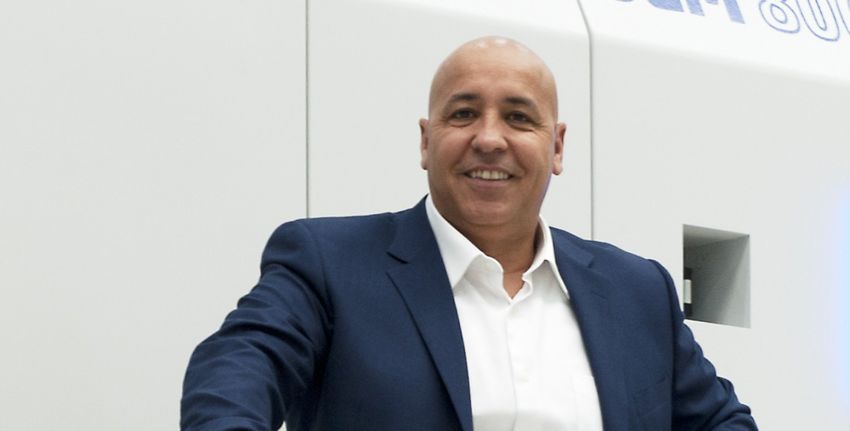
Meddah Hadjar (CEO)

Meddah Hadjar (Vorstandsvorsitzender)

Briefing Note by the CEO

Dear shareholders, customers, business partners and employees,

The end of H1 2020 marks the first anniversary of the significant change and restructuring process that we started at SLM Solutions in May 2019. In
the last twelve months we were able retain very experienced executives for vital areas of our business that require fundamental improvement. The
enhanced organizational maturity in all areas of the Company is allowing us to leverage SLM’s strong technology position to deliver standardized high
quality, reliable 3D printing systems to our customers. The advanced capabilities of our products allow our customers to start integrating our systems in
sophisticated, larger scale, industrial manufacturing processes and improve engineering and manufacturing efficiency dramatically.

We have previously mentioned that the fundamental change we are implementing at SLM Solutions will take time to lead to a meaningful improvement
in our financial metrics. However, already in H1 2020 we were able to convert the better technological and economic value proposition for our customers
into significant revenue growth, increased profitability, and a better cash flow profile at SLM Solutions. We are especially proud of this against the
backdrop of the adverse economic environment that the global COVID-19 pandemic has created.

The COVID-19 pandemic and the related lockdowns globally had a significant impact on our customers being able to conduct business and also on how
we were able to interact with our customers. During the lockdowns in various countries it was significantly more difficult, and took more effort and time,
to install our systems at our customers premises. The ability and willingness of our clients to interact with us in this extraordinary time on new, complex
projects also slowed as many were more inward focused as they tried to navigate the challenges brought on by COVID-19. Customers in some of our
core end markets, e.g. the market for aeroengines, are facing significant end market demand weakness, which will result in a delay in the application of
Additive Manufacturing technologies in these industries. At the same time, however, we have experienced an increased interest from current and new
customers across the manufacturing space for our systems and technology as the COVID-19 pandemic focusses companies heavily on derisking their
global supply chains, localizing key component manufacturing and creating increased flexibility in their manufacturing processes. SLM Solutions and
Additive Manufacturing technologies in general are expected to play a avital role in supporting companies implementing such strategies.

Despite some of the COVID-19 headwinds we were able to increase H1 2020 revenue year-on-year by 90% to EUR 31.2 million (H1 2019: EUR 16.4 million)
and improve EBITDA by EUR 12.9 million to EUR -6.0 million (H1 2019: EUR -18.9 million), providing evidence of the ongoing turnaround of the company.
The COVID-19 situation still limits the visibility we have on our business but has also highlighted our strength as an agile organization that can adapt
quickly to change. Under the assumption that the COVID-19 pandemic will not further deteriorate, and new broader lock downs can be avoided, we
expect revenue for FY 2020 to be at least 20% over the previous year, with EBITDA to improve to between EUR -13 million to -18 million (2019 EBITDA:
EUR -26 million).

SLM Solutions | To the shareholders | Group interim management report | Interim consolidated financial statements and notes                              4
On 26 March 2020 we announced a convertible bond offering for total proceeds of EUR 60 million in three tranches. All SLM Solutions security holders
were able to participate in the rights offering of the convertible bond. The first tranche with proceeds of EUR 15 million closed on 14 July 2020. The entire
offering was, and future tranches continue to be backstopped by funds managed by Elliott Advisors (UK) Limited, our largest shareholder, a strong sign
of confidence in our Company.

Finally, we are on the last stretch of being able to present to the broader public our NextGen product in November 2020. We believe that our NextGen
machine will not only be a key factor for SLM Solutions growth and economic success, but it will be ground-breaking for the Metal Additive Manufacturing
industry.

Lübeck, August 13, 2020

Meddah Hadjar
(CEO)

SLM Solutions | To the shareholders | Group interim management report | Interim consolidated financial statements and notes                                5
Group Management Report

Basic of the Group
Group structure
SLM Solutions Group AG, headquartered in Lübeck, Germany, had eight wholly owned subsidiaries and one joint venture as of June 30, 2020. SLM
Solutions Group AG acts as the only production facility in the Group and is responsible for a large proportion of operating and administrative tasks as well
as product development within the Group, and it also coordinates global sales activities. The subsidiaries based in Singapore, the USA, Canada, China,
Russia, India, Italy and France promote local sales activities in their allocated geographical regions. In addition, they also provide services for customers.

The joint venture 3D Metal Powder GmbH was responsible for the development, production and sale of metal powders. This company was founded due
to the difficult availability of a “by-product” that SLM Solutions Group AG needed from metal powder producers. After the establishment of the entity,
the availability of the product significantly improved. Therefore, SLM Solutions Group AG decided to offer its shares in the joint venture for sale due to
strategic reasons. SLM Solutions Group AG currently holds 51% of the share capital.

             SLM Solutions Group AG, Lübeck

         SLM Solutions NA, Inc.,                          100 %
         Wixom, Michigan, USA

         SLM Solutions Singapore Pte Ltd,                 100 %
         Singapore

         SLM Solutions (Shanghai) Co. Ltd.,               100 %
         Shanghai, China

         SLM Solutions RUS OOO,                           100 %
         Moscow, Russia

         SLM Solutions (India) Private Limited,           100 %
         Bangalore, India

         SLM Solutions S.R.L.,                            100 %
         Milano, Italy

         SLM Solutions SAS,                               100 %
         Paris, France

         SLM Solutions (Canada)                           100 %
         Inc., Toronto, Canada

         3D Metal Powder GmbH,
                                                           51 %
         Lübeck, Germany

SLM Solutions | To the shareholders | Group interim management report | Interim consolidated financial statements and notes                                 6
Employees
SLM Solutions Group AG increased the number of FTE (Full-time equivalents) by 24 compared to the previous year. The increase was driven by all
functions except for production.
June 30, June 30,
Full-time equivalents (FTEs) 2020 2019
Research and Development 96 88
Sales 98 87
After Sales 82 76
Production 89 96
Administration 55 49
Total 420 396
of which in Europe 337 328
of which in USA 39 32
of which in Asia 44 36
Business Model
SLM Solutions Group AG („SLM Solutions“), headquartered in Lübeck, Germany, is a leading provider of metal-based additive manufacturing technology
(“3D printing technology”).
The business was divided into two operating segments in the period under review:
The Machine Business segment encompasses the development and production as well as the marketing and sale of machines and peripheral
equipment for selective laser melting. The machines are sold via a global distribution network. This segment currently represents the focal point of
the business.
The After-Sales Business segment is of strategic interest for the Company and is increasingly gaining in importance. It encompasses business with
machine-related services, the sales of replacement parts and accessories, as well as the sales of merchandise, consumables and services not related
to machines.
The product range currently comprises four systems – the SLM®125, SLM®280, SLM®500 and SLM®800 – which are differentiated by the size of the build
chamber and the number of lasers which can be fitted. These systems enable direct production of highly complex metal components from many
different alloys produced from source materials such as aluminum, titanium, cobalt chrome, nickel, tool steel or stainless steel, as well as super alloys. Our
systems are capable of processing almost any type of weldable alloy into a finished product. The systems are constantly improved and equipped with
new functions.
The systems of SLM Solutions make use of the selective laser melting technology: A computer 3D model of the object to be made constitutes the
starting point for the additive manufacturing process. This object is melted in layers by applying one or multiple laser beams simultaneously in a
metallic powder bed. Parts manufactured in this way meet the highest standards in terms of stability, surface structure and biocompatibility – different
requirements are prioritized depending on the intended application.
One of the significant benefits of additive manufacturing is its lower level of material consumption compared with conventional manufacturing methods.
This approach also creates new degrees of freedom in product design which focuses on and benefits the desired functionalities of the component in
question. As a result, additive manufacturing is well suited to producing complex components which can be used as prototypes or in series production.
In contrast to conventional production methods, complexity is not a cost factor in this type of manufacturing (“complexity comes for free”). The additive
manufacturing of metal parts also offers enormous advantages in terms of speed, as no molds or tools are required. SLM Solutions’ patented multi-
laser technology underlines the Company’s technology leadership. Industrial manufacturing processes such as precision casting are being increasingly
supplemented by laser melting.
The customers of SLM Solutions come from a wide variety of industries, including the aviation and space industries, automotive, tooling, engineering,
the medical and energy sectors, both contract manufacturers and end-users. Target markets for SLM Solutions are Europe and the North American and
Asia-Pacific regions.
SLM’s machine business is subject to cyclical fluctuations which are typical within this industry. Generally, a significant share of turnover and order intake
is achieved in the fourth quarter with the first quarter traditionally being the weakest of the year. In order to minimize the impact of seasonality in the
medium term, the board intends to expand SLM’s after sales business, in particular, by widening the product portfolio to include less-volatile products
such as powder.
SLM Solutions | To the shareholders | Group interim management report | Interim consolidated financial statements and notes 7
Goals and Strategy SLM Solutions pursues the objective of securing its position as the technology leader in metal-based additive manufacturing over the long term, playing a key role in shaping the technology and thereby growing significantly and profitably in the foreseeable future. To this end, SLM Solutions pursues a medium-term growth strategy consisting of three pillars for which interim targets are frequently defined and evaluated: SLM Solutions focuses on research and development (R&D) to secure and extend its technology leadership in the metal-based additive manufacturing area. The intellectual property rights portfolio is continuously optimized, and in the company’s view, the R&D team ensures that its technology leadership is extended in a range of different projects. SLM Solutions also cooperates with research institutes and universities in order to further develop its technology, and to enable it to be deployed for increasingly new applications from all sectors. SLM is aiming to evolve into a full-service solutions provider in the field of additive manufacturing and grow into related business areas. For example, SLM Solutions continues to expand its business with metal powders which form the starting point for manufacturing by its selective laser melting plants. This expansion in the powder business by means of strategic partnerships in the form of close cooperation, is intended to develop as an additional business alongside machine sales, and should contribute to a lessening of the typical industry seasonality of the Group on a revenue and earnings level. To receive a high-quality finished product, the specification and qualification of the metal powder requires specialized expertise and quality-assured processes which is compensated by the market accordingly. Given the complexity of selective laser melting, its proximity to customers represents a critical competitive advantage for SLM Solutions. In order to retain existing customers in the long term, generate recurring service revenues and acquire new customers, SLM Solutions is gradually expanding its international sales and service network by establishing subsidiaries and partnerships based in different regions. The Company is constantly increasing its presence through presentation centers, demonstration machines, customer training sessions and participation at important trade fairs and keynote speeches. Management System SLM Solutions has identified the following key figures as the most important financial performance indicators for business and it publishes these regularly: The Company’s order and revenue trend is the key performance indicator to assess exploitation of the Company’s growth potential within a completed reporting period. This KPI is also regularly compared with the growth rate of the global market for additive manufacturing. For SLM Solutions, as a young growth company, the margin before interest, tax, depreciation and amortization (EBITDA margin) provides us with the best indicator of profitability. This key indicator excludes national particularities relating to tax legislation, the selected financing structure and the intensity of investment in operating business, facilitating the comparison of the company with the international peer group. Compared to prior year, SLM adjusted the calculation of this metric to be based on total operating revenue (previous year: revenue). In addition, absolute EBITDA serves as the main key figure disclosing the Company’s profit. The intention of this key figure is to present the actual operating business and in doing so make earnings more comparable between fiscal years and other companies. As part of the internal steering system, the Management Board of SLM Solutions is informed at regular intervals about internal key performance indicators. These mainly comprise: The personnel cost ratio (defined as personnel costs in relation to total operating revenue) The cost of materials ratio (defined as cost of materials in relation to total operating revenue) Research and development For years, SLM Solutions has been setting the stage for crucial elements of its business success through its Research and Development Department. Especially in the field of multi-laser technology where the company claims to be one of the market leaders, SLM Solutions was able to adapt its technology to further areas of the market. The Company thereby commands an extensive portfolio of intellectual property rights, including patents and licenses not only for selective laser melting technology and the hull-core imaging process. Global alliances with universities and research facilities allow SLM Solutions to always be at forefront of technological enhancements. This ensures a platform for the successful use of SLM® technology in volume production in various sectors. Investments in research and development concentrate primarily on the areas of productivity increases and robust production systems. Moreover, the focus is also on making improvements in the area of material research (e.g. materials that are hard to form/work) as well as finding ways to shorten the total production time of a new component. Interconnections in the industrial production environment (“Industry 4.0”) are now an integral part of modern production and fit perfectly with the fully digitalized SLM® process. The research and development department of SLM Solutions consisted of 96 FTEs (full-time equivalents) as of June 30, 2020 (previous year: 87.5 FTEs). Development costs of kEUR 3,713 were capitalized in the first half of 2020 (previous year kEUR 4,204). Total development costs before other work performed by the company and capitalized and excluding depreciation of completed projects was kEUR 8,496 (previous year: kEUR 8,950). Depreciation for completed projects was kEUR 1,961 (previous year: 1,806). SLM Solutions | To the shareholders | Group interim management report | Interim consolidated financial statements and notes 8
Economic and Business Report
Macroeconomic situation in target markets
The Kiel Institute for the World Economy (IfW) estimates that the world economy is far behind the initial growth estimates for 2020 due to the COVID-19
pandemic. The IfW indicator which estimates worldwide business activity based on indicators from 42 countries, shows a dramatic decrease. The world
economy shrank in the first half of 2020 compared to the previous year by almost 10% with the low point reached in April.1 Despite an expected increase
of production in the second half of the year following various state aid programs, the IfW expects production to shrink by 3.8%. In 2021, production
is expected to recover with a growth rate of 6.2%.2 Overall, the COVID-19 pandemic is expected to have a long-lasting impact on capital expenditure
decisions and therefore impacting worldwide production.

Within the European Union, GDP decreased by 3.2% in the first quarter. The IfW expects a further decrease by 13% in the second quarter.3 France, Italy
and Spain were impacted the most in the first quarter showing GDP declines of 5% as a result of the significant number of infections and the resulting
restrictions. Germany and the Netherlands shown a relatively modest decrease by 2% in the first quarter reflecting lower infection rates in those coun-
tries.4 The IfW expects production in the Euro zone to fall by 8.6% in 2020 followed by an increase of 6.6% in 2021.5

The GDP of the United States shrank by 1.3% in the first quarter of 2020. The IfW estimates a further decrease of 12% in the second quarter. For the total
year 2020, the IfW expects a decrease of 5.8% while growing 4.2% in 2021.6

China in comparison is believed to better weather the impact of COVID-19. Industrial production grew by 33% in March and reached prior year levels in
April. However, the business activity is still impacted by lower exports as most countries still facing significant restrictions. Based on IfW estimates, China´s
GDP grew by 8% in the second quarter of 2020.7

Metal-based Additive Market
SLM Solutions operates in the growth market for metal-based additive manufacturing techniques. Consulting house Ampower puts the global volume
of metal-based additive manufacturing at EUR 2.0 billion in 2019 (2018: EUR 1.5 billion).8 Ampower estimates that the market continuous to grow
dynamically and expects the volume to reach EUR 6.9 billion in 2024 reflecting an annual compound growth rate of 28%.9

Based on a worldwide survey of Ernst & Young, metal-based additive manufacturing is becoming increasingly important for industrial users. 65% of
participants expect metal to be the most important material for additive manufacturing.10 The selective laser melting technology that SLM Solutions
applies ranks among the so-called “powder bed fusion” processes that offer greater precision, surface quality and design freedom compared with other
3D printing processes. In addition, the Management Board of SLM Solutions is convinced that additive production techniques are now ready for use in
volume production. From a technical point of view, this degree of development at SLM Solutions is indicated, among other things, by the option of being
able to use up to four lasers at the same time to produce a part. SLM Solutions AG is currently developing a new generation of laser machines which far
exceed previous technical capabilities thus creating new areas of application.

The management expects the new machine generation to contribute significantly to the productivity of metal-based additive manufacturing and
therefore make it more cost-efficient.

Business Progress
During the first half of 2020, SLM Solutions recorded an order intake of kEUR 13,679 (June 30, 2019: kEUR 20,767). The Covid-19 pandemic significantly
influenced the order intake due the overall uncertain situation for both customers and the overall market as well as lower customer availability, travel
restrictions and the cancellation of trade fairs. Most projects were delayed and not cancelled as customers understand the importance of additive
manufacturing for their own supply chain. As of June 30, 2020, machine-related order backlog was at kEUR 19.249 (June 30, 2019: kEUR 14.644).

The segment Machine business, which accounts for the sale of machines including options, generated revenue of kEUR 23,758 (June 30, 2019: kEUR
9,374), representing 76% of the group revenue (June 30, 2019: 57 %), during the first half of 2019. The segment After Sales Business, comprising service
revenue and the sale of spare parts and commodities, generated revenue of kEUR 7,421 (June 30, 2019: kEUR 7,004), representing 24% of group revenue
(June 30, 2019: 43%).

The sixth Annual General Meeting of SLM Solutions took place as a virtual meeting on June 16, 2020. Among other points, the shareholders approved
the acts of the management and supervisory boards, elected a new supervisory board members and external auditors for the year 2020, and approved
a new convertible bond. The results of the voting were published after the Annual General Meeting on the homepage of the company.

1
  Institut für Weltwirtschaft: Kieler KonjunkturberichtmWeltkonjunktur im Sommer 2020, S. 2.
2
  Institut für Weltwirtschaft: Kieler KonjunkturberichtmWeltkonjunktur im Sommer 2020, S. 2.
3
  Institut für Weltwirtschaft: Kieler KonjunkturberichtmWeltkonjunktur im Sommer 2020, S. 12.
4
  Institut für Weltwirtschaft: Kieler KonjunkturberichtmWeltkonjunktur im Sommer 2020, S. 4.
5
  Institut für Weltwirtschaft: Kieler KonjunkturberichtmWeltkonjunktur im Sommer 2020, S. 11,
6
  Institut für Weltwirtschaft: Kieler KonjunkturberichtmWeltkonjunktur im Sommer 2020. S.11
7
  Institut für Weltwirtschaft: Kieler KonjunkturberichtmWeltkonjunktur im Sommer 2020, S. 5.
8
  Ampower (2020), Metal Additive Manufacturing Report 2020, S. 19
9
  Ampower (2020), Metal Additive Manufacturing Report 2020, S. 19
10
   Ernst & Young (2019), EY‘s Global 3D Printing Report 2019, S. 11

SLM Solutions | To the shareholders | Group interim management report | Interim consolidated financial statements and notes                                    9
Results of Operation
        In the first half year 2020, total sales of SLM Solutions increased by 90% to kEUR 31,178 (June 30, 2019: kEUR 16,378), with 76% derived from the sale of
        laser melting machines, the core business of the company (June 30, 2019: 57%). In this segment the revenue is significantly up to kEUR 23,758 from kEUR
        9,374 in the previous year (June 30, 2019) and therefore was the main growth driver.

        Development consolidated revenue (kEUR)

                                                      17,848
                         17,058
                                        15,526
                                                                    13,330

            9,042

          Q2/2019       Q3/2019       Q4/2019       Q1/2020       Q2/2020

        Overall operating revenue (the total of sales revenue, changes in inventories and other capitalized expenses) of kEUR 32,062 is 75% higher compared to
        previous year (kEUR 18,330). Besides the significant revenue growth, SLM Solutions increased its other work performed by the company and capitalized
        by 10% to kEUR 2,242 (June 30, 2019: kEUR 2,033).

        Other operating income of kEUR 1,555 was significantly higher compared to prior year (kEUR 827), mainly driven by the release of accruals of sales
        commissions for third party agents.

        Cost of material increased due to the revenue growth significantly by 31% to kEUR 14,011 (June 30, 2019: kEUR 10,680) while the cost of material ratio
        (as % of total output) of 44% was well below the previous year (June 30,2019: 58%) indicating improved purchasing conditions as well as better efficiency
        within material management.

        Employee count increased to 420 full-time equivalents (FTEs) as of June 30, 2020 (June 30, 2019: 396 FTEs); while personnel cost of kEUR 14,405 increased
        by 1% compared with the prior year period (June 30, 2019: kEUR 17,624).

        Other operating expenses in the first half of 2020 were kEUR 8,206 or 14% above the previous year value as of June 30, 2019 (kEUR 9,554). Major drivers
        for the reduction were lower bad debt reserves, travel and marketing expenses due to the COVID-19 pandemic.

        EBITDA (earnings before interest, tax, depreciation, and amortization) in the reporting period significantly improved to kEUR -6,010 if compared to the
        prior year period (kEUR -18,907). EBITDA margin (as % of total operating revenue) was -19% for the first half of 2020 (June 30, 2019: -103%). The positive
        development was mainly driven by revenue growth and a lower material cost ratio.

        EBITDA and EBITDA margin
         EBITDA (kEUR)                     EBITDA margin (%)            (%)
   0
                         -773                                            -20
-2000
                                                                         -40
                                                  -3,023       -2,987
-4000                                                                    -60

                                                                         -80
-6000
                                    -6,321                              -100

-8000                                                                   -120

                                                                        -140
10000
         -10,783
12000
         Q2/2019      Q3/2019       Q4/2019      Q1/2020       Q2/2020

        SLM Solutions | To the shareholders | Group interim management report | Interim consolidated financial statements and notes                            10
Depreciation for the first half of 2020 increased by 4% to kEUR 4,368 (June 30, 2019: kEUR 4,214). The operating result (EBIT) of kEUR -10,378 (June 30, 2019: kEUR -23.120) and EBIT margin of -32% (as % of total operating revenue) for the first half year 2020 improved significantly (June 30, 2019: -126%). Interest income and expenses for the first half of 2020 were kEUR -2,072 (June 30, 2019: kEUR -2,024). With income being at kEUR 2,097 (June 30, 2019: kEUR 2,110) and kEUR 25 (June 30, 2019: kEUR 86), respectively. The interest expenses are mainly related to the convertible bond issued in October 2017. Tax expense for the first half 2020 was kEUR 47 (tax expense June 30, 2019: kEUR 5,651). The main effect in 2019 here is the first-time non-recognition of the amounts exceeding the deferred tax liabilities from the deferred tax assets from the loss carryforwards. The period result after tax for the first half of 2020 was kEUR -12,498 (June 30, 2019: kEUR -30,795). This is equivalent to earnings per share (EPS) of EUR -0,63 (June 30, 2019: EUR -1,56). Financial position Cash flow from operating activities of kEUR -3,919 was negative and significantly below the previous year value (June 30, 2019: kEUR -591). The positive operating cash flow in the first half of 2019 was mainly drive by the reduction of the account receivables in the first quarter 2019 (kEUR -16,406), which is seen as one-time effect by the company. Cash flow from investment activities of kEUR -3,565 was below that for the prior year period at June 30, 2019 (kEUR -8,349). This refers pre-dominantly to investments in tangible fixed assets and development projects. Cash flow from financing activities was kEUR -2,900 (June 30, 2019: kEUR -10,280). The positive amount in the previous year is related to the capital increase in March 2019. As of June 30, 2020, cash reserves were kEUR 15,010 (June 30, 2019: kEUR 30,383). Asset situation Total balance sheet of the SLM Solutions as of June 30, 2020, was kEUR 126,969 (June 30, 2019: kEUR 154,747). Long-term assets of kEUR 63,139 were slightly below the level of the prior year period (June 30, 2019: kEUR 65,187). Fixed assets of kEUR 36,612 made up the most significant part of the long-term assets (June 30, 2019: kEUR 37,871). This primarily represents the investment in the new headquarter in Lübeck- Genin. Intangible assets, such as laser technology and capitalized development cost, amounted to kEUR 26,185 in the first half 2020 and on the same level as of the prior year period at June 30, 2019 (kEUR 25,768). The deferred tax assets were kEUR 51 (June 30, 2019: kEUR 0) and are exclusively related to the carry forwarding loss of the subsidiaries. Short-term assets of kEUR 63,558 (June 30, 2019: kEUR 89,561) as at the reporting date represent 50% of the balance sheet total (June 30, 2019: 58%). The main reason was the decrease in cash reserves to kEUR 15,010 (June 30, 2019: kEUR 30,383). In addition, inventories decreased to kEUR 27,994 and were significantly lower than in the prior year period (June 30, 2019: kEUR 37,592). Detailed information regarding working capital is listed in the Group Annex under point 8. Compared to the previous year, the company’s equity decreased to kEUR 31,485 (June 30, 2019: kEUR 62,204) as of June 30, 2020. The equity ratio was 25% (June 30, 2019: 40%). The long-term liabilities increased slightly to kEUR 74,804 (June 30, 2019: kEUR 72,481) if compared to the previous year. This is related to the increase of the provision for employee pensions and the deferred tax liabilities. This was partially offset by the repayment of the loan for the new headquarter building. Short-term liabilities of kEUR 20,407 at balance sheet date were slightly above those at June 30, 2019, of kEUR 20,062. The increase in provisions is primarily due to the reserves for warranties that can be regarded as short-term and is driven by the increase in revenue. Trade accounts payable at balance sheet date amounted to kEUR 5,856 are significantly below the prior year period (June 30, 2019: kEUR 8,213) mostly due to the improved cost of material ratio and an optimization of the purchasing processes. SLM Solutions | To the shareholders | Group interim management report | Interim consolidated financial statements and notes 11
Opportunities and risks report
The opportunities and risks classified as action relevant on page 45 and 46 in the Annual Report 2019 have been reassessed. Besides the four significant
risks listed in the annual report 2019, the business has identified one additional risk related to the COVID-19 pandemic which is seen as significant.

Declining demand caused by the COVID-19 pandemic

The ongoing COVID-19 pandemic had a significant impact on specific industries which hold a notable share of our revenues. Therefore, we experienced
a significant decline in demand, specifically within the civil aerospace as well as in the oil and gas sector. To counter measure those developments, we
intensified our sales activities in other industries. We are reviewing the development of the pandemic very closely and continuously assess measures to
minimize the impact to our business.

Loss of data through criminal activity with the aid of malware from third parties

The integrity or availability of data or systems could be put at risk by means of malware. As a result of an infection or unauthorised access by third parties
(e.g. email communication, phishing), it is conceivable that company / business data or personal data might be lost. One possible result could be that
data confidentiality could not be guaranteed. Overall, any such attack leads to a competitive disadvantage, loss of knowledge as well as to damage
to reputation and possible compensation claims. The potential level of loss is rated as serious. Various measures have been implemented by the IT
Department to mitigate the risk. Specifically, there are regular system updates and backups to save data, consistent patch management, extensive
antivirus software and foolproof monitoring of systems and data flows. The IT Department has optimised its internal processes and continues to work on
improving the systems and automating the monitoring process. It is also planned to increase staffing levels. The aim is to achieve 24-hour availability in
close collaboration with qualified external partners to enable the company to respond as quickly as possible in the event of a potential loss.

Pirate copies and breach of company’s own property rights

Newly founded companies could imitate the copyrighted name or logo of the SLM Solutions Group as well as its products. In the past, there have been
several companies set up with the name “SLM” or similar designation – particularly in Asia. SLM Solutions has also registered various patents to protect
the technology developed by the company. Competitors could also attempt to imitate the design of the product. The probability of occurrence is rated
as definitely conceivable as in the last annual report. The potential loss is rated as high and is manifested in the form of lost profit and increasing risk
of customers changing suppliers. The damage to the company’s reputation would be very noticeable. SLM Solutions has registered various patents.
Suspected breaches of copyright and patent infringements are consequent pursued.

Violation of third-party property rights

The use of technology protected by third parties, which is used unintentionally in our products, could lead to an injunction if the proprietor of the
property right is not willing to license and ultimately to impairment of the business activity or even claims for damages. A damage to the company’s
image cannot be ruled out. Increasing intellectual property rights activity can be observed in the market environment. Despite the very sensitive
handling of third-party property rights, an infringement could occur. The probability of occurrence is classified as possible. However, the impact would
be severe, so that the overall risk falls into the “material” category. Among other things, regular monitoring of competition registrations counteracts the
risk. In some cases, one can proceed against property rights that are allegedly wrongly granted. In addition, there is occasionally a willingness to license
among competitors, so that license agreements or so-called cross-license agreements can be agreed. Proceedings are being taken against allegedly
wrongly granted property rights.

Insufficient procurement of resources to fund expansion

It might be impossible to procure resources to the extent required or only on less favorable terms. The probability of occurrence is classed as possible.
However, the impact could be serious. The following measures have been initiated to counter this risk. The company was authorized at the annual
general meeting to raise capital, relationships with banks and investors are continuously cultivated and greater attention paid to the availability of liquid
assets.

SLM Solutions | To the shareholders | Group interim management report | Interim consolidated financial statements and notes                                12
Forecast
As announced by SLM Solutions on 26 March 2020, the visibility, in particular as it relates to the timing of orders, had been drastically reduced at that
time due to the dramatic global economic slow-down as a result of COVID-19. For this reason, the Management Board was unable to provide a full year
guidance in March 2020.

After a phase of a considerable slowdown during the second quarter, SLM Solutions recorded an uptake of customer activities towards the end of
the first half of 2020. So far, this trend solidified in the third quarter, providing the Company better fundamentals to assess the order-intake and there-
fore financial performance for the remainder of the year. Overall, the Company experienced a quicker rebound of activity in its Asian and US markets
compared to its European market, albeit at lower levels than before the crisis. For the second half of 2020, the Management Board expects customer
activities to increase overall and, as a result, business to pick up further.

On this basis, the Company forecasts its revenue to increase by at least 20% for total year 2020 compared to the previous year (Group revenue 2019: EUR
49.0 million). Furthermore, SLM Solutions expects Earnings before interest, taxes, depreciation and amortization (EBITDA) to improve to a level between
EUR –13 million and EUR –18 million (Group EBITDA 2019: EUR –26.0 million).

This forecast is based on the assumption that there will be no significant deterioration of the COVID-19 pandemic with extensive lockdown measures in
the Company’s key sales markets during the remainder of 2020

SLM Solutions | To the shareholders | Group interim management report | Interim consolidated financial statements and notes                             13
Group Interim Financial Statement (IFRS)
For the Period January 1, to June 30, 2020

Table of Contents
Consolidated income statement (January 1 to June 30 2020)                                                            15

Consolidated Statement of Comprehensive Income (January 1 to June 30, 2020)                                          16

Consolidated Income Statement (April 1 to June 30, 2020)                                                             17

Consolidated Statement of Comprehensive Income (April 1 to June 30, 2020)                                            18

Consolidated Balance Sheet                                                                                           19

Consolidated Cash Flow Statement (January 1 to June 30, 2020)                                                        20

Consolidated Statement of Changes in Group Equity (January 1 to June 30, 2020)                                       21

Group Annex (IFRS) for the Period January 1 to June 30, 2020

Note 1)   General Comments                                                                                           22

Note 2)   Accounting Principles                                                                                      22

Note 3)   Consolidated Companies                                                                                     23

Note 4)   Seasonal Influences on Business Activities                                                                 23
Note 5)   Segment Reporting                                                                                          23

Note 6)   Liquidity and Financial Liabilities                                                                        24

Note 7)   Equity                                                                                                     24

Note 8)   Significant Business Transactions with Related Parties                                                     25

Note 9)   Events after the Balance Sheet Date                                                                        25

Affirmation by the Legal Representatives                                                                             26

SLM Solutions | To the shareholders | Group interim management report | Interim consolidated financial statements and notes   14
Consolidated Income Statement (January 1 to June 30, 2020)

 in kEUR                                                                                          H1 / 2020         H1 / 2019         2019
 Revenue                                                                                             31,178            16,378        48,962
 Reduction/ Increase in inventories of finished goods and work-in-progress                            -1,358                  -81    -7,524
 Other work performed by the company and capitalized                                                   2,242             2,033        3,368
 Total operating revenue                                                                             32,062            18,330       44,806
 Cost of materials                                                                                   -14,011           -10,680      -20,896
 Gross profit                                                                                        18,051             7,650       23,910
 Personnel costs                                                                                     -17,405           -17,624      -31,871
 Other operating income                                                                                1,555              827         1,635
 Other operating expenses                                                                             -8,206            -9,554      -19,234
 Profit or loss from equity-accounted companies                                                           -3             -205          -442
 EBITDA                                                                                              -6,010           -18,907       -26,001
 Depreciation, amortization and impairment losses                                                     -4,368            -4,214       -8,659
 Operating profit or loss (EBIT)                                                                    -10,378           -23,120       -34.660
 Other interest income                                                                                   25                   86       176
 Interest and similar expenses                                                                        -2,097            -2,110       -4,152
 Earnings before tax (EBT)                                                                          -12,451           -25,144       -38,636
 Income tax                                                                                              -47            -5,651       -8,419
 Net profit/loss for the period                                                                     -12,498           -30,795       -47,055
 Net profit/loss for the period allocated to the owners of the parent company                        -12,498           -30,795      -47,055
 Earnings per share *in EUR                                                                            -0.63             -1.56        -2.38
 * Undiluted and diluted calculated with 19,778,953 shares

SLM Solutions | To the shareholders | Group interim management report | Interim consolidated financial statements and notes               15
Consolidated Statement of Comprehensive Income (January 1 to June 30, 2020)

 in kEUR                                                                                          H1 / 2020          H1 / 2019      2018
 Net profit / loss for the period                                                                    -12,498           -30,795    -47,055
 Income / expenses not to be reclassified to profit or loss in the future:
 Actuarial gains and losses                                                                               0                   0      -730
 Income / expenses to be reclassified to profit or loss in the future:
 Income / expenses from currency conversion                                                             -531              548        130
 Consolidated total comprehensive income                                                            -13,029           -30,247     -47,655
 Attribution of comprehensive income
 Shareholders of SLM Solutions                                                                       -13,029           -30,247    -47,655

SLM Solutions | To the shareholders | Group interim management report | Interim consolidated financial statements and notes             16
Consolidated Income Statement (April 1 to June 30, 2020)

 in kEUR                                                                                          Q2 / 2020         Q2 / 2019
 Revenue                                                                                             13,330              9,042
 Reduction/ increase in inventories of finished goods and work-in-progress                             -938              -727
 Other work performed by the company and capitalised                                                   1,219             1,059
 Total operating revenue                                                                             13,611             9,374
 Cost of materials                                                                                    -6,098            -5,180
 Gross profit                                                                                         7,514             4,194
 Personnel costs                                                                                      -7,625            -9,303
 Other operating income                                                                                 864               118
 Other operating expenses                                                                             -3,738            -5,699
 Profit or loss from equity-accounted companies                                                           -2                  -94
 EBITDA                                                                                              -2,987           -10,783
 Depreciation, amortisation and impairment losses                                                     -2,184            -2,092
 Operating profit or loss (EBIT)                                                                     -5,171           -12,875
 Other interest income                                                                                   10                    0
 Interest and similar expenses                                                                        -1,082            -1,081
 Earnings before tax (EBT)                                                                           -6,242           -13,956
 Income tax                                                                                            -156             -9,136
 Net profit/loss for the period                                                                      -6,399           -23,092
 Net profit/loss for the period allocated to the owners of the parent company                         -6,399           -23,092
 Earnings per share *in EUR                                                                            -0.32             -1.17
 * Undiluted and diluted calculated with 19,778,953 shares

SLM Solutions | To the shareholders | Group interim management report | Interim consolidated financial statements and notes         17
Consolidated statement of comprehensive income (April 1 to June 30, 2020)

 in kEUR                                                                                          Q2 / 2020         Q2 / 2019
 Net profit / loss for the period                                                                     -6,399           -23,092
 Income / expenses not to be reclassified to profit or loss in the future:
 Actuarial gains and losses                                                                               0                   0
 Income / expenses to be reclassified to profit or loss in the future:
 Income/Expenses from currency conversion                                                                64               483
 Consolidated total comprehensive income                                                             -6,335           -22,609
 Attribution of comprehensive income
 Shareholders of SLM Solutions                                                                        -6,335           -22,609

SLM Solutions | To the shareholders | Group interim management report | Interim consolidated financial statements and notes       18
Consolidated Balance Sheet
                                                                                                  June 30,          June 30,       December 31,
 in kEUR                                                                                             2020              2019              2019
 Assets
 Cash on hand                                                                                       15,010             30,383            25,523
 Accounts receivable                                                                                15,194             18,350            15,488
 Other financial assets                                                                                256                    0             345
 Inventories                                                                                        27,994             37,592            28,281
 Other non-financial assets                                                                             55                    0             475
 Current tax receivables                                                                             5,049              3,236             1,817
 Total current assets                                                                              63,558             89,561             71,929

 Intangible assets                                                                                  26,185             25,768            24,288
 Tangible fixed assets                                                                              36,612             37,871            39,136
 Companies accounted for by equity method                                                                0               908                  0
 Other assets                                                                                            3               264                  0
 Other financial assets                                                                                 92               375                525
 Other non-financial assets                                                                            193                     0            717
 Deferred tax assets                                                                                    51                     0             43
 Total non-current assets                                                                          63,139             65,187             64,708
 Total assets                                                                                     126,696            154,747            136,637

                                                                                                  June 30,          June 30,       December 31,
 in kEUR                                                                                             2020              2019              2019
 Equity and Liabilities
 Trade payables                                                                                      5,856              8,213             5,341
 Other financial liabilities                                                                         2,547              3,088             2,536
 Other non-financial liabilities                                                                     5,642              3,938             4,054
 Tax provisions                                                                                          0               106                 23
 Provisions                                                                                          5,612              4,717             5,293
 Deferred income                                                                                       751                    0               0
 Total current liabilities                                                                         20,407             20,062             17,246

 Financial liabilities                                                                              63,827             65,736            64,098
 Pensions and similar obligations                                                                    7,061              6,471             6,719
 Other non-financial liabilities                                                                     1,151                    0           1,256
 Deferred tax liabilities                                                                            2,727                    0           2,240
 Deferred income                                                                                        39               204                425
 Provisions                                                                                              0                    70            139
 Total long-term liabilities                                                                       74,804             72,481             74,877

 Subscribed share capital                                                                           19,779             19,779            19,779
 Additional paid-in capital                                                                         98,225             98,225            98,225
 Consolidated loss for the period included in retained earnings                                    -83,834            -55,077            -71,337
 Reserves                                                                                           -2,685               -723             -2,153
 Total equity                                                                                      31,485             62,204             44,514

 Equity and liabilities (total)                                                                   126,696            154,747            169,925

SLM Solutions | To the shareholders | Group interim management report | Interim consolidated financial statements and notes                    19
Consolidated Cash Flow Statement (January 1 to June 30, 2020)
in kEUR H1 / 2020 H1 / 2019 2019
Net profit / loss for the period -12,498 -30,795 -47,055
Depreciation, amortisation and impairment losses 4,368 4,456 8,659
Interest expenses 2,097 2,110 4,205
Interest income -25 -86 -176
Income tax 47 5,651 8,419
Non-cash expenses 3 205 442
Changes in assets and liabilities 2,087 18,152 28,440
Inventories 287 -829 8,482
Receivables 294 16,406 19,269
Pensions and similar obligations 342 917 1,165
Liabilities 890 -1,628 -4,500
Provisions 45 226 872
Other liabilities -1,061 1,006 3.144
Other assets and liabilities 1,290 2,053 7
Income tax paid 0 899 833
Other changes in current assets 0 0 -260
Net cash-flow from operational activities -3,919 591 3,453
Cash outflows for investments in intangible assets and property, plant and equipment -1,334 -6,132 -9,482
Investments for development costs -2,242 -2,033 -3,368
Cash outflows for investments in joint ventures 0 -200 -200
Cash outflows for investments in financial assets 0 -2 0
Interest received 12 19 36
Net cash inflow / outflow from investment activities -3,564 -8,349 -13,015
Capital injection by shareholders 0 13,000 13,000
Interest payment -2,013 -2,002 -3,368
Cash outflows for loans -220 -476 -963
Repayment of lease liabilities -666 -242 -850
Net cash flows from financing activities 2,900 10,280 7,149
Net increase (decrease) in cash and cash equivalents -10,383 2,523 -2,360
Change in financing funds due to exchange rate changes -131 74 97
Financing funds at the start of the reporting period 25,523 27,786 27,786
Financing funds at the end of the reporting period 15,010 30,383 25,523
Financing funds at the end of the period 15,010 30,383 25,523
SLM Solutions | To the shareholders | Group interim management report | Interim consolidated financial statements and notes 20Consolidated Statement of Changes in Group Equity
Consolidated
loss for
the period Foreign
included First-time exchange
Subscribed Capital in retained application equalisation Other
in kEUR capital Reserve earnings reserve reserve Reserves Total Equity
Balance as of January 1, 2019 17,981 87,023 -24,281 -632 -51 -953 79,087
First-time application of IFRS 9 and 15 365
Consolidated net result -30,795 -30,795
Changes in equity from foreign
currencies 548 548
Equity changes arising from actuarial
gains/losses 1,798 11,202 +13,000
Balance as of June 30, 2019 19,778 98,225 -55,076 -267 497 -953 62,204
Balance as of January 1, 2020 19,779 98,225 -71,337 -549 79 -1,683 44,514
Consolidated net result -12,498 -12,498
Changes in equity from foreign
-531 -531
currencies
Balance as of June 30, 2020 19,779 98,225 -83,834 -549 -452 -1,683 31,485
SLM Solutions | To the shareholders | Group interim management report | Interim consolidated financial statements and notes 21Notes to the Consolidated Annual Financial Statements (IFRS) for the period of January 1 to June 30, 2020 SLM Solutions, Lübeck Note 1) General comments SLM Solutions with its head office in Lübeck, is a publicly listed company and the ultimate parent company of the SLM Group. It is registered in the commercial register of the municipal court of Lübeck under HRB 13827. The company’s address is Estlandring 4, 23560 Lübeck, Germany. The shares of SLM Solutions (WKN A11133) have been traded on the Frankfurter Wertpapierbörse (Frankfurt Stock Exchange) since May 9, 2014, where they are quoted in the Prime Standard. The composition of the reportable segments has not changed compared to the previous year. The segment Machine Business and After Sales Business have been identified as main business areas by the board. The segment Machine Business deals with machines from the sector Selective Laser Melting together with options such as powder screening stations and other peripheral. The segment After Sales Business provides service activities, spare part sales, commodities including powder, training, and the installation of machines into account. The consolidated interim financial statement of SLM Solutions as at June 30, 2019, has been prepared in EUR. Unless otherwise stated, all amounts are given in thousand euros (kEUR). Deviations of up to one unit (kEUR, %) are due to rounding differences. In the interim financial statements, both the notes and the consolidated interim financial statements are presented in a condensed form. Note 2) Accounting Principles No changes in accounting principles The interim consolidated financial statement has been prepared in accordance with International Financial Reporting Standards (IFRS) for interim reporting as adopted by the EU and was compiled in compliance with IAS 34. The group management report was prepared in compliance with the Securities Trading Act (WpHG). In terms of scope and level of detail, the interim consolidated financial statement is not comparable with a group consolidated financial, however, it contains all necessary details as per IAS 34 and § 115 section 5, clause 2 WpHG, and shows the actual earnings, financial, and asset situation required for the interim financial statement. The accounting and valuation methods correspond essentially with those in the consolidated financial statement for the financial year 2019. A detailed description of the generally accepted accounting principles is contained in the consolidated financial statement as at December 31, 2019. The income tax expense as shown in the interim report was calculated based on the applicable tax rate currently expected. Newly implemented and changed standards Will following amended standards in interpretations were implemented since the beginning of fiscal year 2020 without having any material effect on the consolidated financial statements. Definition of a business (amendments to IFRS 3) (from 1 January 2020) Definition of “material” (amendments to IAS 1 and IAS 8) (from 1 January 2020) IFRS 17 Insurance contracts Amendments to IFRS 10 and IAS 28 Sale or contribution of assets between an investor and its associ-ate or joint venture (time of first application still open) SLM Solutions | To the shareholders | Group interim management report | Interim consolidated financial statements and notes 22
Note 3) Consolidated Companies
In addition to the parent company SLM Solutions, Lübeck, the group interim financial statement comprises the following companies:

 Name                                                                                                                                     Share in %
 SLM Solutions NA, Inc., Wixom, Michigan, USA                                                                                                     100
 SLM Solutions Singapore Pte Ltd, Singapore                                                                                                       100
 SLM Solutions Shanghai Co. Ltd., China                                                                                                           100
 SLM Solutions RUS OOO, Russia                                                                                                                    100
 SLM Solutions (India) Private Limited, India                                                                                                     100
 SLM Solutions (Italy) S.R.L, Italy                                                                                                               100
 SLM Solutions (France) SAS, France                                                                                                               100
 SLM Solutions (Canada) Ltd., Canada                                                                                                              100
 * including indirect participation through SLM Solutions Singapore Pte Ltd. of 0.1%

 The conditions of the control concept for the 3D Metal Powder GmbH entity are not fulfilled because of the shareholder resolutions which requires
unanimity. Furthermore there are negotiations about selling the company. Consequently this asset will be shown below other financial assets on June
30, 2020 (June 30, 2019: Financial assets accounted for Using the equity method).

Note 4) Seasonal influences on the business activities
SLM Solutions’s business is subject to seasonal influences so that income and operational results of the company may fluctuate from quarter to quarter.
Especially a weak fourth quarter has a strong impact on the full year result. In order to mitigate the risk of seasonal fluctuations, SLM Solutions is
enhancing the composition of customer portfolio from manufacturing companies, service centers, and research institutes. After sales business, which is
less affected by fluctuations, is in addition being expanded.

Note 5) Segment Reporting
The composition of the reportable segments has not changed compared to the previous year. The segments Machine Business and After Sales Business
have been identified as main business areas for internal reporting by the board. The segment Machine Business deals with machines from the sector
Selective Laser Melting together with options like powder screening stations and other peripheral devices. The segment After Sales Business takes
service activities, spare part sales, sales of commodities including powders, training, and the installation of machines into account.

 H1/2020                                                                                               Machine        After Sales
 in kEUR                                                                                               Business         Business               Total
 Revenue                                                                                                  23,758            7,421            31,178
 Expenses                                                                                                 -27,407           -9,780            37,187
 EBITDA                                                                                                   -3,650           -2,359             -6,010
 Depreciation                                                                                                                                  -4,368
 Interest result                                                                                                                               -2,073
 EBT                                                                                                                                         -12,451
 Income tax                                                                                                                                       -47
 Result for the period                                                                                                                       -12,498

 H1/2019                                                                                               Machine        After Sales
 in kEUR                                                                                               Business         Business               Total
 Revenue                                                                                                   9,374            7,004            16,378
 Expenses                                                                                                 -20,479          -14,805           -35,284
 EBITDA                                                                                                  -11,106           -7,801            -18,907
 Depreciation                                                                                                                                  -4,214
 Interest result                                                                                                                              -2,024
 EBT                                                                                                                                         -25,144
 Income tax                                                                                                                                    -5,651
 Result for the period                                                                                                                       -30,795

SLM Solutions | To the shareholders | Group interim management report | Interim consolidated financial statements and notes                         23
Apart from depreciation, there were no further significant non-cash expenses. The segment revenue as shown above represents sales revenue from
business with external customers.

No significant transactions were generated between the segments.

Sales by Region

 in kEUR                                                      2020                    2019
 Germany                                                      5.696                   2.760
 Asia/Pacific                                                 9.101                   5.617
 European countries (excl. Germany)                           6.253                   3.185
 United States of America                                     9.327                   4.344
 Other countries                                                 801                   712
 Total                                                       31.178                  16.618

The above revenue information relates to the location of the customer.

Note 6) Liquidity and financial liabilities
Liquidity was assured at all times in both the prior year and as at June 30, 2020. At balance sheet date, cash and cash equivalents were at kEUR 15,010. To
further enhance liquidity, the first tranche of the convertible bond 2020/2026 was issued (refer to Note 11).

Working Capital at kEUR 37,332 significantly improved compared to previous year (June 30, 2019: kEUR 47,729). Overall, the company implemented
various operational measures compared to the previous year resulting in an improved working capital intensity of 59% at balance sheet date (June 30,
2019: 82%)
                                                                                                                                 Difference
 Working capital                                                            June 30,          December 31,    June 30,      6-month            12-month
 (kEUR)                                                                        2020                 2019         2019         period              period
 Accounts receivable                                                             15,194             15,488      18,350           -294              -3,156
 Inventories                                                                     27,994             28,281      37,592           -287              -9,598
 Accounts payable                                                                -5,856              -5,341     -8,213           -516               2,357
 Total                                                                          37,332              38,428     47,729          -1,096            -10,397

Working capital intensity
         Consolidated revenue LTM (kEUR)      WC at balance sheet day (kEUR)
                                                                               (%)
           WC-Intensity (%)
89,999871
                                                                               80

                                                                 63,762
       58,395                                       59,474
59,999914             56,759                                                   60
             47,729                48,962
                          46,905
                                                        42,118
                                           38,428                      37,332 40

29,999957
                                                                               20

 0,000000
         Q2/2019      Q3/2019      Q4/2019          Q1/2020      Q2/2020

Note 7) Equity
As of June 30, 2020, the equity ratio was 25% (June 30, 2019: 40%; Dec 31, 2019: 33%) at a 13% lower balance sheet total in comparison to the preceding
year.

SLM Solutions | To the shareholders | Group interim management report | Interim consolidated financial statements and notes                             24
Earning per Share (EPS) (undiluted and diluted)
The undiluted and diluted result per share is calculated by the quotient of the net profit attributable to the share-holders of the parent company and
the average number of shares on issue during the financial year.
As in the preceding year, the diluted result corresponds to the undiluted result. The convertible bond issue may have a diluting effect, however,
currently it does not which is due to the counter-dilution effect of the negative result for the year.
June 30, 2020 June 30, 2019
Number of shares issued as at 01.01. 19,778,953 17,980,867
Number of shares issue during the financial year 0 1,798,086
Weighted average number of issued shares 19,778,953 19,778,953
Profit attributable to shareholders of the parent company in EUR -12,497,576 -30,795,203
Weighted average number of issued shares 19,778,953 19,778,953
Undiluted and diluted earnings per share in EUR -0.63 -1.56
Note 8) Significant business transactions with related parties
Related parties within the meaning of IAS 24 are those persons or parties who can be influenced by the reporting entity or who can exert influence on
the company.
The members of the Executive and Supervisory Boards of the SLM Group were identified as related persons.
Members of the Executive Board as at June 30, 2020:
Meddah Hadjar
Sam O‘Leary
Dr. Gereon W. Heinemann (until February 18, 2020)
Frank Hülsmann (until March 2, 2020
Members of the Supervisory Board as at June 30, 2019:
Hans-Joachim Ihde
Magnus René
Thomas Schweppe
Dr. Roland Busch
Kevin Czinger
Dr. Nicole Englisch (from June 2020)
No shareholder exerts direct control.
Note 9) Events after the balance sheet date
The company successfully issued the first tranche of the so-called convertible bond 2020/2026 (ISIN: DE000A289N86) with a volume of kEUR 15,000 on
July 14, 2020. The convertible was offered exclusively to existing shareholders of the company and owners of the convertible bond 2017/2022.
SLM Solutions | To the shareholders | Group interim management report | Interim consolidated financial statements and notes 25You can also read