DRAFT - 2020 Operating Budget & Capital Improvement Plan - Port of Anacortes
←
→
Page content transcription
If your browser does not render page correctly, please read the page content below
2020
Operating
Budget &
Capital
Improvement
Plan
              Por t of A n a c o r te s

 DRAFT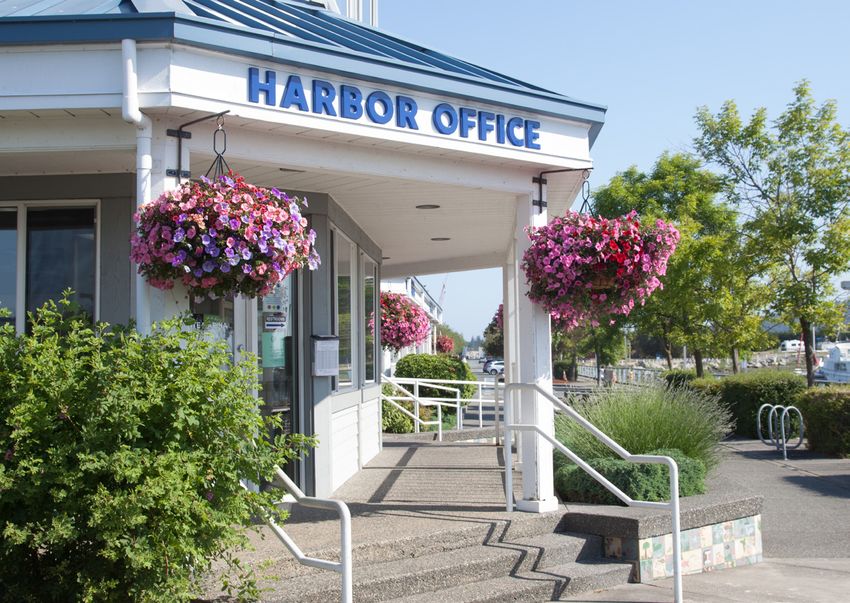
Table of Contents
Introduction Cash Flow Projections
MESSAGE FROM THE EXECUTIVE DIRECTOR 2 DEFINITIONS & ASSUMPTIONS 29
WHO WE ARE/WHAT WE DO 3 CASH FLOW PROJECTIONS 2020-2024 30
ORGANIZATIONAL CHART 4
COMMISSIONERS 5
Long-Term Debt
COMMISSIONER DISTRICT MAP 6
LONG-TERM DEBT 35
THE BUDGET PROCESS 7
Property Tax
Operating Budget TAX LEVY: TYPES & USES 37
FINANCIAL OVERVIEW 9
2020 TAX AT A GLANCE 38
2020 BUDGET SUMMARY INCOME STATEMENT 10
2020 OPERATING BUDGET AND TRENDS 11
AIRPORT 12 Supplemental Information
MARINA 14 2020 BUDGET – SUPPLEMENTAL COMPARISONS 39
MARINE TERMINAL 16
PROPERTIES 18
2020 COMBINED OPERATING BUDGET 20
Capital Improvement Plan (CIP)
OVERVIEW 22
CIP CONSOLIDATED SUMMARY 23
2020 CIP 24
2020 CAPITAL PURCHASES 28
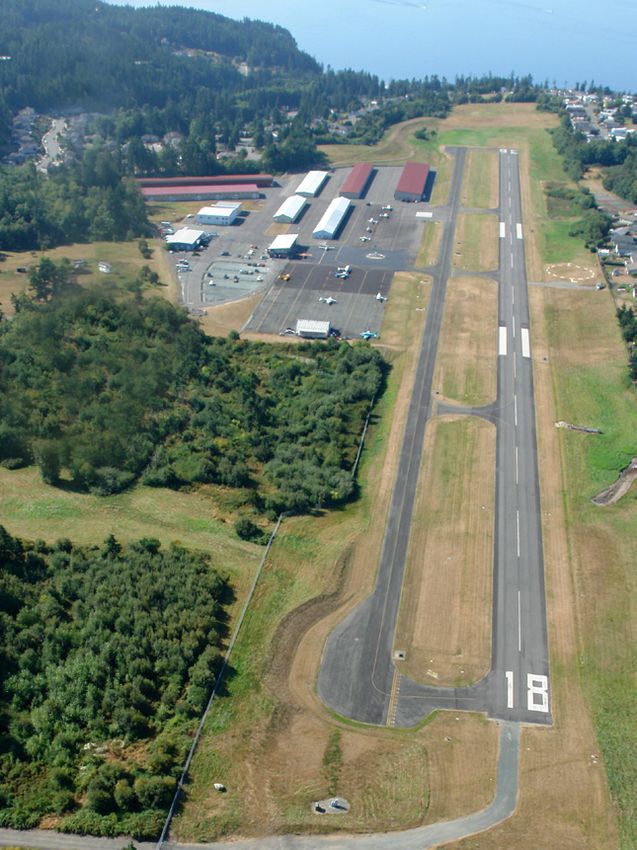
Cover Photos: (Top Left) Anacortes Airport runway aerial (Photo by Steve Berentson), (Top Right) Cap Sante Marina Harbor Office (Photo by Karla DeCamp),
(Bottom Left) Aerial view at Marine Terminal Pier 2 (Photo by Dan Crookes), (Bottom Right) Waterfront Festival Dinner at Port Transit Shed (Photo by Karla DeCamp)
1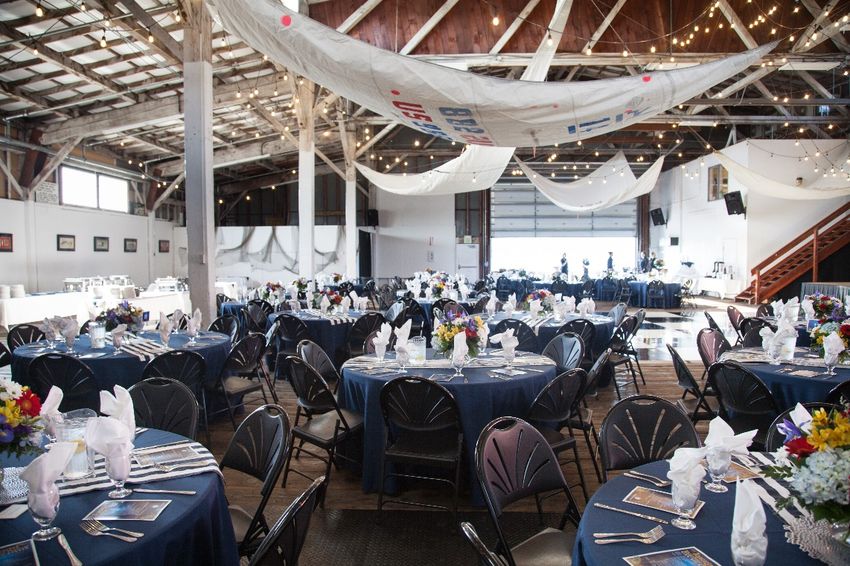
Message from the Executive Director
Message from the Executive Director

Thank you for your interest in the Port of Anacortes’ 2020 budget. The 2020 budget reflects an emphasis on providing and improving facilities that stimulate
economic development within the Port district. From our 1,000 slip Cap Sante Marina, to our deep water Marine Terminal, to our general aviation commercial
services Airport, to our Port Properties, our focus is steadily on economic development, the environment, and meeting the needs and desires of area residents in
accordance with our Mission Statement.
In 2019, the Port moved ahead with our North & West Basin Redevelopment, formed from our Transit Shed and Cap Sante Marina Redevelopment Strategy, exploring
development options in and around Cap Sante Marina and future uses of the Transit Shed. The Port has a Memorandum of Understanding with the City of Anacortes
to work collaboratively to achieve a long-range vision for the Marina Uplands, benefiting all of Anacortes and its residents, and to provide for maximizing the highest
and best uses of our Marina properties and the return of the Transit Shed to industrial marine usage. 2019 saw the formation of two advisory groups, selected from
among members of the community, to provide valued input to our redevelopment, both in the building of a new events center, and the overall redevelopment of
the north and west basin.
The Cap Sante Marina continues its growth as the premier destination marina in the Pacific Northwest. With close to 16,000 transient boater nights annually, Cap
Sante is the busiest public marina in the state. It continues to be a hub of activity and economic driver in the Anacortes community, hosting the Opening Day of
Boating Season, the NMTA Anacortes Boat & Yacht Show, the Waterfront Festival, 4th of July Rock the Dock celebration, the Summer Concert Series, and over 40
boating rendezvous. In 2019, the Port completed steel piling cathodic protection for B-Dock, electrical upgrades for the web storage lockers used by the commercial
fishing industry and continued our permitting efforts for the A-Dock recapitalization. The 2020 budget includes funding for A-Dock demolition and replacement, B-
Dock electrical upgrades, the rehabilitation of Q-Dock and planning for O-P Docks rehabilitation.
The Marine Terminal is also out-performing budgeted expectations for 2019. Petroleum coke and prilled sulfur remain the primary cargoes shipped from Pier 2, the
largest of our shipping terminal piers at the Marine Terminal. We continue to pursue other bulk product and diverse cargoes that require deep-water access. In
2019, the Port completed rub rail repairs and pre-construction efforts for corrosion repairs and cathodic protection of steel pilings at Curtis Wharf; work that will
continue into 2020. Funds for Pier 1 piling repairs round out the 2020 capital improvement budget for the Marine Terminal. Our development of the O Avenue
Laydown Area adjacent to the Marine Terminal is wrapping up and all space is spoken for.
The 2020 Properties budget includes the North & West Basin Redevelopment preliminary design and pre-construction, the South Basin parking lot improvements
pre-construction and development of the newly purchased Rockwell property site, adjacent to the Airport.
The Port is proud to be a leader in environmental stewardship. Efforts continue on three on-going environmental cleanup sites with the Washington State
Department of Ecology: the former log-pocket site adjacent to Pier 2, the uplands portion of Dakota Creek Industries, and the Quiet Cove property adjacent to Curtis
Wharf. These cleanup sites are valuable support properties to our Marine Terminal, and once completed, will provide opportunities for further expansion and job
creation. The 2020 budget includes funding for stormwater detention pond improvements at the Airport.
The Port achieves a great deal in cooperation with our valued partners, including the City of Anacortes, the Anacortes Chamber of Commerce, the Northwest Marine
Trades Association, Pacific Northwest Waterways Association, the Washington Public Ports Association, the Anacortes Waterfront Alliance, the Economic
Development Alliance of Skagit County, Port tenants, Tribes, Skagit County, the Port of Skagit and the residents of our Port district.
If you have any questions or comments regarding the Port, please call me at (360) 293-3134.
Daniel C. Worra
Executive Director

2
Who We Are/What We Do

Who We Are/What We Do
Who We Are
The Port of Anacortes is a municipal corporation of the State of Washington, created in 1926 under provision of the Revised Code of Washington
(RCW Title 53 et seq.), to provide for the development and maintenance of harbors and terminals, promote tourism and foster economic activity in
its district. With one of eight natural deep water marine terminal facilities in Washington State, its nearly 1,000 slip marina, and its roughly 80 acres
of commercial properties, the Port is instrumental to the success and economic development of the community. The Port is independent from other
local or state governments and has geographic boundaries that consist of Fidalgo, Guemes, Cypress, Sinclair, and neighboring islands, and a small
strip of land bordering Padilla Bay up to and including Samish Island.

A five-member Board of Commissioners elected for four-year terms by Port District voters governs the Port. The Commission delegates administrative
authority to an Executive Director and staff to conduct operations of the Port. The County levies and collects taxes on behalf of the Port as determined
by the Board of Commissioners and acts as treasurer for the Port as defined under RCW 53.36.010.

Industrial Development Corporation of the Port of Anacortes. The Industrial Development Corporation, a public corporation, is authorized to
facilitate the issuance of tax-exempt nonrecourse revenue bonds to finance industrial development within the corporate boundaries of the Port.
Revenue bonds issued by the Corporation are payable from revenues derived as a result of the industrial development facilities funded by the revenue
bonds. The bonds are not a liability or contingent liability of the Port or a lien on any of its properties or revenues other than industrial facilities for
which they are issued.

The Port of Anacortes’ five member Port Commission serves as the Board of Directors for the Industrial Development Corporation.

What We Do
The Port provides quality jobs, international trade connections, a strong industrial land base, and economic stability by producing revenue for state
and local services. The Port is authorized by Washington law (RCW Title 53.08) to provide and charge rentals, tariffs and other fees for docks, wharves
and similar harbor facilities, including associated storage and traffic handling facilities for waterborne commerce. The Port may also provide freight
and passenger terminals and transfer and storage facilities for other modes of transportation, including air, rail and motor vehicles. The Port may
acquire and improve lands for sale or lease for industrial or commercial purposes, and may create industrial development districts.

Mission Statement: In partnership with public agencies and private business, develop and manage facilities and services which stimulate private job
creation and commerce, while protecting the quality of life, needs and desires of area residents.

3

Organizational Chart

Organizational Chart

4
Commissioners
Commissioners

Ken Goodwin              Commission Vice-President 2019                         District 1                      Term Expires: December 31, 2021
Commissioner Goodwin was elected Port Commissioner in 2017 and began his term in January 2018. A graduate of the University of Washington,
with Bachelor’s and Master’s Degrees in Business Administration and Accounting, Mr. Goodwin's career includes 40 years as a Certified Public
Accountant, owner/operator of a chain of retail stores in remote Alaska, Director of Finance for the Alderwood Water and Wastewater District, and
Commissioner of the Woodinville Water District for 17 years. He is a Vietnam veteran and served on the Port’s Marina Advisory Committee before
becoming Commissioner. He and his wife Joyce retired to Anacortes in 2012.
Jon Petrich                Commission Secretary 2019                             District 2                     Term Expires: December 31, 2021
Commissioner Petrich was elected Port Commissioner in 2017 and began his term in January 2018. Mr. Petrich is employed as a Project Supervisor
and licensed Lead Vessel Operator at National Response Corporation (NRC). He has two Bachelor’s degrees from Eastern Washington University in
Finance and Economics. A lifelong resident of Skagit County, Mr. Petrich recently joined the Whitney PTA. He and his wife Alia enjoy time with their
family both on and off the water.
Joe Verdoes               Commissioner 2019                                  District 3                     Term Expires: December 31, 2019
Commissioner Verdoes was elected Port Commissioner in 2015 and began his first term in January 2016. Mr. Verdoes is self-employed as a Puget
Sound commercial fisherman and local businessman. He has a Bachelor's Degree in Business Administration from the University of Washington and
a Master's Degree in Developmental Studies from Deakin University, Geelong, Australia. Mr. Verdoes was a member of the Port's Marina Advisory
Committee for seven years. Before becoming a commercial fisherman in 1994, Mr. Verdoes was employed as an Economic Development Officer for
a small Australian community and operated a dairy farm in Mount Vernon. Commissioner Verdoes resides at Similk Beach.
John Pope                 Commissioner 2019                                     District 4                     Term Expires: December 31, 2019
Commissioner Pope was elected Port Commissioner in 2015 and began his term in January 2016. Mr. Pope received Bachelor of Science and Bachelor
of Science Mechanical Engineering degrees from the University of Washington, and is a Licensed Professional Engineer. He is a retired Manager of
Engineering and Maintenance spanning a 34-year career in refining. Mr. Pope is the founding president of the Anacortes Small Boat Center. He has
served on the Anacortes School Board, the Anacortes Chamber of Commerce Executive Board and the Skagit Regional Transportation Planning
Organization. He has been an active participant on steering committees for a number of outdoor trail systems on Fidalgo Island and is a longtime
member of the Anacortes Noon Kiwanis Club. His wife, Michele is retired and is active in the Anacortes Community.
Katherine “Kathy” Pittis Commission President 2019                                  District 5                      Term Expires: December 31, 2021
Commissioner Pittis was elected Port Commissioner in 2017 and began her term in January 2018. Mrs. Pittis had a 21-year career at the Port of
Anacortes, serving in various leadership roles. She currently serves as Secretary to the Washington Public Ports Association Executive Committee. She
has served on the Anacortes School Board and on numerous community and regional committees, including the Governor’s Southern Resident Killer
Whale Task Force. She is a home-educator and, along with her husband Russ, enjoys an active lifestyle including involvement with their children's
athletic and academic endeavors.
5
Commissioner District Map

    Commissioner District Map

6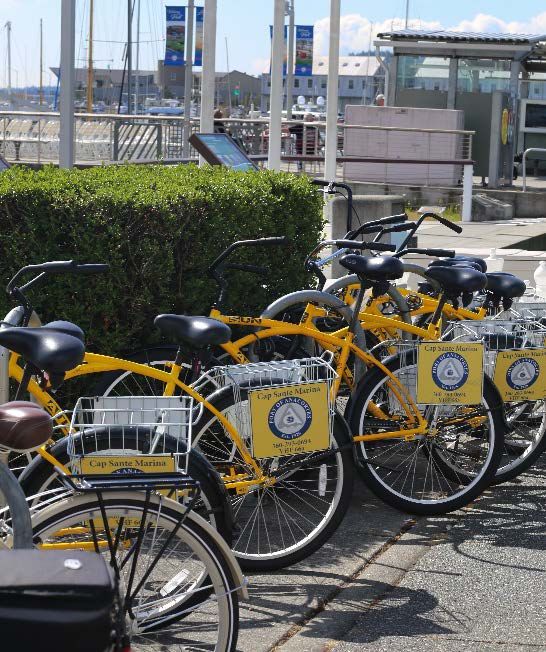
The Budget Process
The Budget Process
The budget has several major purposes. It converts the Port’s policies and plans, including its Strategic and Comprehensive plans, into services and
future capital improvement projects. It serves as a vehicle to communicate these plans to the public, and once adopted by the Commission, becomes
the work plan to be accomplished during the next fiscal year.
The annual operating and capital budgets are a forecast of expected resources and the purposeful distribution of those resources. This includes the
rate of taxation for the coming fiscal year. The 2020 operating budget was developed based on historical trends in revenue and expenses, information
from customers and tenants, market projections, and key economic and regulatory assumptions. Significant initiatives and forecast assumptions for
the Port’s four main operating areas; the Airport, the Marina, the Marine Terminal, and Properties, are detailed in the following pages. While the
Port’s current financial outlook remains positive, the potential financial impacts of economic uncertainty and volatility in local, national, and global
economics, shifts in markets (especially those affecting our local refineries), considerable capital requirements for the Port’s aging infrastructure and
development plans, and continued regulatory requirements and environmental risks remain challenging.
Citizen involvement and understanding of the budget is a major part of the review process. The Budget Calendar on the following page provides an
overview of the budget process and important dates regarding its review and adoption.
Jill R. Brownfield, CPA
Director of Finance & Administration
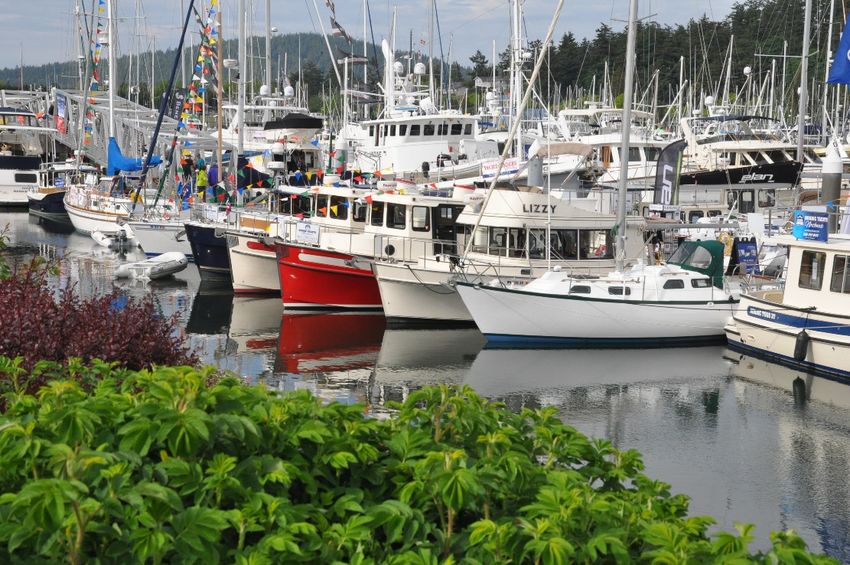
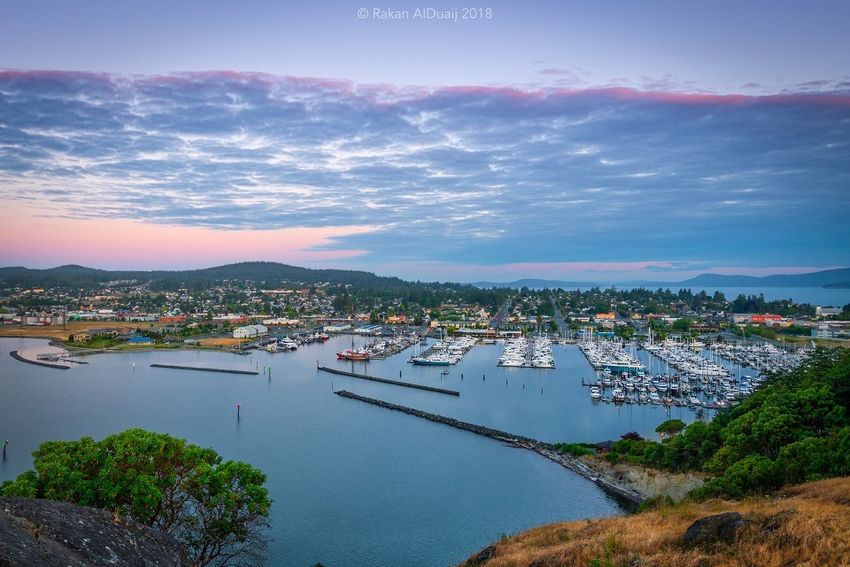
Photo: Cap Sante Marina
(Photo by Rakan AlDuaij)
7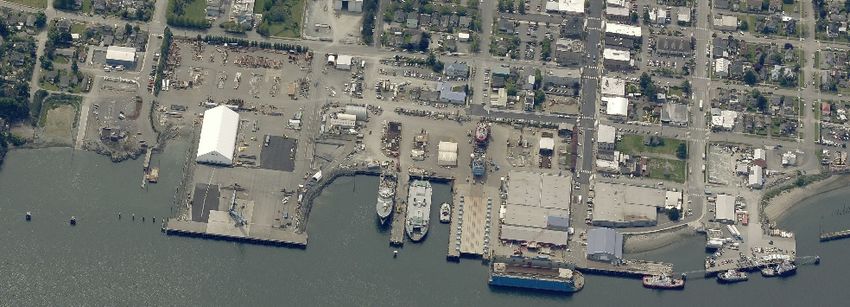
The Budget Process

                                             BUDGET CALENDAR
                                                          July
                  18    Regular Commission Meeting - 2nd Quarter Financial Results
                  19    Mid-Year Update & Budget Kick-Off
                                                            August
                    2   Departments submit draft budgets to Finance
                 5-13   Departmental budget workshops
                   15   Regular Commission Meeting
                   20   Special Commission Meeting - Budget Study Session / Preliminary Review
                   23   5 Year Draft CIP submitted to Finance
                   28   Preliminary 5 year cash flow complete
                                                         September
                   4    Directors/Managers budget workshop CIP/Cash Flow (if necessary)
                   5    Regular Commission Meeting - Tax Levy Discussion
                   6    Final 5 Year CIP and Cash Flow complete
                  19    Regular Commission Meeting - Budget Assumptions
                  20    Draft budget available to Commission
                                                            October
                    3   Special Commission Meeting - Budget Study Session
                   10   Budget revisions from Study Session complete
                   11   Preliminary budget available to public
                   17   Regular Commission Meeting
                23-24   1st public notice; budget hearing scheduled
                30-31   2nd public notice; budget hearing scheduled
                                                         November
                   7    Regular Commission Meeting - Budget Public Hearing & Adoption
                   8    Certify to County Assessor amount of taxes levied; publish final budget
                  11    Adopted budget available to public

8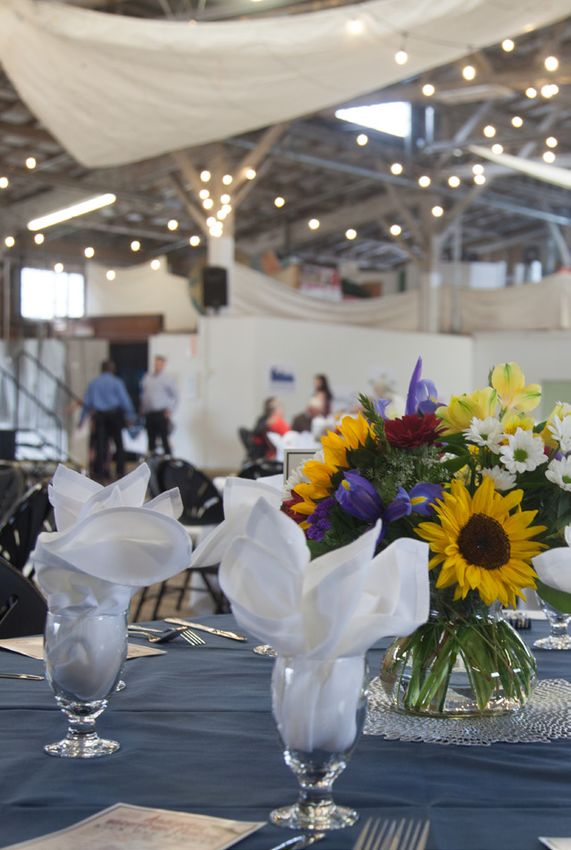
Financial Overview
Financial Overview

Revenues
The 2020 budget reflects total operating revenues of $17.861 million, an increase of approximately ten percent from the 2019 budget. While the Port
has conservatively estimated no significant new business or revenue streams, the strong economy and growth in inflation have contributed to
increased activity at the Marina, anticipated facility rate increases, and higher fuel sales. Additionally, in 2019, the Port secured a five-year agreement
for the export of petroleum coke with a minimum annual volume guarantee contributing to higher Marine Terminal revenues. Fifty-two percent of
the total projected 2020 operating revenue is from the Marina, thirty-seven percent is from the Marine Terminal, nine percent from Properties and
the remaining two percent from the Airport.

Non-operating revenues consist primarily of property tax collections. As directed by the Port Commission, property tax levies fund property
acquisition, industrial development including environmental costs, debt service for general obligation bonds, and public access improvements. The
budgeted levy of $1.588 million reflects a rate of $0.21 per $1,000 of the Port district’s preliminary total assessed value and is a 1% increase over the
prior year’s levy, exclusive of additional revenue from new construction and annexations, etc.

Expenses
Due to the factors discussed above including rising inflation and oil prices, the 2020 budget projects operating expenses of $17.284 million, a ten
percent increase from the 2019 budget. Consistent with the Port’s focus on providing safe, productive facilities with excellent customer service, the
2020 budget includes competitive wages and benefits, increased operation’s department staffing, consultant services to determine a long-term
Marine Terminal strategy, and numerous repair and maintenance projects Port-wide. Included in total operating expenses is approximately $2.177
million in depreciation, general and administrative (G&A) expenses of $2.947 million, and facilities expenses of $991,000. G&A expenses are allocated
to each operating area as a percentage of total operating expenses. Facilities expenses are allocated based on direct labor hours.

The 2020 non-operating expenses consist primarily of interest expense on general obligation bonds. The Port has two outstanding general obligation
bonds, totaling $6.505 million, which mature in 2024. Annual debt service payments in 2020 total $1.510 million.

The Port has six environmental remediation sites, three of which are completed and in post-construction monitoring. The 2020 budget anticipates
substantial progress towards remediation of its Quiet Cove and Dakota Creek Industries sites, with continuing remedial investigation of its former log
yard site. Total costs are estimated at $5.148 million; the majority of this is expected to be recovered via successful partnerships with the Washington
State Department of Ecology, other potentially liable persons, and the Port’s own historical insurance coverage.

Net Income
In conclusion, the 2020 budget reflects a net income, before environmental and capital grants of $2.163 million, very consistent with 2018 actual and
2019 budgeted results of $2.185 and $1.983 million, respectively.

9
2020 Budget Summary Income Statement

     2020 Budget Summary Income Statement
      OPERATING REVENUES
        Airport                                      $      422,024
        Marina                                            9,222,928
        Marine Terminal                                   6,623,767
        Properties                                        1,591,821

      Total Operating Revenues                           17,860,540
      OPERATING EXPENSES
        Airport                                             600,966
        Marina                                            7,698,968
        Marine Terminal                                   5,480,633
        Properties                                        1,326,229
      Total Operating Expenses                           15,106,796
      Net Operating Income Before Depreciation            2,753,744
         Total Depreciation                               2,177,200
      NET OPERATING INCOME                                 576,544
         Non-Operating Revenues                           1,886,439
         Non-Operating Expenses                            (300,420)
      NET NON-OPERATING                                   1,586,019
      Net Income Before Environmental                     2,162,563
         Environmental Grants and Recoveries              4,120,589
         Environmental Expenses                          (5,148,460)
         GASB 49 Costs Previously Accrued                 3,080,407
      NET ENVIRONMENTAL                                   2,052,536
      Capital Grants                                       352,450
      NET INCOME                                 $        4,567,549

                                                                       Photo: Lady of the Sea Statue at Seafarers’ Memorial Park (Photo by Karla DeCamp)

10
2020 Operating Budget: Revenue & Expense Trends 2020 Operating Budget and Trends 11
2020 Operating Budget: Airport

 Airport
 Overview: The Anacortes Airport serves as a vital link for postal, commercial, recreational and passenger services, primarily to the San Juan Islands.
 The Airport is also strategically located for emergency services in the case of natural disasters in and around the surrounding areas.

 Hangar rentals and fuel sales comprise the majority of Airport revenues. The Port owns and leases forty hangars. A consistent waitlist over the past
 few years indicates steady demand for this hangar space, despite statistics, which show decreasing numbers of private pilots in the United States.
 Competitive prices for AvGas and Jet A fuel spurred increased volumes in 2018. Participation in the Fly Washington Passport Program in 2019 has
 continued this trend. Fuel sales yet again are on pace to more than double the average 18,000 gallons of fuel per year the Port had experienced since
 taking over fuel sales in mid-2014.

 Building and property leases are the other major source of Airport revenue. Core tenants, most of which are in long-term lease agreements, are
 Micro AeroDynamics, Aeronautical Services, Northwest Marine Technologies, Rugby Aviation DBA San Juan Airlines, and 48 Degrees North Aviation.

 Budgeted revenues in 2020 total $422,000, an approximate ten percent increase over 2019-budgeted revenues. Major assumptions include; a 1.5
 percent Consumer Price Index (CPI) increase on long-term leases, a five percent increase on hangar rates and no vacancy, and fuel sales of
 approximately 42,000 gallons (on pace with 2019 year-to-date volumes and current prices).

 2019 Improvements and 2020 Significant Initiatives:
 In 2019, the Port, in cooperation with the FAA and WSDOT, completed fog seal improvements of its runways and taxiways consistent with the Airport
 Improvement Program. In 2020, the Port will begin pre-construction elements on maintenance and improvements to the Airport’s stormwater
 detention pond, with construction following in 2021. The detention pond, first constructed 30 years ago, will undergo sediment disposal as part of
 the required maintenance in addition to design improvements for increased capacity. Also in 2020, the Port anticipates asphalt repairs of areas
 outside the operational fence, a Part 77 Surface Survey (completed every five years) to update data relative to obstructions, and preventative
 maintenance cleaning of its underground fuel tanks.

                                      Photo: San Juan Airlines Plane (Photo by Karla DeKamp)

12
2020 Operating Budget: Airport
OPERATING REVENUES
Building & Ground Leases $ 141,529
T-Hangars 120,295
Aviation Fuel 149,800
Other 10,400
Total Operating Revenues 422,024
OPERATING EXPENSES
Aviation Fuel 140,000
Facilities & Operations 341,772
G&A Allocation 119,194
Total Operating Expenses 600,966
Net Operating Loss Before Depreciation (178,942)
Depreciation 289,385
NET OPERATING LOSS $ (468,327)
Photos: (Top) Airport Fixed Base Operator Building (Photo by Karla DeCamp), (Bottom) Fly Washington Passport
Program
132020 Operating Budget: Marina Marina Overview: Located in Fidalgo Bay and containing nearly 1,000 boat slips, Cap Sante Marina is one of the Northwest’s premier boating destinations as well as home to many local commercial fishermen, tour companies, yacht brokerage firms, and other commercial marine businesses. Proximity to the downtown corridor, exemplary customer service, competitive fuel pricing, and quality amenities result in thousands of visiting boaters from early spring to late fall each year. The Marina, in partnership with various local agencies and sponsors, hosts popular community events including Opening Day of Boating Season, the Anacortes Chamber of Commerce’s Waterfront Festival, the NMTA Anacortes Boat and Yacht Show, the Summer Concert Series, and 4th of July Rock the Dock. Events such as these draw both visitors and community members to the Marina and downtown Anacortes businesses. Moorage revenues and fuel sales comprise over ninety percent of the Marina’s total revenues. In addition to increased guest moorage revenue, the past five years have seen monthly moorage at capacity earlier and earlier in the year. The result has been waiting lists for all slip sizes from March through September, annually, with year-round waiting lists for slips over 40’ in length. Fuel sales have exceeded one million gallons in each of the last four years, with gross sales being affected year to year by volatility in oil prices. The remaining ten percent of Marina revenues consists of items such as; boat launch fees, boat trailer and recreational vehicle parking, web locker and outside gear storage rent, and retail sales. Budgeted revenues in 2020 total $9.223 million. This is an increase of about nine percent over 2019-budgeted revenues. Due to seasonality, and activity which continues to outpace projections, budget assumptions are based on the most recent twelve-month time period. Moorage revenue is budgeted to include three percent rate increases, and two to three percent volume increases. Fuel sales are budgeted at roughly 1.1 million gallons of fuel at today’s prices, recognizing that changing prices will affect both cost and gross sales and have a minimal impact on bottom line. 2019 Improvements and 2020 Significant Initiatives: By the end of 2019, the Port anticipates completion of a pier expansion at the entrance to P and Q docks for pedestrian and small boat launch users’ safety, and fiber optic installation to our fuel dock and boat launch for greater connectivity and reliability in processing transactions. Permitting and design continue on the A-Dock recapitalization project. The Port anticipates a construction timeframe beginning in 2020 and completion in 2021, pending permits. The Port also anticipates completing a project in 2020 to upgrade electrical service at B-dock, primarily used by commercial fishermen and other commercial marine businesses, and to install an additional high speed fuel dispenser at the fuel dock. The north basin docks, specifically O, P & Q docks, are the next in line for recapitalization and funds for remedial repairs in the short-term, round out the Port’s 2020 capital plans. 14
2020 Operating Budget: Marina
OPERATING REVENUES
Moorage $ 4,982,364
Fuel Dock 3,451,642
Operating Grants 14,625
Other 774,297
Total Operating Revenues 9,222,928
OPERATING EXPENSES
Wages & Benefits 1,090,008
Fuel 2,925,120
Facilities & Operations 2,182,280
G&A Allocation 1,501,560
Total Operating Expenses 7,698,968
Net Operating Income Before Depreciation 1,523,960
Depreciation 882,065
NET OPERATING INCOME $ 641,895
Photos: (Top) Anacortes Boat & Yacht Show 2019,
(Bottom Left) Central Pier Performer,
(Bottom Right) Bicycles at Cap Sante Marina Harbor
Office (Photos by Karla DeKamp)
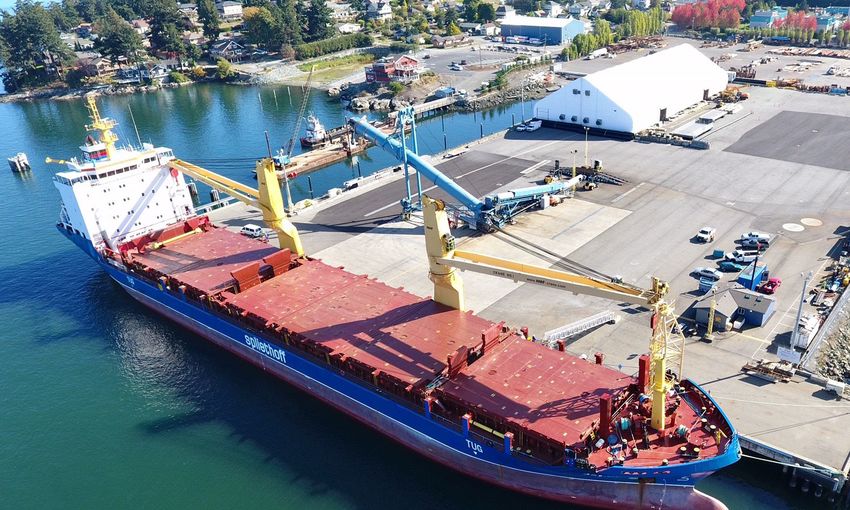
152020 Operating Budget: Marine Terminal Marine Terminal Overview: The Port’s Marine Terminal facility consists of three deep-water working piers, Pier 1, Pier 2, and Curtis Wharf. The Marine Terminal achieves its revenues through cargo shipments, short and long- term lease of dock space, other ground leases and transient dockage revenue from berthing of vessels, barges and tugboats. Pier 1 houses the Port’s historic Transit Shed, currently used as a community events center and administrative offices, as well as providing moorage for a variety of vessels. In addition, Dakota Creek Industries, a primary tenant of the Port, uses Pier 1 for its floating dry dock in support of its shipbuilding and repair operations while M&M Seafood operates a seafood processing area. Pier 2, the primary use of which is exporting dry bulk cargoes, is the most active part of the Port’s Marine Terminal. At 37 ½ feet draft, it is the Port’s deepest pier. Pier 2 has 14 acres of paved asphalt-cement surfacing, a self-contained stormwater management system, a 460-foot concrete cement frontage pier, and a stationary ship loader. Currently, the Port’s primary bulk product commodities are petroleum coke and prilled sulfur, both of which are by-products of the refining process. Curtis Wharf is a working wharf and dock providing periodic vessel moorage to a range of commercial users, including the American Spirit and American Constellation cruise ships, which visit throughout the spring, summer, and fall, as well as home to a seafood processing facility. Budgeted revenues in 2020 total $6.624 million, an increase of about thirteen percent over 2019-budgeted revenues. Bulk product shipments are estimated at 359,000 metric tons. This is 34,000 metric tons over the 2019 budget due to the new agreement for petroleum coke shipments containing a minimum annual volume guarantee. Tariff increases for other Marine Terminal activity, such as dockage, has been estimated at two percent, to be adjusted mid-year and long-term property and ground leases have been estimated using a 1.5 percent CPI increase. 2019 Improvements and 2020 Significant Initiatives: In 2019, the Port completed needed repairs to Curtis Wharf’s fender system including replacement of rub boards, ensuring continued operations and vessel safety. At Pier 2, the Port completed asphalt repairs and fog sealing on waterside surfaces as a preventative maintenance measure, and new safety ladders were installed on the face of Pier 1. Due to permitting delays, completion of the Pier 1 Piling Repairs beneath the Transit Shed warehouse as well as Phase 1 of 3 of corrosion repairs and cathodic protection of the piling at Curtis Wharf are now anticipated in 2020. Also in 2020, the Port intends to complete a Marine Terminal Modernization Feasibility Study, funded in part by a Community Economic Revitalization Board grant. The intent of this in-depth study is to both retain the current products and increase utilization of our Marine Terminal facilities. 16
2020 Operating Budget: Marine Terminal

     OPERATING REVENUES
      Terminal Services                                       $             2,075,396
      Handling                                                              3,467,375
      Ground Leases                                                           530,191
      Other                                                                   550,805
     Total Operating Revenues                                               6,623,767

     OPERATING EXPENSES
      Wages & Benefits                                                        127,208
      Longshore/Stevedoring                                                 3,463,555
      Facilities & Operations                                                 823,319
      G&A Allocation                                                        1,066,551
     Total Operating Expenses                                               5,480,633

     Net Operating Income Before Depreciation                               1,143,134

     Depreciation                                                            842,963

     NET OPERATING INCOME                                     $              300,171

 Photos: (Left) Marine Terminal aerial,
 (Right) Pier 2 Bulkhead Wall Replacement Project (Photo by Karla DeCamp)

17
2020 Operating Budget: Properties Properties Overview: Properties consists of building and ground leases not associated with the other three operating areas, rental of the Port’s Transit Shed and Seafarers’ Memorial Park Building, and revenue and expense related to Port-sponsored events. The majority of Properties’ revenues are determined by already negotiated lease rates with increases set by CPI or by a fixed rate. CPI increases in 2019 hovered around two percent. A conservative 1.5 percent CPI increase is used for 2020 budgetary purposes. The Port’s Transit Shed continues to be a popular venue, with upwards of 40 weekends in 2019 occupied by community events, fundraisers, weddings, and other celebrations. Likewise, the Seafarers’ Memorial Park Building is in use most days of the year for sailing or other marine-related classes, fundraisers, private celebrations, and Port-sponsored events such as summer concerts. Consistent rental activity along with a very modest increase in rental fees has prompted a similar budget in 2020 to that of 2019. The Port will host six events in 2020. Sponsorships, ticket sales and City Lodging Tax grant funds all combine to make these events possible with minimal impact on the Port’s overall operating budget. 2019 Improvements and 2020 Significant Initiatives: The Port purchased two new properties in 2019; the Rockwell site, consisting of nearly 7 acres of zoned light manufacturing property near the Airport, and the N Avenue/3rd Street property, near Curtis Wharf. Both were purchased as buffer properties and for long-term investment potential. The 2020 capital plan includes funds to prepare the Rockwell site for future development, while the home at N Avenue & 3rd Street is being renovated in order to relocate an existing Port tenant. Also in 2019, the Port continued North and West Basin Redevelopment planning efforts. This project, which involves repurposing the Transit Shed to a marine industrial use and moving the Port’s Events Center and Administrative Offices to the Marina’s North and West Basin, also includes an RV Park (with full amenities), establishment of a ground lease pad for potential future development including a hotel, and enhancement of waterfront public access areas. Staff, consultants, and advisory committees consisting of community stakeholders are working cooperatively to achieve 30% design by year-end. Community outreach events are ongoing and the 2020 budget anticipates completion of preliminary design and permitting elements, targeting the first phase of construction to begin in 2021. The 2011 purchase of the temporary dog park, in part, made this redevelopment project possible and the Port continues to search for the highest and best uses of all its properties. In 2019, the Port and the City worked to transition the Olson Building to the Anacortes Housing Authority for future development of workforce housing, thus freeing up Port resources to develop the back half of the Marine Supply & Hardware block into laydown storage area in support of Marine Terminal operations. Additionally, the Port’s Quiet Cove environmental site purchased in 2013, adjacent to Curtis Wharf, is currently leased to various tenants on month-to-month agreements. To fast-track economic development, the Port in cooperation with its funding partners, including Washington Department of Ecology, developed an interim action for remediation construction activities to occur in 2020. 18
2020 Operating Budget: Properties

     OPERATING REVENUES
      Property Rents                                         $               1,430,452
      Venue/Event Revenues                                                     140,375
      Operating Grants                                                          12,000
      Other                                                                      8,994
     Total Operating Revenues                                                1,591,821

     OPERATING EXPENSES
      Wages & Benefits                                                          535,642
      Facilities & Operations                                                   531,332
      G&A Allocation                                                            259,255
     Total Operating Expenses                                                1,326,229

     Net Operating Income Before Depreciation                                   265,592

     Depreciation                                                               162,787

     NET OPERATING INCOME                                    $                  102,805

 ;

                                                  Photos: (Top) Transit Shed Venue Decorated,
                        (Bottom Right) Children Enjoying Kids’ Day at Seafarers Memorial Park,
                (Bottom Left) Waterfront Festival at the Transit Shed (Photos by Karla DeCamp)

19
2020 Combined Operating Budget
2020 Combined Operating Budget
Marine
Airport Marina Terminal Properties Non-Op Totals
OPERATING REVENUES
T-Hangars $ 120,295 $ - $ - $ - $ - $ 120,295
Fuel 149,800 3,451,642 - - - 3,601,442
Moorage - 4,982,364 - - - 4,982,364
Terminal Services - - 2,075,396 - - 2,075,396
Handling - - 3,467,375 - - 3,467,375
Building & Ground Leases/Rents 141,529 - 530,191 1,430,452 - 2,102,172
Venue & Event Revenues - - - 140,375 - 140,375
Operating Grants - 14,625 - 12,000 - 26,625
Other 10,400 774,297 550,805 8,994 - 1,344,496
TOTAL OPERATING REVENUES 422,024 9,222,928 6,623,767 1,591,821 - 17,860,540
OPERATING EXPENSES
Wages & Benefits - 1,090,008 127,208 535,642 - 1,752,858
Longshore/Stevedoring - - 3,463,555 - - 3,463,555
Fuel 140,000 2,925,120 - - - 3,065,120
Facilities & Operations 341,772 2,182,280 823,319 531,332 - 3,878,703
G&A Allocations 119,194 1,501,560 1,066,551 259,255 - 2,946,560
TOTAL OPERATING EXPENSES 600,966 7,698,968 5,480,633 1,326,229 - 15,106,796
NET OPERATING INCOME (LOSS)
BEFORE DEPRECIATION (178,942) 1,523,960 1,143,134 265,592 - 2,753,744
Depreciation 289,385 882,065 842,963 162,787 - 2,177,200
NET OPERATING INCOME (LOSS) $ (468,327) $ 641,895 $ 300,171 $ 102,805 $ - $ 576,544
202020 Combined Operating Budget (continued)
Marine
Airport Marina Terminal Properties Non-Op Totals
NON-OPERATING
Revenues $ - $ - $ - $ - $ 1,886,439 $ 1,886,439
Expenses - - - - (300,420) (300,420)
NET NON-OPERATING - - - - 1,586,019 1,586,019
NET INCOME (LOSS)
BEFORE ENVIRONMENTAL (468,327) 641,895 300,171 102,805 1,586,019 2,162,563
ENVIRONMENTAL ACTIVITY
Grants and Recoveries - - - - 4,120,589 4,120,589
Expenses - - - - (5,148,460) (5,148,460)
GASB 49 Costs Previously Accrued - - - - 3,080,407 3,080,407
NET ENVIRONMENTAL ACTIVITY - - - - 2,052,536 2,052,536
Capital Grants - 276,250 - 76,200 - 352,450
NET INCOME (LOSS) $ (468,327) $ 918,145 $ 300,171 $ 179,005 $ 3,638,555 $ 4,567,549
Photo: Commissioner Kathy Pittis, Executive Director Dan
Worra, & Director of Planning, Properties, &
Environmental Brenda Treadwell with Washington State
Senator Patty Murray in Washington DC (Photo by Port
Staff)
21Capital Improvement Plan Overview Overview Port Commissioners and Staff developed the 2020 Capital Improvement Plan (CIP) through a robust scoring effort in 2019. This biennial process involves identifying all potential projects, including previously unfunded or backlogged projects, some new, and several ongoing projects. Some of the projects date back to the Port’s 2008 Comprehensive Plan. The project inventory is re-evaluated, and prioritized every other year to best meet the Port’s priorities. The 2020 CIP primarily focuses on long-term deferred maintenance across all operating areas, along with new redevelopment opportunities within the Marina and newly acquired properties. At the Airport, the Port will embark on planning efforts towards the maintenance and improvement of the stormwater detention pond. This pond, originally constructed 30 years ago requires maintenance to meet existing and future capacity needs. At the Marina, work will continue on the A-Dock Recapitalization project. First estimated to be completed by 2019, the intensive permitting process has continued to delay the project, which is now scheduled for completion in 2021. The Port also anticipates completing a project to upgrade electrical service at B-dock, primarily used by commercial fishermen and other commercial marine businesses, and to install an additional high speed fuel dispenser at the fuel dock. The north basin docks, specifically O, P & Q docks, are the next in line for recapitalization and funds for remedial repairs in the short-term, round out the Port’s 2020 capital plans at the Marina. At the Marine Terminal, permitting delays postponed the completion of the Pier 1 Piling Repairs beneath the Transit Shed warehouse as well as Phase 1 of 3 of corrosion repairs and cathodic protection of the piling at Curtis Wharf. Both are now slated for 2020. Within Properties, planning efforts continue on the North and West Basin Redevelopment project and significant investments in design and permitting are anticipated in 2020. The Port also expects to prepare the newly acquired Rockwell site for future development and begin planning for South Basin Parking Lot improvements. This parking lot development serving Port tenants, trailer boat launch customers, and the public, will increase passenger vehicle capacity, improve safety, and provide for appropriate stormwater infiltration. 2020 capital procurement primarily includes equipment purchases to replace assets at the end of their useful lives. Included in planned purchases in 2020 are new pumpout carts for Marina customers. Washington State Parks and Recreation funds are anticipated to contribute 75% towards this cost. 22
2020 CIP Consolidated Summary

 CIP Consolidated Summary
                              Prior Year(s)                                                                         TOTAL PROJECT FUNDING
                                                   Current Year        Current Year Cash   Future Year(s)
         Cost Center          Project Carry                                                                          PORT           GRANTS
                                                  Project Budget         Expenditures      Project Spend
                                Forward                                                                             Dollars         Dollars

     Airport                  $               -   $        90,000       $        90,000    $                -   $       90,000 $              -

     Marina                        5,403,284            1,732,216             5,378,500          1,757,000           5,128,500         250,000

     Marine Terminal               2,656,000                       -          1,286,000          1,370,000           1,286,000                -

     Properties                      275,000            1,275,000             1,550,000                     -        1,473,800          76,200

     Capital Procurement                      -          117,100                117,100                     -           90,850          26,250

     Total for All Projects   $    8,334,284      $     3,214,316       $     8,421,600    $     3,127,000      $    8,069,150 $       352,450

23
2020 Airport CIP
2020 CIP
Prior Year(s) Future TOTAL PROJECT FUNDING
Current Current Year
Project Year(s) PORT GRANTS
Project Title Project Type Year Project Cash
Carry Project
Budget Expenditures Source Dollars Source Dollars
Forward Spend
Airport
Stormwater
Tax
Detention Pond Facility M&R $ - $ 90,000 $ 90,000 $ - $ 90,000 --- $ -
Fund
Improvements
(Pre-Construction)
Total Airport Projects $ - $ 90,000 $ 90,000 $ - --- $ 90,000 --- $ -
Photo: Airport Fuel Island
(Photo by Karla DeCamp)
242020 Marina CIP
Prior TOTAL PROJECT FUNDING
Current Future
Year(s) Current Year PORT GRANTS
Year Year(s)
Project Title Project Type Project Cash
Project Project
Carry Expenditures Source Dollars Source Dollars
Budget Spend
Forward
A-Dock
General
Demolition & Economic
$ 85,500 $ - $ 85,500 $ - / Tax $ 85,500 --- $ -
Replacement Development
Fund
(Pre-Construction)
A-Dock
General
Demolition & Economic Skagit
5,317,784 582,216 4,143,000 1,757,000 / Tax 3,893,000 250,000
Replacement Development County
Fund
(Construction)
B-Dock Electrical General
Facility M&R - 625,000 625,000 - 625,000 --- -
Upgrades Fund
North Basin Q- General
Facility M&R - 400,000 400,000 - 400,000 --- -
Dock Float Rehab Fund
North Basin Docks
General
O-P Rehab Facility M&R - 100,000 100,000 - 100,000 --- -
Fund
(Planning)
Additional High
Speed Fuel Economic General
- 25,000 25,000 - 25,000 --- -
Dispenser Development Fund
(Pre-Construction)
Total Marina Projects $5,403,284 $1,732,216 $5,378,500 $1,757,000 --- $5,128,500 --- $ 250,000
252020 Marine Terminal CIP
Prior Year(s) Current Future TOTAL PROJECT FUNDING
Current Year
Project Year Year(s) PORT GRANTS
Project Title Project Type Cash
Carry Project Project
Expenditures Source Dollars Source Dollars
Forward Budget Spend
Curtis Wharf
Corrosion Repairs
General
and Cathodic Facility M&R $ 21,000 $ - $ 21,000 $ - $ 21,000 --- $ -
Fund
Protection system
(Pre-Construction)
Curtis Wharf
Corrosion Repairs
General
and Cathodic Facility M&R 2,055,000 - 685,000 1,370,000 685,000 --- -
Fund
Protection system
(Phase 1 of 3)
Pier 1 / MPO Health & General
580,000 - 580,000 - 580,000 --- -
Piling Repair Safety Fund
Total Marine Terminal Projects $2,656,000 $ - $1,286,000 $1,370,000 --- $1,286,000 --- $ -
Photo: Shell
Petroleum Coke
Contract Signing
(Photo by Port
Staff)
262020 Properties CIP
Prior Year(s) Future TOTAL PROJECT FUNDING
Current Current Year
Project Year(s) PORT GRANTS
Project Title Project Type Year Project Cash
Carry Project
Budget Expenditures Source Dollars Source Dollars
Forward Spend
North & West
Basin
Redevelopment Community Tax
$ 200,000 $ 875,000 $1,075,000 $ - $ 998,800 SCOG $ 76,200
(Preliminary Development Fund
Design / Pre-
Construction)
South Basin
Parking Lot Community Tax
75,000 - 75,000 - 75,000 --- -
Improvements Development Fund
(Pre-Construction)
Rockwell Site Economic Tax
- 400,000 400,000 - 400,000 --- -
Development Development Fund
Total Properties Projects $ 275,000 $1,275,000 $1,550,000 $ - --- $1,473,800 --- $ 76,200
Photos: (Left) North & West Basin
Redevelopment Advisory Committee Meeting,
(Right) Anacortes Maritime Strategic Plan Signing
with City of Anacortes Mayor Laurie Gere &
EDASC CEO John Sternlicht (Photos by Nancy
Rytand-Carey)
272020 Capital Purchases
2020 Capital Purchases
Prior TOTAL PROJECT FUNDING
Current Future
Year(s) Current Year PORT GRANTS
Year Year(s)
Project Title Project Type Project Cash
Project Project
Carry Expenditures Source Dollars Source Dollars
Budget Spend
Forward
Miscellaneous
WA
Capital Purchases
General State
within Equipment $ - $ 117,100 $ 117,100 $ - $ 90,850 $ 26,250
Fund Parks
Executive Director
& Rec
Authority
Total Capital Procurement Projects $ - $ 117,100 $ 117,100 $ - --- $ 90,850 --- $ 26,250
Photo: Weblocker Restriping (Photo by
Port Staff)
28Cash Flow Projection: Definitions & Assumptions
Definitions & Assumptions
Port Funding Sources
• General Fund: Non-restricted cash fund derived from Port operations and used for the daily operation of the Port.
• Construction Fund: Non-restricted cash fund used to collect money for future construction projects. Capital projects outlined in the Capital
Improvement Plan to be funded by the General Fund are financed with cash from this source.
• Property Sales Proceeds Fund: Restricted cash fund derived from proceeds from the sale of surplus Port properties. The Port Commission
restricts the use of this fund for property acquisition and/or industrial development.
• Environmental Fund: Non-restricted cash fund which is an accumulation of cash receipts related to cost recovery settlements with third
parties regarding environmental remediation costs. These funds are set aside to be used for current and future environmental remediation
and cleanup costs. The Port is currently teaming with the Washington State Department of Ecology on “Focus Fidalgo” which includes long-
term post-construction monitoring and clean-up of six sites in the Port District over the next few years.
• Property Tax Fund: Restricted cash fund which is an accumulation of property tax revenues received. Uses of this fund are property
acquisition, industrial development including environmental costs, debt service for general obligation bonds and public access, as established
by the Port Commission.
Estimated Cash from Operations: Estimated cash from operations is the result of Net Operating Income less Depreciation plus capitalized and
reclassified wages. Net Operating Income is the result of operations from the Port’s operating areas: Airport, Marina, Marine Terminal and Properties.
In general, these operating areas are expected to generate sufficient revenues to pay for operating costs including normal maintenance and repair,
allocation of general and administrative costs and debt service on capital projects.
Interest Earned on Investments: Interest income is budgeted conservatively for 2020. Estimated interest earnings in future years were calculated
based upon estimated average investment balances and current interest rates of less than 2%.
Operating Reserve: Operating reserve is established by Commission resolution and is currently based upon a three-month average of historical
monthly expenditures.
29Cash Flow Projections 2020-2024
Cash Flow Projections 2020-2024
Construction Property
Totals General Fund Fund Sales Proceeds Fund Environmental Fund Property Tax Fund
2020
Beginning Cash/Investment Balance $ 9,395,410 $ 5,987,209 $ 1,554,710 $ 28,289 $ 935,017 $ 890,185
Estimated Cash from Operations 2,603,198 2,603,198 - - - -
Estimated Cash from Non-Operating:
Tax Levy 1,588,000 - - - - 1,588,000
Interest Income 218,000 116,751 65,106 552 18,233 17,359
Build America Bonds Subsidy 63,439 63,439 - - - -
Other Non-Operating 17,000 17,000 - - - -
Environmental Projects & Mitigation:
Dakota Creek Shipyard Cleanup Project (952,389) (113,000) - - (839,389) -
Former Pier 2 Log Haul Out Cleanup Project (114,000) (114,000) - - - -
Quiet Cove Cleanup Project (4,011,071) (4,011,071) - - - -
Post-Construction Monitoring (Completed Sites) (66,000) (66,000) - - - -
General Environmental Legal (5,000) (5,000) - - - -
Environmental Recoveries 4,120,589 4,120,589 - - - -
Debt Service Payments (1,510,420) (1,510,420) - - - -
Interfund Loans and/or Transfers:
2010 Loan – Anthony’s Parking Lot - (22,600) - - - 22,600
2019 Loan – Property Acquisition - - 150,000 - - (150,000)
Surplus Property Sales (PY Receipts) - (10,000) - 10,000 - -
CIP Funding - (2,400,000) 2,400,000 - - -
Operating Reserve (2,892,000) (2,892,000) - - - -
Cash Available for Capital Expenditures $ 8,454,756 $ 1,764,095 $ 4,169,816 $ 38,841 $ 113,861 $ 2,368,144
2020 Comp. Plan Expenditures:
Airport Stormwater Detention Pond Improvements (90,000) - - - - (90,000)
A-Dock Demo & Replacement (4,228,500) - (4,028,500) - - (200,000)
B-Dock Electrical Upgrades (625,000) - (625,000) - - -
North Basin Q-Dock Float Rehab (400,000) - (400,000) - - -
North Basin O-P Rehab (Planning) (100,000) - (100,000) - - -
Additional High Speed Fuel Dispenser (Pre-Constr.) (25,000) - (25,000) - - -
Curtis Wharf Corrosion/Cathodic - Phase 1 (706,000) - (706,000) - - -
Pier 1/MPO Piling Repair (580,000) - (580,000) - - -
North & West Basin Redevlop. (Pre-Constr.) (1,075,000) - - - - (1,075,000)
S. Basin Parking Improvements (Pre-Constr.) (75,000) - - - - (75,000)
Rockwell Site Development (400,000) - - - - (400,000)
Capital Procurement (117,100) - (117,100) - - -
Capital Grants 352,450 - 276,250 - - 76,200
Capital Loans (Potential) 5,900,000 - 5,900,000 - - -
2020 Comp. Plan Expenditures Net $ (2,169,150) $ - $ (405,350) $ -- $ -- $ (1,763,800)
Ending Cash/Investment Balance $ 6,285,606 $ 1,764,095 $ 3,764,466 $ 38,841 $ 113,861 $ 604,344
30Cash Flow Projections 2020-2024 (continued)
Construction Property
Totals General Fund Fund Sales Proceeds Fund Environmental Fund Property Tax Fund
2021
Beginning Cash/Investment Balance $ 6,285,606 $ 1,764,095 $ 3,764,466 $ 38,841 $ 113,861 $ 604,344
Estimated Cash from Operations 3,329,736 3,329,736 - - - -
Estimated Cash from Non-Operating:
Tax Levy 1,623,880 - - - - 1,623,880
Interest Income 178,963 90,794 73,407 757 2,220 11,785
Build America Bonds Subsidy 52,873 52,873 - - - -
Other Non-Operating 17,510 17,510
Environmental Projects & Mitigation:
Dakota Creek Shipyard Cleanup Project (831,558) (715,477) - - (116,081) -
Former Pier 2 Log Haul Out Cleanup Project (125,000) (125,000) - - - -
Quiet Cove Cleanup Project (341,700) (341,700) - - - -
Post-Construction Monitoring (Completed Sites) (125,000) (125,000) - - - -
Environmental Recoveries 1,307,177 1,307,177 - - - -
Debt Service Payments (1,724,788) (1,724,788) - - - -
Interfund Loans and/or Transfers:
2010 – Anthony’s Parking Lot - (22,600) - - - 22,600
2019 – Property Acquisition - - 150,000 - - (150,000)
CIP Funding - (2,220,000) 2,220,000 - - -
Additional Operating Reserve (87,000) (87,000) - - - -
Cash Available for Comp. Plan Exp. $ 9,560,700 $ 1,200,620 $ 6,207,873 $ 39,598 $ - $ 2,112,608
2021 Comp. Plan Expenditures (7,511,000) - (4,397,030) - - (3,113,970)
Capital Grants (Potential) 840,800 - 440,800 - - 400,000
Capital Loans (Potential) 1,000,000 - - - - 1,000,000
2021 Comp. Plan Expenditures Net $ (5,670,200) $ - $ (3,956,230) $ - $ - $ (1,713,970)
Ending Cash/Investment Balance $ 3,890,500 $ 1,200,620 $ 2,251,643 $ 39,598 $ - $ 398,638
31Cash Flow Projections 2020-2024 (continued)
Construction Property
Totals General Fund Fund Sales Proceeds Fund Environmental Fund Property Tax Fund
2022
Beginning Cash/Investment Balance $ 3,890,500 $ 1,200,620 $ 2,251,643 $ 39,598 $ - $ 398,638
Estimated Cash from Operations 3,654,628 3,654,628 - - - -
Estimated Cash from Non-Operating:
Tax Levy 1,660,119 - - - - 1,660,119
Interest Income 133,955 81,503 43,907 772 - 7,773
Build America Bonds Subsidy 40,317 40,317 - - - -
Other Non-Operating 18,035 18,035 - - - -
Environmental Projects & Mitigation:
Former Pier 2 Log Haul Out Cleanup Project (2,525,000) (2,525,000) - - - -
Post-Construction Monitoring (Completed Sites) (137,000) (137,000) - - - -
Environmental Recoveries 2,647,000 2,647,000 - - - -
Debt Service Payments (1,748,363) (1,710,863) - - - (37,500)
Interfund Loans and/or Transfers:
2019 – Property Acquisition - - 150,000 - - (150,000)
CIP Funding - (1,920,000) 1,920,000 - - -
Additional Operating Reserve (89,000) (89,000) - - - -
Cash Available for Comp. Plan Exp. $ 7,545,192 $ 1,260,240 $ 4,365,550 $ 40,370 $ - $ 1,879,031
2022 Comp. Plan Expenditures (7,722,250) - (1,441,000) - - (6,281,250)
Capital Grants (Potential) 983,750 - 183,750 - - 800,000
Capital Loans (Potential) 8,375,000 - - - - 8,375,000
2022 Comp. Plan Expenditures Net $ 1,636,500 $ - $ (1,257,250) $ - $ - $ 2,893,750
Ending Cash/Investment Balance $ 9,181,692 $ 1,260,240 $ 3,108,300 $ 40,370 $ - $ 4,772,781
32Cash Flow Projections 2020-2024 (continued)
Construction Property
Totals General Fund Fund Sales Proceeds Fund Environmental Fund Property Tax Fund
2023
Beginning Cash/Investment Balance $ 9,181,692 $ 1,260,240 $ 3,108,300 $ 40,370 $ - $ 4,772,781
Estimated Cash from Operations 3,764,267 3,764,267 - - - -
Estimated Cash from Non-Operating:
Tax Levy 1,696,720 - - - - 1,696,720
Interest Income 238,869 84,401 60,612 787 - 93,069
Build America Bonds Subsidy 27,333 27,333 - - - -
Other Non-Operating 18,576 18,576 - - - -
Environmental Projects & Mitigation:
Post-Construction Monitoring (Completed Sites) (189,000) (189,000) - - - -
Environmental Recoveries 189,000 189,000 - - - -
Debt Service Payments (2,072,342) (1,699,842) - - - (372,500)
Interfund Loans and/or Transfers:
2019 – Property Acquisition - - 150,000 - - (150,000)
CIP Funding - (2,400,000) 2,400,000 - - -
Additional Operating Reserve (92,000) (92,000) - - - -
Cash Available for Comp. Plan Exp. $ 12,763,116 $ 962,976 $ 5,718,912 $ 41,157 $ - $ 6,040,070
2023 Comp. Plan Expenditures (6,075,250) - (775,000) - - (5,300,250)
Capital Procurement (4,050,000) - (4,050,000) - - -
Capital Grants (Potential) 500,000 - - - - 500,000
2023 Comp. Plan Expenditures Net $ (9,625,250) $ - $ 4,825,000) $ - $ - $ (4,800,250)
Ending Cash/Investment Balance $ 3,137,866 $ 962,976 $ 893,912 $ 41,157 $ - $ 1,239,820
33Cash Flow Projections 2020-2024 (continued)
Construction Property
Totals General Fund Fund Sales Proceeds Fund Environmental Fund Property Tax Fund
2024
Beginning Cash/Investment Balance $ 3,137,866 $ 962,976 $ 893,912 $ 41,157 $ - $ 1,239,820
Estimated Cash from Operations 3,877,195 3,877,195 - - - -
Estimated Cash from Non-Operating:
Tax Levy 1,733,687 - - - - 1,733,687
Interest Income 122,808 80,398 17,431 803 - 24,176
Build America Bonds Subsidy 13,837 13,837 - - - -
Other Non-Operating 19,134 19,134 - - - -
Environmental Projects & Mitigation:
Post-Construction Monitoring (Completed Sites) (70,000) (70,000) - - - -
Environmental Recoveries 70,000 70,000 - - - -
Debt Service Payments (2,048,965) (1,676,465) - - - (372,500)
Interfund Loans and/or Transfers:
2019 – Property Acquisition - - 150,000 - - (150,000)
CIP Funding - (2,160,000) 2,160,000 - - -
Additional Operating Reserve (95,000) (95,000) - - - -
Cash Available for Comp. Plan Exp. $ 6,760,563 $ 1,022,076 $ 3,221,344 $ 41,960 $ - $ 2,475,183
2024 Comp. Plan Expenditures (8,036,500) - (5,150,000) - - (2,886,500)
Capital Loans (Potential) 3,000,000 - 2,500,000 - - 500,000
2024 Comp. Plan Expenditures Net $ (5,036,500) $ - $ (2,650,000) $ - $ - $ (2,386,500)
Ending Cash/Investment Balance $ 1,724,063 $ 1,022,076 $ 571,344 $ 41,960 $ - $ 88,683
34Long-Term Debt
Long-Term Debt
Limited Tax General Obligation Bonds
Limited Tax General Obligation (LTGO) bonds are general obligations of the Port payable from general (ad valorem) taxes, subject to certain
constitutional and statutory limitations. The Port plans long-term debt issuance to finance its capital program based on its cash flow needs, sources
of revenue, capital construction periods and market conditions. Borrowings by the Port mature over a term that does not exceed the economic life
of the improvements that they finance.
Outstanding Limited Tax General Obligation Bonds: $6,505,000 LTGO bonds remain outstanding at December 31, 2019.
Principal Outstanding - LTGO Bonds
7,000,000
6,000,000
5,000,000
4,000,000
2010 LTGO Bonds
3,000,000 2012 LTGO Bonds
2,000,000
1,000,000
-
2019 2020 2021 2022 2023 2024
Obligation Purpose Interest Rate Final Maturity Original Issue Balance at 12/31/2019
2010 LTGO Bonds Construction 4.387% - 4.487% 2024 $ 4,500,000 $ 3,810,000
2012 LTGO Bonds Refunding 2.75% - 4.00% 2024 5,075,000 2,695,000
Total Bond Amount $ 9,575,000 $ 6,505,000
35Long-Term Debt
Indebtedness Limitation (RCW 53.36.030)
Under Washington State law the Port may incur indebtedness payable from ad valorem taxes in an amount not exceeding one-fourth of one percent
of the value of the taxable property in the district without a vote of the people. With the assent of three-fifths of the voters voting thereon, the
district may incur additional general obligation indebtedness provided the total indebtedness of the Port at any time shall not exceed three-fourths
of one percent of the value of the taxable property in the district. The following estimates the 2020 debt limit. The Port does have debt capacity to
issue additional general obligation bonds.
Value of Taxable Property (2020 Collection Year) $ 7,689,251,579
Limited Tax General Obligation Debt Capacity (Non-Voted)
0.25% of Assessed Value 19,223,129
Less: Outstanding LTGO Debt at 12/31/2019 (6,505,000)
Remaining Capacity (Non-Voted) $ 12,718,129
Revenue Bonds
Revenue bonds are obligations of the Port payable solely from the Port’s net operating revenues. The Port plans long-term debt issuance to finance
its capital program based on its cash flow needs, sources of revenue, capital construction periods and market conditions. Borrowings by the Port
mature over a term that does not exceed the economic life of the improvements that they finance.
Outstanding Revenue Bonds: Currently there are no outstanding revenue bonds.
36You can also read