SEEK LIMITED FY21 RESULTS PRESENTATION - We help people live more fulfilling and productive working lives and help organisations succeed
←
→
Page content transcription
If your browser does not render page correctly, please read the page content below

SEEK LIMITED
FY21 RESULTS
PRESENTATION
12 months to 30 June 2021

We help people live more fulfilling and productive
working lives and help organisations succeed
Today’s   1   Corporate Structure Changes

agenda    2   FY21 Group Financial Performance

          3   Asia Pacific & Americas (AP&A)

          4   SEEK Investments

          5   Strategy Update

          6   FY22 Outlook

                                               SEEK Limited FY21 Results Presentation   2
CORPORATE STRUCTURE CHANGES
New structure implemented
Capital flexibility, management alignment and greater focus

                                                                                                                SEEK Growth Fund

     Overview                            • Comprises core AP&A; and certain portfolio         • Newly created unit trust in which SEEK will initially
                                           investments, primarily Zhaopin (23.5% interest)      hold c84.5%1 of the units
                                           and SEEK’s interest in the SEEK Growth Fund        • Seeded with SEEK’s interests in OES and the majority
                                                                                                of SEEK’s existing ESV portfolio
                                                                                              • Managed by an independent management company
                                                                                                (SEEK Investments)

                                         • Led by Ian Narev and current members of the        • SEEK Investments to be led by Andrew Bassat, and
     Management
                                           AP&A Executive team (refer page 49 for detail)       the existing team transferring from the legacy SEEK
                                                                                                Investments business (refer page 50 for detail)

     Rationale                           • Enables sharper focus on significant growth        • Focuses on being an investor and business builder,
                                           opportunities within SEEK’s core businesses          partnering with emerging leaders to deliver strong
                                         • Generates cash flows that enable reinvestment in     long-term returns
                                           building competitive capability and payment of     • Facilitates greater access to capital that can be used
                                           dividends                                            to support both existing and new investments
                                         • Retains the option, but not the obligation, to     • Delivers greater independence to enable aggressive
                                           commit further capital to the SEEK Growth Fund       long-term investment decisions

1   Assumes all committed capital is fully drawn.
                                                                                                                          SEEK Limited FY21 Results Presentation   4
Overview of the new structure
SEEK Growth Fund
Assets owned and Assets owned by SEEK Growth Fund
managed by SEEK1 and managed by SEEK Investments2
SEEK ANZ SEEK Asia Online Education
Brasil Online OCC AP&A Other (formerly known as Caelum)
HR SaaS
Assets owned by SEEK and
managed by SEEK Investments2
Contingent Labour
Zhaopin3 ESVs
(plus 6 other ESVs)
1 For external reporting purposes, SEEK entities are reported within Continuing Operations and SEEK Growth Fund entities are reported within Discontinued Operations
2 SEEK to pay a management fee to SEEK Investments, the independent management company, for: (i) management of assets seeded into the SEEK Growth fund (OES & ESVs);
and (ii) management of certain assets owned by SEEK (including Zhaopin and JobAdder).
3 SEEK retains 23.5% equity accounted investment in Zhaopin.
SEEK Limited FY21 Results Presentation 5The SEEK Growth Fund
• Unit trust seeded1 with OES and 14 ESVs (majority of SEEK’s existing ESV portfolio) in exchange for units in the Fund
• Formation of new management company (SEEK Investments) led by Andrew Bassat, and the existing investment
professionals from current SEEK Investments
Fund • SEEK Investments to manage the Fund and receive management and performance fees
structure • SEEK Investments to manage certain SEEK owned assets outside of the Fund structure, mainly Zhaopin and JobAdder, and
to receive management and performance fees
• Fees structured to ensure management fees are lower than previous costs to manage the portfolio and performance fees
only accrue after certain threshold returns are achieved
• Seed assets were independently valued at A$1,215m2 in exchange for units in the Fund
o True-up mechanism exists to ensure SEEK receives fair value if subsequent capital raisings occur within 12 months that
value the seeded assets at a significant premium to A$1,215m (subject to certain thresholds)
Capital
• A further A$460m committed to the Fund, consisting of a further A$200m investment by SEEK and A$260m from other
raised investors (incl. cA$80m from Andrew Bassat and the SEEK Investments management team), to be completed on or around
1 September 2021
• Mandate similar to today, with capital raised to go towards existing and new investments in current areas of focus
• Assuming all committed capital is fully drawn, SEEK is expected to own c84.5% 3 of the Fund initially
SEEK’s • SEEK retains liquidity in the Fund via its ability to sell its units to a third party 4 and certain redemption rights every 5 yrs5
interest • The Fund expects to raise additional capital in future which will dilute SEEK’s interest further if SEEK chooses not to invest
pro rata
1 Transfer of individual assets to the Fund is subject to completion of consent (where required) and transfer processes.
2 Valuation of A$1,215m reflects the final composition of the seeded assets to be transferred from SEEK to the Fund. Valuation comprises: (1) SEEK’s 80% interest in OES of A$420m, being the mid-point of the higher of 2 independent
valuations; and (2) ESVs of A$795m, based on a valuation methodology agreed with an independent valuer. In SEEK’s 4 May 2021 ASX release an unaudited aggregate valuation of A$1,159m was disclosed for the ESVs and OES. It has
subsequently been determined that some ESVs will be retained by SEEK, and as a result, the “like-for-like” valuation at 4 May 2021 would have been A$1,106m, with the uplift to A$1,215m reflective of increased valuations.
3 Based on A$1,215m portfolio valuation of the SEEK seeded assets and completion of the transfer of those assets + A$200m SEEK capital divided by A$1,215m portfolio valuation + A$200m SEEK capital + A$260m external capital.
Ownership interest of c84.5% assumes all committed capital is fully drawn.
4 SEEK’s right to sell units is subject to customary pre-emptive rights for other unitholders, and certain other customary terms.
5 Ability to request redemption of: (1) 25% of the units received in relation to the seeded assets; and (2) up to 100% of the units received in the initial capital raise. The Fund is subject to a reasonable endeavours obligation to satisfy these
requests by seeking replacement capital for the Fund.
SEEK Limited FY21 Results Presentation 6FY21 GROUP FINANCIAL PERFORMANCE
FY21 Group Financial Results
                                                                Revenue                                                          EBITDA1                                      NPAT excl. significant items1,2

     Group                                     A$1,591m                                                             A$474m                                                          A$141m
                                                            +1% vs pcp                                                     +15% vs pcp                                                      +58% vs pcp

     Continuing
                                                        A$760m                                                           A$332m                                                             A$135m
     Operations
                                                           +17% vs pcp                                                      +30% vs pcp                                                     +68% vs pcp

Discontinued
 Operations
                                                        A$831m                                                           A$142m                                                              A$6m
                                                           (10%) vs pcp                                                      (9%) vs pcp                                                    (34%) vs pcp

Important note to SEEK’s FY21 results
• Group results are the aggregate of Continuing and Discontinued Operations (see page 40 for details), and are on a comparable basis to SEEK’s FY21 guidance
• SEEK reduced its ownership in Zhaopin from 61.1% to 23.5%, and deconsolidated Zhaopin on 30 April 2021. FY21 Group results and Discontinued Operations
  reflect 10 months consolidated Zhaopin results (FY20: 12 months)
• Group results include the impact of a change in accounting policy (reduction in FY21 EBITDA A$13m and NPAT A$7m) 1
• Further detail on significant items is provided on page 42

 1 SEEK has revised its accounting policy for upfront configuration costs incurred in implementing cloud computing arrangements in response to guidance from the International Accounting
   Standards Board in late FY21. These costs were previously capitalised and will now be expensed. Before the impact of this change, FY21 Group EBITDA was A$487m and Group Reported
   NPAT (excluding significant items) was A$148m. FY20 comparatives have been restated to account for the impact retrospectively. This change in policy was not factored into guidance as
   provided in SEEK’s 4 May 2021 ASX announcement. SEEK’s FY21 guidance was Revenue of cA$1,590m, EBITDA of cA$480m, and Reported NPAT (excluding significant items) of cA$140m.
 2 Refer page 42 for breakdown of significant items.
                                                                                                                                                                                             SEEK Limited FY21 Results Presentation   8
Profit and loss summary
FY21 vs FY20 results (A$m) Key points
Constant 1 Continuing Operations: Revenue +17%, EBITDA +30% vs pcp
Restated Growth Currency • ANZ revenue up 40% driven by job ad volumes, yield and growing depth
FY21 FY20 2 % % revenue
• SEEK Asia revenue down 2%1 and recovering but at varying rates
1 Continuing Operations across each market
Revenue 760.3 650.6 17% 21%
• EBITDA margin expansion of 5% driven by ANZ
EBITDA 332.0 255.1 30% 33%
EBITDA Margin % 44% 39% 2 Discontinued Operations: Revenue -10%, EBITDA -9% vs pcp
2 Discontinued Operations • Zhaopin revenue down 19%1 due to deconsolidation but underlying
Revenue 830.8 926.8 (10%) (7%) results steadily recovering
EBITDA 141.6 155.5 (9%) (6%) • OES revenue up 40% benefitting from COVID-19 related demand
EBITDA Margin % 17% 17% • EBITDA down due to deconsolidation impacts and strategic investment
3 SEEK Group
3 SEEK Group
• Results include the impact of an accounting policy change for cloud
Revenue 1,591.1 1,577.4 1% 5%
configuration costs2. Excluding this adjustment:
EBITDA 473.6 410.6 15% 18%
o FY21 Group EBITDA would have been A$486.7m (FY20: A$414.9m)
EBITDA Margin % 30% 26%
o FY21 Group Reported NPAT (excl. significant items 3) would have
Reported NPAT 752.2 (113.1) n/m been cA$147.5m (FY20: A$90.3m)
Significant items 611.4 (202.0) n/m • Reported NPAT excl. significant items3 benefitted from higher EBITDA
Reported NPAT excl. Sign items 140.8 88.9 58% and lower net interest, offset by higher D&A (product & tech, lease
costs)
SEEK Group results: • Reported EPS of 213.0 cents (39.9 cents excl. significant items)
• Reflect the aggregate of Continuing and Discontinued Operations and are comparable
to SEEK’s revised FY21 guidance provided in its 4 May 2021 ASX announcement 2 Dividends
• Include the impact of an accounting policy change for cloud configuration costs 2 • FY21 Final dividend of 20 cents per share, fully franked
• Total FY21 dividends of 40 cents per share, fully franked
Reported A$ results negatively impacted by A$ appreciation against major
1 Constant currency (vs pcp). currencies (primarily Chinese Renminbi and the Hong Kong Dollar)
2 Refer footnote 1 on page 8.
3 Refer page 42 for breakdown of significant items.
SEEK Limited FY21 Results Presentation 9Cash flow summary
FY21 movement in Net Debt (A$m) Key points
FY21
1 EBITDA to operating cash flow2 conversion of 94%
1 Operating cash flows (excl. interest, tax etc) 313.6
• EBITDA to cash conversion decreased due to COVID-19 impacts to
Interest, tax and transaction costs (89.5) billings in early FY21, transition to new ANZ contracts and Zhaopin
Operating Cash flows 224.1 deconsolidation3
Capex (137.9) • Conversion expected to improve
2
M&A (158.9) 2 Continued long-term investment
3 Zhaopin initial proceeds (applied to SEEK's senior debt) 437.6
• cA$84m of product & tech capex
4 Dividends paid (116.4)
• cA$54m of PP&E capex, mainly SEEK’s new HQ in Cremorne
FX and other 32.1
• cA$159m of M&A, comprising cA$14m for JobAdder (Continuing
Movement in SEEK Ltd Borrower Group 1 Net Debt 280.6
Operations) and cA$145m for ESVs (Discontinued Operations)
"Other" net cash (moved to discontinued operations) (21.4)
3 Majority of Zhaopin proceeds received
Zhaopin impacts
Operating and investing cash flows prior to deconsolidation 65.5
• cA$438m initial proceeds applied to SEEK’s senior debt
4
Reduction in net cash due to deconsolidation (353.9) 4 Dividends paid
5 Cash received but not yet distributed 308.7 • cA$116m of dividends paid in FY21 (FY20 Final & May 2021 dividend)
FX and other (2.5) Zhaopin cash received but not yet distributed
5
Movement in SEEK Group Reported Net Debt 277.0 • Transaction related cash of cA$309m (received June 2021) was
distributed in July 2021 to Hillhouse, FountainVest, and to settle
transaction costs
1 Borrower Group includes SEEK Ltd and all subsidiaries in which its ownership is at least 90%.
2 Cash flows from operating activities excluding interest, transaction costs and tax payments (Continuing Operations).
3 ANZ revenue in early FY21 was more heavily weighted to consumption of existing contracts; under the new ANZ contracts, an increased proportion of cash is received evenly across the
contract period. In Zhaopin, the majority of cash is received upfront.
4 Reduction in Zhaopin net cash due to deconsolidation: Reduction in cash and funds on deposit of cA$314m and cA$115m respectively, offset by a reduction in borrowings of cA$75m.
SEEK Limited FY21 Results Presentation 10Balance sheet summary
Net Debt (A$m) Key points
30 June 30 June
Movement 1 Borrower Group1 net debt of A$863m (30 June 2021)
2021 2020
1 • Reduced Borrower Group leverage2 due to Zhaopin transaction
1 SEEK Ltd Borrower Group Net Debt (863.3) (1,143.9) 280.6
and improved operating results (30 Jun 2021: c1.6x)
Cash 317.0 245.8 71.2 • Average tenor of debt: c2.9 years
Funds on deposit - 442.8 (442.8)
Borrowings (77.3) (466.7) 389.4 2 Group reported net debt of A$624m (30 June 2021)
Zhaopin Net Cash 239.7 221.9 17.8
• Includes Zhaopin Ltd cash of cA$309m3 received before year-
Other Net Cash - 21.4 (21.4)
end and distributed to other parties in July 2021
2 SEEK Group Reported Net Debt (623.6) (900.6) 277.0
• Adjusting for this cash, Group Net Debt was A$932m and
broadly comparable to 30 Jun 2020, however SEEK’s balance
sheet has been simplified:
o Zhaopin offshore debt (30 June 2020: cA$407m) has been
Update on Zhaopin transaction proceeds partially paid down via Zhaopin dividends and proceeds
from sell down
• SEEK to receive total gross proceeds of A$697m (A$560m net 4) o Group Net Debt now comprises cash and debt outside of
o Received cA$500m gross proceeds (cA$438m net proceeds) which local Zhaopin structure
were applied to SEEK’s senior debt
o Remaining proceeds expected in H1 225 and will be used to (1)
extinguish Zhaopin Ltd’s remaining pre-transaction debt (A$77m at
30 June 2021); and (2) pay down SEEK’s senior debt
1 Borrower Group includes SEEK Ltd and all subsidiaries in which its ownership is at least 90%.
2 Calculation of leverage for Borrower Group only includes senior debt facilities and excludes SEEK’s A$225m subordinated debt.
3 Cash proceeds of cA$309m received in late June 2021 but not yet distributed, to settle amounts owing to Hillhouse & FountainVest and to third parties for transaction costs.
4 Net proceeds of approximately A$560m having regard to transaction costs, tax and FX.
5 Certain acquirers will settle part of the transaction in RMB, the timing of the receipt of which will depend on customary administrative processes with the State Administration for
Foreign Exchange in the People’s Republic of China. SEEK Limited FY21 Results Presentation 11ASIA PACIFIC & AMERICAS (AP&A)
AP&A                                                                                           Varied recovery by market

                                                                                  v
                                                                                               • ANZ strongest with record ad volumes in H2 21

Highlights                                                                                     • Asia recovering but at a slower rate and more variable due to ongoing
                                                                                                 COVID-19 impacts

Key markets recovering
                                                                                               EBITDA benefitted from strong revenue recovery in ANZ

                                                                                  v
well from COVID-19 lows
and strategic priorities
progressing
                                                                                               Market positions remained strong, but competition is intense

                                                                                  v
                                                                                  v            Strategic priorities progressing
                                                                                               • Completed new pricing model roll-out (AU); commenced NZ roll-out
                                                                                               • Completed planning for next stage of Unification with an accelerated
                                                                                                 work program over the next 3 years
                                                                                               • Continued to deepen engagement with candidates and hirers through
                                                                                                 various product roll-outs (e.g., Certsy and ROI reporting in ANZ)
                                                                                               • Acquired c10% interest in JobsKorea1 a leading jobs platform and
                                                                                                 bought new capability with Sourcr (both August 2021)

1   SEEK invested cUS$48m for its 10% interest in JobKorea. SEEK acquired 100% interest in Sourcr for
APAC key metrics
SEEK ANZ SEEK Asia
Delivering value 16m+ c40m c30m 40m+
for candidates Candidate Profiles1 Total monthly visits3 Candidate Profiles1 Total monthly visits3
90%+ of ANZ labour force2 c10% growth vs pre COVID-19 levels c13% of labour force2 Broadly in line with pre COVID-19 levels
Delivering value c200k c160k c125k c180k
for hirers Active Unique Hirers4 Job ads on platform Active Unique Hirers4 Job ads on platform
Last 12 months FY21 monthly average Last 12 months FY21 monthly average
Highly effective
marketplaces
c20% c30% c20% c22%
Uplift in Applications5 Share of AU placements6 Uplift in Applications5 Share of placements (avg)8
Driven by AI-powered Smarter Refer page 17 for detail Driven by AI-powered Smarter Across all SEEK Asia markets
Search and Recommendations Search and Recommendations
76%
Unprompted Brand Awareness7
+2x lead vs nearest competitor
1 Searchable profiles of c11.8m (ANZ) and c24.1m (SEEK Asia) as at 30 June 2021.
2 Source data: ABS and Stats NZ (ANZ), World Bank (SEEK Asia).
3 Total visits including desktop, mobile & app. Growth represents H2 21 vs FY19 average.
4 Total number of active advertisers (posting any job ads) between 1 July 2020 and 30 June 2021. ANZ includes a significant uplift in SME hiring activity.
5 Refers to application starts per candidate (ANZ) and application starts per visit (SEEK Asia). Management estimate based on internal analysis.
6 Includes SEEK and Jora placements. Source: Independent research conducted on behalf of SEEK. Study is conducted quarterly among c3k Australians who changed / started jobs in the last 12 months.
Data are weighted to be nationally representative of the demographics of the Australian labour force with quotas set for age, gender, location and employment status but not for industry participation.
7 Source: Independent research conducted on behalf of SEEK. Study is conducted monthly among 800 Australians aged 18+ in the workforce. Data are weighted to be representative of the Australian labour
force. Results reported are based on July 2020-June 2021 data collected from c10k people.
8 Placements data based on independent SEEK Asia Placement Study (June 2021) conducted on behalf of SEEK. Sample data weighted by education.
SEEK Limited FY21 Results Presentation 14SEEK ANZ Recovery
Recovering well from COVID-19 lows
SEEK ANZ - Volume trends Detailed Insights
Job ads posted by month (‘000s) All industries have now returned to pre COVID-191 levels
250 • Strongest growth in H2 21 from Community Services &
Development, Hospitality & Tourism, Trades & Services and
Manufacturing, Transport & Logistics
200
• Professional Services slower to recover, but moved ahead
of pre COVID-19 levels in June 2021 (vs June 2019)
150
SMEs continue to lead recovery
100 • SME: volumes up c40% (FY21 vs FY191), now accounting
for 39% of job ads (FY19: 25%);
• Corporates: have returned to growth (FY21 vs FY191), with
50
strong performance in H2 21
Jul Aug Sep Oct Nov Dec Jan Feb Mar Apr May Jun
• Recruiters: activity levels improved in H2 21 and now
FY21 FY20 FY19 account for c27% of job ads (FY19: 46%)
General observations
Strong recovery across all states
• Recovery accelerated in early H2 21, peaking in March 2021 at
record volumes • Recovery in NSW & VIC slightly lagged other states due to
COVID-19 lockdowns
• Volume growth moderating but above pre COVID-19 (FY19) levels
• Regional recovery has been stronger than Metro
• Volumes in some industries impacted by longer-term lockdowns
• Candidate engagement increased however application levels
continue to remain low compared to historical trends
1 Unless stated, comparisons are to FY19 (average) given COVID-19 impacts in FY20.
SEEK Limited FY21 Results Presentation 15SEEK ANZ Performance
Strong yield and depth performance as volumes recover
Financials EBITDA
A$m Growth Higher revenue benefitted EBITDA whilst reinvestment continued
FY21 FY20 1 % • Ongoing investment in product & tech to strengthen platform, mainly
Revenue 541.0 387.2 40% in areas such as data, AI, UX and mobile
EBITDA 322.9 220.5 46%
• Reinstated annual profit share for staff (nil in FY20 due to COVID-19)
• EBITDA growth of 49%1 before the impact of cloud computing
EBITDA (%) 60% 57%
accounting policy change
Revenue Growth drivers
Revenue growth of 40% attributable to: Significant upside from aligning price to value and deepening candidate
• 8% volume increase and hirer engagement
• 15% yield increase mostly driven by customer mix2 followed by • Aligning price to value:
lower discounting3, partly offset by lower variable ad pricing o Flexible contracts now utilised by majority of customers (AU: 99%,
• 17% depth (Premium, Branded ad, Premium Talent Search etc.) NZ: 80%)
o Opportunity to better align price to the value created
Recovery led by SMEs and strong depth adoption • Deepening engagement: focus on structuring of data and leveraging
• Job ad volumes hit a record high of c250k in March 2021 AI to roll-out new value add products
• Depth revenue up 58% vs pcp and now 32% of revenue
o Premium Ad revenue up 2x on pcp, and now c7% of total ads
o Flexible contract structure enabling increased depth usage
1 SEEK has revised its accounting policy for upfront configuration costs incurred in implementing cloud computing arrangements, in response to recent guidance from the International
Accounting Standards Board in late FY21. These costs were previously capitalised and will now be expensed. The impact on SEEK ANZ’s FY21 results is A$11m at EBITDA and A$5m at
NPAT. FY20 comparative has been restated to account for the impact of the change retrospectively (cA$3m reduction in EBITDA and cA$1m reduction at NPAT).
2 Increased SME hirer activity.
3 Lower average discounts due to: (1) reduction in committed ad spend (macro related); and (2) the transition to standardised discounts for all hirers.
SEEK Limited FY21 Results Presentation 16SEEK AU Placement share
Placement share dropped but activity on the platform increased
Share of AU Placements1 (%) Activity on ANZ platform2
Last 12 months
14 Monthly Unique Visits ('m)
29.8%
13
12
11
6.9% 7.7%
3.1% 3.8% 10
1 9
Professional Social Online Aggregators SEEK
Networks Networks Classifieds (incl. JORA) 8
Note: Offline channels (including word of mouth, internal referrals, 7
Feb
Feb
Feb
Feb
Dec
Dec
Dec
Jan
Dec
Jan
Jan
Jan
Nov
Nov
Nov
Nov
Jun
Jun
Jun
Jun
Oct
Oct
Oct
Oct
Jul
Jul
Jul
Jul
Aug
Aug
Aug
Aug
Sep
May
Sep
May
Sep
May
Sep
May
Mar
Mar
Mar
Mar
Apr
Apr
Apr
Apr
noticeboards, etc) accounted for a combined 28% of placements FY18 FY19 FY20 FY21
FY18 FY19 FY20
FY20 FY21
Monthly Unique Hirers ('000s)
Platform metrics remain extremely strong 60
• Hirers and traffic metrics (refer RHS charts) are both at or near record 50
highs in H2 21
40
However, SEEK’s placement share fell in an unusual market
• COVID-19 has significantly impacted role mix and candidate behaviour 30
• In a short labour market, hirers have an incentive to try multiple channels
20
• Placements in the market shifted to lower skilled roles with Facebook a
beneficiary (placements up from January 2020: 3.4% to July 2021: 6.3%) 10
• LinkedIn saw some benefit from higher use of social platforms during
COVID-19 0
Feb
Feb
Feb
Feb
Dec
Dec
Dec
Dec
Jan
Jan
Nov
Nov
Nov
Jan
Nov
Jan
Jun
Jun
Jun
Jun
Oct
Oct
Oct
Oct
Aug
Aug
Aug
Aug
Jul
Jul
Jul
Jul
Sep
Sep
Sep
Sep
Mar
May
May
Mar
Mar
May
Mar
May
Apr
Apr
Apr
Apr
FY18 FY19 FY20 FY21
FY18 FY19 FY20 FY21
1 IncludesSEEK and Jora placements. Source: Independent research conducted on behalf of SEEK. Study is conducted quarterly among c3k Australians who changed / started jobs in the last 12 months.
Data are weighted to be nationally representative of the demographics of the Australian labour force with quotas set for age, gender, location and employment status but not for industry participation.
2 MonthlyUnique Hirers refers to the number of unique hirers who posted an ad (via SEEK’s Advertiser Centre or indirectly).
SEEK Limited FY21 Results Presentation 17SEEK Asia Recovery
Variable recovery - strongest in key markets
SEEK Asia - Volume trends Key insights by market
Job ads volumes by month (% growth vs FY19)
Hong Kong
40%
• Strong recovery with acceleration in Q4 FY21 driven by
20% Corporates and SMEs
• Stronger recovery in Engineering / Architecture, Property, IT &
0%
Finance industries; ad volumes now higher than pre COVID-19
- 20% • Economic indicators trending positive
Malaysia
- 40%
• Volumes steadily recovering however some volatility in SME due
- 60% to continued COVID-19 lockdowns
• Improving GDP indicators across Manufacturing & Services and
- 80%
Agriculture
Oct- 19
Oct- 20
Apr- 20
Apr- 21
Jan- 20
Feb- 20
Jan- 21
Feb- 21
Aug- 19
Aug- 20
Dec- 19
Jul- 20
Dec- 20
Jul- 19
May- 20
Sep- 20
Jun- 20
Jun- 21
Sep- 19
Nov- 19
Mar- 20
Nov- 20
May- 21
Mar- 21
Singapore
HK MY SG ID PH TH • Corporate-led recovery driven by lower levels of COVID-19
restrictions and improving economic conditions
General observations Developing Markets
• Job volumes recovering, but to varying degrees by market • Philippines: recovery more volatile due to high rates of COVID-19
• Rates of recovery correlated to COVID-19 restrictions infections and restrictions
o Stronger growth from Hong Kong, Singapore and Malaysia • Thailand: positive recovery but COVID-19 3rd wave impacted
o Developing markets continue to be impacted by lockdowns economic conditions in Q4 FY21
• Positive momentum from SMEs, however they tend to be more • Indonesia: showed signs of recovery but impacted by recent
sensitive to prolonged lockdowns wave of COVID-19
SEEK Limited FY21 Results Presentation 18SEEK Asia Performance
Strong yield performance as markets gradually recover
Financials EBITDA
Constant
A$m Growth Currency EBITDA impacted by lower revenue and increased re-investment
SEEK Reported FY21 FY20 % % • Increase in product & tech investment to roll out several new products
Revenue 145.6 162.9 (11%) (2%)
• Reinstated annual profit share for staff (nil in FY20 due to COVID-19)
EBITDA 47.4 72.8 (35%) (27%)
• Brand refresh and increased marketing spend supporting an
EBITDA (%) 33% 45%
improvement in traffic and candidate engagement
Revenue Growth drivers
Revenue decline (constant currency) of 2% attributable to: Opportunity to build on strong placement share but requires ongoing
• (9%) volume decline investment
• 10% yield increase driven by country & customer mix • Strong competitive positions, average placement share of 22% 2
• (1%) depth1 decline (Branded Ad, Talent Search etc.) • Market opportunity much larger than SEEK ANZ
• (2%) decline in non-core revenue streams • Investment required to unlock opportunity, with SEEK Asia to benefit
from acceleration of unification program (refer page 30)
Recovery from COVID-19 has varied by market o Unified platform will deliver scale and efficiency benefits
• Singapore has recovery strongly (+12% vs pcp) followed by Hong • Expect SEEK Asia to continue to invest aggressively in marketing to
Kong and Malaysia with developing markets remaining weaker grow market share across the region
• Depth now 19% of revenue (FY20: 18%)
1 Defined as non-basic job ad revenue (e.g. Stand Out /Branded ads and Talent Search, etc.).
2 Placements data based on independent SEEK Asia Placement Study (June 2021) conducted on behalf of SEEK. Sample data weighted by education.
SEEK Limited FY21 Results Presentation 19LatAm Performance
Focussed on re-building sustainable businesses despite COVID-19 challenges
Brasil Online Key insights
Markets remain significantly impacted by COVID-19
BRLm Growth • Both among the world’s most severely impacted countries
Pro Forma FY21 FY20 % o Brasil Online: Revenue remains suppressed and new business model roll-
Revenue 122.5 154.0 (20%) out delayed. cA$20m impairment charge (post-tax) recognised in SEEK’s
EBITDA (4.7) 17.3 (127%) FY21 results
EBITDA (%) (4%) 11% o OCC: Despite weak economic conditions, billings grew strongly in H2 21
EBITDA A$m (100%) (1.1) 5.8 n/m
Strategy in place to re-build sustainable businesses
• Focussing on a range of initiatives including:
o Brasil Online: Evolving B2C offering
o OCC: Leveraging SEEK ANZ capability to evolve product set and grow
OCC Mundial
value proposition
Improved performance will require time and successful execution
MXNm Growth
• Large markets with a combined labour force of c150m1 people
Pro Forma (100% basis) FY21 FY20 %
Revenue 297.8 340.3 (12%) • Leveraged to an improvement in macro conditions
EBITDA 37.8 97.5 (61%) • Strong relative market positions, especially in Mexico
EBITDA (%) 13% 29% • Both businesses were self-funding in FY21
o Brasil may require a small capital injection in FY22 to support roll-out of
EBITDA A$m (100%) 2.4 7.2 (67%) new model
1 Source: World Bank data.
SEEK Limited FY21 Results Presentation 20SEEK INVESTMENTS
Zhaopin Performance
 Steadily recovering after the impact of the pandemic, however competition remains intense

                                                Financials                                                                                                            Key drivers of result

                                                                           RMBm                      Growth                   Online and adjacent revenue both showing steady recovery
Pro Forma (100% basis)                                              FY21             FY20                %                    • Online billings growing faster than realised revenue
    Online Revenue                                                 1,982.1          2,017.7             (2%)                     o Online billings +34% in H2 21 vs pcp (+6% on H1 21)
    Adjacent Services Revenue                                      1,525.7          1,531.3             (0%)                  • Improving online revenue trends: +9% in H2 21 vs pcp (+4% on H1 21)
  Revenue                                                          3,507.8          3,549.0             (1%)                  • Adjacent services benefitting from online migration
  EBITDA                                                            653.5            587.2              11%                      o Adjacent services (excl. BPO) +28% vs FY20
  EBITDA (%)                                                        19%              17%                                         o BPO reported (gross) revenue decreased c20% due to the change in
                                                                                                                                    revenue recognition1
SEEK Reported EBITDA A$m (100%)                                      98.7           123.7              (20%)
                                                                                                                              Operating efficiencies offset by investment in product & tech
                  SEEK Reported EBITDA reflects Zhaopin deconsolidation on 30 April 2021                                      • Realised operating efficiencies in FY21
                                  (FY21: 10 months, FY20: 12 months)
                                                                                                                              • Investing in data & AI capability to improve search and match outcomes

                                         Operating metrics                                                                                                                  Growth drivers

Improving signs in hirer metrics                                                                                              Significant addressable market however competition is intense
• Active hirers on platform flat vs pcp2, with improving momentum in                                                          • Competition is intense, requiring ongoing re-investment to evolve the
  Q4 FY21 vs Q3 FY21                                                                                                             product offerings and grow market share
• Job ads on platform up c8% vs pcp3                                                                                          • New ownership structure expected to support Zhaopin’s long term
                                                                                                                                 growth
Growth in candidate metrics
• Completed resumes up 11% vs pcp2
• Average monthly unique visitors up 7% vs pcp2,4, now at record levels
  and a lead of 1.5x vs nearest competitor

 1 As a result of changes in contract terms, in FY21 some of Zhaopin’s BPO Services are transitioning from Gross Revenue to Net Revenue recognition. Zhaopin’s BPO service offerings attract
  varying GP margins, all of which are low. The accounting change does not impact EBITDA.
 2 Metric relates to Q4 FY21 vs Q4 FY20.
 3 Relates to job ads on platform as at 30 June 2021 vs 30 June 2020.
 4 Data relating to monthly Unique visitors (desktop and mobile) sourced from Questmobile.                                                                                                     SEEK Limited FY21 Results Presentation   22
OES Performance
Benefitted from significant uplift in COVID-19 related demand for online education
Financials Operational insights
A$m Growth OES continues to deliver world class student outcomes
Pro Forma (100% basis) FY21 FY20 % • 16k+ students across 6 university partners (AU & UK)2
Revenue 190.7 136.6 40% • Student satisfaction scores of c88%3
EBITDA 45.5 34.8 31% • Global footprint, delivering OPM (Online Program Management) and
EBITDA (%) 24% 25% online content services to partners in AU, US, NZ, UK and mainland
Europe
Key drivers of result Growth drivers
Revenue growth of 40% vs pcp Positioned well for growth across four key drivers
• Under grad grew c16% (vs pcp) despite AU funding caps • Unique expertise, strong brand and a global footprint
o COVID-19 increased demand (higher enrolments & study loads) • Expect an aggressive investment bias to scale opportunities across
• Post grad partnerships (QUT, new Monash contract) delivered end-to-end OPM and customised education solutions
meaningful growth as they continue to scale • Opportunities to unlock international growth but requires significant
• Increased adoption of unbundled services (via OES & Construct)1 investment
As expected EBITDA margin declined as OES invests for growth
Growth drivers
• EBITDA benefitted from revenue growth
• EBITDA margin declined as OES invested to scale new partnerships
(e.g. Monash) and unbundled service offerings 1 2 3 4
Post grad Under grad Short & Unbundled
OPM Services OPM Services Micro-courses Services1
1 Unbundled Services relates to customised education solutions, including certain elements of full OPM Services. OES acquired a controlling interest in Construct Education (November 2020),
a designer and developer of online education with a presence in the US, UK and mainland Europe.
2 Total current students: Swinburne Online, WSU, QUT, Monash & UK partnerships.
3 Metrics relate to Swinburne Online (UG). Source: QILT Student Experience Survey (SES) data. Student satisfaction scores based on teaching quality & student support.
SEEK Limited FY21 Results Presentation 23ESVs - Online Education
Benefitting from structural shifts to online learning
Online Program Management & Online Education Marketplaces
Higher Education / Distribution
1
Investments in
emerging leaders (formerly known as Caelum)
Australia, US, NZ, UK Latin America Latin America Latin America UK, Europe & Australia Global
and Europe
Serving an • Partnering with universities to • Online university • Providing career- • Enabling partners to reach new students
important need bring content online and expand offering high-quality relevant IT (incl. (global and local) and providing learners with
student access to high-quality education for Spanish coding) courses access to global career-relevant education
online education speaking students (short courses through to degrees)
Portfolio metrics • 70k+ students / learners • 90m+ students / learners
• c60% student growth vs pcp • c25% student growth vs pcp
• 400+ education partners
Levers of growth • Grow number of courses in current specialisations
• Evolve product offerings (e.g., short courses, micro credentials and “stackable” degrees)
Accessing a Global
TAM of A$50b+2 • Expand product offerings (e.g., post grad, learning design solutions and managed services)
• Pursue new partnerships & new geographies
49% ‘look-through’3 revenue growth (vs pcp)
1 OES is one of SEEK’s more mature Online Education investments and is reported separately to SEEK’s Online Education ESVs.
2 Online Education TAM = Enterprise Training opportunity of cA$50b + MOOCs/Online Short Courses/Online Program Management of cA$5b+. Source: Internal management analysis
supported by external market studies.
3 ‘Look-through’ share represents net revenue of investments multiplied by SEEK’s ownership interest (based on comparable ownership interest across FY20 & FY21). FY21 ‘Look-through’
revenue on a net basis for the entire ESV portfolio (Online Education + HR SaaS + Contingent Labour) was A$112m, growth of 50% vs FY20. FY21 ‘Look-through’ revenue on a gross basis for
the entire ESV portfolio was A$276m, growth of 57% vs FY20. Excludes OES & Coursera. SEEK Limited FY21 Results Presentation 24ESVs - HR SaaS
Utilising technology to solve complex HR problems for organisations
Investments in 2
emerging leaders
Australia, Asia, UK & US Australia, NZ, UK & US Australia, NZ, UK & SE Asia Israel, UK, Europe & US
• A leading digital learning • A talent acquisition suite • A HR Information System • A HR Information System
Serving an
platform enabling that simplifies the hiring that helps SMEs to easily tailored to mid-sized
important need
organisations to source, process for recruiters and manage HR, payroll and businesses, with a focus on
curate, deliver and track corporate talent acquisition employee benefits employee experience
employee training teams
Portfolio metrics • >90% recurring revenue
• c10k customers growing at c45%
• >100% net revenue retention (i.e., value from upselling more than offsets value from churned customers)
• Strong unit economics driven by effective customer acquisition and low churn
Levers of growth • Adding new customers (replacing manual solutions with HR Software, winning share from legacy providers)
Accessing a Global • Growing customer value through innovation (e.g., new modules, upsell, cross-sell)
TAM of A$55b+1 • Pursuing new partnerships & new geographies
51% ‘look-through’3 revenue growth (vs pcp)
1 HR SaaS TAM includes both Talent Acquisition software (e.g. JobAdder) and Talent Management software (e.g. GO1, Employment Hero, Hibob). Source: Internal management analysis
supported by external data.
2 JobAdder will not be transferred into the newly created SEEK Growth Fund, and will be retained by SEEK.
3 ‘Look-through’ share represents net revenue of investments multiplied by SEEK’s ownership interest (based on comparable ownership interest across FY20 & FY21).
SEEK Limited FY21 Results Presentation 25ESVs - Contingent labour platforms
Tech-driven platforms driving efficiencies in the growing temporary labour market
Investments in
emerging leaders
Europe & Latin America Australia & NZ UK Latin America & SE Asia
Serving an important • A tech-enabled staffing • A tech-enabled • A tech-enabled marketplace • A tech-enabled marketplace
need marketplace connecting pre- marketplace providing pre- connecting pre-qualified connecting businesses with
qualified workers to medium- qualified shift-based nurses and care workers with freelancers that work in IT,
to-long term assignments, workers to employers and clients in the Social Care programming, design and
providing reliable work to a reliable work to a large industry looking to fill shifts content writing
large labour pool labour pool
Portfolio metrics • Overall strong net revenue growth despite COVID-19 impacts
• Businesses continue to scale and expand into new industry verticals
Levers of growth • Pursuing new industry verticals & new geographies
• Adding new customers (including through new channels)
Accessing a TAM of
• Driving greater usage from existing customers (including new product features)
A$20b+ across AP&A
and Europe1
57% ‘look-through’2 revenue growth (vs pcp)
1 Contingent Labour TAM includes net revenue of non-permanent labour across AP&A Geographies and Europe. Source: Internal management analysis supported by external market studies.
2 ‘Look-through’ share represents net revenue of investments multiplied by SEEK’s ownership interest (based on comparable ownership interest across FY20 & FY21).
SEEK Limited FY21 Results Presentation 26STRATEGY UPDATE
SEEK’s growth drivers

                    Significant growth opportunities in                          Organic growth the focus, but
                   our core businesses (ANZ and Asia)                                 will consider M&A

 Underlying economic         Enrichment and                                            M&A to enhance
 growth and offline to    expansion of products              Aligning price           capabilities and/or
   online migration         including through           to the value we create         create options in
        (Asia)                 unique data                                            new revenue pools

              We have the opportunity to double revenue in
                our core business over the next 5 years
                  (if we execute well and markets are stable)

                                                                                        SEEK Limited FY21 Results Presentation   28
Strategic focus areas
Investing in four core capabilities
Focus areas Objectives Progress
Scalable, reliable • Consolidate to one flexible platform to provide • Unified search platforms in March 2021 and
and safe platforms scale efficiencies, enable rapid innovation and recommendation platform August 2021
improve reliability and security • Commenced Unification (see next page for further
details)
Strong brand • Maintain ANZ brand strength • Maintained relative brand strength in ANZ
presence • Reinvigorate brands in Asia and add sales • Increased brand investment across Asia
capability in Indonesia
Data capture, • Apply structured and unstructured data to • SEEK Profiles now shared in job applications
analysis and continuously add ‘intelligence’ to the platform • Talent Search Connect launched, better integrating
application • Combine local know-how with greater scale SEEK Profiles into hirers’ workflows (via ATS)
• Verify candidate and hirer claims to add trust • More than 20% uplift in applications per session1
• Verified candidate credentials grew by 88% in FY212
Pricing to reflect • Align pricing with customer value creation • New pricing model rolled out to AU customers; NZ
value transition commenced in March 2021
o Variable pricing construct
o Greater insights and tools to help hirers • Investment in improved ROI tracking tools for hirers
manage spend • Pricing trials underway across Asia
1 Relates to APAC.
2 Relates to Australia.
SEEK Limited FY21 Results Presentation 29Platform Goal is one unified platform within 3 years
v
• APAC employment marketplaces will be centrally hosted on an optimised
ANZ platform
Unification • Centralised platform will enable new products and enhancements to be
deployed at scale across all markets, and improve reliability and security
• Products will be uniform across all markets with some degree of local
customisation
Unlocking the larger APAC
opportunity
Candidate and Hirer sides of the marketplace are being unified in parallel
v
• As noted at SEEK’s H1 21 Results, progress made on the candidate side
gave us confidence to bring forward unification on the hirer side
Resource intensive, though innovation will continue
v
• Transition to the centralised platform is expected to take 3 years
• Investment in other product and tech initiatives will continue (e.g., aligning
price to value), so prioritisation is key
Investment required over next c3 years
v
• Around 200 new people are needed to complete the project; recruitment is
progressing
• Undertaking unification at the same time as other infrastructure projects
(ERP and CRM), with expected aggregate FY22 costs of up to cA$35m and
overall costs of around A$125m over 3 years
• Expect around 80% of the Unification costs to be capitalised
Unification will contribute to increased operating leverage over time
v
• Unification will increase our speed to market and therefore our APAC
revenue opportunity
• Post completion, cost efficiencies will support increased operating
leverage
SEEK Limited FY21 Results Presentation 30SEEK’s Opportunity to double revenue over the next five years
v
• Aspirational but achievable given current market positions and size of the
strategic
addressable market
• Focused on growth opportunities in our core businesses but may consider
M&A to enhance capabilities and/or create options in new revenue pools
outlook Investment and innovation required to realise significant growth potential
v
• Competition will remain intense and relentless
over the next 5 years • Sustained investment immediately improves the candidate and hirer
experience with financial benefits following in future years
• Significant investment in Unification (next c3 years) will deliver scale
efficiencies and improve speed to market
Expect continued investment but greater operating leverage to emerge
v • Expect EBITDA margin to improve even during Unification
• Post Unification, operating leverage should accelerate
• But in near term and longer term, we will continue to invest through any
periods of cyclical revenue weakness
EPS to grow but impacted by large work programs in short term
v
• Larger programs of work (e.g., Unification) will impact short-term EPS
growth
SEEK Limited FY21 Results Presentation 31Capital management approach
Including SEEK’s updated dividend policy
Capital Management Approach Updated Dividend Policy
From FY22 onwards
Strong operating cash flows
• Target payout of greater than 75% of “Cash NPAT less Capex”
o Payout will be subject to forward-looking considerations
Long-term investment including long-term investment opportunities and
Product & Tech Capex Optionality for M&A
external market conditions
• Cash NPAT less Capex defined as:
Reported NPAT excl. significant items
Balance Sheet strength
+ Depreciation and Amortisation
Working Capital Debt capacity + Share-based payments (net of tax and NCI)
+/- Associate equity accounted NPAT contribution
Remaining Capital + Dividends received
+/- Fair value accounting adjustments
Dividends Capital flexibility*
- Committed capex
* Deleveraging or the option (but not the obligation) to invest further in
the SEEK Growth Fund
SEEK Limited FY21 Results Presentation 32Shareholder Total Shareholder Returns (TSR)
returns over • c7x1 TSR vs ASX 200 since IPO despite the economic cycle and
aggressive competition
time
• New structure expected to drive SEEK’s next leg of growth
3 1,781.3%
SEEK continues to invest and Product & Tech
1,781.3 %
innovate to deliver long-term evolution
shareholder value
2
M&A led growth
(Int’l & Education)
1
ANZ led
growth
273.2%
273.2 %
Apr- 2005 Jan- 2008 Sep- 2010 Jun- 2013 Feb- 2016 Nov- 2018 Aug- 2021
SEEK ASX 200
1 Total shareholder returns includes dividends and share price appreciation from 19 April 2005 to 18 August 2021.
SEEK Limited FY21 Results Presentation 33FY22 OUTLOOK
Accounting & Reporting impacts
FY22 and beyond
              Discontinued Operations up until loss of control
              • Up until loss of control, the assets transferred from SEEK to the SEEK Growth Fund will be reported as
                Discontinued Operations in SEEK’s statutory financial results (consistent with FY21 treatment)
SEEK Growth   • SEEK is expected to lose control of the Fund at some point in the near future, timing uncertain
   Fund       Fair value accounting will apply once SEEK ceases to control the SEEK Growth Fund
              • From the time at which SEEK loses control, SEEK will start to account for the Fund as an associate and will
                recognise fair value movements in its income statement to reflect revaluations of the Fund’s investments
                every six months.

              SEEK to pay fees to the Manager
              • Manager to receive management and performance fees relating to the management of the Fund, and also
   Fees         management of assets owned by SEEK (including Zhaopin and JobAdder)
              • Fees will be recognised as an expense item below EBITDA

              SEEK to equity account for SEEK’s interest in Zhaopin
  Zhaopin     • SEEK retains a 23.5% interest in Zhaopin and will recognise its share of Zhaopin profits/losses in ‘share of
                equity accounted profits/losses’

                                                                                                     SEEK Limited FY21 Results Presentation35 35
FY22 Guidance: SEEK (excluding
the SEEK Growth Fund)1
Context
v
• Forecasting remains challenging given volatility caused by COVID-19, changes in hiring sentiment and FX
o SEEK’s ad volumes have responded quickly to changes in COVID-19 restrictions, both positively and
negatively. Yields are also sensitive to the areas of the economy in which activity occurs
FY22 Guidance (excluding significant items) for SEEK (excluding the SEEK Growth Fund)1:
v
• EBITDA to be in the range of A$425m to A$450m
o Based on assumed revenue in the range of A$950m to A$1bn
o If revenue is weaker than anticipated, SEEK has some flexibility to reduce discretionary opex but will
proceed with strategic investment
• NPAT to be in the range of A$190m to A$200m
Key assumptions: SEEK (excluding the SEEK Growth Fund)
• COVID-19: Some degree of ongoing disruption in H1 22, with limited overall impact to hiring demand. SMEs continue to hire actively.
Labour supply remains similar to FY21 with international travel unchanged throughout FY22
• Macro: No material changes to FX or in macro settings that cause a shift in hiring demand
• Management Fees: Assumes cA$21m of management fees recognised below EBITDA
• Capex (incl. Unification) to be in the range of A$135m to A$145m
• Tax: In December 2021 SEEK will cash settle cA$50m of Australian tax relating to the sell down of its ownership interest in Zhaopin.
No impact to FY22 NPAT as the expense was recognised in FY21 as part of the gain on sale of SEEK’s sell down in Zhaopin
1 Comprises AP&A, SEEK’s 23.5% interest in Zhaopin, JobAdder and other smaller investments, and Corporate Costs.
SEEK Limited FY21 Results Presentation 36FY22 Guidance: SEEK Growth Fund
FY22 Guidance (excluding significant items) for the SEEK Growth Fund:
v
• SEEK’s equity accounted share of the NPAT losses to be in the range A$20m to A$25m for H1 22
Key assumptions: The SEEK Growth Fund
• Point at which SEEK will lose control of the Fund is uncertain. Guidance assumes SEEK will control the Fund until 31 Dec 2021,
with SEEK recognising its equity accounted share of the Fund’s NPAT losses for all of H1 22. On loss of control SEEK will
account for the Fund as an “associate” and will recognise “fair value” movements in its income statement to reflect revaluations
of the Fund’s investments. Given fair value movements are difficult to predict, SEEK’s guidance does not include any estimates
of fair value movements in H2 22.
SEEK Limited FY21 Results Presentation 37Well Attractive opportunity exists in our core markets to grow
v
revenue and expand margins over time
positioned Leveraged to improving economic conditions and structural
v
to grow changes in the labour market
long-term Ability to capture and apply deep and unique data to create
v
more value for candidates and hirers
shareholder Opportunity to price for the additional value we create
value v
v High cash flow generation provides ability to reinvest in our
capabilities whilst also providing an ongoing stream of
dividends
New structure provides shareholders with access to capital
v
growth in the SEEK Growth Fund
SEEK Limited FY21 Results Presentation 38APPENDICES
A note to our FY21 statutory results
The new structure and Zhaopin sell down impacted the presentation of our FY21 statutory results

• As a result of the structure changes and Zhaopin sell down, SEEK’s FY21 statutory financial results (as presented in SEEK’s Appendix 4E
  and Statutory Accounts) have been reported on a Continuing Operations basis 1
• The table below describes what was classified as Continuing Operations versus Discontinued Operations. Refer to next page for a
  detailed breakdown of SEEK’s FY21 and FY20 (restated) statutory financial results.

                                                          Continuing Operations                                                                Discontinued Operations

              Revenue               • AP&A businesses and select ESVs that will                                            • Results for assets to be transferred to the SEEK
             & EBITDA                 continue to be owned by SEEK under the new                                             Growth Fund (OES and majority of ESVs)3
                                      structure                                                                            • Zhaopin’s results for the 10 months to 30 April
                                                                                                                             20214 (FY20: 12 months of results)

                   NPAT             • AP&A businesses and select ESVs (per above)                                          • Zhaopin, OES and Sidekicker results (per
                                    • SEEK’s share of Zhaopin NPAT for May and                                               Revenue and EBITDA above); and
                                      June 2021 (period in which it was equity                                             • SEEK’s share of NPAT for equity accounted
                                      accounted)2                                                                            ESVs to be transferred to the SEEK Growth Fund

             SEEK Group results referred to throughout this presentation are an aggregate of Continuing and Discontinued Operations

1 FY20 Statutory results were also been restated into Continuing and Discontinued Operations.
2 As outlined in SEEK’s 4 May 2021 ASX announcement, SEEK reduced its ownership interest in Zhaopin from 61.1% (undiluted) to 23.5% (fully diluted) in May 2021. As a result, SEEK
  deconsolidated Zhaopin from its Group financial statements from 30 April 2021 and subsequently equity accounted for Zhaopin. SEEK’s share of Zhaopin NPAT for May and June 2021 is
  included within FY21 Group Reported NPAT from Continuing Operations.
3 As noted on page 6, OES and 14 ESVs to be transferred from SEEK to the SEEK Growth Fund. As a result, these assets have been included within Discontinued Operations for statutory

  reporting purposes in FY21 and in the restated FY20 results.                                                                                                                         SEEK Limited FY21 Results Presentation   40
FY21 Financials (A$m)2
SEEK Group
Constant
FY20 Growth Currency
FY21 (restated) % %
SEEK ANZ 541.0 387.2 40% 40%
P&L detail
SEEK Asia 145.6 162.9 (11%) (2%)
LatAm 49.7 77.5 (36%) (19%)
AP&A Other 1.2 2.0 (40%) (40%)
ESVs3 22.8 21.0 9% 10%
Continuing Operations 760.3 650.6 17% 21%
Zhaopin 577.1 749.6 (23%) (19%)
Aggregate results for OES 190.7 136.6 40% 40%
Continuing and Discontinued ESVs4
Discontinued Operations
63.0
830.8
40.6
926.8
55%
(10%)
55%
(7%)
Operations1 Group Revenue 1,591.1 1,577.4 1% 5%
SEEK ANZ 322.9 220.5 46% 47%
SEEK Asia 47.4 72.8 (35%) (27%)
LatAm 1.3 13.0 (90%) (87%)
AP&A Other (9.5) (14.3) 34% 34%
3
ESVs (4.1) (3.8) (8%) (9%)
Corporate Costs (26.0) (33.1) 21% 21%
Continuing Operations 332.0 255.1 30% 33%
Zhaopin 98.7 123.7 (20%) (17%)
OES 45.5 34.8 31% 31%
ESVs4 (2.6) (3.0) 13% 13%
Discontinued Operations 141.6 155.5 (9%) (6%)
Group EBITDA 473.6 410.6 15% 18%
Group EBITDA Margin % 30% 26%
Depreciation & Amortisation (133.3) (131.7) (1%)
Net interest (47.3) (56.2) 16%
Share-based payments (23.3) (22.2) (5%)
Share of equity accounted results (33.8) (39.9) 15%
Other items (3.6) (0.7) n/m
Tax (69.8) (49.3) (42%)
Non-controlling interests (21.7) (21.7) -
Group Reported NPAT (excl Sign. Items) 140.8 88.9 58%
Significant items 611.4 (202.0) n/m
Group Reported NPAT 752.2 (113.1) n/m
1 SEEK Group results reflect the aggregate of results from Continuing Operations plus results from Discontinued Operations. Refer to page 40 for further detail.
2 SEEK has revised its accounting policy for upfront cloud computing configuration costs in response to recent guidance from the International Accounting Standards Board. These costs were
previously capitalised and will now be expensed. The change results in the following impacts to FY21: EBITDA A$13m and A$7m NPAT. FY20 comparative has been restated to account for the
impact of the change retrospectively. This change in policy was not factored into SEEK’s guidance provided in SEEK’s 4 May 2021 ASX announcement.
3 Includes ESVs that will be retained by SEEK under the new structure and managed by SEEK Investments (e.g., JobAdder), and that have been reported under SEEK Investments in prior year.
4 Relates to controlled ESVs to be transferred to the SEEK Growth Fund. The results from equity accounted ESVs to be transferred to the SEEK Growth Fund will be accounted for within SEEK’s share of
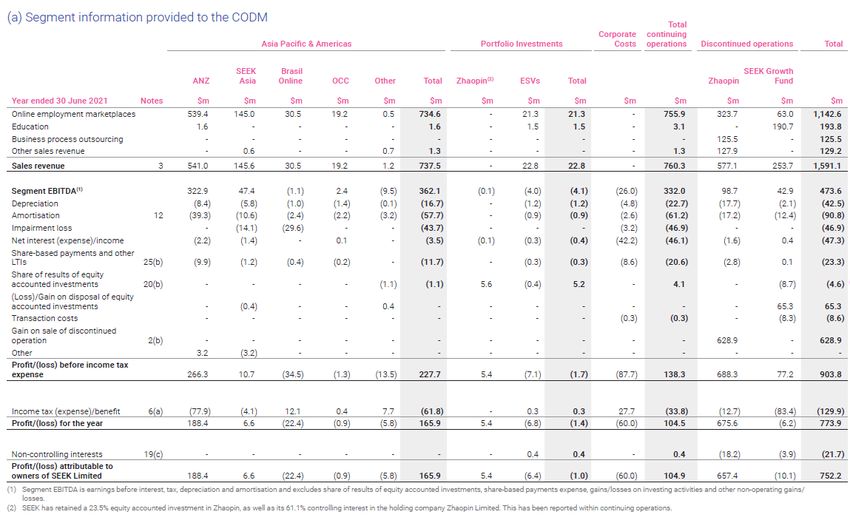
results from equity accounted investments. SEEK Limited FY21 Results Presentation 41Reconciliation to statutory results
SEEK Group results versus those presented in SEEK’s statutory accounts (Segment Note)
FY21 Financials (A$m) Significant items
FY21 FY20 (restated)
Continuing plus Continuing plus Continuing plus Continuing plus FY21 significant items of A$611.4m includes:
Discontinued Significant Discontinued Discontinued Significant Discontinued
Operations Items Operations Operations Items Operations
• Gain on sale of the sell down of SEEK’s controlling
(statutory) (excl. Sign. items) (statutory) (excl. Sign. items) interest in Zhaopin of A$628.9m post-tax; and
SEEK ANZ 541.0 0.0 541.0 387.2 0.0 387.2 • Gains on changes in ownership of equity accounted
SEEK Asia 145.6 0.0 145.6 162.9 0.0 162.9 investments (incl. JobandTalent and Go1) of A$98.6m
LatAm 49.7 49.7 77.5 77.5
AP&A Other 1.2 0.0 1.2 2.0 0.0 2.0
post-tax;
ESVs1 22.8 22.8 21.0 21.0 Offset by:
Continuing Operations 760.3 760.3 650.6 650.6
Zhaopin 577.1 0.0 577.1 749.6 0.0 749.6 • Deferred income tax with respect to SEEK’s future
OES 190.7 0.0 190.7 136.6 0.0 136.6
2
interest in the SEEK Growth Fund of A$75.2m;
ESVs 63.0 0.0 63.0 40.6 0.0 40.6
Discontinued Operations 830.8 830.8 926.8 926.8 • Impairment charges against the carrying values of Brasil
Group Revenue 1,591.1 0.0 1,591.1 1,577.4 0.0 1,577.4
Online and WorkAbroad (A$33.6m post-tax); and
SEEK ANZ 322.9 0.0 322.9 220.5 0.0 220.5
SEEK Asia 47.4 0.0 47.4 72.8 0.0 72.8 • Transaction costs relating to the structural separation
LatAm 1.3 1.3 13.0 13.0 between SEEK and Investments of A$7.3m (post-tax).
AP&A Other (9.5) 0.0 (9.5) (14.3) 0.0 (14.3)
ESVs1 (4.1) (4.1) (3.8) (3.8)
Corporate Costs (26.0) (26.0) (33.1) (33.1)
Amounts recognised as significant items in FY20 consisted
Continuing Operations 332.0 332.0 255.1 255.1 of impairments relating to Brasil Online, OCC and minority
Zhaopin 98.7 0.0 98.7 123.7 0.0 123.7 investments of A$198.4m (post-tax) and refinancing related
OES 45.5 0.0 45.5 34.8 0.0 34.8
2 costs of A$3.6m (post-tax).
ESVs (2.6) 0.0 (2.6) (3.0) 0.0 (3.0)
Discontinued Operations 141.6 141.6 155.5 155.5
Group EBITDA 473.6 0.0 473.6 410.6 0.0 410.6
Depreciation & Amortisation (133.3) (133.3) (131.7) (131.7)
Net Interest (47.3) 0.0 (47.3) (59.3) (3.1) (56.2)
Share based payments (23.3) (23.3) (22.2) (22.2)
Share of equity accounted results (4.6) 29.2 (33.8) (39.9) (39.9)
Other items 638.7 642.3 (3.6) (205.8) (205.1) (0.7)
Tax (129.9) (60.1) (69.8) (43.9) 5.4 (49.3)
Non-controlling interests (21.7) 0.0 (21.7) (20.9) 0.8 (21.7)
Group Reported NPAT 752.2 (113.1)
Significant items 611.4 (202.0)
Group Reported NPAT excl. Sign items 140.8 88.9
1 Includes ESVs that will be retained by SEEK under the new structure and managed by Investments (e.g., JobAdder), and that have been reported under SEEK investments in prior year.
2 Relates to controlled ESVs to be transferred to the SEEK Growth Fund. The results from equity accounted ESVs to be transferred to the SEEK Growth Fund will be accounted for within SEEK’s
share of results from equity accounted investments.
SEEK Limited FY21 Results Presentation 42You can also read