KANNALAND: HUMAN SETTLEMENT PLAN (HSP) - Final Draft May 2016 - Kannaland Municipality
←
→
Page content transcription
If your browser does not render page correctly, please read the page content below
0

   KANNALAND:
HUMAN SETTLEMENT   Final Draft
                   May 2016
    PLAN (HSP)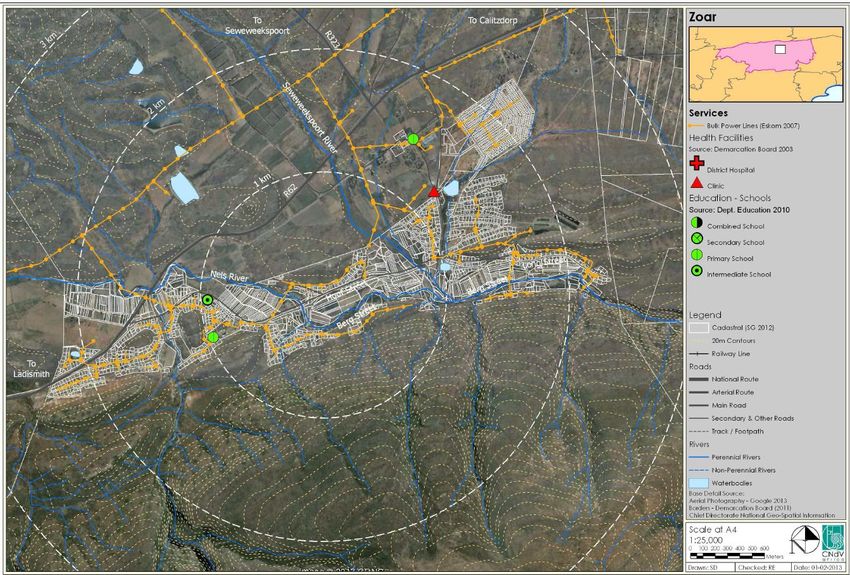
1

TABLE OF CONTENTS

1.      INTRODUCTION AND BACKGROUND ............................................................................. 7
     1.1      Sustainable Human Settlements ............................................................................. 7
     1.2      Principles of integrated and sustainable human settlements ............................ 8
     1.3      Purpose of a Human Settlements Plan .................................................................. 8
     1.4      Legislative & Policy Framework ............................................................................... 9
     1.5      Roles and Responsibilities......................................................................................... 9
     1.6      Roles and Responsibilities of Municipalities ......................................................... 10
     1.7   Kannaland IDP‟s strategic alignment with National, Provincial and District
     Arms of Government ......................................................................................................... 10
     1.8      Integrated Development Plan 2015/16 Review ................................................. 11
     1.9      PSP 2014-2019: Provincial Strategic Goals (PSGs) ............................................... 13
2.      KANNALAND OVERVIEW ............................................................................................... 14
     2.1      Municipal Area and Community Profile .............................................................. 14
     2.2      Vision ......................................................................................................................... 15
     2.3      Development Trends in the Municipality ............................................................. 15
     2.4      Infrastructure/ Basic Service Delivery Backlogs .................................................. 15
     2.5      Economic Development ....................................................................................... 15
        2.5.1        Service Delivery Challenges .......................................................................... 15
        2.5.2        Critical Interventions........................................................................................ 15
     2.6      Social Development ............................................................................................... 16
     2.7      Demographic Characteristics............................................................................... 16
        2.7.1        Population ........................................................................................................ 16
        2.7.2        Households ....................................................................................................... 18
        2.7.3        Educational Levels .......................................................................................... 20
        2.7.4        Employment and Unemployment................................................................. 20
        .......................................................................................................................................... 22
        2.7.5        Opportunities for economic growth ............................................................. 22
     2.8      Housing Waiting List per town ............................................................................... 22
     2.9      Informal Settlements ............................................................................................... 23
3.      ANALYTICAL PHASE ........................................................................................................ 24
     3.1      Kannaland Population Projection ........................................................................ 24
     3.2      Human Settlement Housing Demand Projections and Analysis (Current) ...... 26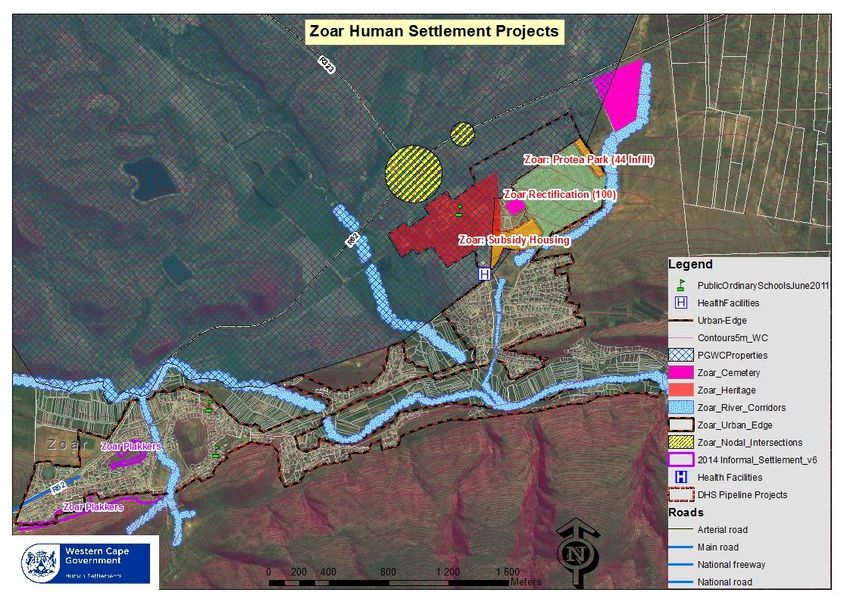
2
3.3 Informal Settlements Projection ............................................................................ 26
3.4 Land Requirement for Subsidy Housing Demand Projections 2035 ................. 27
3.5 Implication of the demographic analysis for Kannaland Municipality ........... 28
3.6 Summary of Town Profiles: Kannaland Municipality Settlements, their main
functions, economic base and locational advantages.............................................. 30
3.7 Summary of population, household and land required projection up until
2035. 31
3.8 Summary of current Human Settlement pipeline projects for Kanaland
Municipality ........................................................................................................................ 32
3.9 Settlements Development Parameters................................................................ 33
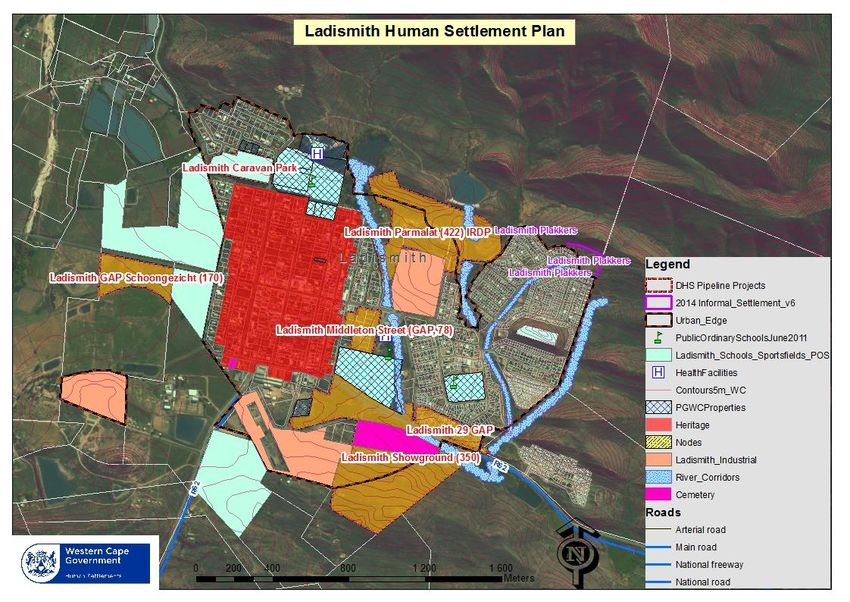
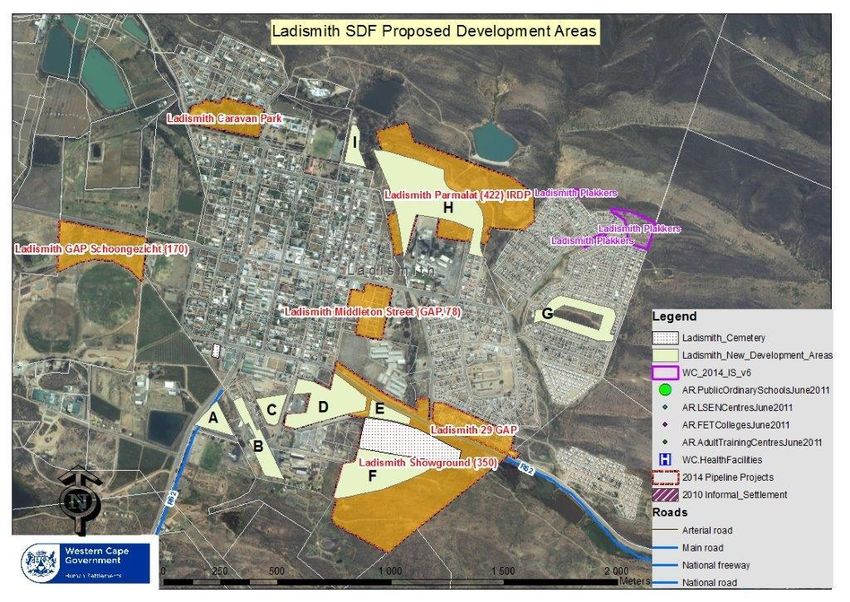
4. Ladismith .......................................................................................................................... 34
4.1.1 Challenges and potential emanating from the SDF: ................................. 34
4.1.2 Challenges and potential emanating from the status quo analysis: ....... 35
4.1.3 Projects identified in the Spatial Development Framework: ..................... 35
4.1.4 Summary ........................................................................................................... 35
.................................................................................................................................................. 41
4.2 Zoar ........................................................................................................................... 42
4.2.1 Challenges and potential emanating from the SDF: ................................. 42
4.2.2 Challenges and potential emanating from the status quo analysis: ....... 42
4.2.3 Projects identified in the Spatial Development Framework: ..................... 43
4.2.4 Summary ........................................................................................................... 43
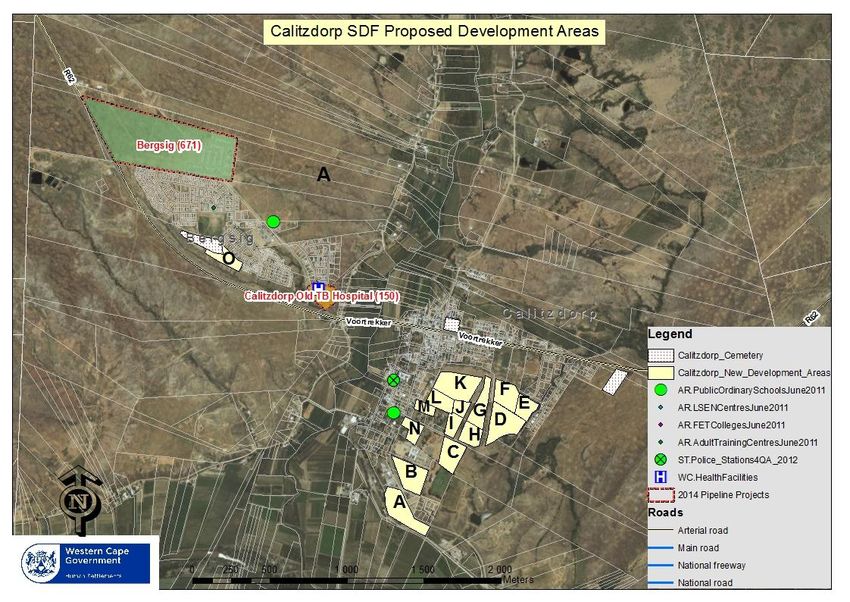
4.3 Calitzdorp................................................................................................................. 49
4.3.1 Challenges and potential emanating from the SDF: ................................. 50
4.3.2 Challenges and potential emanating from the status quo analysis: ....... 50
4.3.3 Projects identified in the Spatial Development Framework: ..................... 50
4.3.4 Summary ........................................................................................................... 51
.................................................................................................................................................. 56
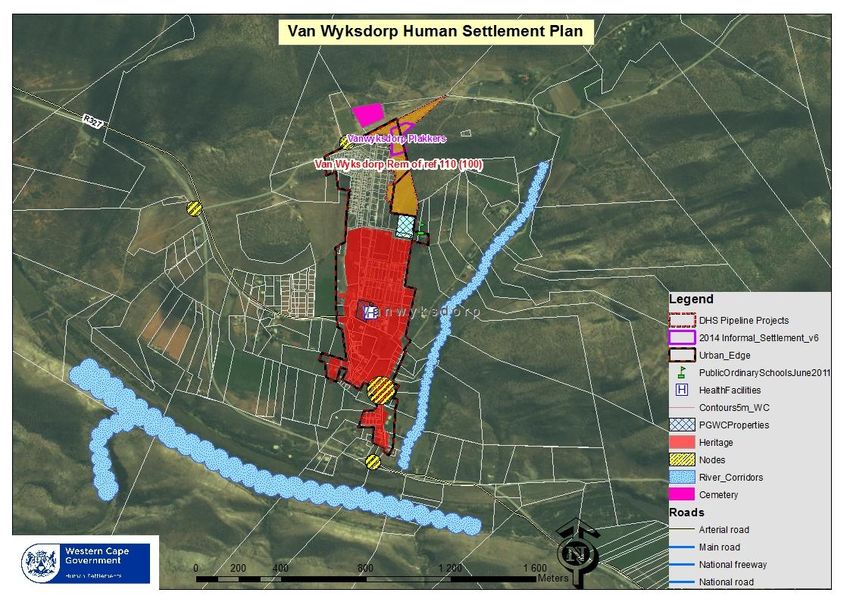
4.4 Van Wyksdorp ......................................................................................................... 58
4.4.1 Challenges and potential emanating from the SDF: ................................. 58
4.4.2 Challenges and potential emanating from the status quo analysis: ....... 58
4.4.3 Projects identified in the Spatial Development Framework: ..................... 58
4.4.4 Summary ........................................................................................................... 59
5. CONCLUSION .................................................................................................................. 65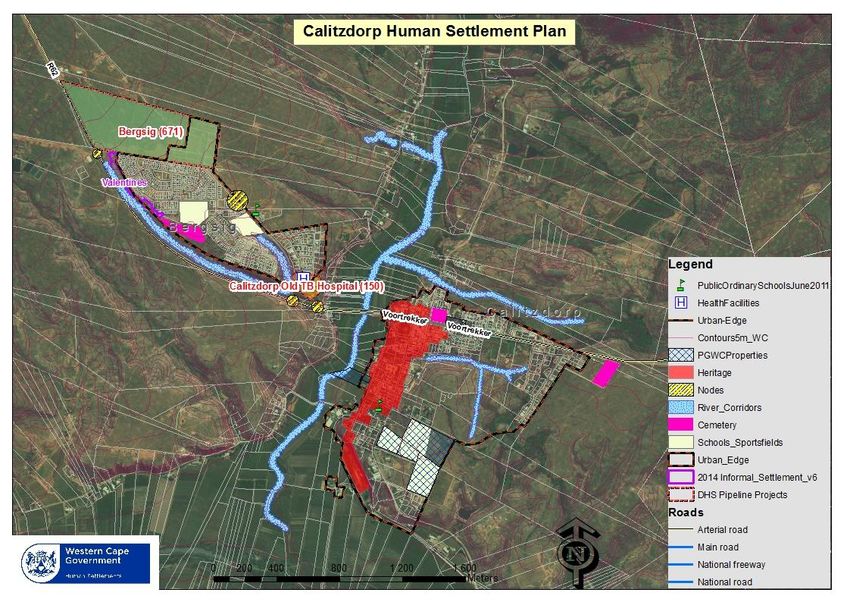
3

LIST OF TABLES

Table 1: Summary of Human Settlements related policies ................................................ 9
Table 2: Strategic alignment of the three spheres government ..................................... 12
Table 3: 2001-2011 Population Census information .......................................................... 17
Table 4: Level of education distribution in Kannaland Municipality (Census 2011)..... 20
Table 5: Employment status comparison between 2001 & 2011 Census ...................... 21
Table 6: Informal settlement shack count (2015 Study) ................................................... 23
Table 7: 2035 Projected Population Figures ....................................................................... 24
Table 8: 2035 household projections .................................................................................. 25
Table 9: Land requirement for different population projections .................................... 25
Table 10: Current housing demand and projected demand (2035) for subsidy
housing .................................................................................................................................... 26
Table 11: Kannaland informal settlements growth projections....................................... 27
Table 12: Projected land requirement for housing opportunities up till 2035 ................ 27
Table 13: Summary of municipal overview and strategy ................................................ 29
Table 14: Summary of town profile ...................................................................................... 30
Table 15: Summary of land requirement for population projections per town ............ 31
Table 16: Summary of current human settlements pipeline projects ............................. 32
Table 17: Summary of Ladismith infrastructure capacity (IGP Report) .......................... 35
Table 18: Ladismith HS pipeline project readiness status ................................................. 38
Table 19: Ladismith SDF identified property ownership and zoning status .................... 39
Table 20: Summary of Zoar Infrastructure Capacity (IGP Report) .................................. 43
Table 21: Zoar HS pipeline project readiness status .......................................................... 46
Table 22: Zoar SDF identified property ownership and zoning information................... 46
Table 23: Summary of Calitzdorp Infrastructure Capacity (IGP Report) ........................ 51
Table 24: Calitzdorp HS pipeline project readiness status ............................................... 54
Table 25: Calitzdorp SDF Identified property ownership and zoning status .................. 55
Table 26: Summary of Van Wyksdorp Infrastructure Capacity (IGP Report) ................ 59
Table 27: Van Wyksdorp Human settlement project ........................................................ 62
Table 28: Van Wyksdorp SDF proposed future development areas .............................. 62
4

LIST OF FIGURES

Figure 1: Kannaland locality map in relation to the surrounding areas ........................ 17
Figure 2: 2011 Sex Distributions according to Age classification .................................... 18
Figure 3: Kannaland household income distribution (Census 2011) .............................. 19
Figure 4: Locality map of educational facilities within Kannaland Municipality .......... 19
Figure 5: Workforce distribution within Kannaland Municipality (Census 2011)............ 21
Figure 6: Potential Growth of Town Study (Western Cape) ............................................. 22
Figure 7: Housing Backlog distribution per Age (February 2016 extract WCHDD) ....... 23
Figure 8: Ladismith locality map showing human settlements projects......................... 36
Figure 9: Ladismith future development areas .................................................................. 37
Figure 10: Ladismith SDF development proposal .............................................................. 40
Figure 11: Ladismith social facilities availability ................................................................. 41
Figure 12: Zoar locality map showing human settlement projects ................................. 44
Figure 13: Zoar SDF proposed future development areas ............................................... 45
Figure 14: Zoar SDF development proposal ....................................................................... 47
Figure 15: Zoar social facility capacity map ...................................................................... 48
Figure 16: Calitzdorp locality map showing human settlement projects ...................... 52
Figure 17: Calitzdorp SDF proposed development areas ................................................ 53
Figure 18: Calitzdorp SDF development proposal ............................................................ 56
Figure 19: Calitzdorp social facilities capacity map......................................................... 57
Figure 20: Van Wyksdorp locality map showing human settlement project ................ 60
Figure 21: Van Wyksdorp HS project and SDF proposal ................................................... 61
5

ACRONYMS

BNG - Breaking New Ground
CRU - Community Residential Units (Hostels Redevelopment Programme)
KHSP – Kannaland Human Settlement Plan
KSDF - Kannaland Spatial Development Framework
EHP - Emergency Housing Programme
FLISP - Finance Linked Individual Subsidy Programme
HSP - Human Settlement Plan
ISHS - Integrated Sustainable Human Settlement
IRDP - Integrated Residential Development Programme (Project Linked Subsidy)
NDoHS - National Department of Human Settlements
NDP - National Development Plan
NHFC - National Housing Finance Corporation
NSDP - National Spatial Development Perspective
PHP - People‟s Housing Process
PSDF - Provincial Spatial Development Framework
RDP - Rural Development Programme
SDF - Spatial Development Framework
UISP - Upgrading of Informal Settlements Programme
IDP- Integrated Development Plan
WCHDDB – Western Cape Housing Demand Database
JPI - Joint Planning Initiative
LED- Local Economic Development
Kannaland LM – Kannaland Local Municipality
NGO - Non Government Organisation
6

Document Management

Document Authors

Mr. David Alli (Pr. Pln)

E Shortles (Pr. Pln)

Contact Person:

Mr David Alli

Department of Human Settlements

Western Cape Government

10th Floor, ISO Building, 27 Wale Street

Tel: 021 483 5609

Email: David.Alli@westerncape.gov.za

Document Name

Kannaland Human Settlement Plan

Date            Revision /       Rev.        Details of changes        Authors
                Version Name     No.
17/12/14        First Draft      1    Additional Information &         D Alli &
                                      Formatting                       E Shortles
29/4/15         Second Draft     2    Additional Information &         D Alli &
                                      Formatting                       E Shortles
                Third Draft      3    Additional Information &         D Alli &
                                      Formatting                       E Shortles
13/01/2016 Forth Draft           4    Additional Information &         D Alli &
                                      Formatting                       E Shortles
04/02/2016 Workshop              5    Presentation                     D Alli
31/05/2016 Final Draft           6    Additional Information &         D Alli &
                                      Formatting                       E Shortles

Date                       Approval           Name & Position     Signature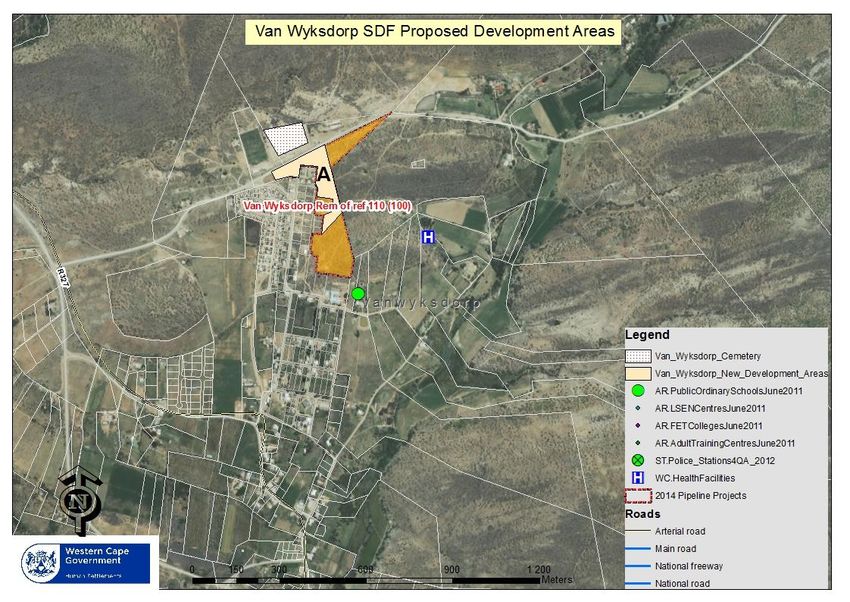
7

1. INTRODUCTION AND BACKGROUND

1.1 Sustainable Human Settlements
This document is developed within the context of Human Settlement Plan as the
anchor of creating sustainable resilient integrated settlements with the support of
provincial arms of government. A good understanding of the requirements and
standards for the creation of a resilient environment is necessary for effective
planning and service delivery. The most significant of it all is demographic analysis
and projections for forward planning. In the past emphasis has been place on
housing delivery with little consideration of the social integration component of
settlements. Amongst the mechanisms recently advocated for through the National
Development Plan (NDP) is the creation of sustainable integrated human
settlements with different income groups and social backgrounds.

The shifts and changes in human settlement thinking is not yet fully accepted as
increasing pressure on municipalities to deliver housing opportunities with little
funding and capacity available at their disposal. Regardless of these realities the
provision of human settlements is still a high priority for most municipalities. Diverse
challenges do however exist with regard to the capacity of bulk infrastructure
services with specific reference to supply of basic services in form of water,
electricity, sanitation and waste removal. These infrastructure backlogs attributed to
most rural municipalities which are also evident in Kannaland Local Municipality
(KLM), thus has an effect on the delivery of human settlements. Over the past few
years the municipality has enjoyed accelerated housing provision but the recent
bulk infrastructure challenges is creating pressure on the municipality to deliver.

A Housing Pipeline (2013/14) was developed through the assessment of the demand
for low and middle income groups housing in Kannaland Municipality. Given the
high unemployment in towns and the agricultural nature of the local economy,
which is affected by the national and international trends toward a magnetisation
of the agricultural sector has resulted in a significant increase in the demand for low
cost housing.

To the contrary non-availability of homes for this grouping consisting of municipal
workers, nurses, teachers, government officials, and ordinary factory workers and
policemen has highlighted the demand for affordable housing.

Given the demand for low and middle income earners settlements, there is a serious
need for a credible Human Settlement Plan. The plan will ensure medium to long
term planning with regard to the delivery of the appropriate infrastructure that will
enable the municipality to address the backlog for low cost housing and make land
available for affordable housing market segment. A portion of affordable housing is
also subsidised by the Department of Human Settlements depending on the income
bracket.

Within the context of using human settlement development as a catalyst for other
municipal services delivery a credible human settlement plan is required in
Kannaland to combat all the issues associated with rural municipality to manage
their housing situation.
8
The Human Settlement Plan will entail the following technical work:-
Spatial planning analysis
Topographical survey
Implementation readiness assessment
Biodiversity assessment
Bulk infrastructure services assessment
Social amenities assessment
With the assistance of DHS a Beneficiary Selection Policy was initiated, developed
and adopted by the municipality in 2013/14 financial year. This policy directive is to
assist municipalities in the regulation of the housing waiting list and the allocation of
housing to beneficiaries in a transparent and comprehensive manner. This policy will
also enable the municipal council to determine the demand for housing in both rural
and urban areas and thus be able to proactively plan for its citizens.
Apart from this long term strategic planning considerations, the municipality will also
facilitate other stakeholders in their jurisdiction for transversal partnering for the
creation of sustainable integrated human settlements. Taken the opportunity from
this process to consolidate and present community needs identified through the
Integrated Development Plan (IDP) consultation process.
1.2 Principles of integrated and sustainable human settlements
Land Infill
Densification
Development within urban edge
Mixed development
Access to public transport
Variety to public transport
Variety of social amenities to choose from
Access to economic opportunities
Variety of housing instruments relevant to clientele
1.3 Purpose of a Human Settlements Plan
The purpose of this Human Settlement Plan is to feed into the Provincial Multi Year
Housing plan. To establish a medium to longer term (i.e. 20 year) strategy for the
development of integrated and sustainable human settlements within the
municipality‟s area of jurisdiction.
To identify specific priority projects emanating from these programs for which more
detailed planning is required to implement them.
Furthermore, this HSP guideline will assist the local municipality in the following:
Guiding the vision of municipality.
Delivering integrated and sustainable human settlements through the
compilation of credible HSPs.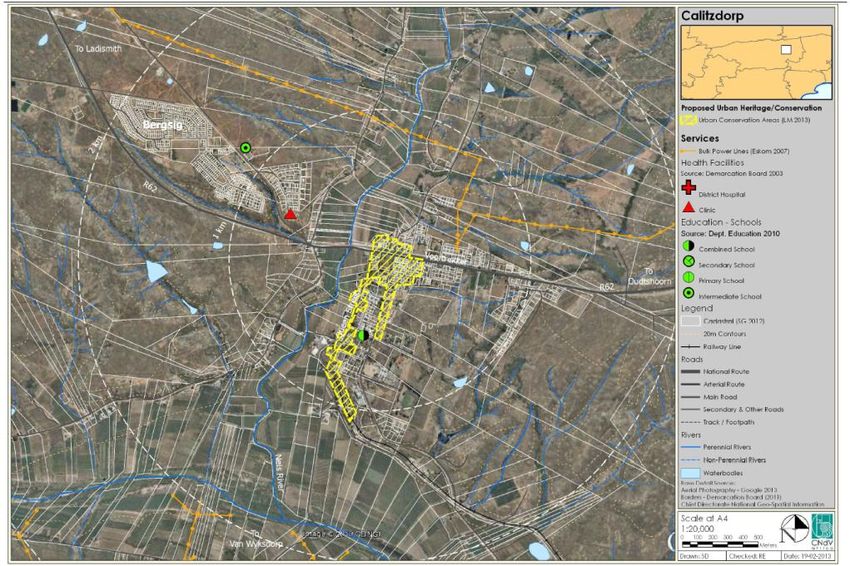
9
Drawing linkages with the Integrated Development Plan (IDP) process with
adequate information about the housing projects, their benefits, parameters
as well as strategic and operational requirements.
Ensuring that the contents and process requirements of planning for
sustainable human settlement development are adequately catered for.
1.4 Legislative & Policy Framework
The Breaking New Ground (BNG) policy as well as the Western Cape Sustainable
Human Settlement Strategy Goals forms the strategic basis for the approach to
developing a Human Settlement Plan at local government level. The BNG proposes
to “promote the achievement of a non-racial, integrated society through the
development of sustainable human settlements and quality housing.”
Housing is interrelated with many policies and acts, whether it is the environment,
government, social amenities or infrastructure. Table 1 depicts the policies and
different programmes at National and Provincial level that relate to housing delivery
and human settlement development.
Act Policies & Strategies
Constitution of South Africa, National Housing Code
Housing Act, No.107 of 1997 National Development Plan (NDP)
Municipal Structures Act, 1998 and 2000 National Spatial Development Framework
Municipal Structures Act, No.32 of 2000 Breaking New Ground Comprehensive Plan
Development Facilitation Act,No.67 of 1995 Provincial Spatial Development Framework (PSDF)
Division of Revenue Act, 2005 Provincial Growth and Development Strategy(PGDS)
Intergovernmental Relations Framework Act, No.13 of Integrated Urban Development Framework
2005 Draft Western Cape Human Settlement Framework
Disaster Management act, No.57 of 2002 Human Habitat No.108 of 1996
Spatial Planning Land Use Management Act Millennium Development Goals (MDG)
Western Cape Housing Development Act, No. 6 of Draft Informal Support Plan Strategic Framework
1999
Restitution of Land Rights Amendment Act 15
of 2014
National Environmental Management Act
Rental Housing Act 50 of 1999
Table 1: Summary of Human Settlements related policies, strategies and acts
1.5 Roles and Responsibilities
National Government must be establish and facilitate a sustainable national housing
development process and determine national housing policy.
Provincial Government must create an enabling environment by promoting and
facilitating the provision of adequate housing within the framework of national
housing policy.
Municipalities must pursue the delivery of housing, within the framework of national
and provincial policy, by addressing issues of land, services and infrastructure, and
creating an enabling environment for housing development.10
1.6 Roles and Responsibilities of Municipalities
The Housing Act sets out the roles and responsibilities for local government, but does
not differentiate between B-Municipalities and C-Municipalities. It is therefore the
responsibility of B and C municipalities to address issues regarding land, services and
infrastructure provision when pursuing housing delivery. Municipalities are responsible
for housing delivery within the area of jurisdiction.
It is the municipalities‟ responsibility to:
Initiate, plan, co-ordinate, facilitate, promote and enable appropriate
housing development;
Provide a Healthy and Safe environment;
Provide economically efficient Services;
Set Housing Delivery Goals;
Identify and designated land for Housing;
Create and maintain a financially and socially viable public environment;
Promote the resolution of conflicts arising in the housing development
process;
Provide bulk and Revenue Generating Services; and
Plan land use.
In the national housing programme, Municipalities may play the role of one of:
Promoter of a housing development project by a developer.
Developer in respect of the planning and execution of a housing
development project.
Administrator of any national housing program.
Facilitator and supporter of the participation of other role players in the
housing development process.
Joint venture contractor with a developer in respect of a housing
development project.
A separate business entity established to execute a housing development
project.
1.7 Kannaland IDP’s strategic alignment with National, Provincial and
District Arms of Government
The overall planning context which informs and defines the Kannaland IDP is the
National Development Plan (NDP), which was signed into power during August 2012.
The NDP contains 36 objectives and 36 actions which impact directly on Local
Government. The Western Cape Provincial Government‟s draft strategic plan:
Delivering the open opportunity society for all (2010) identifies 5 strategic priorities.
The Eden District Municipality has identified seven key strategic goals which are
essential for the growth and development of the district. Table 2 below indicates the
strategic alignment of Kannaland Municipality‟s Strategic Objective with Eden
District Objectives, Provincial Strategic Goals (PSG) and National Development Plan
(NDP).11
1.8 Integrated Development Plan 2015/16 Review
Kannaland Objectives Eden District Objectives Provincial Strategic Goals (PSG’s) NDP Objectives / Outcomes
KPA1: To provide access to Conduct regional bulk PSG 1: Create opportunities for growth and jobs. Outcome 6: Efficient, competitive and
reliable infrastructure that will infrastructure planning & responsive economic infrastructure
contribute to a higher quality implement projects, roads network
of life for Kannaland citizens maintenance and public
transport; manage and
develop council fixed assets (3)
KPA2: To provide adequate Increasing wellness (4) PSG 2: Improve education outcomes and opportunities for youth development
services and improve our Integrating service delivery for
Public confidence maximum impact (10)
KPA3: To strive towards a safe Promote sustainable PSG 3: Increase wellness safety and tackle social Outcome 2: Improve health and life
community in Kannaland environmental management ills expectancy
through the proactive and public safety (4) Outcome 3: All people in South Africa
management of protected and feel safe
environmental health, fire, Outcome 7: Vibrant, equitable and
traffic and disaster risks sustainable rural communities and food
security
Outcome 10: Protection and
enhancement of environmental assets
and natural resources
Outcome 11: A better South Africa, a
better and safer Africa and world
KPA4: To facilitate Economic Grow the district economy (7) PSG 4: Build a quality living environment, resilient Outcome 1: Improve the quality of
Growth and Social facets of Healthy and socially stable to climate change: basic education.
community development communities (1) Outcome 1: Sustainable ecological & agricultural Outcome 4: Decent employment
resource-base through inclusive growth
Outputs: Maintenance & Sustainable Use of Outcome 6: Efficient, competitive and
agricultural & Ecological Resources & responsive economic infrastructure
Infrastructure network
Climate Change Response Outcome 8: Sustainable human
Outcome 2: Sustainable & integrated urban & settlements and improved quality of
rural settlements. household
Increase housing opportunities
Improved settlement functionality, efficiencies
and resilience
Game Changers12
Water for sustainable growth and development
Water & sanitation- basic services
Table 2: Strategic alignment of the three spheres government
Kannaland Objectives Eden District Objectives PSO NDP Objectives / Outcomes
Creating opportunities for growth and development in rural areas (11) Outcome 7: Vibrant, equitable and sustainable rural communities and food
security
KPA5: To promote efficient and Promote good governance (5) Building the best-run regional Outcome 9: A responsive and,
effective Governance with high levels government in the world (12) accountable, effective and efficient
of stakeholder participation local government system
Outcome 12: A development-
orientated public service and
inclusive citizenship
KPA 6: To provide an efficient Build a capacitated workforce and Mainstreaming sustainability and Outcome 5: A skilled and capable
workforce by aligning our institutional communities (2) optimising resource-use efficiency (7) workforce to support inclusive growth
arrangements to our overall strategy
KPA 7: To strive towards a financially Ensure financial viability of the Eden Building the best-run regional Outcome 9: A responsive and,
sustainable municipality district municipality (6) government in the world (12) accountable, effective and efficient
local government system
Table 3: Strategic alignment of the three spheres government13 1.9 PSP 2014-2019: Provincial Strategic Goals (PSGs)
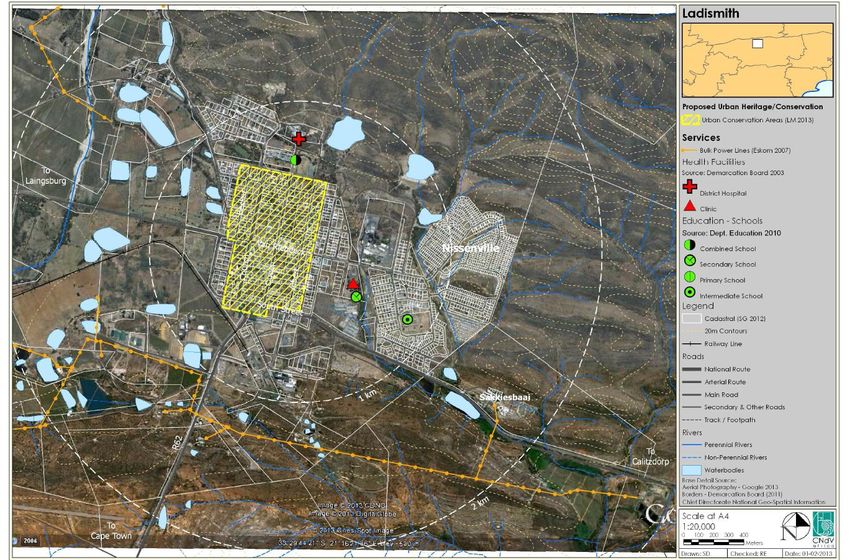
14

2. KANNALAND OVERVIEW
2.1 Municipal Area and Community Profile
Kannaland municipal area is situated in the jurisdiction area of the Eden District
Municipality. The municipal area is bordered in the west by Overberg District, in the
east by the Oudtshoorn municipality, in the north by Central Karoo District and in the
south by Hessequa municipality (refers to Figure 1).

The Kannaland municipal area lies huddled between two mountain ranges, the
Swartberge and Anysberg. Kannaland Local Municipality is classified as a Category
B municipality and is responsible for basic service provision to the towns of
Calitzdorp, Ladismith, Van Wyksdorp and Zoar, as well as the surrounding farming
communities. The municipality is situated about 340km north-east of Cape Town
along the famous tourism Route 62. It is linked by tarred main roads to all other major
centres, such as Oudtshoorn (100km), Montagu (139km), George (160km) and
Mosselbay (185km).

The municipality has the smallest population in the Eden District, and also has the
smallest economy in the region. Kannaland‟s climate is ideal for the production of
apricots, peaches, plums, nectarines and grapes. The well-known Parmalat and
Ladismith dairy products come from the area. The quaint little haven of Calitzdorp is
known as the port-wine capitol of South Africa by virtue of the top quality wines,
produced mainly by Boplaas, De Krans, Axehill and Calitzdorp wine cellars.
Kannaland has its own individual building style, which makes it unique. For example,
the so-called Ladismith Style is a simplified Georgian design and dates from the
1830s. Kannaland is an integral part of the Eden District, along with six other
municipalities, namely Hessequa, Mosselbay, George, Oudtshoorn, Knysna and
Kannaland.

As oppose to other municipalities in the district, Kannaland Municipality does not
have a diverse economy, with agriculture and forestry being the largest
employment sector.

There are however, significant initiatives in the broader Eden District Municipality
which may in the longer term benefit the economic base of Kannaland. Main
Economic Sectors: Agriculture (26.8%), manufacturing (20.4%), community and
personal services (18.4%), finance and business (11%), wholesale, retail and trade
(9.4%), construction (6.20%), electricity and water (4.70%), transport and
communication (3%).
15 2.2 Vision To be the place of choice 2.3 Development Trends in the Municipality A number of trends were identified during the Joint Planning Initiative (JPI) analysis of the socio economic reality for the Kannaland region. These trends can be summarized in the following development areas from input from sector departments: 2.4 Infrastructure/ Basic Service Delivery Backlogs Low levels of access to the minimum basic service in refuse removal and sanitation are of concern. These need to be addressed in order to enhance the quality of life of individuals and to stimulate economic activity which may be hampered as a result of these backlogs. Current budget allocations may be insufficient to address backlogs. 2.5 Economic Development Economic growth over the period 2001 to 2010 averaged 5.63 per cent per annum whilst real GDP-R per capita increased from R16 438 in 2001 to R26 043 in 2010. Agriculture and agro-processing sectors along with limited tourism prospects are highlighted. 2.5.1 Service Delivery Challenges The demand-driven nature of the work and the support interventions provided by the department (like, access to finance for enterprises) is dependent on uptake by the private sector and the demand generated by businesses and citizens to equip them for economic improvement. This is based on the extract from the Joint Planning Initiative (JPI) Provincial Consolidated Report for Kannaland Municipality 2014. It is also necessary for the Municipality to be able to identify key areas of challenge where the economic interventions which the department provides can be taken up. The Municipality must therefore be equipped for Local Economic Development (LED) sensitivities and be able to articulate the support needed from the department. 2.5.2 Critical Interventions Joint ventures can potentially occur in the areas of: Skills Development Red Tape Reduction Entrepreneurship Trade/Sector development Transversal participatory assessment in the Local Economic Development (LED) and in its implementation plan is required to stimulate economic development that will
16 improve municipal performance and maturity to deal with the economic development objectives of the area. Collaboration with the local private sector in order to unlock the local economy and establish what local businesses require in localities to unlock economic production, competitiveness and opportunities for labour absorption. Using partnerships and joint collaboration with the local private industry players, there is a need to focus on developing or expanding priority sectors with potential – In Kentland the development of the Agro-processing and Tourism sectors are to be prioritized for its labour-absorbing potential. Potential levers also include skills development, red tape reduction and enterprise support programs. 2.6 Social Development Kannaland LM, with an estimated median age of 28, 3 years in 2014, has a younger population than the Western Cape (29, 2) and Eden District (30, 1). The process of population ageing predicted for the Western Cape and Kannaland follows this trend with the median age projected to increase to 31, 0 years in 2030. The overall dependency ratio is predicted to decline from 55, 6 in 2014 to 53, and 5 in 2030. Relative to the working age population, those 14 years and younger are predicted to decrease so that the young dependency ratio falls from 42, 9 in 2014 to 36, and 5 in 2030. Those 65 years and older are expected, in contrast, to increase in proportion to the working age population with the old age dependency ratio rising from 12,7 in 2014 to reach in 17,0 in 2030. In 2014 it was estimated that there were 93, 3 males for every 100 females in Kannaland LM. In 2030 the sex ratio is expected to decline to 90, 8 males per 100 females. The following areas were identified by the Department of Social Development as service delivery challenges. High level of education, School drop-out of youth, Poverty, Substance abuse that have an enormous impact on all levels and spheres of the society as a whole. Crime is also a challenge as especially domestic violence. 2.7 Demographic Characteristics 2.7.1 Population The table below indicates that in 2001 there was a total population of 22 821 and in 2011 a total population of 24 767 in the area. The annual growth rate of the population between 2001 and 2011 was 0.85%. This positive growth rate indicates that more people are settling in the municipality, but at a very slow rate. The municipality has a relatively young population with the highest number of unemployment between the ages of 15-30 years. This remains a critical area for the municipality to focus on particularly in partnership with its social partners
17

(Government and NGO‟s) and in the context of its economic and social
development programs.

                Census 2001          Census 2011         Growth Rate

Population      22821                24767               0,85%

Table 3: 2001-2011 Population Census information

Implication of population growth on Human Settlements:

The implication of slow population growth for the municipality has got divers effect
be it on the economy, infrastructure or even housing needs. It is also however
important to acknowledge other effect of population growth rate other than
housing, but for the purpose of this plan we will focus more attention on human
settlements needs.

Figure 1: Kannaland locality map in relation to the surrounding areas
18
Kannaland Sex and Age Distribution
85+
80=84
75=79
70=74
65=69
60=64
55=59
50=54
45=49 Female
40=44
35=39 Male
30=34
25=29
20=24
15=19
10=14
5=9
0=4
-1500 -1000 -500 0 500 1000 1500
Figure 2: 2011 Sex Distributions according to Age classification
There seem to be an even distribution between female and male within the
Municipality. Majority of the population is aged between 0 and 29 years old. The
above graph presents a good indication that more people are within the workforce
age.
Implication of Sex and Age distribution on Human settlements:
Majority of the residents are still capable of entering the workforce as they aged
between 19 and 60 years. This implies that the future demand for housing would
decline as residents will be able to afford their own homes if the municipal economy
creates job opportunities to absorb the work force.
2.7.2 Households
The 2011 census information indicated that in general, the Kannaland income levels
of households are in the lower middle-income categories. The majority of households
earn between R800 and R12 800 per month. The table below shows the household
income per different income category. This indicates that approximately 55% of
households earned less than R4 800 per month in 2011. Almost 67% of households in
the municipal area earned between R800 and R6 400 per month and approximately
8% of the households did not receive any form of income in 2011.19
30.00% 28%
25.00%
20%
19%
20.00%
15.00%
9%
10.00%
6%
5%
5.00% 2% 2%
0.53% 0.19% 0.24%
0.00%
R1 - R400 R401 - R801 - R1601 - R3201 - R6401 - R12801 - R25601 - R51201 - R102401 - R204801
R800 R1600 R3200 R6400 R12800 R25600 R51200 R102400 R204800 or more
Figure 3: Kannaland household income distribution (Census 2011)
Implication of low to medium income households on Human settlement:
Having over 55% of the households earning less the R3500 bracket will impact on the
demand for as more and more people will rely on subsidised housing. Furthermore
the percentage rate payers in relation to non-rate payers are low which impacts on
financial sustainability of the municipality.
Figure 4: Locality map of educational facilities within Kannaland Municipality20 2.7.3 Educational Levels It is evident from the table below more toddlers were enrolled into the education system with a decline in the no schooling statistics. Furthermore, the table also displays a decline in further educational training however; there has been an increase in the number of pupils enrolled for Grade 12. Level of Education 2001 2011 No schooling 1660 1115 Some primary schooling 4378 7550 Completed primary school 1634 2033 Some secondary school 3826 7312 Grade 12 1683 3016 Higher education 766 656 Table 4: Level of education distribution in Kannaland Municipality (Census 2011) Educational facilities are largely clustered around the settlements of Ladismith, Calitzdorp, Van Wyksdorp and Zoar (figure 4). No educational facilities are available in Anysberg and Plathuis in the west and in Kraaldorings, Badshoogte and Vleirivier in the eastern parts of the municipality. Implication of Educational levels on Human Settlements: The current school amenities are meeting the current demand in terms of pupils attending school within municipality. The clustering of schools amenities around a particular area will ultimately result in an influx of people in that particular area. 2.7.4 Employment and Unemployment The table below indicates that there has been a slight increase in the labour force between 1996 and 2011. The labour force participation rate also decreased between 1996 and 2001 and then decreased to approximately 48% in 2011. This indicates that less than half of the total work force between the ages of 15 and 65 are employed or actively seeking employment. The table also indicates that there were a total of 6344 people employed in 1996. This figure increased to 6345 in 2001 and decreased to 6271 in 2011. This is noteworthy since the labour force decreased by 74 people.
21

Figure 5: Workforce distribution within Kannaland Municipality (Census 2011)

 Census      Total             Labour      LFPR%    Employed       Unemployed   Unemployment
 Data        Population        force                                            rate (%)
             aged 15-65
 1996        11909             7405        62.2     6344           1061         14.3
 2001        14622             7365        50.4     6345           1020         13.8
 2011        15728             7587        48.2     6271           1316         17.3
Table 5: Employment status comparison between 2001 & 2011 Census

 Implication       of       Educational        levels     on    Human       settlements:
 The Kannaland Municipality has experienced large job losses in especially the
 agricultural sector. This has in turn led to increasing unemployment rates. Kannaland
 Municipality has the second highest unemployment rate in the District. This is of
 concern considering the high poverty rates in the area. The implication of increase
 in unemployment in Kannaland means more residents will become dependent of on
 government grant and housing subsidy hence the demand for housing opportunities
 will continue to increase.

 In terms of skill development there are extremely high average dropout rates in the
 municipal area which need to be addressed. The literacy rates are also the lowest in
 the District. Considering the trends towards employing skilled and highly skilled
 individuals they may become an increasing concern.

 Growth Potential of Towns

 The Growth Potential Study of Towns in the Western Cape (2010) scored Ladismit with
 a low growth rate potential. Zoar and Calitzdorp scored a very low growth potential,
 respectively, while Van Wyksdorp was not included in this study. Kannaland is the
22 only municipality within the Eden District that is scored with a very low growth potential. Knysna, George and Mossel Bay, the other major urban centres within the region are scored with a very high potential growth rate. Table 5 below provides a summary of the growth potential of each settlement, in relation to economic, natural, infrastructure and institutional potential. Figure 6: Potential Growth of Town Study (Western Cape) Implication of slow employment growth on Human settlements: As mentioned above Kannaland has a very low growth potential in comparison with other municipalities. The municipality needs to find a niche in the market and exploit any feasible economic opportunities in order to counter this problem, as it could lead to job losses, increasing poverty, lower per capital income etc. within the municipal area. Although the potential growth rate is very low for the municipality the social demand is medium to high therefore Provision must nevertheless be made to accommodate this needs. 2.7.5 Opportunities for economic growth Although declining, poverty rates are still high within Kannaland Municipality. With the large job losses there will be increasing indigent households placing strain on municipal resources to provide free basic services. A number of opportunities and interventions exist for economic growth and development, as set out in Kannaland‟s IDP and SDF. 2.8 Housing Waiting List per town The following is an extract from the Housing Demand Database (WCHDDB February 2016). It shows that Kannaland Municipality has a backlog of 3184 which equates to 5% of the District waiting list. The table below shows age distribution of housing backlog per town.
23

                                       Kannaland
                        1200
                        1000
         Waiting List

                         800
                         600
                         400
                         200
                           0
                                                         60     Invalid    Under
                               30-39    40-49   50-59
                                                        Above     ID        30
       LADISMITH               430      262     161      114      4         258
       ZOAR                    236      121      61      40       9         145
       CALITZDORP              317      309     170      150      4         189
       VAN WYKSDORP             56       52      27      16       1         50
       Grand Total             1039     745     419      320      18        643

Figure 7: Housing Backlog distribution per age (February 2016 extract WCHDD)
 The above table displays current housing demand within the Kannaland
Municipality. It‟s evident that Ladismith has the highest demand for housing
opportunities. Furthermore, an interesting statistic is that there are more young
people in need for housing opportunities looking at the overall housing demand
from the database.

Implication of high number young applicants for Human settlement opportunities:

With majority of the awaiting applicants ageing under 40 years is very concerning as
provincial priority is to consider most desirable applicants first and thus makes the
municipal projects to be on a low priority.

2.9 Informal Settlements
The recent informal settlement shack count and verification study conducted by the
province to gather necessary planning and prioritisation information on the numbers,
level of services, density and living conditions within the informal settlements geared
towards informing municipalities of current status of the informal settlement within
the municipal area. The information presented in Table 7 was extracted from the
study:

                                Kannaland Informal Settlement Count
Town                             Informal Settlement Name                 Shack Count
Ladismith                        Unknown                                  206
Zoar                             Unknown                                  45
Calitzdorp                       Unknown                                  28
Van Wyksdorp                     Unknown                                  27
                                    TOTAL                                 306
Table 6: Informal settlement shack count (2015 Study)

Table 6 above displays a relatively even distribution of informal shacks in relation to
the respective towns. Furthermore, the shack count is low which would make short
tern intervention and final upgrading easier.
24
3. ANALYTICAL PHASE
3.1 Kannaland Population Projection
Projected population of settlements within Kannaland based on a high growth
scenario (0.8% growth rate per annum), a medium growth scenario (0.6% p.a.) and
low growth scenario (0.44% p.a.)
The stakeholder workshop held 4th February 2016, the population projection growth
of Ladismith and Calitzdorp are anticipated to only growth at medium rate (0.6%)
while Zoar and Van Wyksdorp are said to be low growth (0.44%). For the projected
analysis, the scenario of the combination of medium and low growth will be
adopted for this document.
Based on the above various growth scenarios, corresponding housing and land
requirements have been calculated. It is assumed that 3 people per household to
occupy a dwelling unit and that the average future gross dwelling unit density will
be 40 dwelling units per hectare.
POPULATION PROJECTIONS - UP TO 2035 (FOR HIGH, MEDIUM AND LOW GROWTH SCENARIO)
Projected Population 2035
Settlement Population (2011) High Growth Scenario Medium Low Growth Scenario
(0.85%) Growth (0.44%)
Scenario
(0.6%)
Ladismith 7123 8727 8223 7915 0.6
Zoar 4659 5708 5378 51770
Calitzdorp 4283 5248 4944 47590
Van Wyksdorp 833 1021 962 926
Non-Urban 7869 9641 9084 8743
Total 24767 30346 28591 27519
Table 7: 2035 Projected Population Figures
The following observations can be made regarding the future population
projections:
Under the „high growth‟ scenario, Kannaland is projected to grow from 24 767
people in 2011 to 30 346 in 2035, if it sustains the current development patterns and
same average growth rate of 0.85% per annum for all its settlements. It is expected
that this is an overly-optimistic growth rate and that current growth rates will not be
sustained until 2035.
Under the „low growth‟ scenario, Kannaland is projected to grow from 24 767
people in 2011 to 27 519 in 2035, if it experiences a growth rate of 0.44% per annum.25
It is anticipated that this growth rate is too conservative, given the significant influx of
people and resultant population growth that this municipality is experiencing.
Under the „medium growth‟ scenario (0.6%), Kannaland is projected to grow from
24 767 in 2011 to 28 591 in 2035.
HOUSEHOLD PROJECTIONS - UP TO 2035 (*assuming 3 people per household (2011 Census)
Projected No. of households 2035
Settlement No of households (2011) High Growth Scenario Medium Growth Low Growth
(0.85%) Scenario (0.6%) Scenario (0.44%)
Ladismith 1874 2296 2163 2082
Zoar 1226 1502 1415 1362
Calitzdorp 1127 1381 1301 1252
Van Wyksdorp 219 268 253 243
Non-Urban 2071 2537 2391 2301
Total 6517 7985 7513 7241
Table 8: 2035 household projections
LAND PROJECTIONS - UP TO 2035
(Future land requirements for new housing, assuming a future gross dwelling unit of 40du/ha)
New households between 2015 - 2035 Land Required by 2035 (ha)
Settlement No of High Growth Medium Low Growth High Medium Low Growth
households Scenario Growth Scenario Growth Growth (0.44%)
(2011) (0.85%) Scenario (0.44%) (0.85%) (0.6%)
(0.6%)
Ladismith 1874 2296 2163 2082 91 86.5 83
Zoar 1226 1502 1415 1362 60 56.6 55
Calitzdorp 1127 1381 1301 1252 55 52 50
Van Wyksdorp 219 268 253 243 10.7 10 9.7
Non-Urban 2071 2537 2391 2301 101.5 95.6 92
Total 6517 7985 7513 7241 319.4 300.5 289.6
Table 9: Land requirement for different population projections26
3.2 Human Settlement Housing Demand Projections and Analysis (Current)
Using the medium growth rate, table 12 below shows housing demand projection of
the February 2016 housing waiting list extracted from the Western Cape Housing
Demand Database (WCHDDB). As the „medium growth‟ scenario was adopted for
the population estimates, the following sets out the projected number of housing
demand in each settlements within Kannaland base on subsidy housing demand
database (WCHDDB).
Subsidy Housing Demand Projection 2035
Town Age classification of housing demand waiting list Current Total Projected
HS Demand Subsidy
Housing
60 Invalid Under
Demand
30-39 40-49 50-59 Above ID 30
Ladismith 430 262 161 114 4 258 1229 1419
Zoar 236 121 61 40 9 145 612 674
Calitzdorp 317 309 170 150 4 189 1139 1315
Van
56 52 27 16 1 50 202 222
Wyksdorp
Municipal
1039 745 419 320 18 643 3184 3629
Total
Table 10: Current housing demand and projected demand (2035) for subsidy housing
3.3 Informal Settlements Projection
Using the medium growth scenario to project informal settlements growth in
Kannaland municipality, the informal settlement is anticipated to grow from current
306 to 353 by 2035 if no intervention. However it is very important to note that the
rate at which informal settlements grow is dependent on various factors which in
most cases proof to be higher than normal population growth rate. The verification
process to determine and confirm the status of all identified informal settlements is
complete 2015. Table below presents the informal settlement shack count and
relative projection for 2035.27
Informal Settlements Growth Projection per town 2035
Informal Shack Count Projected growth of Informal
Settlement Settlement (0.6%)2035
Name
Ladismith A 206 238
Zoar B 45 52
Calitzdorp C 28 32
Van Wyksdorp D 27 31
Total 306 353
Table 11: Kannaland informal settlements growth projections
3.4 Land Requirement for Subsidy Housing Demand Projections 2035
Projected Subsidy Housing Land Requirement (2035)
Projected Current Housing HS Demand Land
Demand 2035 Pipeline Opportunities Shortfalls requirement
Ladismith 1419 850 569 14.22
Zoar 674 144 530 13.25
Calitzdorp 1315 821 494 12.35
Van 222 100 122 3.05
Wyksdorp
Municipal 3629 1943 1715 42.87
Total
Table 12: Projected land requirement for housing opportunities up till 2035
Base on the above various growth scenarios, corresponding housing and land
requirements have been calculated. It is assumed that 3 people will occupy a
dwelling unit and that the average future gross dwelling unit density will be 40
dwelling units per hectare. A total of 42.87 hectare will be required for subsidy
housing to accommodate the projected future subsidy housing demand (2035).28
3.5 Implication of the demographic analysis for Kannaland Municipality
Transversal and Implication of the demographic analysis on the Municipality Strategy (Stakeholder engagement to agree on strategy) Municipality,
Partnering DoHS, DEADP etc. Strategic recommendations to meet the challenges
Engagements emanating from the HSP analysis
Municipality to Population growth / Migration: With the slow/steady influx of people within the To provide access and updated Plans that will contribute to
facilitate and settlement, the demand for basic services will also increase. The Infrastructure and improve quality of life of current and future population. Alignment
foster socio facility capacity needs to be investigated in order to determine the impact on of all plans such as infrastructure Master Plan (water, sewer, storm
partnership the current or future demand. water, and electricity), SDF, HSP thereof incorporated into the IDP.
Municipality to Sex and age distribution: Majority of the residents are still capable of entering the Municipality to provide enable environment to retain and attract
facilitate and workforce as they aged between 19 and 60 years. This implies that the future business to boost the economy and promote employment
foster demand for housing would decline as residents will be able to afford their own opportunities.
partnership homes if the economic grows to absorb the work force
Municipality to Household Income: Having over 55% of the households earning less the R3200 Forward planning initiative to guide strategic direction of the
facilitate and bracket will impact on municipal resources as higher number of the population will municipality as to how human settlement projects should be
foster rely on subsidies. Furthermore the percentages of rate payers in relation to non-rate implemented
partnership payers are low which impacts on the sustainability of the municipality. Economic and skill development initiatives is paramount for
Promoting and attracting investment into the municipality through
LED mechanism and implementation of initiatives identified
Municipality to Educational Levels: The current school amenities are meeting the current demand in Improve current educational facilities to encourage further
facilitate and terms of pupils attending school within municipality. The clustering of schools learning and skills development
foster amenities around a particular area will ultimately result in an influx of people in that Department of Education/Public Works in conjunction with the
partnership with particular area. municipality to investigate the possibility of developing a
Dept. of secondary school or alternative option for Van Wyskdorp
Education
Municipality to Employment Status: Unemployment is increasing, meaning more residents will rely on To facilitate economic growth development through pursuing
facilitate and government subsidies thus increasing the burden on the municipality. initiates identified in the local LED strategy such as diversification of
foster municipal economic base to include tourism, construction and
partnership other services.
Dept. of Local Municipality to investigate opportunities to stimulate economic
Economic growth through the LED initiatives and rural development (tourism,
Development agriculture, manufacturing and processing).
and private LED strategy to support human settlement development and29
sectors should be used as the catalyst for local economic development
and skills transfer.
Skill development Initiatives and programmes to be investigated
through the LED to encourage local business; industries and other
institutions to be involved in capacitating local residents.
Solid waste management to be investigated as form of economic
development or employment opportunity. (recycling initiative)
Municipality to Growth Potential of Towns: Although the potential growth rate is low for Kannaland Social needs of the municipality to be considered in human
facilitate and Municipality the social demand is medium to high therefore provision must be made settlement planning by optimising human settlement instrument as
foster to accommodate this need. Although NDP and PSG states that investment should a catalyst for economic growth.
partnership with limited in small settlements Municipality with the assistance of sector departments to improve
Treasury, DEADP, infrastructure capacity to support existing and potential future
DEDAT NGO, industries; farming and other economic activities.
Private etc. Investment must be made to investigate LED programmes that
could improve and encourage tourism in the municipality as part
of economic growth.
Additional funding streams should be investigated to finance
municipal projects.
Municipality to Subsidy Housing Backlog: With majority of the awaiting list ageing under 30 years old Periodic and rigorous evaluation of the housing waiting list to
facilitate and is concerning as priority should be given to the more desirable applicants which is prioritise the most deserving for human settlements opportunities.
foster the strategic drive of the province and thus put Kannaland in partisan situation for its Alternative technology to be investigated for infrastructure
partnership with development. provision which could include solar; storage tanks etc. for new
Dept. of Human housing developments
Settlements and Violent Prevention through Urban Upgrade (VPUU) initiative to be
other key role incorporated in new township establishment or housing
players development.
Enhanced service site to be promoted for the beneficiaries below
the prioritised age limit and housing development should be
utilised as economic catalyst, skills and job creation mechanism
through EPWP process.
Facilitate creation of resilient and functional settlements
Table 13: Summary of municipal overview and strategyYou can also read