Prepared by Professor William Mitchell Director February 20, 2019 Centre of Full Employment and Equity The University of Newcastle, Callaghan NSW ...
←
→
Page content transcription
If your browser does not render page correctly, please read the page content below
Objection to Development Application - DA2019/00061

                    Land: Lot 1 DP 204077

Property Address: 11-17 Mosbri Crescent, The Hill NSW 2300

              Prepared by Professor William Mitchell

                             Director

                        February 20, 2019

              Centre of Full Employment and Equity

    The University of Newcastle, Callaghan NSW 2308, Australia

            Home Page: http://www.fullemployment,net

        Contact for Report: Bill.Mitchell@newcastle.edu.au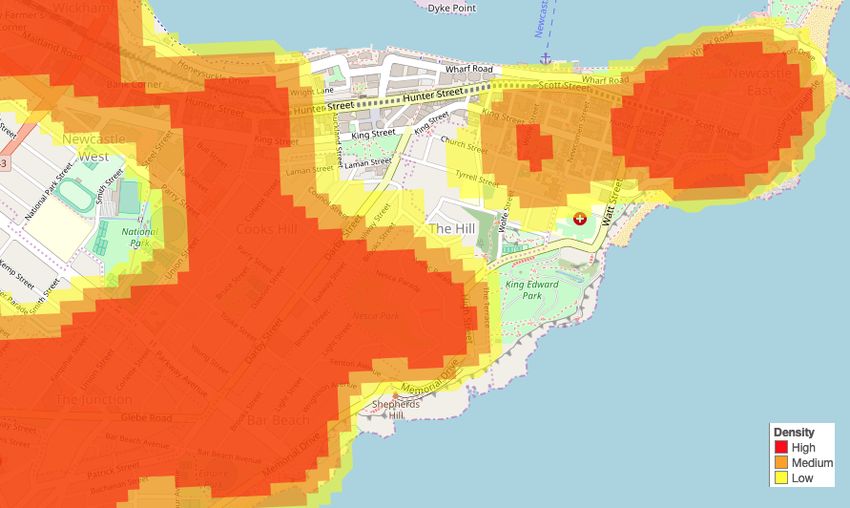
1.       Personal statement from Centre Director
The Centre of Full Employment and Equity has a long track record in producing high quality
research in the field or urban and regional studies, spatial statistics and spatial policy. It
regularly produces reports of public interest and assists communities by producing evidence-
based analysis on a range of significant policy issues.
As a professional economist and Director of the Centre, I have have won several million dollars
in grants under competitive funding schemes such as the Australian Research Council in the
field of urban and regional studies and spatial analysis.
I have been employed by several international agencies (for example, ILO, Asian Development
Bank) to assist in urban and regional development initiatives in several African, Asian and
Central Asian nations and communities.
I have a long list of internationally recognised publications in the field of urban and regional
studies.
My academic work on functional regions has been used by the Australian Bureau of Statistics
as part of the revision of the geography they use to collect and disseminate spatial data
(including the Census and the Labour Force data).
It should be made clear from the outset that when the development of NBN site was mooted I
was on the public record as supporting a Medium Density development on the old NBN site,
within the usual meaning of that terminology.
The R3 medium density residential controls are typically Height of Building (HOB) 10m and
Floor Space Ratio (FSR) 0.9:1. These settings would yield around 40-55 dwellings on the
current site.
However, this proposal will allow 172 dwellings. The discrepancy indicates that a massive
overdevelopment is being contemplated for which no convincing evidence-based justification
has ever been provided – either at the rezoning stage or in this development application.
Even with, say 55 dwellings, the local area would undergo a population increase of around 125
per cent, which is very large, given the historical experience of NSW regions.
The 172 new dwellings would generate a population increase of around 747 per cent which is
so far out of normal outcomes that it tells me, as an experienced analyst, that this is a site and
area that will become overdeveloped if this project goes ahead.
The overdevelopment will compromise a number of variables that combine to determine the
urban amenity (liveability) and the public interest.
The evidence is presented in this evaluation is consistent with the findings of the NCC Urban
Design Consultative Group, whose papers of June 15, 2016 in relation to the original proposal
to rezone the land to R3 noted that they had considered:
     §   “the site capable of bearing a moderately greater level of development than the current
         R2 [low density] zoning would permit, but considered the height and densities proposed
         under Option 3 [the NCC “approved” Option] to be somewhat excessive”.
     §   “while the site is relatively close to the original Newcastle CBD and Hunter Street,
         there is a steep ridge separating the two, which would make walking or cycling between
         the two a challenge for those who have less mobility and fitness. While pedestrian
         access to Darby Street is less challenging, even this route involves descending some 21
         meters”.

                                                                                                2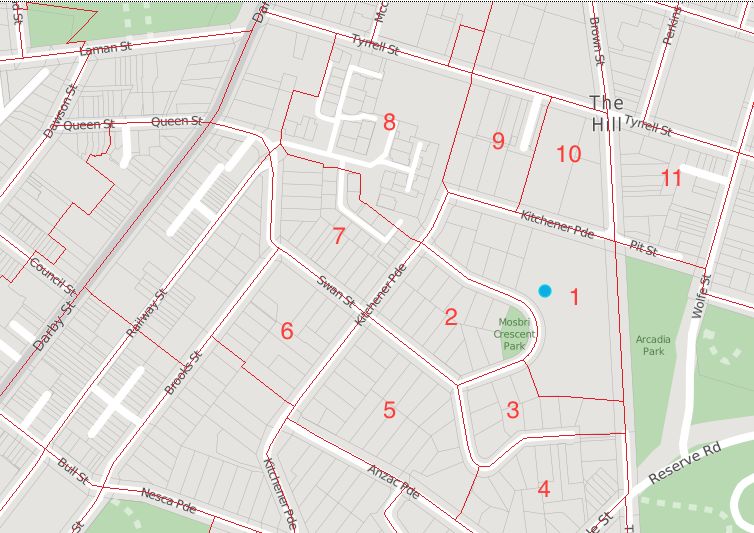
§   “the steepness of the paths and roads…is an unavoidable natural attribute of the site…it
         is one of the factors against opting for the densest zoning of the area”.

     Professor William Mitchell
     Professor of Economics
     Director, Centre of Full Employment and Equity
     University of Newcastle, Australia

     Docent Professor of Global Political Economy
     University of Helsinki, Finland

     Main contacts:
     Phone: +61 419 422 410
     E-Mail: Bill.Mitchell@newcastle.edu.au

     The author resides in Mosbri Crescent, The Hill 2300.

2.       Personal Declaration of CofFEE Director concerning probity
I have made no relevant political donations and/or gifts in accordance with the Environmental
Planning and Assessment Act 1979.

                                                                                               3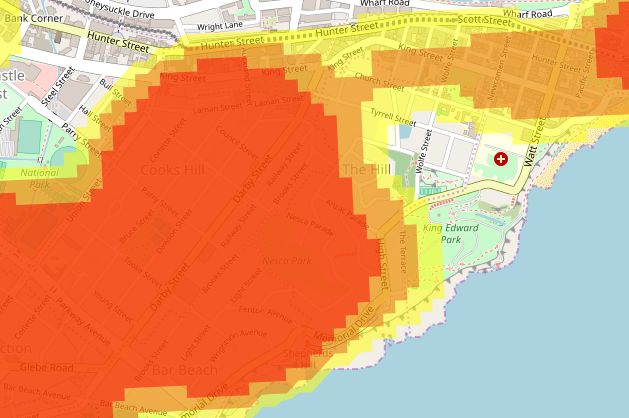
3.     Executive Summary
The evidence presented in this Report, in addition to a detailed understanding of the
characteristics of the development area, drives our strongest objection to this overdevelopment.
While the LEP provides FSR and HOB planning controls, it is only a necessary condition that
development proposals fit within those limits. They should be seen as a maximum envelope
that a proposal might sit.
However, sufficiency must be established on much broader criteria such as those outlined in
Section 4.15 of the EPA 1979. The evidence leads to the reasonable conclusion that the
proposal cannot be justified even though it falls within the FSR and HOB parameters of the
LEP.
The proposal development would generate unprecedented population growth for the local area
(both relative to other areas in the Newcastle LGA and NSW in general).
Key findings:
1. The level of population growth associated with the development will compromise the
    character and social cohesion of the tight-knit local community.
2. The development does not satisfy the objectives of an R3 Medium Density residential
    zoning or an R4 High Density residential zone.
3. The scale of the proposed development is unsuitable for the site and there is no basis for
    supporting the LEP Clause 4.6 variations requested by the DA.
4. The documentation manipulates FSRs for the site and in fact Buildings A, B and C have an
    FSR of 1.61, which is well in excess of an already inappropriate density control.
5. The heights and densities proposed by the development cannot be achieved while satisfying
    the objectives and vision of the Local Planning Strategy and this is confirmed in Council
    records.
6. There development does not represent a successful infill strategy as it overwhelms the
    locality and has a significant impact on the neighbouring Heritage Conservation Zone with
    buildings higher than Wolfe Street.
7. The systematic use of data that generates the lowest possible traffic movements means that
    the actual impact of increased traffic associated with the development is grossly
    underestimated.
8. The Crime and Safety report is incomplete as it fails to analyse the impact of the
    development on the neighbouring community.
9. The development provides no housing diversity and should be rejected on those grounds
    alone.
10. The supporting documentation fails to evaluate the impact of the development on
    surrounding properties through shade analysis.
11. The development will destroy significant remnant bushland in the inner-city and the habitat
    of a range of wildlife through the use of Arcadia Park to form an Asset Protection Zone.
    This is not an acceptable use of public land.
12. The development would impose unacceptable costs on the community and on public assets,
    in particular, Arcadia Park and the neighbouring Heritage Conservation Zone.

                                                                                              4
4. Population growth implications of the proposed development
4.1 The added local population from the development
Our analysis shows that the proposed development will generate a massive and
unprecedented population expansion in the local area, the implications of which have not
be properly analysed by the applicant or the City of Newcastle (CN).
The 172-unit proposal provides for 34 one-bedroom dwellings, 98 two-bedroom dwellings and
40 three-bedroom dwellings (including the 11 terrace houses) for a total of 350 bedrooms.
What estimated population growth would arise from a development of this scale?
We constructed a profile of The Hill from the 2016 Australian Census of Population and
Housing to provide a reasonable estimate of the increase in population that could be expected.
We chose all households types that reported incomes in the decile that covers the ABS SA2
regions (within which The Hill lies) in the 2016 Census. 942,804 households were used to
construct the profile.
The profile weighted numbers of adults and children in each household type to construct a
representative household.
The result was that on average each household contained 2.58 persons overall with 0.85
children per household.
The proposed 172 dwellings would thus result in an estimated 294 adults and 146 children
being added to the local community – a total of 444 new residents.
This is likely to be a conservative estimate.
4.2 The current population in the immediate area
The smallest region for which the ABS disseminates Census data is the Mesh Block. The
following (numbered) map shows the Mesh Blocks in the development area and the immediate
vicinity.
The Mesh Blocks are delineated by the red boundary lines and they have been numbered for
analytical convenience.
The accompanying Table 1 lists the descriptive characteristics of the numbered Mesh Blocks.
Region 10 is the Newcastle East Primary School.
Some facts:
1. The average population density for the 68,986 Residential Mesh Blocks in NSW where the
population exceeded 20 was 5,236.3 persons per square km in 2016.
2. The average number of dwellings was 40.2.
3. The average persons was 98.2.
4. Examining the 1,416 Residential Mesh Blocks in the Newcastle LGA, which recorded
populations in both the 2011 and 2016 Census the average population density was 3,667.
Obviously, the current density of the Development Mesh Block is lower than the surrounding
Mesh Blocks, as a result of the presence of the NBN facility.
5Figure 1 Mesh Blocks in the Mosbri Crescent vicinity
Source: ABS Census of Population and Housing, 2016.
http://stat.abs.gov.au/itt/r.jsp?ABSMaps
6Table 1 Mesh Block characteristics, The Hill, 2016
ID ABS Mesh Block Category Area Dwellings Persons Density
Code km2 (persons
per km2)
1 10542580000 Residential 0.0224 44 59 2,633.9
2 10544960000 Residential 0.0136 34 66 4,852.9
3 10543120000 Residential 0.0092 23 50 5,434.8
4 11205460700 Residential 0.0162 37 80 4,938.3
5 11205460600 Residential 0.0201 52 75 3,731.3
6 11205478800 Residential 0.0126 34 50 3,968.3
7 10540590000 Residential 0.0137 22 51 3,722.6
8 11205126900 Residential 0.0232 33 58 2,500.0
9 11205402100 Residential 0.0097 38 81 8,350.5
10 10545320000 Education 0.0098 0 0 0.0
11 10539750000 Residential 0.0217 37 77 3,548.4
Source: ABS Census of Population and Housing, 2016. Author’s own calculations.
4.3 The population growth accompanying the development
The population growth that will follow the development at 11-17 Mosbri Crescent, will
be unprecedented and establishes the conclusion that the proposal represents a gross
overdevelopment of the area concerned.
Table 2 estimates the population growth following the development using the estimated
population increase outlined in Section 3.1. We also used a simple ‘one-person, per bedroom’
assumption to provide a lower bound.
Table 2 Estimated population growth following development
Mesh Block Population Population Population Growth
Area(s) in Increase before after (per cent)
Figure 1 Assumption (Actual 2016)
1 444 59 503 752.5
1+2+3+5 444 250 694 177.6
1 350 59 409 593.2
1+2+3+5 350 250 600 140.0
The results confirm that the development will generate growth beyond that evidenced in any
Mesh Block in the Newcastle LGA (Figure 2).
7Figure 2 relates the likely population growth rates to the growth rates of Newcastle LGA Mesh
Blocks between 2011 and 2016?
The average population growth for 1,423 Residential Mesh Blocks in the Newcastle LGA
between 2011 and 2016 (where population was positive in both Census years) was 3.6 per cent.
Of the Mesh Blocks with positive population growth between 2011 and 2016, the average was
15.6 per cent.
The population growth in the development Mesh Block (10542580000) was -7.81 per cent (a
decline of 5 persons between the Census collections).
Figure 2 demonstrates how significant an outlier the population growth in the development
Mesh Block and surrounding areas would be following the proposed development.
As we will see in a later section of this Report, this sort of rapid and substantial population
growth is typically detrimental to a local community.
Figure 2 Newcastle LGA Mesh Block Population Growth 2011-2016 with simulated post
development growth for Mesh Block 10542580000
Source: ABS Census of Population and Housing. Author’s own calculations. See Table 2 for
assumptions.
One might argue that it would be better to compare the population growth of the Mosbri
development Mesh Block with the growth in all NSW state MBs.
Figure 3 presents this comparison. The Mosbri Development Mesh Block would be the 10 th
fastest growing Mesh Block in NSW when compared to the 2011-2016 growth rates.
Thus, while the implied growth that would arise from the development in Mosbri Crescent is
not the stark outlier that it was when considered within the Newcastle LGA, it is still highly
significant.
8Of course, one should really compare like with like. To ensure we understand what these
specific regions look like, we did a detailed analysis of location, zoning, planning controls and
spatial features for each.
The results confirm that the Mosbri Development Mesh Block bears little resemblance to the
features of these other high growth Mesh Blocks, which are mostly located in the Greater
Metropolitan Sydney region.
Thus, broadening the analysis to all of NSW, still leaves us with the conclusion that the
proposed development will generate unprecedented population growth in the local
community.
Many of the Mesh Blocks that reported higher population growth rates in the intercensal period
are zoned as B2 Local Centre, B4-Mixed Use, B5 Business Development, B8-Metropolitan
Centre, and R4 High Density.
For example, the highest growth Mesh Block shown in Figure 3 is located in Wooli Creek
directly opposite Sydney Airport. The area of the region is around 50 per cent larger than the
Mosbri Development Mesh Block area and is allowed an FSR twice as large. It is located in an
area with broad street access.
Further, of those which are classified R1-General Residential, several are greenfield outer
suburban locations in Sydney, with significantly larger land areas than the Mosbri
Development Mesh Block area. The classic urban sprawl developments.
Finally, the R3 Medium Density Mesh Blocks with high growth rates are typically 5-6 storey
developments with Height of Buildings restricted by the planning controls to be between 9 and
12 metres and FSR ratios of between 0.5 to 1.
Figure 3 NSW Mesh Block Population Growth 2011-2016 with simulated post development
growth for Mesh Block 10542580000
Source: ABS Census of Population and Housing. Author’s own calculations. See Table 2 for
assumptions.
9The only reasonable conclusion is that the proposed Mosbri Development has
characteristics that resemble a high-density development rather than a typical medium
density project. But in saying that many of the high growth, high density regions in
Sydney actually have lower heights and densities that are being proposed in this
Development proposal.
Further, in order to satisfy the objectives of an R4 Residential zoning, development must
“provide for commercial development that contributes to the vitality of the street
where provided within a mixed use development”. This DA thus satisfies neither the
R3 or R4 objectives.
The detailed analysis of these ‘high growth’ Mesh Blocks is presented in Appendix A. It is
clear from this detailed analysis that the Mesh Blocks that had stronger population growth or
similar population growth to what would be experienced if this proposal goes ahead are not
comparable to the Mosbri Development Mesh Block.
This is an unprecedented high-density development masquerading as a Medium Density
project in terms of the controls that would reasonably be expected to accompany such
development.
The evidence supports a conclusion that the project is proposing excessive development
for this relatively enclosed area.
105. The FSRs on Buildings A, B and C indicate overdevelopment
While the proponents claim in the Statement of Environmental Effects that with a proposed
FSR of 1.46:1, “the proposal complies with the FSR requirement” of the relevant LEP 2012,
the relevant point is that the ‘permitted’ density is not to be seen as a hard and fast goal to
reach.
Along with the HOB controls, the LEP defines a maximum envelope in which the development
must be assessed.
The fact that a development proposal conforms with the planning controls set out in the LEP
with respect to FSR and HOB requirements is only a necessary condition for approval. It is not
a sufficient condition.
Further, it is clear that the overwhelming proportion of the land being developed in this
proposal would exceed reasonable density levels, especially in a medium-density setting.
The DA proposal, in fact, comprises two separate proposals:
1. 4239A Newcastle – Crescent Newcastle Pty Ltd (Bld A,B,_02 – 161 units on a site area of
10,032 square metres.
2. 4239A Newcastle - Crescent Newcastle Pty Ltd (Townhous_02 – 11 Townhouses on a site
area of 2,203 square metres.
We calculated the FSRs for each component of the development using the floor space data
provided in the proposal and the areas noted above (see Table 3 for calculations).
The Buildings A, B and C Project cover 82 per cent of the total area for the proposed
development.
The FSR for this part of the development is 1.61, over the planning controls, indicating
that the area is being overdeveloped by several storeys, even if the overall project falls
within the development controls.
Table 3 Areas, GFAs, and FSRs relating to the proposed development
Project Building A, B and C
Site area (m2) 10,032
Proportion of total area (per cent) 82.0
GFA (m2) 16,186
FSR 1.61
Project Town Houses
Site area (m2) 2,203
Proportion of total area (per cent) 18.0
GFA (m2) 1,626
FSR 0.74
Total
Total area (m2) 12,235
Total GFA (m2) 17,812
Total FSR 1.46
116. Previous Council analysis and opinion
The Local Planning Strategy (LPS) identifies 11-17 Mosbri Crescent as suitable for
redevelopment opportunities and makes estimates regarding the forecast population growth
and associated number of dwellings required.
The LPS forecasts that an extra 27 people will live in The Hill by 2031, and that an extra 39
dwellings will be required to support the population. It suggests investigating an R3 Medium
Density zone for this site due to its proximity to the mall.
However, the rezoning process and related documents reveal a number of issues associated
with assumptions about the site and accessibility, and therefore its capacity to support intensive
redevelopment of the kind proposed in the current DA.
Council records released through a GIPA process that I have studied show that the consistent
view of Council Officers, the Urban Design Consultative Group, and the LEP Advisory Panel,
was that a scale of six storeys was considered appropriate for the site, and an FSR of closer to
the R3 Medium Density standard of 0.9:1. These were the controls considered appropriate in
order to satisfy the objectives of the LPS.
The UDCG made the point that although the site is centrally located when viewed on plan, it
is surrounded on three sides by steep topography, which limits pedestrian access in all
directions. This group concluded that these features are unavoidable and are “one of the factors
against opting for the densest zoning of the area”.
In fact, the maximum height proposed by the current DA (RL59.5) was explicitly rejected by
the Newcastle Council in February 2016 and the applicant was required to make a number of
subsequent reductions to the HOB controls.
Newcastle Council records indicate that there is no basis for supporting the LEP Clause
4.6 variations requested by the DA and suggest that the site should support buildings of
no more than six storeys.
127. Sensitivity analysis for alternative floor plans
7.1 FSR changes with alternative floor plans
Table 4 simulates the changes in the FSR that would arise if the project was modified to reduce
the number of floors in Building A and Building B and deal with what is unambiguously an
over-development of the area.
Column one lists different configurations of floors for Buildings A, B and C.
The current proposal can be defined as 9/7/5 (which includes the Ground floor).
The alternatives 5/4/4, 6/5/4, 6/6/4, 7/5/4 and 7/6/4 relate to the number of floors in each of
Building A, B and C, respectively.
For example, the 5/4/4 alternative would see 5 floors (including ground) in Building A and 4
floors in Buildings B and C, respectively.
The FSR columns reflects the changing Gross Floor Areas for each of the alternatives (which
include the 11 Terrace Houses). The first FSR column computes the ratio using the GFA of the
Buildings A, B and C taken together expressed as a proportion of the area occupied by these
buildings.
The Total FSR column shows what the overall FSR for the Project would be under each of the
alternative scenarios.
Table 4 Impact on FSR of modifying the number of floors in Buildings A and B.
FSR Total FSR Dwellings With Terrace Total
Buildings A, A+B+C Houses Dwellings
B and C areas
Proposal 1.613 1.46 161 11 172
(9/7/5)
5/4/4 0.965 0.92 96 11 107
6/5/4 1.172 1.09 117 11 128
6/6/4 1.272 1.18 127 11 138
7/5/4 1.230 1.14 123 11 134
7/6/4 1.330 1.22 133 11 144
Observations:
1. The option that is most closely aligned to what a R3 Medium-density development looks
like throughout NSW (in Sydney and regional towns) is the 5/4/4 option, which would add
107 new dwellings to the Mosbri site and increase the population density of the local area
significantly.
2. At present, the population density of the Mosbri Development Mesh Block is 2,663 persons
per square km. The 107 new dwellings, assuming the profiling we outlined earlier, would
increase the population density for this Mesh Block to 14,888 persons per square km.
3. One could not suggest that this is not a significant infilling of the inner-city area nor that
the local community was not sharing in the goal of population in-filling.
4. By way of contrast, if the current Development proposal was to proceed the population
density in the Mosbri Development Mesh Block would rise to a staggering 22,321 per
square km. This is the sort of density one sees in R4 High Density areas.
137.2 Population growth and density changes with alternative floor plans
Table 5 shows the estimated changes in population growth and population density in the
Development Mesh Block under the different floor assumptions shown in Table 4. These
calculations are for the entire project including the Terrace Houses.
Table 5 Sensitivity of population growth and density for the Development Mesh Block
Different Total Dwellings Implied Population Implied Population
Floor Growth (per cent) Density (Persons per
Assumptions km2)
Existing 2633.9
Proposal 172 752.5 22455.4
5/4/4 107 467.90 14958.0
6/5/4 128 559.73 17376.8
6/6/4 138 603.46 18528.6
7/5/4 134 585.97 18067.9
7/6/4 144 629.69 19219.6
Source: Author’s calculations. See Table 4 and discussion for assumptions.
Observations:
1. Even with Building A having 5 floors including the Ground Floor and Buildings B and C
having on 4 floors including the Ground Floor, the population growth for the Development
Mesh Block would be unprecedented.
2. The Population Density would rise significantly (5.6 times) and be the most dense Mesh
Block in the immediate vicinity by some margin.
3. A 5/4/4 configuration would still represent a massive infill of the local area relative to other
localities in the region and state.
148. The problem of such rapid population growth in a small community
We have presented the detailed population analysis associated with the proposed project
because it bears on important developmental principles that the Council has to consider when
assessing this proposal.
Under Section 4.15 (subsection 1) of the EPA Act 1979 No 203, the “consent authority” must
consider various items (none of which appear to be privileged over others), which include:
(b) the likely impacts of that development, including environmental impacts on both
the natural and built environments, and social and economic impacts in the locality,
(c) the suitability of the site for the development,
(d) any submissions made in accordance with this Act or the regulations,
(e) the public interest.
The proposed development is seen by Council (according to their statements with respect the
initial rezoning of 11-17 Mosbri Crescent) to be part of their urban consolidation policy.
While spot rezoning is taking place on an increasing basis as developers attempt to subvert the
Development Application process by pushing through ‘low-doc’ rezoning, there is still a
broadly accepted view of what constitutes Medium-density development.
The NSW Department of Planning and Environment Medium-density design guide (2016) says
it provides “consistent planning and design standards for low rise medium density resident
dwellings in NSW”.
Such development usually restricts height to less than 10 m and results in a “net density of 25-
45 dwellings per hectare”.
The strategy indicates that “good design” is necessary to create “sustainable and liveable
communities”.
Context is considered crucial and good design has to fit into the character of the existing
neighbourhood.
It is clear the proposed development will be a monolithic outlier in the locality and not
enhance the qualities of the local environment.
The design principles supplied by the DPE also state that:
Good design achieves a scale, bulk and height appropriate to the existing or desired
future character of the street and surrounding buildings.
Urban consolidation is about increasing density in urban areas to better use the current
infrastructure and amenities.
But it can only be beneficial if it doesn’t degrade the lived environment of the area, which
includes that of current residents.
Rod McCrea and Peter Walters 2012 article 'Impacts of Urban Consolidation on Urban
Liveability: Comparing an Inner and Outer Suburb in Brisbane, Australia’ (published in
Housing, Theory and Society, Vol 29, No 2, pp. 190-206) note that (p.191):
Ideally, urban consolidation also caters for commercial and retail activities in mixed
use developments; local employment and amenity; social diversity; housing mix; better
public transport; and more walkable, safer communities.
15Our research finds that the scale of the proposed development does not achieve these
goals nor does it satisfy the statutory requirements laid out in Section 4.15 (1) of the EPA
Act 1979 No 203.
An important aspect of urban consolidation is the concept of urban liveability, which relates to
what McCrea and Walters call the “overall quality of life (QOL) for residents living in urban
environments” (p.192).
There is an extensive research literature considering the concept of urban liveability and the
impact of rapid population growth on the generalised well-being of local communities.
The literature provides extensive coverage of the way that cities are pursuing development and
in-fill based on sustainability of development and quality of life for the residents – and provide
examples of good practice and bad practice.
The Development Proposal in question would constitute, on the balance of this evidence, bad
practice.
In-fill has to guard against overdevelopment. The global challenge for cities is to
understand that so-called ‘market interests’ (profit for developers and financiers)
typically run counter to the liveability needs of local residents.
There is a very deep literature exploring that conflict in objectives.
At the forefront of these considerations is the concept of ‘liveability’, which is notoriously
difficult to pin down, given that it involves both objective (measurable) and subjective (difficult
or impossible to measure) components.
There is, however, agreement that liveability is compromised by major developments through
demographic change (population growth and related characteristics) which upset a local
community balance; high-rise dominance in a predominantly low-rise neighbourhood;
shadowing from high-rise building altering the natural ambience of a locality, the impacts of
density on traffic and pedestrian congestion, noise, access to amenities, increased crime rate or
fear of crime, neighbourhood diversity and continuity, and more.
Successful infill strategies must involve the co-operation of the existing residents. Problems
are always encountered when top-down impositions are made which change the lived
experience of existing residents.
If a local area is not rated highly on a liveability index then the mobile population will leave
the region and the hollowing out usually brings new problems.
See Glen Searles 2010 article ‘Too concentrated? The planned distribution of residential
density in SEQ’ that was published in Australian Planner (Vol 47, No 3, pp. 135–141) for more
on the dangers of urban infill strategies.
It is also important to appreciate the nature of community that resides in the area of the
proposed development area. Residents are a diverse mix of working and retired people and
reflect a broad range on the socio-economic spectrum.
There is a high proportion of lower income residents in the area despite the overall average
income in The Hill being skewed by some high income residents residing above the ridge.
We assess that the proposed development is of a scale, bulk and height that renders it totally at
odds with the existing character of the street and the surrounding buildings.
There is no congruency at all between the proposed new construction and the extant built
environment.
16This violates the DPE’s own best-practice principles.
Further, good design also “positively influences internal and external amenity for residents and
neighbours”.
The proposed development application makes little reference to the existing neighbourhood
and the way in which the existing residents will view the massive construction at the end of a
quiet, narrow street.
It is clear that there is a tight knit community here with many long-term residents providing
various levels of support to each other which is highly valued. This includes seemingly trivial
functions such as sharing equipment, watering gardens during vacation periods, bringing in
rubbish bins, helping out when illness arises, and more.
While seemingly mundane, this cooperative spirit is what makes a neighbourhood liveable.
Imposing approximately 440 additional people to such a neighbourhood, especially in a
monolithic development that will literally look down on the rest of the housing, will introduce
fracture lines to the community.
The proposed development is clearly of a large enough scale that we would expect the
following issues to arise:
1. During the construction phase the local residents will be subjected to noise, dust pollution,
heavy trucks moving through the already crowded and narrow streets, which means there
will have to be traffic constraints operating for extended periods.
2. Compromises to visual and acoustic privacy in the neighbourhood.
3. The ‘good access to sunlight’ amenity will be compromised for several residences in the
street.
4. Increased fear of crime and safety compromises.
5. Increased demand for on-street parking in an area already unable to cope with existing
demand.
6. Increased traffic congestion – residents already have to exercise significant caution leaving
their properties due to difficulties in siting the traffic flow (parking etc), and coming into
and out of the street from Kitchener Parade.
We provide some analytical rigour to some of these issues in the sections of this Report that
follow.
179. Traffic and parking
9.1 Traffic movements
Section 9.0 of the Traffic and Parking Report, provided in the suite of development application
documents, utilises the RTA’s Guide to Traffic Generating Developments to estimate the likely
extra traffic movements arising from the proposed development.
It is interesting that while the Development Application holds itself as a Medium-Density
development, the Traffic and Parking Report utilises data from the RTA Guide applicable to
“High density residential flat dwelling” (August 2013 RTA Technical Direction update
document).
Further, the more detailed ‘regional’ estimates produced in the RTA Guide were derived from
RTA survey analysis in Charlestown (Hunter) and Wollongong. In the former case, the
surveyed property had 108 units with around 209 bedrooms and 113 parking spaces, while the
Wollongong survey watched a 9-unit property with around 27 bedrooms and 19 parking spaces.
Again, it is interesting to note that the Charlestown development with just 108 units is
considered ‘High Density’ by the RTA, whereas the proposed Mosbri Crescent development
with 172 units is classified as ‘Medium Density’, which tells us how fraught the spot rezoning
decisions can be in terms of general perceptions about development controls and the objectives
associated with each zone.
RTA averages the observations and converts them into rates, which the Traffic and Parking
Report then scaled up to the appropriate dimensions of the proposed Mosbri Crescent
development.
We could question the applicability of Charlestown as an information-generating suburb to
driving behaviour in The Hill.
However, there are more disturbing features of the way the Traffic and Parking Report has
applied the rates derived from the RTA surveys.
Effectively, the Traffic and Parking Report scales up the rates provided by the RTA surveys.
It takes the ‘average’ regional rates, which are a simple average of the two regional RTA survey
sites – Charlestown and Wollongong.
Table 6 presents the detailed RTA rate estimates across a range of ratios. The first thing that
we note is that the rates have considerable variation across the three denominators (per Unit,
per Car Space, and per Bedroom) for each concept (AM Peak Person, PM Peak Person, Daily
Person Trips, AM Peak Vehicle Trips, PM Peak Vehicle Trips, and Daily Vehicle Trips).
This brings into question the validity of the exercise.
On what basis should the denominator we use be selected?
Further, as we demonstrate in the next two figures (Figures 4 to 6), the Traffic and
Parking Report uses the RTA rates, which systematically generate the lowest traffic
movements. It provides no justification for this practice.
As we will see, the variation in estimated traffic movements derived from these rates for an
equivalent concept is significant in terms of vehicle movements per hour.
These qualifications are ignored by the Traffic and Parking Report which clearly wants to
present only the most favourable outcome with no sensitivity analysis to blur the picture.
18Table 6 RTA guide to traffic movements, rates
Charlestown Wollongong Average
Weekday
AM Peak Person Trips per Unit 0.53 0.89 0.71
AM Peak Person Trips per Car Space 0.62 0.53 0.58
AM Peak Person Trips per Bedroom 0.27 0.30 0.29
PM Peak Person Trips per Unit 0.65 1.11 0.88
PM Peak Person Trips per Car Space 0.65 1.11 0.88
PM Peak Person Trips per Bedroom 0.33 0.37 0.35
Daily Person Trips per Unit 6.03 8.67 7.35
Daily Person Trips per Car Space 5.76 4.11 4.94
Daily Person Trips per Bedroom 3.11 2.89 3.00
AM Peak Vehicle Trips per Unit 0.39 0.67 0.53
AM Peak Vehicle Trips per Car Space 0.37 0.32 0.35
AM Peak Vehicle Trips per Bedroom 0.20 0.22 0.21
PM Peak Vehicle Trips per Unit 0.42 0.22 0.32
PM Peak Vehicle Trips per Car Space 0.40 0.11 0.26
PM Peak Vehicle Trips per Bedroom 0.22 0.07 0.15
Daily Vehicle Trips per Unit 4.37 4.78 4.58
Daily Vehicle Trips per Car Space 4.18 2.26 3.22
Daily Vehicle Trips per Bedroom 2.26 1.59 1.93
Saturday
Peak Hour Person Trips per Unit 0.61 1.89 1.25
Peak Hour Person Trips per Car Space 0.58 0.89 0.74
Peak Hour Person Trips per Bedroom 0.30 0.59 0.45
Daily Person Trips per Unit 4.71 10.56 7.64
Daily Person Trips per Car Space 4.50 5.00 4.75
Daily Person Trips per Bedroom 2.44 3.52 2.98
Peak Hour Vehicle Trips per Unit 0.39 0.78 0.59
Peak Hour Vehicle Trips per Car Space 0.37 0.37 0.37
Peak Hour Vehicle Trips per Bedroom 0.20 0.26 0.23
Daily Vehicle Trips per Unit 2.33 3.67 3.00
Daily Vehicle Trips per Car Space 2.23 1.74 1.99
Daily Vehicle Trips per Bedroom 1.21 1.22 1.22
19Further, such an average is fraught, given the totally different characteristics of the two
surveyed sites.
Given that the Charlestown is a high-rise development and the Wollongong site is more akin
to the Terrace House component of the proposed development, it would have been more
appropriate to decompose the average before we scale the RTA rates by the parameters of the
proposed development, although the differences will not be all that significant.
As an aside, there were arithmetic errors in the Traffic and Parking Report.
For example, it estimates only 53 vehicle movements per hour by scaling the average per
bedroom (0.15) in Table X-1 by 350.
This calculation is incorrect. The correct arithmetic result is 51 vehicle movements per hour.
Similarly, the calculation for Daily vehicle trips per bedroom of 676 is also incorrect. The
correct arithmetic result is 674.
But the real issue, aside from the considerable range in estimates for each measure, depending
on whether one used the Charlestown, Wollongong or average of the two, is the bias in
reporting, where the Traffic and Parking Report deliberately presents the estimate for each
ratio that will deliver lower traffic movements.
No justification is given for this choice and we are left with the impression that the Traffic and
Parking Report deliberately chose to present the development in the best possible light without
taking into account the possible variations.
Figure 4 Estimates of Vehicle Trips Per Hour - AM and PM - Weekdays
Source: RTA Guide to Traffic Generating Developments, August 2013 Update. Author’s
calculations.
Figure 4 shows the variation in traffic movement if we use the RTA averages across the three
denominators (per Unit, per Car Space, and per Bedroom).
The Traffic and Parking Report choices are in green.
20If we used the RTA average for Peak Hour Vehicle Trips per unit, we would estimate that there
would be 91 AM Peak Vehicle Trips per hour rather than the 74 as is assumed by the Traffic
and Parking Report.
That is, a difference of 23 per cent.
The differences in the PM Peak Hour estimates are less but there would still be 8 per cent more
traffic coming into the area than the Traffic and Parking Report estimates.
Figure 5 shows the estimates for Saturday (weekend) traffic, which the Traffic and Parking
Report completely ignores but which will result in detrimental changes to the character of the
locality and the liveability enjoyed by the current residents.
At present there is very little traffic at weekends. As Figure 5 shows this will change
dramatically.
The Peak Hour movements will exceed those on weekday AM peaks.
Figure 5 Estimates of Vehicle Trips Per Hour - Peak Hour - Saturday
Source: RTA Guide to Traffic Generating Developments, August 2013 Update. Author’s
calculations.
Finally, Figure 6 compares the total Daily Vehicle Trips for Weekdays and Saturday based on
the RTA averages by each scaling choice
The green bar is the estimate used in the Traffic and Parking Report.
The variation in possible estimates is very large for both times of the week.
Using a per Unit scaling choice, the total Daily traffic movements are 16 per cent higher during
weekdays than if we use a per Bedroom choice.
For Saturday traffic movements, the per Unit choice generates a 21 per cent higher estimate
than a per Bedroom choice.
21Figure 6 Estimates of Daily Vehicle Trips - Weekdays and Saturday
Source: RTA Guide to Traffic Generating Developments, August 2013 Update. Author’s
calculations.
The conclusion we reach is that the Traffic and Parking Report fails to fully analyse the
situation that will be encountered by residents in the locality of the proposed development.
Further, the 2016 Census of Population and Housing tells us that The Hill has the following
characteristics with respect to travel to work (see Table 7).
Table 7 Travel to work modes, The Hill
Travel to work mode The Hill % NSW %
Car, as driver 721 61.5 1,953,399 57.8
Walked only 144 12.3 130,957 3.9
Car, as passenger 46 3.9 144,820 4.3
Worked at home 37 3.2 163,026 4.8
Bus 24 2.0 133,903 4.0
Travelled to work by public transport 46 3.9 540,215 16.0
Source: ABS Quick Facts, 2016 Population and Housing Census.
If we model that data, scaling it to the impact of the population arising from the development
it is likely that the RTA estimates of vehicle movements will significantly understate the reality
that will arise.
22This is, in part, because the scale of the development and the implied population increase is so
large.
These shortcomings are exacerbated by the flow analysis that the Traffic and Parking Report
proffers.
Here, the ABS Journey to Work data from the 2016 Census is relevant.
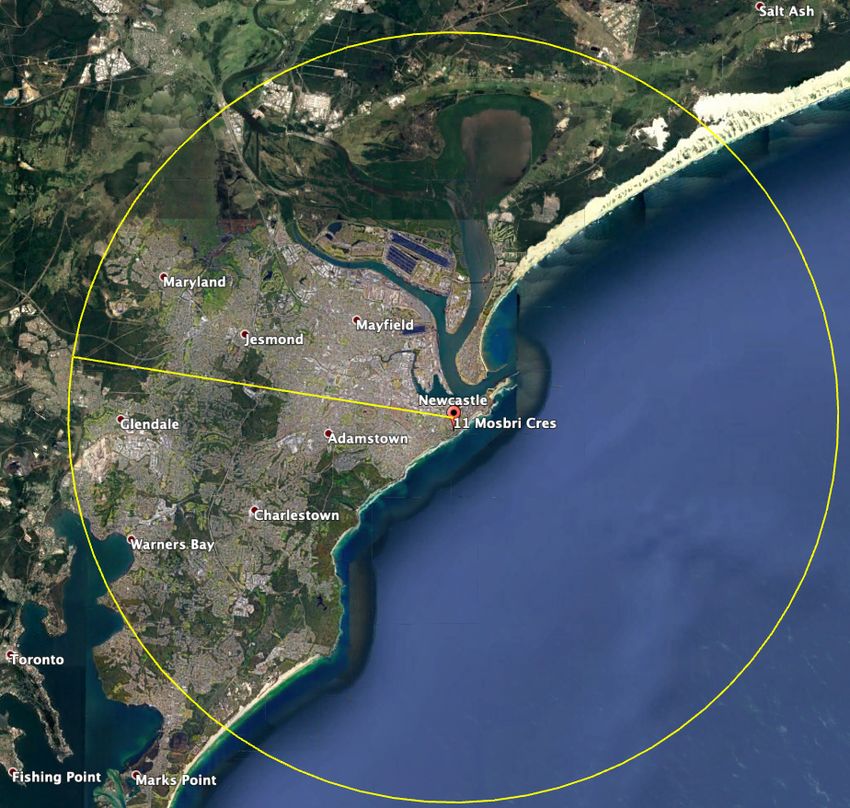
On average, the ABS estimates that a worker in the Newcastle-Cooks Hill SA2 region
commutes 14.85 kms per trip.
The dominant employers in the region are the Health system (John Hunter), the University,
Charlestown Square, and the Williamtown defence facility, which would explain this average
commuting result.
But it means that most of the outflow is heading for areas well beyond The Hill (see Figure 7)
Figure 7 Average Journey to Work radius map, The Hill, kms
Source: ABS 2016 Census of Population and Housing, Journey to Work.
This renders the AM and PM traffic flow analysis presented in the Traffic and Parking report
(Section 10 Trip Distribution) highly questionable.
23The Traffic and Parking Report states:
This involves making assumptions as to distribution patterns to and from the
development based on likely origin / destinations and trip making decision making.
The resulting analysis based on those assumptions has been clearly performed by a person
unfamiliar with the traffic patterns in the area. The assumptions bear little relationship to lived
reality of residents who live in that area.
First, there is no traffic flow indicated for Brooks Street, which is a major outlet for traffic
heading East out of the Mosbri Crescent area. Virtually no-one would use the left-hand turn
into Darby Street to head towards The Junction or the beach suburbs to the East of The Hill.
Second, twice as much traffic is assumed to head up the Kitchener Parade hill (right-turn out
of Mosbri) in the morning. Where is this flow of traffic going? Given the commuting patterns
established by the ABS Journey to Work data, very few commuters would drive that route to
get to the wider Newcastle-Lake Macquarie district.
The map below – which depicts the 14.85 average trip radius from the development site. It is
highly unlikely that very much of the commuting traffic will take a route out to the broader
region from the Development other than down Mosbri, into Kitchener, into Swan (one way or
the other) and down to Derby or Brooks Street.
The flows going back over The Hill are unlikely.
We conclude that the assumptions are deeply flawed and lead to spurious reasoning about the
likely traffic flows.
9.2 Parking
The development proposal states that the proposed Buildings A, B and C will provide 196 car
parking spaces for residents and the Terrace Houses will provide 11 spaces (one for each
residence).
This means that the local streets will have to absorb the surplus of cars that are likely to be
associated with the residents in the resulting development.
The 2016 Census of Population and Housing indicates that the trend to 1 and 2 motor vehicle
households grew dramatically between 2011 and 2016.
The ABS report that:
In The Hill (State Suburbs), 43.7% of occupied private dwellings had one registered
motor vehicle garaged or parked at their address, 34.4% had two registered motor
vehicles and 10.3% had three or more registered motor vehicles.
http://quickstats.censusdata.abs.gov.au/census_services/getproduct/census/2016/quick
stat/SSC13826
If we extrapolate that to the proposed development, the obvious conclusion is that the
number of car parking spaces provided for is deficient given the excessive scale of the
development (see Table 8).
The corollary is that there will be significant spill overs of parking demands in the
immediate streets.
24Table 8 Car Parking provision and estimated representative car ownership
Development proposal provision (spaces)
Buildings A, B and C 196
Terrace Houses 11
Total 207
Estimated car ownership (numbers)
1 car 43.7% 75
2 cars 34.4% 118
3 cars or more 10.4% 54
Expected Total 247
Shortfall 40
Source: DA documents, ABS Census of Population and Housing. Author’s own calculations
The problem is that Mosbri Crescent already endures a significant car parking problem where
residents have to compete with commuters for spaces during the day time hours. This
competition for space often results in commuters parking across entrances and driveways to
existing dwellings.
The expected parking overflow from the proposed development will exacerbate this
problem by further reducing the parking amenity available to existing residents in the
locality.
It will also impact of in-commuting workers who use the parking spaces in Mosbri Crescent
and who have already faced a squeeze on parking capacity as a result of developments
elsewhere in the city.
2510. Crime and Safety
A significant aspect of liveability is the sense of safety and security that a community enjoys
and feels.
There are both objective dimensions (the actual crime incidence) and subjective dimensions
(fear of crime incidence) that impact on this sense of safety and security.
Data from the NSW Bureau of Crime Statistics and Research (BOCSAR) show that the
Newcastle LGA ranks in the Top 10 of the 129 NSW LGAs for overall crime incidence.
Figure 8 shows the NSW ranking of the Newcastle LGA in 2017 for the crime categories for
which BOCSAR collect statistics.
Figure 8 Newcastle LGA crime rankings, 2017
Source: BOCSAR.
It is clear that in many of the crime categories, the Newcastle LGA ranks highly when
compared to all other NSW LGAs.
On September 7, 2017, BOCSAR released a press released entitled “Crime falling but not in
Newcastle and Broken Hill” and noted that:
Crime across most of NSW has remained stable or fallen over the last two years.
Consistent with the State pattern, crime is either stable or in decline across most of regional
NSW.
The NSW region with the most major crimes increasing is the Newcastle and Lake Macquarie
Statistical Area.
26Newcastle LGA itself has significant increases in five major offences including sexual assault
(up 13.1%) and indecent assault (up 26.9%).
https://www.bocsar.nsw.gov.au/Documents/RCS%20Revised/NSW_Recorded_Crime_June_2
017%20REVISED.pdf
More recently, for example, BOCSAR’s NSW Recorded Crime Statistics (September Quarter
2018) reports that over the 60 months to September 2018, the average annual percentage
change in property offences in the Newcastle LGA has risen by 5.3 per cent (1.9 times the
NSW rate).
BOSCAR also allow us to drill down further into the suburban localities of this crime
incidence.
For example, in terms of Motor vehicle thefts and House break-ins, the following hotspot maps
show that the Development (11-17 Mosbri Crescent) is located near to high and medium
density crime spots (see Figures 9 and 10).
Newcastle Council’s own Safe City Plan 2017-2020 identifies “Key Community Safety
Challenges” (p.10) which include:
§ The presence of drugs and alcohol within the community
§ Disengaged youth
§ Discrimination and a lack of community inclusiveness
§ Fear of crime
§ Anti-social behaviour
§ The homeless community are identified as being at heightened risk of becoming victims
of crime and are therefore included in this list
Figure 9 Motor vehicle theft hotspot map, October 2017 to September 2018
Source: Boscar.
27Figure 10 Break and enter dwelling hotspot map, October 2017 to September 2018
Source: BOSCAR
There is an extensive research literature analysing the impact of rapid population growth on
small, localised communities (such as the area adjacent to the proposed development).
References can be provided on request.
The summary of the literature that is accepted as robust by professionals in the area
(criminologists, sociologists, etc) is that rapid population growth increases the crime rate (per
capita) in the local area.
The question of crime prevention falls under the Section 4.15 (subsection 1) criteria after the
Crime Prevention Legislative Guidelines were added to the Act in April 2001.
The Crime and Safety Assessment provided by KDC and included in the suite of development
application documents is notable by the relevant research literature that it omits.
It focuses entirely on the crime prevention at the actual development and ignores, completely,
the impact of the development on the local community.
It completely ignores the impacts of rapid population growth on the small, tight-knit
community that exists in the vicinity of the development.
There is an extensive research literature that is accepted by sociologists and criminologists that
documents broader impacts and these impacts are crucial in assessing the concept of urban
liveability.
According to the NSW Department of Urban Affairs and Planning (2001 document - Crime
prevention and the assessment of development applications) – which sought to clarify the
relevant provisions under the EPA Act 1979, Section 79c, now Section 4.15(1), an acceptable
28crime risk assessment must evaluate in a systematic manner “the potential for crime in an
area”.
This assessment must indicate “both the likely magnitude of crime and likely crime type”.
It outlines two essential steps in evaluating the crime risk:
§ Obtain an understanding of the crime risk in the area.
§ Apply CPTED treatments.
A crime risk assessment has to
To provide actual and perceived safe environments and minimise opportunities for
criminal and anti-social behaviour. (NSW DUAP, 2001: 1).
The CPTED analysis of the actual development site is only one aspect of that assessment. One
of the problems that the literature identifies is that an application of CPTED may not effectively
reduce crime.
There is significant evidence supporting the argument that CPTED just displaces or shifts the
crime risk associated with the rapid population growth from the ‘gated’ development to the
immediate local community.
So a massive development is like a honey pot for criminals and when they determine the risk
of criminal activity in the new development area is too high they default to the local
community, which is not protected by the CPTED principles of design and construction.
The reference to the ‘community’ is significant because it encompasses a population beyond
those who will reside in the actual development.
A development that attracts higher crime interest into a local community because of rapid
population growth should not be approved.
The Newcastle City Council Development Control Plan 2012, Section 4.00 covers Risk
Minimisation Provisions, which include Section 4.04 Safety and Security.
The essential information that is required “to be included in a Crime Risk Assessment” include:
§ Crime Risk and Opportunity – including “Identify existing and possible crime risks” and
“Analyse the types of crime that may be prevalent in the area, and to which the development
may be susceptible.” – the Crime and Safety Assessment provides no analysis.
§ Recommendations and Mitigation Measures - there is no analysis of the impact of the
development on the local community.
The Crime and Safety Assessment accompanying DA2019/00061 is thus deficient in several
ways:
1. It fails to identify the existing and possible crime risks.
2. It fails to analyse the types of crime that are prevalent in the area.
3. It fails to provide any analysis of the potential for criminal activity that is attracted to a
massive new population concentration to be diverted into the neighbouring, less secure
area.
We conclude that the Crime and Safety Assessment accompanying the Development
Application is incomplete and should be rejected.
2911. Housing diversity and key workers
The NSW Department of Planning and Environment’s briefing note - Supporting infill
affordable rental housing (August 2014) – stated that in relation to the State Environmental
Planning Policy (Affordable Rental Housing) 2009, planning processes must:
… increase the supply and diversity of affordable rental and social housing throughout
NSW.
The DPE emphasised that infill developments associated with urban consolidation must ensure
that affordable housing in existing residential areas which are accessible by public transport.
Urban consolidation has to promote housing diversity to achieve important equity goals.
Other requirements for infill developments that promote diversity include walking distance
proximity to B2 Local Centre and B4 Mixed Use zones.
Further, between 20 and 50 per cent of the gross floor area of a development should provide
for diversity of housing.
The fact is that the proposed development provides zero housing diversity and should be
rejected on those grounds alone.
Newcastle's so called price-to-income ratio (calculated by CoreLogic) is 8.3 and that ratio has
risen from 6.3 in the last decade.
What this means is that Newcastle is at the top end of the unaffordable housing category. In
terms of the Demographia Housing Affordability Index, Newcastle would sit in the top 10
alongside London and Toronto, Canada.
Demographia's analysis suggests that ratios in excess of ratios above 5.1 indicate a housing
market is "severely unaffordable".
Only Sydney and Melbourne have higher indicators of least affordable housing of the
Australian cities.
Allied to that is the fact that Newcastle’s median weekly household income was $1,368
according to the 2016 Census of Population and Housing. The corresponding figure for NSW
was $1,486 and Australia $1,438.
Further, 22.2 per cent of Newcastle households have income of less than $650 per week,
compared to 19.7 per cent in NSW and 20 per cent in Australia.
The point is that this is a lower income LGA and there is a desperate need for more low-income
accessible accommodation to ensure there is diversity of occupancy.
There is also the problem of key workers.
The concept of urban consolidation embodied in the Development Application is the anathema
of good planning.
Where urban infill creates new retail and service employment it also requires a workforce to
provide the labour supply.
With the massive population growth foreshadowed by the development, where will the key
workers who provide services to such populations live?
Apart from the construction phase, most of the jobs created servicing the larger population will
be casualised low-paid positions. The development proposal doesn’t provide for inner city
residential capacity which is affordable to these “key workers”.
30A well-thought out urban consolidation would not support a proposal where a relative few high
income earners enjoy living close to the beautiful beaches and harbour while being ‘serviced’
by a low income workforce that is ‘shipped in’ each day.
All income groups should be able to live close to these assets.
The development proposal is severely deficient in this respect.
3112. Shading
In the Urban Design Study, that was provided by Channel 9 to the Newcastle City Council as
part of their bid to rezone the land in question, a partial shadow analysis was included.
The diagrams, which showed considerable loss of sunlight throughout the day to the properties
west (downhill) from the site was accompanied by the following discussion:
At 9am in mid-winter additional shadow impact will occur in the front garden of 10
and 12 Mosbri Crescent to the south-west of the site, and 9 Mosbri Crescent to
immediately to the west. Some over-shadowing to the front garden of 19 Mosbri
Crescent will also occur …
By the afternoon (3pm) in mid-winter the shadows extend across the internal open
spaces and into Arcadia Park.
The current Development proposal provides no analysis of the impact of the reduced sunlight
in the local environment beyond the property being developed.
It also provides no analysis of the impacts of afternoon shading (westerly sun direction) on
the health and sustainability of the flora in Arcadia Park.
3213. Arcadia Park
Arcadia Park is a significant piece of remnant bushland in the inner city. It hosts a range of
wildlife including Powerful Owls, breeding birds, butcherbirds, and tawny frogmouths, parrots,
microbats, and possums. This important community asset was established in 1861 as part of
the original grant to the people of Newcastle. It forms part of the King Edward Park Headland
Reserve and it is part of the Newcastle Recreation Reserve that is being considered by the NSW
State Heritage Council for state heritage listing. Arcadia Park is currently maintained by a local
Landcare Group.
The proposed development impacts on Arcadia Park in a number of unacceptable ways. This
report will deal primarily with the DA’s suggested approaches to managing stormwater and
bushfire risk.
13.1 Stormwater
The DA proposes a pipe network to deal with stormwater that will require a depth of 5-6m
inside the park. To achieve this, major excavations will be required that will cause significant
damage to the site. The DA’s suggested solution is to raise the northern pit and pipe, and use
2m of fill to raise the level of the starting invert. This is an unacceptable level of fill and should
not be supported.
13.2 Asset Protection Zone
An Asset Protection Zone (APZ) is an area around a built asset or structure that has a reduced
fuel load. It creates a separation zone between assets and fire hazards to reduce the risk
associated with bushfires, and to provide access should the asset need defending from a fire.
The Rural Fire Service Standards for Asset Protection Zones give clear directions on this issue:
The APZ should be located wholly within your land. You cannot undertake any clearing
of vegetation on a neighbour’s property, including National Park estate, Crown land or
land under the management of your local council, unless you have written approval.
The DA proposes that a 10m APZ should be created inside the perimeter of Arcadia Park. This
means that the mature trees that host the birdlife and other animals mentioned above would not
be replaced.
In pushing the APZ on to Arcadia Park, the DA suggests that the public should offer a further
subsidy to the developer through use of the public land to reduce the Bushfire Attack Level
(BAL) rating of the buildings.
The greater the distance of the buildings from potential fire, the lower the heat flux, and
therefore the lower the required construction standards. An APZ in Arcadia Park would
significantly reduce the construction costs for the development.
The use of Arcadia Park – a precious natural public asset - as an APV for a gated community
should not be contemplated.
In forcing the APZ on to Arcadia Park, the development destroys significant remnant
bushland in the inner-city. The effect of this is to expand the site’s development potential
and reduce construction costs. This is not an acceptable use of public land.
33You can also read