Solano County 2020 Index of Economic and Community Progress - County of Solano and Solano Economic Development Corporation - Solano ...
←
→
Page content transcription
If your browser does not render page correctly, please read the page content below

1

                Solano County 2020
Index of Economic and Community Progress
  County of Solano and Solano Economic Development Corporation

                           May 2021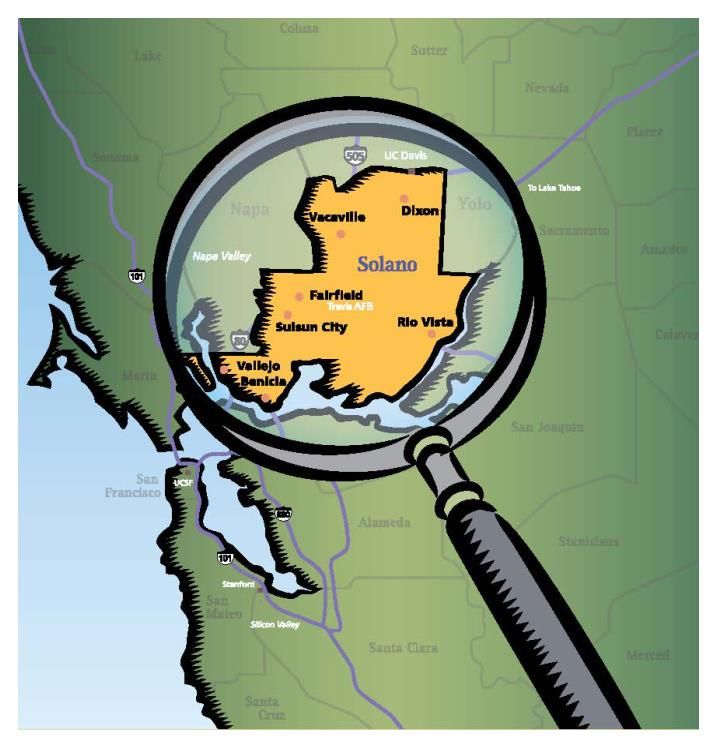
2

                          Solano County 2020
              Index of Economic and Community Progress
The Solano County Index of Economic and Community Progress is a project that was launched in 2007 after a
series of economic summits identified a need for more fact-based information to guide efforts by public and
private sector leaders to expand Solano County’s economy and support its long-term viability.

Three comprehensive editions were produced for 2008, 2009 and 2010 by the consultant Collaborative
Economics for the County of Solano and the Solano Economic Development Corporation. These insightful
documents provided an objective analysis of key indicators shaping the local economy.

In 2011, the Index became a project for County staff, in cooperation with the Solano EDC, to maintain and
update throughout the year. The Index was expanded to include comparisons in many instances to the
Sacramento Area, the Bay Area, California, and the United States. The 2012 to 2020 editions include the
objective analysis of Dr. Robert Eyler from Economic Forensics and Analytics (www.econforensics.com).

All of the annual index reports, as well as several in-depth analyses of local industry clusters, can be found at
www.solanocounty.com/economicindex.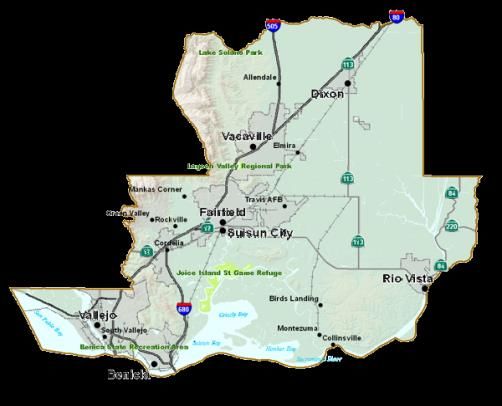
1
               Index of Economic and Community Progress

W
                e are proud to present to you the 13th annual Solano County Index of Economic and
                Community Progress. As in previous years, the intent of this report is to provide a
                “foundation” of various economic indicators, capturing trends shaping our local economy
                while providing long-term perspectives and considerations for regional economic
                development.

What makes this Index different from previous years is the impact of the COVID-19 pandemic and
regulations intending to mitigate the negative health impacts to the community. There is optimism in the
air and hope that with vaccinations and continued vigilance, we will be able to dramatically reduce the
spread of the virus and “re-open” our economy in 2021. A year of the pandemic has taken a significant toll
on the national, state and regional economies. Additional care has been taken in this edition to provide
policy makers and the community a comprehensive data-based view of Solano County’s economy to help
support future decisions for the County. Objectivity is critical, and official data sources are utilized to
support this analysis. We are proud to partner again with Dr. Robert Eyler, President of Economic Forensics
and Analytics, as our research lead in the development of this annual Index.

COVID-19 Job Impacts
Not surprisingly, the annual trend of job growth in Solano County was interrupted by the pandemic.
Through the end of 2020, employers in the County retained 10,500 fewer non-farm employees that at the
start of that year. In addition, there were 16,500 few employed residents in Solano County (those both
employed in and out of the County). Prior to March of 2020, the unemployment rate had been relatively
stable and near four percent, a level considered “full employment” by most economists. By the end of 2020
the unemployment rate reached 9.5 percent, the highest rate since 2013. This was actually an
improvement over previous months leading to December 2020, reaching 15.7 percent in April of 2020.
Employment data revealed significant job loss remains in March 2021, particularly in industries effected by
statewide health and “social-distancing” orders: retail, restaurants, business services, and
tourism/hospitality. In addition, Solano County’s labor force has been dramatically changed as some
workers had to give up their jobs to care for themselves or others in their households, while many others
changed their work locations from office to home, often even changing where they lived.

Recovery and Resilience
A number of city, county, state, and federal agencies, including healthcare providers and members of
private industry, have dedicated time and resources to mitigate the long-term effects of this economic
downturn. In 2020, the County of Solano authorized discretionary funds from the Federal CARES Act to be
spent on rental assistance grants for Solano County residents in jeopardy of evictions due to job loss and
engaged with the Workforce Investment Board of Solano County to issue grants to small business owners
to stay open and keep employees working. In addition, over $584 million dollars of the federal Paycheck
Protection Program (PPP) was received by businesses and employers based in Solano County between April
2020 and March 2021. County government continues to focus extreme efforts to address the health
impacts from COVID-19 in 2021 and continues to advocate for additional vaccines. Of another positive
note, the Solano EDC recently has just received a new EDA CARES Act Grant supported by matching funds
from the County of Solano, all cities in the County, and Solano Transportation Authority to create a
comprehensive regional plan for economic recovery. All of these efforts continue to move Solano County
forward through economic recovery from COVID-19 impacts and beyond.

          Sincerely,

          John M. Vasquez                               Robert Burris
          Chairperson                                   President
          Solano County Board of Supervisors            Solano Economic Development Corporation
2
                         Index of Economic and Community Progress
Contents
Solano County Key Facts .................................................................................................................................................... 3
Key Highlights from the 2020 Index ................................................................................................................................... 4
   Solano County and the COVID-19 Recession ........................................................................................................... 5
Index Overview .................................................................................................................................................................. 6
Our Changing Economy ................................................................................................................................................... 13
   Labor Markets ...................................................................................................................................................... 14
     Annual Local Industry Employment ......................................................................................................................... 14
     Total Non-Farm Employment .................................................................................................................................. 15
     Unemployment Rate Comparisons ......................................................................................................................... 16
     Total Employed Residents Comparisons ................................................................................................................. 17
     Cities Overview: Labor Markets .............................................................................................................................. 18
     Employment in Base Industries and Locally-Serving Industries .............................................................................. 19
     Change in Jobs by Industry and Long-Term Jobs Forecasts ..................................................................................... 20
     Long-Term Jobs Forecast to 2030 ............................................................................................................................ 21
   Businesses and Incomes ....................................................................................................................................... 22
     Non-Employer Businesses ....................................................................................................................................... 22
     Paycheck Protection Program (PPP) Lending and Solano County in 2020 .............................................................. 23
     Gross Product Change by Industry Sector and Overall Growth Rate ...................................................................... 24
     Gross Product Deflator and Solano County’s Local Cost of Living ........................................................................... 25
     Tourism Industry: Supporting Visitors ..................................................................................................................... 26
     Personal Income ...................................................................................................................................................... 27
     Sources of Personal Income .................................................................................................................................... 28
     Business Affordability: Wages ................................................................................................................................. 29
     Median Household Income Comparisons ............................................................................................................... 30
     Poverty Rates........................................................................................................................................................... 31
     Agriculture ............................................................................................................................................................... 32
   Commercial RE and Housing Demand ................................................................................................................... 33
     Commercial Real Estate Pricing and Vacancy .......................................................................................................... 33
     Building Permits....................................................................................................................................................... 34
   Housing Markets .................................................................................................................................................. 35
     Median Home Prices and Affordability ................................................................................................................... 35
     Median Home Price Forecasts ................................................................................................................................. 36
     Regional Housing Needs Allocation (RHNA) ............................................................................................................ 37
     Summary on Housing Markets ................................................................................................................................ 37
   Social Equity Metrics: Baseline for Monitoring in Solano County .......................................................................... 38
Our Changing Community ............................................................................................................................................... 39
   People .................................................................................................................................................................. 40
     Population Growth .................................................................................................................................................. 40
     Population Growth Projections ............................................................................................................................... 41
     Components of Population Change ......................................................................................................................... 42
     Measuring Population Change in Real Time: US Postal Service Changes of Address .............................................. 43
   Workforce Readiness and Supply ......................................................................................................................... 44
     Dependency Ratios, High-School Graduation Rates and UC/CSU Readiness .......................................................... 44
     Labor Force Participation Rates............................................................................................................................... 46
     Unemployment Insurance and COVID-19, Solano County ...................................................................................... 47
     City Overview: Education, Housing and Income ...................................................................................................... 48
     Broadband and Computer Access ........................................................................................................................... 50
     Commuting .............................................................................................................................................................. 51
   Quality of Place Index ........................................................................................................................................... 52
   Data Sources and Methodology............................................................................................................................ 53
3
Index of Economic and Community Progress
Solano County Key Facts
Area
Rural land area 675 square miles
Urban land area 150 square miles
Water area 84 square miles
2020 Population (January 1, 2021) 438,527
Benicia 27,111
Dixon 20,197
Fairfield 118,005 Educational Attainment (2015–19 Avg.)
Rio Vista 10,080 Less than high school 11.6%
Suisun City 28,882 High school graduate only 23.8%
Vacaville 98,041 Some college, no degree 27.4%
Vallejo 117,846 Associate’s degree 10.3%
Unincorporated 18,365 Bachelor’s degree 18.6%
Graduate or Professional degree 8.3%
Population Change: 2020 to 2021 (Jan 1) -684
Age Distribution of Pop (2015–19 Avg.)
Solano County 2030 Population Est. 472,048 Under 5 years old 6.1%
(CA Dept. of Finance, estimate as of Jan 2021) 5 to 19 18.6%
20 to 44 33.7%
Top 5 Employment Sectors (as of Dec. 2020)
45 to 64 26.4%
Education & Health Services 28,500
65 and older 15.2%
All Government (incl. US Military) 23,500
Retail Trade 16,700
Ethnic Composition of Pop (2015–19 Avg.)
Manufacturing 12,300
White 38.0%
Leisure & Hospitality 12,300
Hispanic 26.5%
Construction 10,900
Asian 15.0%
African-American 13.5%
Total Industry Jobs (Dec. 2020) 134,400 Other (incl. mixed race/Pacific Islander) 7.0%
Employment to Housing Units (2020) 83.2% Building Permits Issued, New Housing Units
Employment to Housing Units (2019) 90.7% (Fiscal Year 2019–20) 1,131
Sources and Notes:
1. Population and housing data come from California Department of Finance (www.dof.ca.gov), as of May 2021.
2. Employment data from California Employment Development Department (www.edd.ca.gov), as of April 2021.
3. Employment to housing unit ratios help city and county development plan for efficient municipalities and transit
networks. A ratio of 100 percent suggests a balance in housing units and commuting workers. Ratios below 100
percent suggest the local economy has more residents working outside (or fewer jobs locally) in net versus other
areas; ratios above 100 suggest rising numbers of commuters coming to the local area from other areas to work.
4. Demographic data from the Census Bureau’s American Community Survey (factfinder.census.gov), March 2021.
5. Building Permits data provided in March 2021 by the County of Solano, fiscal year 2019-20, ending June 30, 2020.4
Index of Economic and Community Progress
Key Highlights from the 2020 Index
Our Changing Economy Our Changing Community
• Solano County employers hired 10,500 fewer • Solano County’s population fell by 684 people in
workers in 2020, a 7.3 percent decrease from 2019. 2020 (-0.16 percent), and grew by 6.1 percent
Solano County’s labor force fell by 5,300 in 2020, since 2010 to January 1, 2021.
2.5 percent of residents working or seeking a job. • Population growth estimates show a county
• 183,600 residents of Solano County were population of approximately 472,040 by 2030.
employed as 2020 ended, 16,500 less than 2019. • Solano County’s population is forecasted to grow
• Solano County’s unemployment rate was 9.5 from 2020 to 2060 by approximately 23.8
percent at the start of 2021, the highest rate for percent.
Solano County’s economy since 2013. • Data from the US Postal Service suggests more
• Industry losses of jobs in 2020 were driven by households came to Solano County than left
hotel/motel, restaurant, other personal services, during 2020, even though population fell.
and retail jobs lost due to the COVID-19 recession. • Solano County’s high-school graduation rate
• Based on the most recent data available, inflation- increased to 86.9% of eligible students, ahead of
adjusted (real) gross product for Solano County the state average for the 2019-20 academic year.
grew by 3.6 percent in 2019, slightly faster than • Eligible African-American students in Solano
both California and the national economy. County graduated from high school 81.8 percent
• Solano County’s personal income per person of the time in academic year 2019-20.
increased in 2019 by 3.7 percent after inflation. • Median housing prices increased 7.9 percent in
• Median household income also increased in 2019 2020 to $485,950; housing affordability in Solano
after inflation to $65,055 in 2012 dollars (+1.9%). County decreased slightly.
• Employment in industries focused on customers • Recent allocations of housing units from state
outside Solano County (“base” industries) fell in government assigned over 10,990 more units
2019 by approximately 4,900 jobs. need to be built to balance supply and demand in
• Solano County median wages in 2020 increased Solano County between 2023 and 2031.
from 2019 for local workers to just $0.02 below • 1,131 building permits were issued for new
California on average, the first time on record that homes for fiscal year 2019-20. Approximately
gap was closed suggesting new jobs have been 251,000 square feet of commercial space was
above average wages and pulling all wages up. permitted during fiscal year 2019-20, about 12
• Poverty rates for Solano County residents fell in percent of the 2018-19 fiscal year total.
2019 (the latest data), based on five-year averages. • Commute times to work increased in 2019 (the
• Regional cost of living increased for Solano County latest data) by 2.1 minutes from 2018 for Solano
by 1.6 percent in 2019 (the latest data), slower County residents; the COVID-19 recession may
than the state and national averages. transform commute patterns to 2025.
• Local farmers made slight gains in 2019 (the latest • Solano County’s assessed property values
data) from 2018 to the highest level of agriculture increased to over $60 billion in fiscal year 2019-
value since 2010. 20, while taxable sales fell slightly in calendar
• $584 million in PPP loans came to Solano County year 2020.
employers from April 2020 to April 2021 amid job Considerations for the Future
losses from the COVID-19 recession, approximately The COVID-19 recession wreaked havoc on Solano
3.2 percent of county gross product. County’s labor markets for the first half of 2020.
• Social equity metrics for Solano County suggest the Forecasts suggest that Solano County will return to pre-
County has performed well since 2012 on poverty COVID levels of employment by 2023, as re-opening
alleviation and median household income, less so and federal stimulus assist jobs recovery. Housing
on homeownership versus state and national markets are forecasted to continue price growth in
averages for under-represented communities. 2021 due to strong demand conditions, but may
exacerbate inequities for lower- to middle-income
households trying to own homes.5
Index of Economic and Community Progress
Solano County and the COVID-19 Recession
Social policies constrained the American economy in 2020 creating recession conditions as a reaction
to rising cases of the COVID-19 virus. Solano County experienced recession also. Economic progress
toward the end of 2020 and into 2021 helped ease fears of a longer recession. Forecasts for 2021
through 2024 are rising as of April 2021 (the latest data) in expectations of a strong economic
recovery. In the 2019 Index of Economic and Community Progress, we noted the economic effects of
the COVID-19 recession may put pressure on county government due to lower taxable transactions
and property values. Median housing prices actually increased from March 2020 to March 2021.
Lower interest rates and higher-income jobs preservation helped to increase housing demand.
Taxable sales fell sharply in quarter 2 2020 versus quarter 2 2019, but increased in 2020 quarters 3
and 4 for Solano County. Solano County’s taxable sales are likely to return to 2019 levels by the end
of 2021.
Three rounds of “fiscal stimulus” have been passed by the US Congress since April 2020 as of April
2021. The initial round, called the CARES Act, initiated the Paycheck Protection Program (PPP) and the
Economic Injury Disaster Loan (EIDL) program from the federal Small Business Administration. Over
$584 million in PPP loans came to Solano County, most of which is likely convertible to a federal grant.
For Solano County, this amount was approximately 3.2 percent of county gross product. Solano County
used some of its CARES Act funding to give out more than $4 million to Solano County residents in need
of rental assistance. Over $350 billion of funds in the March 2021 round are slated for state and local
government.
For Solano County, jobs losses were acute in April and May 2020 specifically (see figure below).
However, from June to November 2020, labor-market recovery took place across California and most of
its counties, including Solano County. As of March 2021 (the latest labor-market estimates at the county
level available shown in the figure), Solano County’s residents are 94.2 percent back to pre-COVID
employment levels. 2022 is likely the year that Solano County recovers jobs lost in 2020 in the
aggregate; for some workers and industries, the COVID-19 recession’s effects may linger beyond 2022.
Residential Employment Levels, Index = 100 for November 2007 and January 2020, Great Recession
(2008-10) and COVID-19 Recession and Recovery (2020-), Months from Peak Employment, Solano County
105.0
Great Recession COVID-19
100.0
95.0 94.2
90.0
85.0
80.0
101
105
109
113
117
1
5
9
57
61
65
69
13
17
21
25
29
33
37
41
45
49
53
73
77
81
85
89
93
97
Months from Pre-Recession Peak
Source: California EDD (https://www.labormarketinfo.edd.ca.gov/data/employment-by-industry.html) and EFA Calculations6
Index of Economic and Community Progress
Index Overview
Solano County Jobs fell to 134,400 Workers in 2020
After nine consecutive years of growth, approximately 10,500
workers lost jobs at non-farm employers in Solano County, a In 2020, Solano County
reduction of 7.3 percent in 2020 from 2019; farm jobs stayed
the same as in 2019. From 2010 to 2019, Solano County
employment decreased by
employers added a total of 23,700 jobs; COVID-19 reduced 7.3%, approximately 10,500
the net gains since 2010 to just 13,300 or 11 percent growth workers lost jobs across
over 11 years to 2020. Leisure and hospitality and other
Solano County employers.
personal services jobs were hurt more than other industries.
These employers’ inability to stay open consistently and also
2018 across farm and non-
farm employers.
reduced travel levels lowered revenues. The state and national economies also contracted.
The Broader Context: State and National Economic Updates
The California and national economies entered
Forecasts through 2024 suggest a 2020 with jobs and income expansions for the
slow but steady recovery from the longest period on record. As 2020 ended,
California’s unemployment was 10.1 percent
COVID-19 recession across the
versus 4.2 percent as 2019 ended. Jobs in
national and state economies California as 2020 ended contracted by
1,305,200 workers or a 7.3 percent reduction of
employment levels as compared to those working in 2019.
The national economy also experienced jobs losses in 2020; by December 2020, there were
approximately 10.74 million workers in the United States out of work. This is approximately 5 million
more than in February 2020. Lower interest rates and multiple rounds of fiscal stimulus increased
employment quickly from May 2020 to November 2020 across the American economy, slowing down
from December 2020 to March 2021 (the time of this writing). However, the combination of
vaccines, reduced social restrictions, low interest rates,
and large fiscal stimulus packages all generated
National and state economic
optimistic forecasts through 2024. Inflation pressure
and expectations, slow initially in the COVID-19 recovery since May 2020 has
recession, are being watched closely as a gauge of been accelerated by lower
rising interest rates and problems for consumers. For interest rates and three rounds of
Solano County, local costs of living measures are
influenced largely by local housing costs.
fiscal stimulus as of March 2021.7
Index of Economic and Community Progress
Housing Prices Grew Quickly in 2020 and More Growth Predicted in 2021
Solano County’s housing price forecast slowly
increased over 2020 as lower interest rates and ZillowTM Research predicted Solano
movements around the state and Bay Area
County home prices to rise by 12.3
region led to rising demand for purchasing
homes in Solano County. The median sale price
percent to March 2022 as of March
for homes in Solano County was approximately 2021 after rising by 7.9 percent in
$485,950 in December 2020, up 7.9 percent from 2020.
the previous year according to ZillowTM Research.
In comparison, median home prices in California overall grew 9.8 percent in 2020 to just over $618,000.
Regional fires that happened in 2020 – initially called the Lightning Complex Fires in Sonoma-Napa-Lake
counties (or LNU for short), including both the Wallbridge and Glass Fires – were more destructive to
regional property and lives than any fires since 2017. However, housing price forecasts for Solano
County and the Bay Area region remain positive for 2021.
Building permits in Solano County were strong for housing though relatively low for commercial real
estate in fiscal year 2019-20 (July 1 to June 30) compared to fiscal year 2018-19. Residential building
permits activity in Solano County increased by 1,131 new housing units permitted in fiscal year 2019-
20. Commercial square feet under construction was
Regional economic development up 251,000 new square feet of space between July
2019 and June 2020. In the previous fiscal year,
faces challenges to keep
Solano County permitted over 2.1 million square
businesses in commercial real feet). The COVID-19 recession has created
estate, but there may be uncertainty in office space demand. According to
opportunities for new businesses Colliers International, office-vacancy rates in Solano
County remained relatively flat during 2020 at 18.1
and ways to use office space. percent, with rents also relatively flat at $2.40 per
square foot as 2020 ended.
Solano County: Residents lost jobs initially due to COVID-19 and then partial recovery in 2020
Solano County’s residents working or looking for work (the labor force) fell in 2020 by 2.5 percent
overall. The number of Comparison of Solano County Labor Force Components, 2010 to 2020
Solano County Number of Workers and Percent Change Based on Annual Averages
residents with a job fell Number of Workers Percent Change
by 8.2 percent in 2020. 2010 2019 2020 2010 2019
The number of people Labor Force 202,500 208,100 202,800 0.1% -2.5%
Employed Residents 176,500 200,100 183,600 4.0% -8.2%
working for Solano
Unemployment Residents 26,000 8,000 19,200 -26.2% 140.0%
County employers fell
Industry Employment 121,100 144,800 134,400 11.0% -7.2%
by 7.2 percent, Source: EDD (http://www.labormarketinfo.edd.ca.gov/), Labor Market Information,
regardless of where Annual Averages; a new benchmark of 2020 was set with some revisions.
the workers live. Jobs
growth is expected to take place each month of 2021 for Solano County and California overall as
recovery continues. Changing labor force levels reflect the choice to not seek a new job, to retire,
and also to leave Solano County and thus be counted elsewhere.8
Index of Economic and Community Progress
Goods-Producing Employment Watch: Moving Solano Forward
Economic development efforts by Solano EDC, called Moving Solano Forward, focus on specific
industries that combine economic diversity, economic mobility for workers and a focus on external
markets to help the county’s economy grow over the next decade. Those industries include:
• Advanced Materials;
• Biotech/Biomedical;
• Food and Beverage Manufacturing;
• Logistics; and
• Travis Air Force Base.
Goals of Moving Solano Forward include an expansion of goods-producing jobs in Solano County
due to higher-than-average wages and larger ripple effects from growth on Solano County’s
economy than services jobs. As 2020 ended, the California Employment Development
Department (EDD) estimated that jobs in construction and manufacturing fell by approximately
1,700 jobs while private-sector services jobs fell by 7,500; government jobs at all levels fell by
1,300. The downturn at employers in Solano County affected almost all county industries.
Solano County Employment, Sorted by Changes During 2020
2020 Annual Average Gains and (Losses) of Jobs Since 2010 and 2019
Since 2010 Since 2019
Industry Gain/(Loss) % Chg. Gain/(Loss) % Chg.
Federal Government (incl. Travis AFB) -900 -19.6% 100 2.8%
Agriculture (Farm) 100 7.1% 0 0.0%
State Government Excl. Education 200 4.3% 0 0.0%
Financial Activities -300 -5.8% -200 -3.9%
Manufacturing 2,600 26.8% -200 -1.6%
Wholesale Trade 100 2.4% -200 -4.5%
Information (Software and Publishing) -400 -30.8% -300 -25.0%
Healthcare 7,100 36.8% -500 -1.9%
Local Government Education -300 -3.4% -900 -9.7%
Retail Trade 300 1.8% -1,100 -6.2%
Construction 3,700 51.4% -1,400 -11.4%
Bars and Restaurants 400 4.0% -2,000 -16.0%
All Other Industries 700 2.5% -3,700 -11.3%
Total, All Industries (Farm + Non-Farm) 13,300 11.0% -10,400 -7.2%
Source: EDD (http://www.labormarketinfo.edd.ca.gov/), Labor Market Information, Annual Data, Chg. = Change
Another goal of Moving Solano Forward is more economic diversity, especially comparing the
private sector to the public sector. Since 2010, Solano County has done just that due to both an
expansion of private-sector businesses and jobs (reflected in the gross product data to 2019,
which are the latest data available), but also smaller government levels, including Travis Air Force
Base (TAFB). A recent economic impact study by the U.S. Department of Defense estimated $2.1
billion of local economic impact from TAFB in 2019. As economic recovery continues in 2021,
Solano County is likely to see more growth in private-sector services jobs than goods-producing or
government as visitor-supporting and retail industries rebound.9
Index of Economic and Community Progress
Solano County Labor Force and Industry Employment, 2005–2020, Annual Change in Number of Workers
10,000
5,000
0
-5,000
-10,000
-15,000
-20,000
2005
2010
2006
2007
2008
2009
2011
2012
2013
2014
2015
2016
2017
2018
2019
2020
Change in Labor Force Change in Employed Residents
Change in Industry Employment
Source: EDD (http://www.labormarketinfo.edd.ca.gov/), Labor Market Information, Annual Averages
Sector Shares of Gross Product at the County, State, and National Levels
Percent of Total Gross Product in 2012 Dollars, 2010 to 2019, Selected Years
Goods-Producing Services-Producing Public Sector
Solano Solano Solano
Year County CA US County CA US County CA US
2010 28.2% 18.7% 19.3% 52.7% 67.9% 66.5% 19.1% 13.3% 14.2%
2015 31.9% 17.1% 19.1% 51.9% 71.5% 68.5% 16.2% 11.4% 12.3%
2016 31.3% 17.2% 18.9% 52.0% 71.4% 68.9% 16.7% 11.4% 12.2%
2017 29.4% 17.2% 18.9% 53.9% 71.9% 69.1% 16.7% 10.9% 12.1%
2018 29.3% 17.3% 19.0% 54.5% 72.0% 69.1% 16.3% 10.6% 11.9%
2019 30.0% 17.1% 19.0% 54.2% 72.5% 69.2% 15.9% 10.4% 11.7%
Source: Bureau of Economic Analysis (http://www.bea.gov/regional/index.htm), 2019 data are the latest available
Standards of Living Rising for Solano County in 2019, in 2020 Mixed Results are Likely
Standard of living measures include income measures in real (inflation-adjusted) terms per
person or household: median household income and personal income per person are examples.
Median household income (MHI) is generally estimated by the United States Census Bureau,
based on a household of four people. MHI remains the basis of affordable housing eligibility
determination as well as establishing income thresholds for measuring poverty levels.
In 2019, real personal income per person and gross product per person in Solano County grew
but remains below the national and California averages. MHI adjusted for inflation grew almost
1.9 percent in 2019. Solano County continues to have MHI levels above statewide and national
averages. All three measures increased in 2019 (the latest data). In 2020, due to job losses, gross
product per person is likely to fall sharply. In contrast, federal stimulus and jobs recovery in late
2020 may lead to stable or perhaps slight growth in both personal income per person and median
household income levels. When all three of these indicators are rising, Solano County’s economy
is improving its living standards unambiguously.10
Index of Economic and Community Progress
Standard of Living Measures at the County, State, and National Levels
2010, 2018 and 2019 (latest available data), in 2012 Dollars
Gross Product per Person Personal Income per Person Median Household Income
Place 2010 2018 2019 2010 2018 2019 2010 2018 2019
Solano County $42,566 $49,032 $50,571 $40,378 $44,855 $46,523 $66,065 $67,812 $69,132
California $55,551 $68,648 $70,877 $45,482 $58,020 $59,553 $60,519 $62,236 $63,840
United States $50,844 $57,204 $58,164 $42,188 $49,509 $50,319 $49,238 $51,512 $52,735
Sources: Bureau of Economic Analysis (http://www.bea.gov) and Census Bureau (http://data.census.gov); there have been changes
in benchmarking that make these data different than previous Index versions for the same date and place.
Social Equity Metrics and the COVID-19 Recession
The 2020 edition of this Index adds social equity metrics. The indicators consider poverty, median
household income (which is related to income derived from both wealth and from working), and
homeownership versus renting for county residents by race and ethnicity. Comparisons made to statewide
and national averages suggest Solano County has relatively good equity as of 2019 in lifting under-
represented residents out of poverty and to higher median household income levels. Homeownership gaps
remain for African-Americans and Hispanic-Americans, less so for Solano County’s Asian-American
residents versus the state and national averages.
Community Indicators: Continued Gains and Some Challenges
Population estimates by the California Department of Finance help California’s counties compare
to annual Census estimates. In 2020, Solano County’s population fell by an estimated 684 people
(the latest data as of May 7, 2021). This estimated reduction in Solano County’s population is a
function of both aging residents and people leaving Solano County in net, the first year of
population loss since 2010. In contrast, Sonoma County has lost population for four years in a
row; Marin and Napa counties are estimated to have lost population for five years in a row. As of
January 1, 2021, Solano County’s population was estimated to be 438,527 residents.
Solano County’s graduation rate was 86.9 percent in the 2019-20 academic year
Solano County's graduation rate increased to 86.9
percent for the 2019-20 academic year (the latest year
Graduation rates at Solano
for which data are available as measured by the
California Department of Education) from 84.9 percent
County high schools were higher
in the academic year 2018-19, ahead of California’s than the state on average again
average that decreased slightly from 84.5 to 84.3 in academic year 2019-20, with
percent. The percent of graduates that were UC/CSU-
gains also made in graduates
ready was 50.0 percent of Solano County graduates in
2019–20 versus 50.9 percent of graduates for the state that were UC/CSU eligible.
of California. Current and expected loss of population in
Solano County of school-age residents is a looming concern for attendance and funding, but
fiscal stimulus in 2021 should help relieve short-term pressures caused by COVID-19 on Solano
County’s schools.11
Index of Economic and Community Progress
Taxable sales fell slightly in 2020 and assessed property value increased in Fiscal Year 2019-20
The County of Solano
saw a small downturn Solano County Taxable Sales, Q1 1996 to Q4 2020
in calendar-year 2020 Quarterly and Annual, Calendar Year
2,100 8,000
taxable sales due to
Quarterly Sales Tax Revenues - Millions
Annual Sales Tax Revenues - Millions
7,000
the COVID-19 1,900
recession, though 6,000
1,700
there was a large drop
5,000
in quarter 2 2020
1,500
versus quarter 2 2019. 4,000
Taxable sales fell by 0.6 1,300
3,000
percent for calendar
year 2020. Taxable 1,100 2,000
sales are forecasted to
900 1,000
rise in the last two
quarters of fiscal year
2020-21 to provide Annual 1st Qtr. 2nd Qtr. 3rd Qtr. 4th Qtr.
overall, fiscal-year
Source: California Department of Tax and Fee Administration (CDTFA),
gains from 2019-20;
Latest Data Through Dec 2020
taxable sales from online
merchants were a key reason for any taxable sales stability in 2020.
Solano County’s aggregate, assessed property values continued to grow in the 2019-20 fiscal year;
current values are used by the Solano County Assessor’s Office to set the property tax roll each
year. As of June 30, 2020, the assessed value of property in Solano County was approximately
$60.5 billion, the eighth year of increased property tax rolls in a row. While the Index version in
2019 predicted lower home prices in 2020, the combination of stable jobs for higher-income
households and lower interest rates increased demand for homes and helped to reduce concerns
of assessed values falling in Solano County; this is a much different, positive outcome of the
COVID-19 recession versus the Great Recession (2008-10).
Solano County Assessed Values for Property Tax Purposes, Fiscal-Year End 2000 to 2020, Current Dollars
70
60.5
57.6
Billions (Current Dollars)
60 54.6
51.8
48.8
50 46.1 45.8 43.7 46.0
42.0 41.3 39.7 39.1 39.2 41.0
40 36.8
32.7
29.8
30 27.0
22.4 24.8
20
10
0
2000
2004
2001
2002
2003
2005
2006
2007
2008
2009
2010
2011
2012
2013
2014
2015
2016
2017
2018
2019
2020
Source: Solano County Assessor’s Office (current assessed value for Fiscal Year end)12
Index of Economic and Community Progress
Geographic Comparisons
Unless stated otherwise, the 2020 Index groups counties into the following three areas
in California for the purpose of making comparisons. In some cases, individual counties
in each of these areas are used instead and as appropriate.
• Bay Area Other: San Francisco, Santa Clara, Alameda, San Mateo, Contra Costa
counties;
• North Bay: Sonoma, Marin and Napa counties;
• Sacramento Metropolitan Statistical Area (MSA): Sacramento, Placer, El Dorado,
and Yolo counties.
Takeaways, Opportunities and What Lies Ahead
Because of continued volatility in 2021 due to COVID-19, the 2020 Index provides brief
“TAKEAWAY” sections and also one of two additional conclusions to most subsections. An
“OPPORTUNITY” for Solano County economic development may be considered when data
suggest alignment with Moving Solano Forward goals, workforce development
opportunities or both. In cases where there may be lingering concerns from the COVID-19
recession, we use “Beyond 2021” and try to point the reader to challenges and also most-
likely scenarios based on the COVID-19 recession’s effects on Solano County, as well as
issues to watch toward 2025. The American economy was still in recession officially as of
May 1, 2021; this may change if there is an announcement by the National Bureau of
Economic Research that it ended sooner. The report starts with a look at Solano County’s
economy followed by community indicators.13 Index of Economic and Community Progress Our Changing Economy
14
                  Index of Economic and Community Progress
Labor Markets
Annual Local Industry Employment
Labor markets were deeply and broadly affected by the COVID-19 recession in 2020.
Solano County employers decreased payroll workers from 144,900 workers at the end of
2019 to 134,400 as 2020 ended. Private-sector employment fell by 9,200 workers and
government employment fell by 1,300 workers.

              Solano County Private and Public Sector Employment, Annual Averages, 2000–2020
                          Number of Jobs and % of Private-Sector Jobs (Line Graph)
  150,000                                                                                                                                                         86.0%
  140,000
  130,000                                                                                                                                                         84.0%
  120,000
  110,000                                                                                                                                                         82.0%
  100,000
                                                                                                                                                                  80.0%
   90,000
   80,000
                                                                                                                                                                  78.0%
   70,000
   60,000
                                                                                                                                                                  76.0%
   50,000
   40,000                                                                                                                                                         74.0%
   30,000
   20,000                                                                                                                                                         72.0%
   10,000
          0                                                                                                                                                       70.0%
               2000

                                           2004
                      2001
                             2002
                                    2003

                                                  2005
                                                         2006
                                                                2007
                                                                       2008
                                                                              2009
                                                                                     2010
                                                                                            2011
                                                                                                   2012
                                                                                                          2013
                                                                                                                 2014
                                                                                                                        2015
                                                                                                                               2016
                                                                                                                                      2017
                                                                                                                                             2018
                                                                                                                                                    2019
                                                                                                                                                           2020
               Private Sector                      Government                        % Private Sector of Total Jobs, Solano County

Source: California Employment Development Department (www.edd.ca.gov). Private- and public-sector employment levels are
indicated on the left-hand axis; share of private-sector (%) jobs to total employment is indicated on the right-hand axis.

    TAKEAWAY: COVID-19 created a major change in Solano County’s labor market, reducing the
    total number of workers to levels equal to 2013.
    Beyond 2021: As we see later, specific industries to watch due to lingering job losses as 2021
    began include retail, leisure and hospitality and other services. Due to stimulus funding and
    PPP lending/grants in 2021 coming directly to local municipalities and states, government job
    losses may stabilize and ultimately increase slightly before 2021 ends.
15
Index of Economic and Community Progress
Total Non-Farm Employment Solano County Non-Farm Employment, 2000–2020,
The graph to the right summarizes the Annual Data, Number of Workers
non-farm jobs loss in Solano County. 150,000
145,000 143,400
The graph below summarizes the 140,000
industry-level job losses compared to 135,000
the 2019 levels of jobs for the same 130,000
132,900
125,000
month from April 2020 to December
120,000
2020. Agricultural jobs growth in 115,000
Solano County was basically flat in 110,000
2020 (+20 jobs). The overall loss of 105,000
100,000
jobs for Solano County’s employers in
2011
2014
2000
2001
2002
2003
2004
2005
2006
2007
2008
2009
2010
2012
2013
2015
2016
2017
2018
2019
2020
2020 was primarily in leisure and
Source: California Employment Development Department (www.edd.ca.gov)
hospitality, other personal services and
retail jobs. Initially in the COVID-19 recession, all major industry categories experienced job
losses, except for federal government (government jobs were lost in net when all government
levels considered). As 2020 ended, jobs recovery had begun. The figure below shows many
of Solano County’s industries remained more than 10 percent below the same month’s
employment level in 2019.
Solano County, Percent Change in Industry Employment from Same Month in 2019, April to Dec 2020
20.0%
13.0%
10.0% 0.3%
0.0%
-10.0% -2.4% -4.5% -1.1% -3.9%
-7.7% -7.6% -9.2%
-20.0% -13.5%
-11.0% -19.6%
-30.0%
-40.0% -27.3%
-27.7%
-50.0%
Apr-20 May-20 Nov-20 Dec-20
Source: California Employment Development Department (www.edd.ca.gov)
TAKEAWAY: Jobs at Solano County’s employers contracted quickly in 2020, as low as
124,100 workers (equivalent to the same volume of non-farm employment as September
2012) before rising to 132,900 by the end of 2020 (equivalent to September 2015 levels).
Beyond 2021: While Solano County may return to the same volume of workers as it
started with in 2020 by the end of 2022, Solano County needs to be concerned about
structural shifts in industry employment, especially lower-wage and low barriers to entry
jobs such as retail, leisure and hospitality and other services. Slow recovery of such jobs
can lead to more demand on social services provided by government and nonprofits.16
Index of Economic and Community Progress
Unemployment Rate Comparisons
Solano County’s unemployment rate measures county residents and how many are looking for
work but not currently employed. As 2020 ended, Solano County’s unemployment rate was 9.5
percent. The rate was 3.8 percent when 2020 began. The state of California ended 2020 at 10.1
percent unemployment, while the United States overall had 8.1 percent unemployment in 2020
on an annualized basis.
Unemployment Rate (%), 2000 –2020
Comparisons Between Selected Areas, Annual Data (Solano County in 2020 = 9.5%)
14.0%
12.0%
9.5%
10.0%
8.0%
6.0%
4.0%
2.0%
0.0%
CA Sac MSA Bay Area Other North Bay Solano County
Source: California Employment Development Department (http://www.edd.ca.gov)
TAKEAWAY: Unemployment rates in Solano County and California went from among the
lowest unemployment rates on record to among the highest in May 2020, with
unemployment rates moderating across the state as 2020 ended.
Beyond 2021: The unemployment rate in Solano County will fall from 9.5 percent in 2021
and likely continue to fall in 2022, as vaccinations and social practices adjust to reduce
COVID-19 cases; a shrinking, regional labor force in and around Solano County may create
lower unemployment rates technically while Solano County’s economic capacity shrinks
due to a smaller labor force and thus fewer residents available for work. Fewer workers
means lower levels of income produced by businesses and lower spending levels.17
Index of Economic and Community Progress
Total Employed Residents Comparisons
This section considers how Solano County’s residents remained employed as compared to
regional areas and California on average. Notice in the graph the sharp downturn in
employed residents across the comparison areas. Solano County saw this index (an index is
used to allow for easy comparisons of different-sized labor markets) drop from 113.4 in
2019 to 104.0 in 2020, approximately the same level of employment as in 2013.
Total Employed Residents, 2010-19, Index 2010 = 100 (Solano County in 2020 = 104.0)
Comparisons Between Selected Areas, Seasonally-Adjusted Monthly Data
130.0
120.0
110.0
100.0
104.0
90.0
80.0
70.0
60.0
2010 2011 2012 2013 2014 2015 2016 2017 2018 2019 2020
Solano County California Sac MSA Bay Area Other North Bay
Source: California Employment Development Department (http://www.edd.ca.gov)
Percent Change in Employed Residents, 2010 and 2019 Annual Data Compared to 2020
Employed Residents 2010-20 2019-20
Solano County 4.0% -8.2%
California 5.2% -8.8%
Sacramento MSA 8.2% -6.2%
Bay Area Other 11.1% -8.6%
North Bay 1.9% -10.1%
Source: California EDD (www.edd.ca.gov)
TAKEAWAY: The sharp reduction in county residents with a job due to COVID-19 social
restrictions came after nine consecutive years of growth.
OPPORTUNITY: The volume of employed residents reflects regional job markets and
capacity to produce goods and services. Solano County residents that may now work
from home versus commuting to work could help increase demand for locally-serving
industries in Solano County during the week, but may also reduce tax revenues from
specific markets like those from gasoline sales while also reducing traffic and classic
commute problems and accidents.18
Index of Economic and Community Progress
Cities Overview: Labor Markets
Data on Solano County’s incorporated cities and their labor markets come from California’s
Employment Development Department (EDD). Jobs were lost in 2020 in all Solano County’s
cities; unemployment rates also increased with reduced labor force levels. Solano County’s
unemployment rate had an annual average of 3.7 percent in 2019 and 9.5 percent in 2020.
Solano County Employed Residents by City (Number of Workers); 2010, 2018, 2019, and 2020
60,000 49,400
47,100 40,800
50,000
40,000
30,000
20,000 13,100 12,600
8,800
10,000 2,300
-
Benicia Dixon Fairfield Rio Vista Suisun City Vacaville Vallejo
2010 2018 2019 2020
Source: California EDD (www.edd.ca.gov)
Solano County Unemployment Rate (% of Labor Force) by City, 2010, 2018, 2019, and 2020
(9.5% as Solano County Average at solid line for 2020)
25.0%
20.0%
11.7%
11.3%
15.0% 9.7%
9.1% 9.3%
7.3% 8.2%
10.0%
5.0%
0.0%
Benicia Dixon Fairfield Rio Vista Suisun City Vacaville Vallejo
2010 2018 2019 2020
Source: California EDD (www.edd.ca.gov)
TAKEAWAY: For Solano County cities, the number of employed residents decreased sharply
in 2020. Some cities, such as Vallejo, have historically recovered more slowly from
recession.
Beyond 2021: Uneven jobs recovery in 2021 and 2022 may affect economic development in
different parts of Solano County such that some cities grow faster than others; coordinating
economic development strategies across Solano County’s cities is critical to not compete
internally given broader, regional competition for similar industries outside Solano County.19
Index of Economic and Community Progress
Employment in Base Industries and Locally-Serving Industries
The COVID-19 recession’s effects on local employers can be seen below in a slightly
different way than data seen
Solano County Base versus Locally-Serving Industry Employment,
above. Base-industry
Number of Workers, Second Quarter Data for 2010, 2018, 2019, and 2020
employment includes jobs Change % Chg.
that primarily serve markets 2010 Q2 2018 Q2 2019 Q2 2020 Q2 2019-20 2019-20
Base Industries Totals 32,401 36,537 36,804 31,872 -4,932 -13.4%
either outside Solano County Agriculture 1,489 1,673 1,572 1,495 -77 -4.9%
or visitors to Solano County. Mining 223 560 524 385 -139 -26.5%
Wholesale Trade 3,986 4,203 4,212 3,903 -309 -7.3%
As of Quarter 2 2020 (the Information 612 267 237 218 -19 -8.0%
Finance and Insurance 991 1,047 1,070 1,043 -27 -2.5%
latest official data available Real Estate, Rental and Leasing 119 275 316 280 -36 -11.4%
as of February 2021), Solano Prof., Sci, Technical Services 266 306 283 304 21 7.4%
Management/Consulting 1,217 797 763 702 -61 -8.0%
County jobs growth fell by Arts, Entertainment and Rec 2,455 2,833 2,822 689 -2,133 -75.6%
over 18,640 jobs (recovery Hotels, Bars and Restaurants 701 702 886 481 -405 -45.7%
Federal government 4,975 3,548 3,579 3,626 47 1.3%
took place after June 30, State government 4,618 5,400 5,982 5,781 -201 -3.4%
Manufacturing 6,109 9,816 9,559 8,947 -612 -6.4%
2020 according to estimated
Retail Trade 2,334 2,249 2,070 969 -1,101 -53.2%
monthly data). For base Transport and Warehousing 2,306 2,861 2,929 3,049 120 4.1%
industries (4,932 jobs lost as Locally-Serving Ind Totals 68,902 87,552 95,707 83,904 -11,803 -12.3%
shown in the table), only Utilities 480 585 593 582 -11 -1.9%
Construction 7,119 11,047 12,679 10,165 -2,514 -19.8%
professional services, Information 586 636 1,170 823 -347 -29.7%
transportation and Finance and Insurance 2,323 2,445 3,417 3,338 -79 -2.3%
Real Estate, Rental and Leasing 1,218 1,210 1,728 1,517 -211 -12.2%
warehousing, and federal Prof, Sci, Technical Services 3,121 3,659 3,863 3,336 -527 -13.6%
government (including Travis Admin/Waste Manage Services 6,579 6,059 5,387 4,841 -546 -10.1%
Educational Services 1,537 1,322 2,034 1,789 -245 -12.0%
Air Force Base) experienced Healthcare/Social Assistance 12,777 24,068 25,914 24,341 -1,573 -6.1%
Arts, Entertainment and Rec 222 144 97 36 -61 -62.9%
jobs growth. Bars and Restaurants 438 437 496 240 -256 -51.6%
Other Services 3,097 3,734 4,475 3,285 -1,190 -26.6%
All locally-serving industries Local Government 15,380 16,077 15,847 14,382 -1,465 -9.2%
Local Portion of Retail Trade 13,281 15,886 17,689 14,986 -2,703 -15.3%
(11,803 jobs lost) shown here Local Trans and Warehouse 744 243 318 243 -75 -23.6%
experienced estimated lower
Jobs in industries unassigned 21,332 17,567 11,655 9,741 -1,914 -16.4%
levels of jobs from 2019 to Sources: Bureau of Labor Statistics (www.bls.gov) and its Quarterly Census of Wages and
2020. These data suggest Employment (QCEW), Calculations by Author
(“Unassigned” jobs in industries that serve a mix of local and export markets).
how general the effects of
the COVID-19 were initially
on Solano County. Quarter 2 2020 is likely the low point in the COVID-19 recession for
jobs lost in both Solano County and California on average. There were 1,914 jobs lost in
industries that are unassigned to base or locally-serving also, as shown in the table.
TAKEAWAY: Base industries employment fell by almost 5,000 workers from Quarter 2 2019 to
Quarter 2 2020, while locally-serving industries saw a loss of over 11,800 jobs at such Solano
County employers between the same quarters.
OPPORTUNITY: Base industry jobs lost in Solano County were primarily in services versus goods-
producing industries, suggesting that the mix of goods-producing jobs was preserved or expanded
by local policy declaring such businesses as “essential” as the COVID-19 recession began.20
Index of Economic and Community Progress
Change in Jobs by Industry and Long-Term Jobs Forecasts
Many industries in Solano County’s economy had come back from initially lows in 2020 by the
year’s end, but no one industry exited 2020 without job losses from 2019 except “Transportation,
Warehousing and Utilities” (outlined in figures) and agriculture (no change).
Percentage Change in Jobs by Industry, Solano County
Change in 2019 from 2018 and Change in 2020 from 2019, Annual Data
15.0%
10.0%
5.0% 2.1%
0.0%
0.0%
-5.0% -1.6% -1.7%
-4.5% -3.9% -5.2%
-10.0% -7.3% -6.2%
-7.8%
-15.0% -11.4%
-20.0% -14.9%
-25.0%
-25.0% -23.6%
-30.0%
Change in 2019 from 2018
Change in 2020 from 2019
Source: California Employment Development Department (http://www.edd.ca.gov)
Percentage Change in Jobs by Industry, Solano County and California
Change in 2020 from 2019, Annual Data
5.0% 2.1%
0.0%
0.0%
-5.0% -1.6% -1.7%
-4.5% -3.9%
-6.2% -5.2%
-10.0% -7.3% -7.8%
-15.0% -11.4%
-14.9%
-20.0%
-25.0% -23.6%
-25.0%
-30.0%
Solano County California
Source: California Employment Development Department (http://www.edd.ca.gov)21
Index of Economic and Community Progress
Long-Term Jobs Forecast to 2030
The COVID-19 recession is likely to leave some longer-term concerns for jobs in specific
industries. These include retail, restaurants, hotels and motels, and other personal services.
Long-term jobs forecasts assume a certain amount of employer and population growth to then
estimate employment growth. These estimates from CalTrans provide a perspective on county
employment. Notice there is forecasted growth in leisure and hospitality from the end of 2020
to 2030 that is robust. Much of this growth is due to 2020 being a year where leisure and
hospitality jobs contracted more than any other industry sector in this figure; these industries
are expected to recover as the decade continues. Construction jobs in Solano County are
forecasted to contract; such a change may be due to limited job loss in 2020 and low interest
rates and housing policy providing more growth to 2025 and then slower growth to 2030.
Solano County’s growth of jobs is forecasted to outpaced California’s growth on average.
Solano County Estimated Percentage Change (%) in Jobs by Industry Sector, 2020 to 2030
Leisure/Hospitality
37.4%
Professional Services 29.9%
Wholesale & Retail Trade 19.0%
Health & Education 18.3%
Government 10.3%
Manufacturing 10.3%
Financial Activities
9.1%
Transportation, Utilities 3.2%
Information
1.9%
Farm -3.1%
Construction -5.6%
Total Wage & Salary 15.3%
-15.0% -5.0% 5.0% 15.0% 25.0% 35.0% 45.0% 55.0%
California Solano County
Sources: California EDD (www.edd.ca.gov) and CalTrans (www.caltrans.org)
TAKEAWAY: While the jobs lost in 2020 were historic, the latter months of 2020 began
jobs recovery and most industries saw jobs gains from the initial lows and forecasts
suggest that jobs growth is coming across most industries to 2030.
OPPORTUNITY: For industries in Solano County that have relatively low or negative
growth forecasts from 2020 to 2030, these industries may provide some possible
economic and workforce development opportunities. These forecasts show continued
industry diversity in Solano County toward 2030.You can also read