Pricing trends for communications services in the UK - Published 22 July 2021 - Ofcom
←
→
Page content transcription
If your browser does not render page correctly, please read the page content below

Pricing trends for
communications
services in the UK

        Published 22 July 2021
Pricing trends for communications services in the UK

Contents
Section
Overview                                                2
Market context                                          9
Consumer engagement, fairness and affordability        17
Pricing of broadband and bundled services              26
Pricing of landline services                           35
Pricing of mobile voice and data services              41
Pricing of pay-TV and OTT services                     54
International comparisons                              59
Terminology used in this report                        61

                                                        1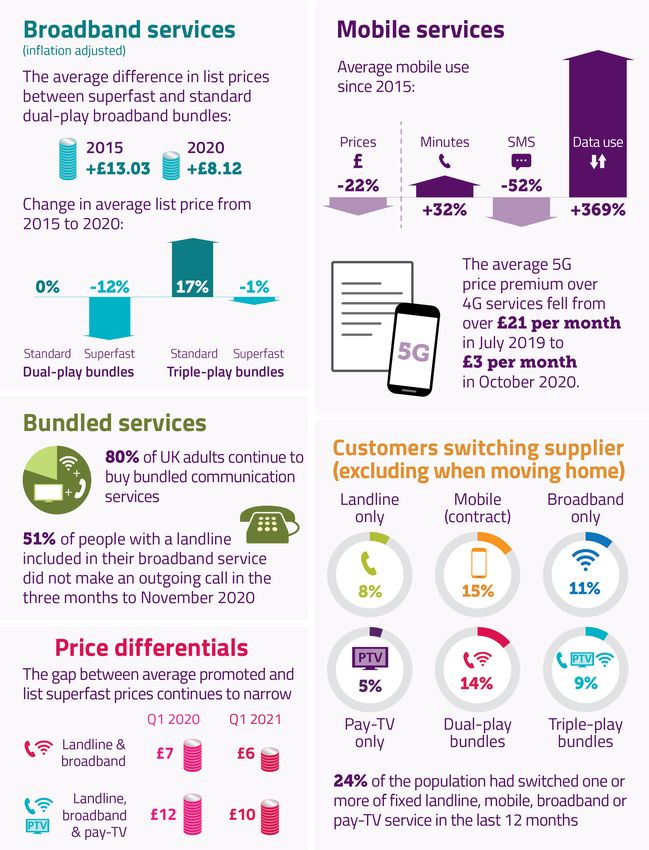
Pricing trends for communications services in the UK

Overview
This report examines pricing trends for residential phone, mobile, broadband and TV services in the
UK. It covers the prices offered for standalone and bundled services, and what customers actually
pay for these services. The analysis is against a backdrop of increased dependency on connectivity
for communications, information and entertainment during the Covid-19 pandemic and the
associated lockdown restrictions.
Overall, the majority of consumers are able to benefit from a wide range of good value deals,
although there is variation in pricing trends across communications services, with some services
becoming cheaper and others more expensive.
We have an established programme of work to help customers get better deals and ensure they are
treated fairly by providers, including paying a fair price for their services. We have already taken
steps to help people shop around with confidence, make informed choices, and get a fair deal. We
will publish a report on the effectiveness of these measures in the autumn. We have published an
update on our affordability work alongside this report.

                                                                                                      2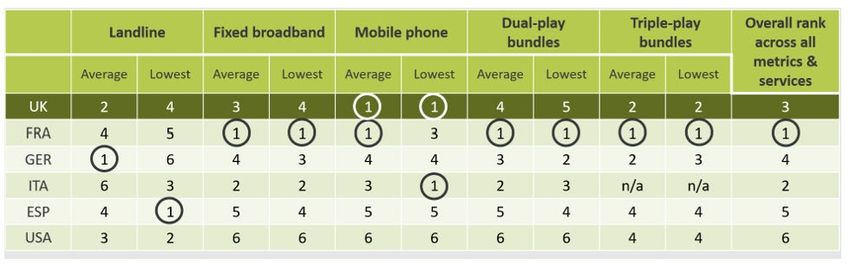
Pricing trends for communications services in the UK

What we have found
The price of mobile services is falling for most customers. The average cost of a SIM-only mobile
service based on average use fell by 10% in 2020 despite increasing voice and data use. Pay-monthly
SIM-only prices for services with over 1GB of data continue to decline, but some occasional and low-
use users are finding reduced choice and rising prices, particularly for traditional pre-pay services.
Mobile customers typically pay a lower price if they take a SIM-only deal. It is cheaper to buy a
handset and airtime separately than get them together from a mobile provider. We estimate the
difference in price is equivalent to customers being charged an APR of up to 23% for their handset
‘loan’. This can be higher if customers do not move to a SIM-only deal when their contract ends.
Mobile prices in the UK compare well to those in other countries. Our analysis compares UK prices
with five comparator countries and finds the UK had the lowest standalone mobile prices overall.
Prices for superfast and ultrafast broadband bundles fell in 2020. The gap between standard and
high-speed broadband prices narrowed; promoted prices for superfast and ultrafast services fell by
11% while promoted prices of residential dual-play bundled standard broadband services remained
flat. In some cases superfast services were cheaper than their standard broadband equivalents.
Some operators’ prices rose for new, and many existing, customers in 2021. For example, BT/EE
increased prices by CPI+ 3.9% from March 2021 across landline, broadband, TV, BT Sport and mobile,
Three has introduced price increases of 4.5%, to be applied each April, and Vodafone has introduced
price rises of CPI +3.9%, again to be applied each April.
Most people buying bundled services continue to benefit from discounts over standalone options.
Our analysis of typical ‘baskets’ of communications services bought by households shows that it is
cheaper for those with a fixed broadband connection to buy bundled services: average savings
ranged from 27% to 41%. The exception was households that only need landline and mobile phone
services; they can end up paying more, as home broadband is a key part of most service bundles.
The gap between the promoted and list prices for broadband services has narrowed. In the year to
March 2021, the average list price for superfast broadband and voice bundles was £6 a month
higher than the promoted price (down from £7 in the previous year). For standard-speed services,
list prices were £4 higher (down from £6). Customers who do nothing at the end of their contract
often face a price increase as they move to the list price.
Prices for line rental and some call packages have increased. Average line rental prices increased by
4% to £19.62 per month in real terms in the year to March 2021, while evening and weekend call
package prices have increased by 18% over the past two years. Reduced price line rental services are
available to people who do not use fixed broadband.
Pay-TV promoted prices have risen, as have some subscription video-on-demand services. But
customers can still make savings by taking pay-TV as part of a bundle, and SVoD services tend to be
flexible, based on monthly contracts.
A quarter (24%) of households report switching either their fixed landline, mobile, broadband or
pay-TV service in the last year. To avoid reverting to higher list prices at the end of a contract it is
important that customers look at offers from their current provider and other providers.

                                                                                                           3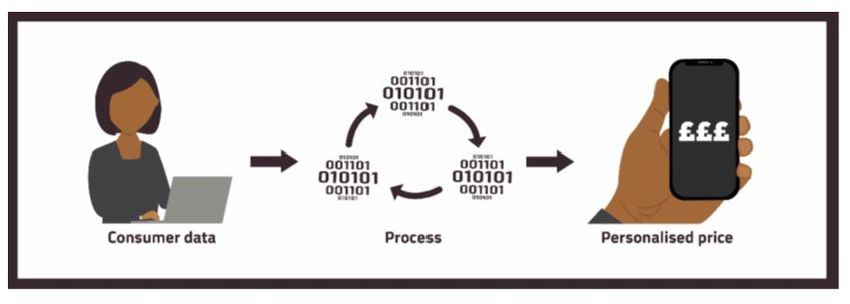
Pricing trends for communications services in the UK

Key metrics

                                                       4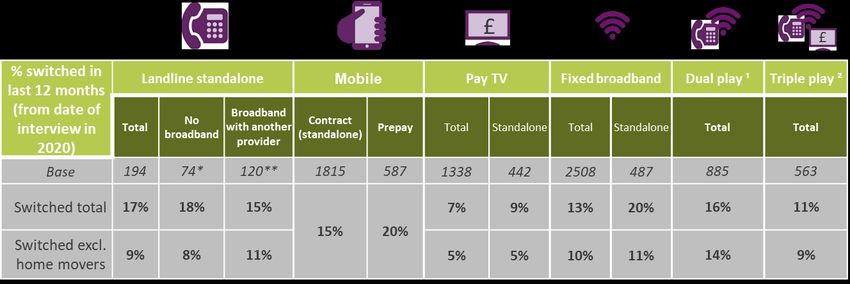
Pricing trends for communications services in the UK

Summary
Higher-use customers tend to be well-served in terms of pricing
•   People buying bundles including superfast broadband services, or mobile services with large
    amounts of inclusive data and voice minutes, tend to have access to a wide range of keenly
    priced tariffs.
•   Although the promoted price of residential bundled standard broadband services was flat in
    2020, promoted prices for residential bundled superfast and ultrafast broadband services fell. 1

But some lower-use customers are less well served
•   Standard broadband customers who do not engage with the market can end up paying more
    than superfast users. The average promoted monthly price for a triple-play superfast package
    was £40 in January 2021, compared to a £44 average list price for similar services with standard
    broadband, meaning that some standard broadband users will pay a similar price, or more, for a
    less capable broadband service.
•   A shift towards mobile tariffs offering larger inclusive data allowances has meant that there are
    fewer offering 1GB or less of data per month. This has also resulted in the price of these services
    increasing, making them more expensive on average than SIM-only tariffs offering over 1GB and
    up to 10GB per month.
•   Similarly, our analysis of the prices of a range of mobile use ‘baskets’, each with different voice,
    text and data requirements, shows that while mobile prices fell overall, the average price for the
    two lowest-use connections (neither of which include any mobile data) increased in 2020. 2
•   There are now relatively few traditional pre-pay mobile tariffs (where the cost of use is deducted
    from a credit balance) and the price of these services has increased. Providers are instead
    offering ‘hybrid’ pre-pay tariffs with an allowance of calls, texts and data for a monthly fee.
•   Although hybrid pre-pay mobile tariffs enable pre-pay users to have inclusive allowances like
    pay-monthly customers, very low-use and occasional users may pay more.

Several of the largest providers introduced above-inflation price rises in 2021
•   Some leading fixed and mobile operators increased prices at above-inflation rates for new, and
    many existing, customers in 2021. For example, BT/EE increased prices by CPI +3.9% from April
    2021 across landline, broadband, TV, BT Sport and mobile; Three has introduced price increases
    of 4.5% (independent of CPI) to be applied each April; and Vodafone has introduced price
    increases of CPI +3.9%, also to be applied each April.

1 Standard broadband products have advertised speeds of less than 30Mbit/s, superfast broadband products are those
with advertised speeds of 30Mbit/s or more and less than 300Mbit/s, ultrafast broadband products have advertised speeds
of 300Mbit/s or more.
2 We use a model provided by pricing specialist Teligen, Strategy Analytics, to analyse the cost of baskets of services that

are designed to reflect the usage of ‘typical’ households, using the tariffs offered on major providers’ websites. See the
Methodology for full details.
                                                                                                                          5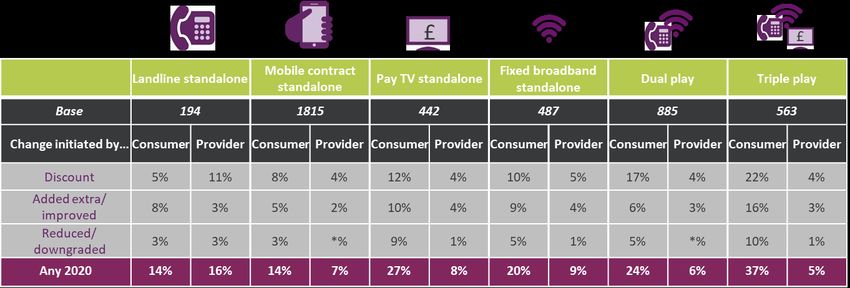
Pricing trends for communications services in the UK

•    When announcing price rises, several operators have said they will help fund investment in
     network capacity. In some cases, this will include investment in full-fibre and 5G infrastructure
     to enable faster and more reliable mobile and fixed connectivity as demand for data accelerates.

In a complex marketplace, shopping around brings considerable savings
•    A wide range of prices are available for similar services. For example, the average monthly price
     of dual-play landline and very high-speed digital subscriber line (VDSL) fibre-to-the-cabinet
     (FTTC) broadband bundles offered by leading providers ranged from £23 to £66 per month in
     March 2021.
•    The price paid is determined by a number of factors, such as broadband speed, inclusive call
     allowances, any value-added services (e.g. internet security software and wi-fi coverage
     guarantees) and the provider selected, and it is important that people understand their usage
     requirements so they can identify a service that suits their needs.
•    Customers taking out new contracts benefit from discounted prices that are typically lower than
     the ‘list prices’ paid by most out-of-contract customers. For example, in March 2021 dual-play
     customers taking a promotional offer could save on average 14% over the list price for both
     superfast and ultrafast services.

Many mobile customers are getting more for less
•    Mobile customers can often get more while paying less, particularly those buying services with a
     large data allowance.
•    Excluding the handset, the average cost of a basket of mobile services, based on average use
     across all mobile phone users, was £11 per month in 2020, 10% lower than a similar basket in
     2019, despite increased voice and data consumption.
•    Lower prices can generally be achieved by buying a handset and mobile airtime separately. 3 Our
     analysis of acquiring an iPhone 12 on tariffs with the four major mobile operators shows that it is
     cheaper to use a SIM-only plan with a separately purchased handset than to buy them together.
     The difference between the two prices is equivalent to customers being charged an APR (annual
     percentage rate) of between 8% and 23% for their handset ‘loan’.
•    The price premium required to receive 5G mobile services (rather than 4G) has fallen
     significantly as more providers have started to offer them. Our analysis shows that the average
     5G price premium across six mobile connections fell from over £21 per month in July 2019
     (when only two operators offered 5G) to £3 per month in October 2020.

Landline voice services are increasing in price as mobile prices fall
•    Average line rental prices increased by 4% to £19.62 per month in the year to March 2021, and
     the price of landline voice call bundles has increased, with evening and weekend package prices
     up by 7% on average to £6.29 per month and by 18% over two years. This came at a time when

3This refers to buying a handset and airtime from different providers or retailers, rather than taking out a split contract for
handset and airtime from the same provider.
                                                                                                                              6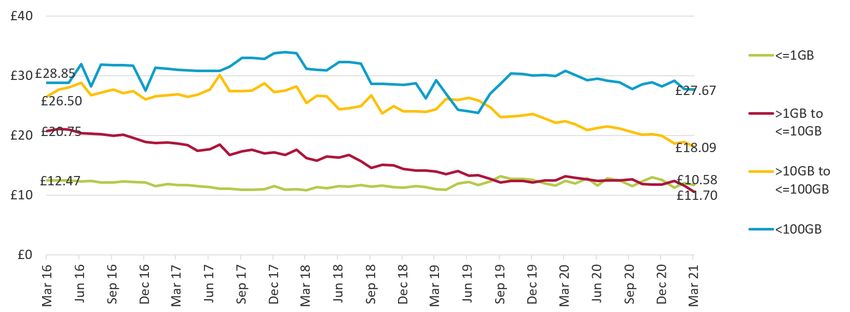
Pricing trends for communications services in the UK

     the Covid-19 pandemic resulted in an increased reliance on home phones and the first increase
     in residential fixed call volumes since 2003.
•    While landline prices have risen, the cost of out-of-bundle mobile calls has declined. The average
     price per minute across calls to UK landlines and mobiles fell by 23% in real terms during the
     year, to £0.29 pence per minute.

The affordability of communications services is an issue for some
•    Increasing prices for services may present affordability challenges to lower-income households.
•    Our consumer research suggests that around 2 million households reported having either an
     affordability issue with broadband and/or smartphone services in the past month, or are not
     taking these services at all, with cost being a factor. 4
•    Our analysis of expenditure and income data shows that the 3.3 million households with the
     lowest incomes in the UK spend on average over 4% of their disposable income on fixed
     broadband, nearly four times more than the proportion of an average household.

But some lower-cost tariffs are available to low-income households
•    Several fixed telecoms providers offer targeted discounted tariffs (on a voluntary basis) for
     people receiving certain benefits (or in some cases, those living in specific local authority
     housing). Our analysis of some of these tariffs suggests savings of between £7 and £27 per
     month compared to the price of equivalent or near-equivalent tariffs offered by the same
     providers.
•    During the pandemic fixed and mobile operators offered support to ensure that vulnerable
     households could get connected to the services they needed to access home learning and/or
     information resources.
•    This included mobile providers zero-rating data to a number of educational services and
     websites in order to help inclusive allowances go further, and giving additional mobile data to
     support disadvantaged children.

Prices have risen for TV services
•    Home entertainment increased in importance to many households during the pandemic, and we
     estimate that the average monthly promoted price of a basic pay-TV service, when bought as
     part of a triple-play bundle, was £14.82 in Q1 2021, a year-on-year increase of £3.83. It

4 The error range around the 2 million is +/- 500,000. This estimate is made up of: 800,000 households that reported having
at least one affordability issue with their broadband service in the past month; 1,200,000 that own a smartphone and
reported having an affordability issue with their mobile service in the past month; and 100,000 households that do not
have internet and do not intend to get this, at least partially due to cost (this calculation takes the lower end of the error
margin for this data point due to it being combined with other data sources). Some households experienced affordability
issues with both broadband and mobile services in the past month. The estimated number of households that experienced
an affordability issue with their broadband and/or mobile (among smartphone owners) i.e. removing this overlap, is 1.9
million (+/- 300,000). Note: the 2 million household estimate is based on data from two surveys and makes an assumption
that mobile affordability issues among smartphone owners at least in part relates to affordability of mobile internet
services. For further details please refer to Affordability of communications services: Summary of findings, Annex 2
(Consumer research technical annex).
                                                                                                                            7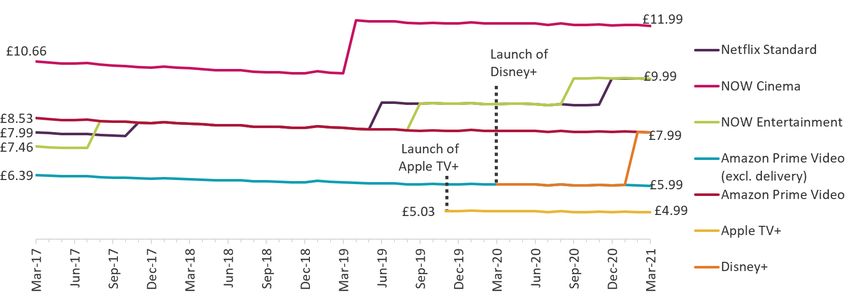
Pricing trends for communications services in the UK

    continues to be cheaper to purchase pay-TV as part of a bundle rather than on a standalone
    basis, and around 35% of UK homes take a bundled pay-TV service.
•   Spending on subscription video-on-demand (SVoD) is increasing. A further 2.7 million
    households subscribed to at least one SVoD service in the first nine months of 2020 – such
    offerings have taken SVoD penetration to 60% of UK homes by Q3 2020. 5 These services typically
    allow customers with a monthly subscription to subscribe and cancel from month to month.
    Several SVoD providers (Netflix, NOW and Disney+) increased their prices in 2021.

A quarter of households switched at least one communications service
•   A quarter (24%) of households reported that they had switched either their fixed landline,
    mobile, broadband or pay-TV service in the past 12 months. 6
•   Fixed broadband switching stood at 13% in 2020; this includes a minority (3%) who switched
    when moving home. However, nearly half of the switching by standalone landline customers
    occurred when moving home (17% switched their landline, 8% switched when moving).
•   Fifteen per cent of mobile standalone customers had switched provider in the past 12 months
    and switching was lowest for pay-TV (7% total). Across all markets, between 14% (landline) and
    37% (triple-play) of consumers had proactively contacted their provider to make changes (other
    than switching) to their service or package, and between 5% (triple-play) and 16% (landline) had
    made changes following contact from their provider.
•   Consumers had greater levels of engagement with the broadband and landline markets and
    lower levels of engagement with the pay-TV market. Those purchasing services on a standalone
    basis tended to be less engaged than those buying a package.

5 BARB Establishment Survey 2020 Q: Do you, or does anyone in your household, subscribe to the following… Note: Due to
the Covid-19 pandemic, the BARB Establishment survey was temporarily suspended when necessary due to restrictions,
resulting in no data collection for Q1 2021. Q4 2020 had some data collection but not enough for the results to be released
just for that quarter.
6 Data collected via Ofcom’s Switching Tracker between June-November 2020. Methodology changes mean that trend

comparisons are not possible. 22% had switched at least one communications service while remaining at the same address
in the 12 months before the interview.
                                                                                                                         8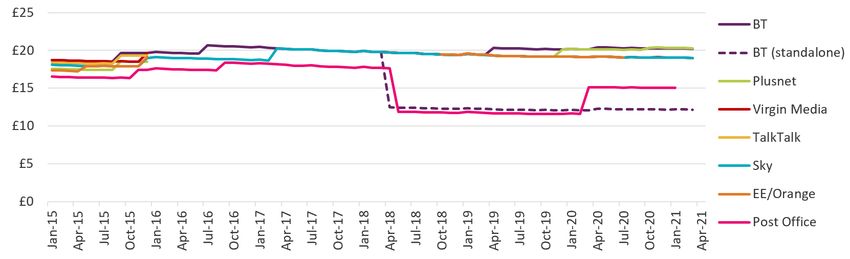
Pricing trends for communications services in the UK

Market context
The UK residential communications market is complex, with many tariffs and add-ons available
across landline, broadband, mobile and pay-TV services. The emergence of ultrafast broadband
services and full-fibre operators is bringing change in the fixed sector. The growing coverage of 5G
mobile services and new mobile virtual network operators, together with new models for acquiring
handsets, are altering the mobile landscape. Subscription video-on-demand (SVoD) services and
changing viewing habits are shaping the pay-TV and video-on-demand sector.

Increased dependency on communications services
During the Covid-19 pandemic there has been increased reliance on residential communications
services for home working, home schooling, shopping, entertainment and information services.
According to a telephone omnibus survey conducted in conjunction with Ofcom’s Technology
Tracker, 94% of UK households had access to the internet as of March 2021. 7 This suggests an
increase in the proportion of households with internet access from 89% in March 2020. 8 Recent
findings from Ofcom’s Adults’ Media Lives research support the idea that the pandemic has led to an
increase in digital access. 9
Qualitative research conducted for Ofcom in January 2021 found that for many households,
particularly younger families with children, broadband is considered an essential service, and many
do not know how they would function without it. Indeed, some said they would prioritise broadband
over other bills. 10

Data consumption continues to grow
Average fixed and mobile data consumption continued to increase in 2020. This was partly due to
Covid-19 lockdown measures, as people who were working from home turned to online voice and
video calling and the closure of schools resulted in growth in content streaming and online gaming,
as children learned and were entertained at home.
Data from our Connected Nations 2020 report shows that average monthly data consumption per
fixed broadband line increased by 36% to 429GB in 2020, while operator data shows that average
data consumption per mobile subscription (which is calculated across all mobile users, including

7 Ofcom’s Technology Tracker CATI omnibus survey, March 2021 (fieldwork 12 February to 5 March 2021) suggests that
86% of households had fixed broadband at home and 86% of adults claimed to use their mobile phone to access the
internet.
8 This should be considered as indicative only due to enforced methodology changes.
9 As a result of the Covid-19 pandemic, the Ofcom Technology Tracker was not able to conduct face-to-face fieldwork in

2021, the method by which previous Technology Tracker surveys have been conducted. Instead, data on internet access
was gathered via a CATI (telephone) survey in 2021. The survey was conducted among adults aged 18+ in 2021, and among
adults aged 16+ in 2020.
10 Understanding the financial impact of Covid-19: part 4, conducted for Ofcom by Blue Marble, has followed 25 British

households since May 2020, to understand everyday consumer confidence in the context of Covid-19 and explore the
impact on their financial lives. In January 2021 the sample was boosted to include an additional five households that have
been negatively impacted financially by the pandemic.
                                                                                                                        9
Pricing trends for communications services in the UK
those who do not use data services) increased by around a third to 3.9GB per month during the year.
Average monthly mobile use per mobile data user was even higher, at 4.5GB per month.
Figure 1: Fixed and mobile average monthly data use consumption
Source: The Communications Market 2021 and Connected Nations 2020 reports.
Household spend on communications increased slightly in 2020
Average monthly household spend on communications services was £122.51 in 2020, a £0.83 (1%)
increase compared to 2019.
Average spend on telecoms services was flat in real terms at £79 per month, as an increase in fixed
telecoms spend was offset by a similar fall in spend on mobile services. While lockdown measures
resulted in a 20% increase in outgoing calls from home landlines, the increase in fixed telecoms
spend can largely be attributed to growing take-up of home broadband (which accelerated during
the pandemic) and people upgrading to superfast and ultrafast services. Falling mobile spend came
despite increased consumption of mobile voice and data services and was due to falling prices.
Average monthly spend on TV services (which includes the TV licence fee) increased by £0.70 (2%) to
£38.22 during the year and, overall, communications accounted for 4.8% of total spend in 2020, up
0.1pp compared to 2019.
Figure 2: Average monthly household spend on communications services
Source: Ofcom / operators / ONS / Ampere Analysis.
Notes: Adjusted for CPI at 2020 prices; mobile telecoms spend excludes device revenues from 2018 onwards
10Pricing trends for communications services in the UK
due to a change in accounting standards; TV includes spend on over-the-top (OTT) subscriptions, download-to-
own and pay-per-view online TV services.
Transactional data can also be used to monitor trends in communications
spend
Data collected by Money Dashboard gives us anonymised financial transaction information for
people who are using the Money Dashboard app to help manage their finances. 11 By categorising
each transaction, a picture can be built of spending patterns by retail sector for this cohort of users.
On average, overall spend on communications-related services fell immediately after the March
2020 national lockdown, with all three communications categories rising in August and September
2020. Spending on mobile, phone and internet services then declined, while entertainment, TV and
media continued to increase until November 2020.
Figure 3: Average monthly spend on media and communications services, by category
Source: Ofcom analysis of Money Dashboard data.
Note: ‘Entertainment, TV, Media’ includes payments made to BT, Sky and Virgin Media for services as well as
payments for SVoD subscriptions and transactional video-on-demand (TVoD) transactions. ‘Phone or Internet’
includes payments to fixed-line telecoms and broadband providers as well as VoIP services; average monthly
spend by category is across the users of each category; adjusted for CPI (December 2020 prices).
In general, the higher the income, the more households spend on
communications services
Money Dashboard data can also compare spending patterns by income band. Those with over
£80,000 annual income were the highest spenders on communications services in 2020, at over
£120 per month, over 50% more than the average spend of those with an income of less than
£10,000.
11This dataset is based on the aggregated transaction data of 46,000 people who have been sharing information since at
least 2018.
11Pricing trends for communications services in the UK
Figure 4: Average monthly spend on media and communications services, by ‘main source of
income’ band
Source: Ofcom analysis of Money Dashboard data.
Note: Adjusted for CPI (December 2020 prices).
Lower income means higher proportional spend on communications services
As Figure 5 shows, people whose main income source provides less than £10,000 a year spend
around 10% of their earnings on media and communications services. This group is likely to include
those on universal credit, state pension and statutory sick pay.
Figure 5: Proportion of salary spent on media and communications services, by ‘main source of
income’ band: 2020
Source: Ofcom analysis of Money Dashboard data.
Note: The median salary within each salary band has been used in this calculation.
In 2021, above-inflation price increases were implemented
After years of falling prices across a range of communications services, leading providers have
introduced a series of above-inflation price increases for new and some mid-contract customers in
2021, as outlined in Figure 6.
12Pricing trends for communications services in the UK
Figure 6: Pricing announcements by selected leading providers: 2021
Provider Effective Details
BT, EE 31 March Prices to rise by CPI+ 3.9% across landline, broadband, TV, BT Sport & mobile.
2021 Also affects extra charges e.g. out-of-allowance calling rates and add-ons.
Applies to all new customers, and those re-contracting from 1 September 2020
Sky April 2021 Price rises effective from 1 April 2021 for broadband and TV customers and from
(broadband 1 May 2021 for home phone customers. Broadband Essential increased by
& TV); May £3/month, Broadband Superfast by £1/month. Sky Talk Anytime Extra and Talk
(phone) International Extra increased by £2 per month
TalkTalk April 2021 Annual price increase introduced for the first time. Price rises from April 2021 of
£2 for all TalkTalk broadband packages, or a capped amount of £3 for customers
with add-ons e.g. calling features. From April 2022 charges will increase by
inflation plus 3.7%
Three April 2021; Annual increase of 4.5% to be applied each April for new customers, or those
February upgrading their service on or after 29 October 2020. Pre-pay SIM-only top-up
2021 increase (announced January 2021)
Virgin March Average price increase is 4.0% on bills from 1 March 2021. Most customer
Media 2021 increases between £2.50 and £4.50/month, averaging £3.63. No change for
vulnerable customers including the Essential Broadband package for people
receiving Universal Credit and Talk Protected landline customers
Vodafone April 2021 Customers signing up after 9 December 2020 will have a 3.9% price increase on
top of the CPI published each January, to be applied each April
Source: Operator websites / news reports.
Note: Some of these increases (e.g. from BT, EE, Three, Vodafone and Virgin Mobile) are specified in customer
contracts, while Sky’s TV contracts say that prices ‘may’ increase, but limits these increases to a maximum of
10%. Other providers’ increases (e.g. Sky Talk and Broadband and Virgin Media cable) are not included in the
T&Cs. Customers may have the right to exit their contracts if providers increase prices during the contract term.
What are consumers getting in return?
Several providers have said that these price increases reflect the investment needed to support
growing demand, and that they are necessary to enable them to continue investing in their
networks, products and services.
On the mobile side this includes the continued expansion of 4G coverage and upgrading to 5G. On
the fixed side, while the UK’s copper telephone network has helped deliver superfast broadband to
96% of homes, as demand for data continues to accelerate, the infrastructure urgently needs an
upgrade. Both will require significant private investment in full-fibre broadband and mobile
infrastructure, to provide much faster and more reliable networks.
In the subscription video-on-demand (SVoD) sector, providers have linked their price rises to
increased content investment. Netflix spent $1bn (£743m) on British productions in 2020 and
Disney+ added Star, a hub containing adult-orientated content, which more than doubled the
amount of content available to subscribers, in February 2021.
13Pricing trends for communications services in the UK
Lowest-priced providers
Price competition is a sign of a well-functioning market. To help us identify the challenger providers
in the fixed and mobile markets we undertook analysis in two service categories within the fixed and
mobile sectors:
• dual-play landline and fixed broadband bundles with superfast broadband; and
• SIM-only mobile phone services offering a monthly data allowance of more than 10GB and
up to 100GB.
Fixed market
To identify price challenger providers in the market for superfast dual-play bundles we have used
tariff data taken from Pure Pricing’s Monthly Broadband Pricing Tracker reports.
Using this data, we calculated an average price across all superfast dual-play services and an average
price for each of the providers with superfast dual-play services. We then identified the provider
with the lowest average price and compared it to the average across all services in the category to
calculate a percentage saving. This saving is represented in the charts below by the height of each
bar: the higher the bar, the greater the discount. This calculation was undertaken for each month
from December 2016 to March 2021.
Vodafone, which relaunched its home broadband services in 2015, was the provider with the lowest
average price for superfast dual-play services in most of the months included in the analysis. More
recently, NOW and Post Office (whose telecoms business has been acquired by Shell Energy) had the
lowest average prices for these services. Of the four largest providers’ main brands, only Sky and
TalkTalk had the lowest superfast bundle prices at any point during the period in question. 12
Figure 7: Dual-play superfast broadband: cheapest provider and savings vs. average price
Source: Ofcom / Pure Pricing's Monthly Broadband Pricing Tracker reports.
12In March 2021 Shell Energy announced that it had completed the purchase of Post Office’s broadband and telephony
business, with Post Office customers due to start moving over to Shell Energy in August 2021.
14Pricing trends for communications services in the UK
Mobile market
To understand who the price challenger providers are in the mobile market, we undertook similar
analysis using tariff data for SIM-only mobile phone services offering more than 10GB and up to
100GB of inclusive monthly data.
Three was the only mobile network operator (MNO) whose main brand had the lowest average
prices in any of the months covered by our analysis. Plusnet had the lowest average price for these
services in all but one of the 18 months to March 2021, while BT Mobile, iD Mobile and Virgin
Mobile each had the lowest average price for more than six months during the period covered.
Figure 8: Pay-monthly SIM-only mobile with >10GB and ≤100GB monthly data allowance: cheapest
provider and savings vs. average price
Source: Ofcom / Pure Pricing's Monthly Mobile Pricing reports.
In-bundle and out-of-bundle spend
Consumers’ spend may differ from month to month depending on how much of their usage is
included in their monthly charge, or their bundle, and how much falls outside this allowance: they
may be charged extra for this in their monthly bill.
Using operator data collected for this report, we can analyse how much average monthly spend is
inside and outside customers’ allowance. Standalone landline services had the highest out-of-bundle
spend, as a proportion of average spend, at 26%. This is likely to be due to customers making calls
outside their calling packages or not having signed up for any such packages. Consumers taking dual-
play bundled services comprising landline and fixed broadband products spent on average 6% of
their total spend outside their inclusive package. Out-of-bundle spend was lowest for standalone
broadband at 1%, and less than 1% for standalone pay-TV services, while for standalone mobile out-
of-bundle spend was 8% of total average spend at £2.
15Pricing trends for communications services in the UK
Figure 9: In-bundle and out-of-bundle spend, by service type
Source: Ofcom / operator data.
Notes: Dual-play refers to landline and fixed broadband bundles, triple-play to landline, fixed broadband and
pay-TV bundles and quad-play to landline, fixed broadband, pay-TV and mobile phone bundles.
16Pricing trends for communications services in the UK
Consumer engagement, fairness and
affordability
Consumer engagement
In 2020, as a result of the Covid-19 pandemic, the decision was taken to suspend all face-to-face
fieldwork across all consumer research projects to protect the safety of everyone involved. As a
result, Ofcom’s Switching Tracker changed from using a 100% face-to-face methodology to using a
combination of post-to-web, post-to-phone and online methodologies. Fieldwork was spread over a
longer period (June to November) in order to capture responses by all methods. For these reasons,
we have not made any comparisons with previous years.
A quarter of households switched at least one communication service
A quarter (24%) of households had switched provider for at least one of their communications
services in the past year. 13 Seventeen per cent of landline standalone customers had switched
(about half of these when moving to a new home). A fifth of standalone fixed broadband and 15% of
mobile standalone customers said they had switched provider during the year. Pay-TV had the
lowest level of switching.
Figure 10: Percentage of consumers switching in the past 12 months
Source: Ofcom Switching Tracker (fieldwork conducted between June and November 2020).
Notes: ¹ Dual play refers to those who use the same provider for their landline and broadband services (but not
pay-TV or mobile); ² Triple-play refers to those who use the same provider for their landline and broadband
services and pay-TV (but not mobile).
13 Data collected via Ofcom’s Switching Tracker between June-November 2020. Due to methodology changes, trend
comparisons are not possible. 22% had switched at least one communications service while remaining at the same address
in the 12 months before the interview.
17Pricing trends for communications services in the UK
Around one in ten households made changes to their packages to make them
more affordable
Our December Affordability report found that, on average, 11% of households had made changes to
a communications service in order to make it more affordable. Similarly, our Switching Tracker
showed that some consumers had downgraded or reduced their services, or received a discount, in
the past 12 months, although it also suggests that some had upgraded or added extra services to
their package.
Fourteen per cent of standalone contract (pay-monthly) mobile customers had made changes to
their existing package in the past 12 months by contacting their provider, including receiving a
discount, adding extra or improved services, or reducing or downgrading services. In addition, 7%
had made changes after being contacted by their provider.
Triple-play customers were the most likely to have proactively made any changes to their service,
with over a third (37%) saying they had contacted their provider to change their package in the past
12 months. Consumers of most services, or packages of services, were more likely to have improved
or added extra services to their package than to have downgraded or reduced their services, as
illustrated in Figure 11.
At least some of this behaviour can be linked to the various initiatives that providers put in place to
support customers through the pandemic. For example, increased mobile data allowances and the
removal of capped broadband may have been interpreted by consumers as being discounts.
Figure 11: Changes made to packages by customers
Source: Ofcom Switching Tracker.
Varying levels of engagement among consumers
There are a number of ways in which consumers can engage with the communications market – they
can be ‘considering switching’, ‘keeping an eye on the market’ or ‘making changes to existing
services’. In order to engage effectively with the market, consumers should be confident in the
following three aspects of engagement: a) understanding the language and terminology used by
providers, b) speaking to providers about new deals, and c) comparing the costs of various offers.
Ofcom’s Engagement Index, taken from our Switching Tracker, takes all these factors into account
and classifies consumers as being active, browsers, dormant, unmotivated, apprehensive or
18Pricing trends for communications services in the UK
resigned. A brief description of each of these segments is shown below. The detailed definitions
used to create each segment can be found in the Methodology annex.
• Active: The most recently engaged segment. They have taken one or more of the following
actions in the past year: switched supplier, negotiated with their existing supplier or assessed
the market.
• Browsers: Have not engaged as recently as the active segment but are planning to and/or are
currently looking around.
• Dormant: Have either switched previously (13-24 months ago) or are in a new contract. They
may also have reactively made a change to their existing service in the past year.
• Unmotivated: Are confident with aspects of engagement but have not made any changes to
their service in at least the last two years, and are not planning to.
• Apprehensive: Are not confident in at least one of the three aspects of engagement (as set out
above) and have not made any changes to their service in at least the last two years, nor are
they planning to. They say they are satisfied with their existing service.
• Resigned: Are unhappy with their existing service and have not sought to engage in at least the
last two years, and are not planning to.
Standalone customers are the least engaged
Most consumers fall into one of the more engaged segments (active, browser or dormant), although
this varies according to the type of contract or deal the consumer has. Standalone landline,
standalone pay-TV and mobile pre-pay customers are the least engaged groups, with the highest
proportions falling into the resigned, apprehensive or unmotivated segments.
The proportion of consumers falling into the active segment was highest among broadband and
landline decision-makers (43% and 40%), and lowest among standalone pay-TV decision-makers
(31%). Those aged 65+ tended to be more apprehensive in their engagement with each
service/package provider, whereas those aged 16-24 were the most likely group to be active in the
mobile market. Those in the DE socio-economic group were the least likely to be active and the most
likely to be apprehensive in the landline and mobile phone markets.
Figure 12: Switching Tracker Engagement Index
Source: Ofcom Switching Tracker 2020.
19Pricing trends for communications services in the UK
Base: All adults aged 16+ who are the decision-maker for a mobile phone – contract or pre-pay (2862), contract
mobile phone (2275), pre-pay mobile phone (587) for the household’s fixed broadband service (2508), the
decision-maker for the household’s landline service (2020), standalone landline – don’t use landline provider for
another service (194), standalone landline no broadband – don’t use landline provider for another service and
don’t have fixed broadband (74*), who are the decision-maker for the household’s pay-TV service (1338),
standalone pay-TV – don’t use main pay-TV provider for another service (442).
Fairness
Helping consumers find better deals
Fairness for customers of communications services continues to be a priority for us. It is vital that
people and businesses are treated fairly by their providers and can trust that markets operate with
integrity. We have taken action to make sure customers are treated fairly and we continue to
challenge companies to do more.
New rules introduced in February 2020 require phone, broadband and pay-TV companies to notify
customers, between 10 and 40 days before their contract ends, about how much they will pay after
this point, and to provide information on the provider’s best deals, including any prices available
only to new customers. For customers with a single bundled contract for their mobile service and
handset, these end-of-contract notifications (ECNs) will include at least one SIM-only deal. Anyone
who is already out of contract must also be reminded annually that they are out of contract and told
about their provider’s best deals.
In addition, Ofcom has secured commitments from the UK’s major fixed broadband providers to
conduct price reviews for their vulnerable customers, including providing discounts that do not
require these customers to engage with their provider.
The effect of these commitments is that many vulnerable people who face barriers to engaging, and
who may therefore find it more difficult to act in response to receiving an ECN, will not experience
out-of-contract price rises. Similarly, we have secured commitments from the major mobile
companies – except Three – to reduce bills for customers who bundle their handset and airtime
together in a single contract and are past their initial contract period. As a result, out-of-contract
bundled handset and airtime customers with all participating providers will receive a discount on
their bills.
We will publish a report on the impact of ECNs and the pricing commitments made by major
broadband and mobile providers in autumn 2021. This will be informed by customer level data
obtained from the UK’s major broadband and mobile providers, which we are currently in the
process of analysing.
Personalised pricing
As part of our work in 2020/21 on making data work for customers, under Ofcom’s strategic priority
of fairness for customers, we have considered personalised pricing.
Personalised pricing – the practice of charging customers different prices based on what the seller
thinks the customer is prepared to pay – is a sophisticated form of price discrimination. As in many
20Pricing trends for communications services in the UK
other sectors, communications providers can now understand their customers in ways that were not
previously possible. By collecting information about them, and processing it using algorithms,
particularly machine learning algorithms, firms can gain insight into how much customers are willing
to pay for their services or products.
Offering different prices to different customers is not a new practice; what has changed is
companies’ ability to use data and machine learning to do it more precisely. This personalised pricing
differs from the long-established method of price discrimination by group, like student discounts. It
is also distinct from dynamic pricing, such as when airlines increase prices as the number of available
seats decreases.
Personalised pricing can be implemented in different ways; for example, by offering all customers
the same price, but personalising the discounts that can be accessed based on the individual’s
product use, interactions with the company, and/or personal characteristics. Another approach
might be adjusting the quality or quantity of the product offered to each customer.
The extent to which customers receive personalised prices varies across the different sectors of the
economy. In our discussion paper published in August 2020 we looked at how personalised pricing
might evolve in the communications sector and the potential implications for customers.
The paper shared the results of our qualitative research on consumers’ perceptions of personalised
pricing of communications services. Although some participants recognised the potential benefits,
such as lower prices for lower-income households, concerns were much more common. They felt
that personalised pricing was ‘unfair’, with a lack of transparency about how the price would be
calculated and uncertainty about whether they had a good deal.
The paper explored a range of issues relating to customer fairness that personalised pricing could
create. We expect that giving people the ability to compare prices effectively, and the transparency
of the process, will be particularly important. Greater personalisation could also have implications
for pricing outcomes and for levels of trust in the market.
We want to stay at the forefront of how the communications sector is evolving. We will closely
monitor how pricing practices develop, such as looking at data on the distribution of pricing
outcomes over time for similar products, so we can keep track of any evolving trends.
21Pricing trends for communications services in the UK
Affordability and support
Our Covid-19 Affordability Tracker research 14 suggested that 18% of households had had an
affordability issue with at least one communications service (including 5% for fixed broadband and
6% for mobile) in the month before they were surveyed. This was similar to the situation we
reported in December 2020. 15 Lower-income households, and those in receipt of at least one type of
benefit, were more likely to have an affordability issue with their fixed broadband service and with
all communications services.
Our analysis of provider data suggests that for broadband services many customers who are more
likely to have affordability issues may be able to reduce their bills by shopping around for a better
deal. 16 But for some customers on the lowest household incomes, engaging with the market may not
be sufficient to prevent affordability problems.
For fixed broadband, our analysis of expenditure and income data shows that the 3.3 million
households in the lowest income decile spend nearly four times as much on fixed broadband (as a
proportion of their disposable income after housing costs) as the median household (4.2% compared
to 1.2%) and nearly twice as much as those in the second decile (2.3%). As the lowest decile spend a
significantly higher proportion of their income on fixed broadband, they may not be able to resolve
affordability issues solely by shopping around for the best deal. For these households, targeted
tariffs offering lower prices may be necessary to make services affordable.
In our December 2020 summary of initial findings, we strongly encouraged providers that do not
already offer targeted tariffs to consider introducing them.
Low-cost broadband packages for those in financial difficulties
As is shown in Figure 13, several fixed broadband providers offer low-cost packages, that are
cheaper compared to commercially offered products at equivalent speeds (VOXI also currently offers
a mobile tariff).
These tariffs are available to people in receipt of certain means-tested benefits. Currently, five
providers offer a targeted tariff for £15 or £10 per month, while a sixth, KCOM, offers a tariff for
£19.99. Our analysis indicates that such prices can help households that are likely to have
affordability issues, with deeper discounts particularly beneficial for those on the lowest incomes.
14 The consumer research included in this report (unless otherwise stated) is the average taken from interviews conducted
between November 2020 and April 2021, using monthly telephone interviews among c.1,100 UK households.
15 In our December 2020 report we reported that 19% of households (based on an average for that period) reported an
affordability issue with at least one communications service.
16 In May 2021, we found that the cheapest tariffs for a standard dual-play service and for superfast connections were
£16.99 and £22 per month respectively. In contrast, we found that households in the top 10% most deprived areas were
spending on average £26 and £31 per month for standard and entry-level superfast services respectively. As such, those
customers could reduce their bills by around £9 per month if they switched to the cheapest tariffs available on the market.
22Pricing trends for communications services in the UK
Figure 13: Comparison of providers’ targeted internet tariffs
Provider Price Speed Eligibility 17 Call Discount vs Discount vs
allowance provider’s cheapest
cheapest market-
equivalent equivalent 18
BT Home £15 36 Universal Credit (UC), 700 mins £23 /mth £10 /mth 20
Essentials 19 /mth Mbit/s Jobseeker’s Allowance
BT Home £20 67 (JSA), Employment Support Unlimited £27 /mth £5 /mth
Essentials 2 /mth Mbit/s Allowance (ESA), Pension mins
Credit (Guarantee Credit)
Community £10 10 UC, Income-based JSA, n/a £10 /mth £7 /mth
Fibre 21 /mth Mbit/s Income-related ESA,
Housing Benefit, Personal
Independent Payment (PIP)
Hyperoptic £15 50 UC, Income-related JSA, n/a £7 /mth £7 /mth
Fair Fibre /mth Mbit/s Income-related ESA, (evening
50 22 Pension Credit, Housing &
Hyperoptic £25 150 Benefit, PIP weekend £10 /mth £5 /mth
Fair Fibre 150 /mth Mbit/s calls £3
/mth)
KCOM Full £19.99 30 UC zero earnings, JSA, 20 local £10 /mth £2 /mth 23
Fibre Flex /mth Mbit/s Income-related ESA, Income calls & 60
Support, Pension Credit, mins to
Housing Benefit, PIP 0845/
0870, with
£10 cap
Virgin Media £15 15 UC n/a £10 /mth 24 £2 /mth
Essential /mth Mbit/s
broadband
VOXI For £10 5G UC (employment based), Unlimited £25 /mth £5 /mth
Now 25 /mth JSA, ESA mins &
texts
Source: Ofcom / Pure Pricing's UK Monthly Broadband Pricing Tracker June 2021 / Pure Pricing's UK Monthly
Mobile Pricing Update July 2021.
17 The criteria listed here are not exhaustive for all providers. Full lists are provided on the websites linked to in the table.
18 Prices are compared to the cheapest UK-wide commercially available tariff in the equivalent speed bracket (e.g.
standard, superfast, ultrafast) as given by Pure Pricing's UK Monthly Broadband Pricing Tracker June 2021.
19 BT and KCOM both also offer a regulated landline-only social tariff. BT Home Essentials landline only offers unlimited
calls for £10 a month. KCOM’s Flex Call Only offers 20 local calls and 60 minutes to 0845/ 0870 numbers for £5.10 a month,
with a £10 spend cap once the inclusive call allowance has been reached.
20 This is compared to the cheapest tariff offering unlimited minutes, therefore likely overstates the relative discounting.
21 These products are only open to applications for a specified period: Community Fibre’s is open until the end of July 2021.
22 Hyperoptic also offers dual-play tariffs, which are £3 per month more than the broadband-only tariffs in the above table.
23 This product offers a £10 per month discount on commercial pricing available in the Hull area.
24 Virgin Media does not offer a comparable commercial standard speed product, so this is compared to the operator’s
cheapest superfast broadband tariff.
25 These products are only open to applications for a specified period: VOXI’s is open until the end of September 2021.
23Pricing trends for communications services in the UK
Note: KCOM, Virgin Media , BT (targeted tariff), BT (provider equivalent), Community Fibre, VOXI, Hyperoptic
(accessed at 15 July 2021). Discounts are rounded to the nearest whole number.
Support for vulnerable customers during the Covid-19 pandemic
Providers offered ongoing support to customers to help them cope with the Covid-19 restrictions at
an estimated cost of £940m. 26 This included measures in response to the initial lockdown in March
2020 and further provisions including the Get Help with Technology scheme, following restrictions
from November 2020 onwards. This support included additional mobile call, text and data
allowances, free access to healthcare information and zero-rated access to education resources, and
even in some cases devices to help with online learning.
Support initiatives continue to be announced. In June 2021 Vodafone said it would be working with
The Trussell Trust’s UK network of food bank centres to distribute SIM cards loaded with 20GB of
data plus free calls and texts allowance renewed each month, each providing connectivity for up to a
year, to people in need. This falls under Vodafone’s plan to connect a million people living in digital
poverty by the end of 2022 through a range of programmes, including its Great British Tech Appeal
and its new Buy One, Give One initiative for customers of Vodafone Together, its converged
broadband and mobile package.
Early lockdown support for vulnerable customers
In March 2020 the Government announced that an agreement had been reached with the industry
on the treatment of vulnerable customers. 27 BT/EE/Plusnet, Virgin Media, Sky, TalkTalk, O2,
Vodafone, Three, Hyperoptic, Gigaclear and KCOM signed up to a set of four commitments to
support customers during the Covid-19 crisis. In May 2020, LycaMobile, G.Network, giffgaff, iD
Mobile, Post Office, Tesco, Spectrum Internet and Voneus also joined the initiative. All committed
to:
• work with customers who find it difficult to pay their bills because of Covid-19, to ensure that
they are treated fairly and appropriately supported;
• remove data allowance caps from all current fixed broadband services;
• offer new, generous mobile and landline packages to ensure that people are connected and the
most vulnerable continue to be supported (for example, data boosts or free calls); and
• ensure that vulnerable customers and those self-isolating receive alternative methods of
communication where possible, if priority repairs to fixed networks cannot be carried out.
These commitments were in addition to a range of supportive measures offered by individual
providers including the relaxation of data and usage caps.
26 Assembly Research suggests that UK telecoms companies had provided £940m in Covid-19 support as of 21 January
2021.
27 Government agrees measures with telecoms companies to support vulnerable consumers through COVID-19 - GOV.UK
(www.gov.uk)
24Pricing trends for communications services in the UK
Mobile data allowances for online learning in later lockdown
The Government announced the Get Help with Technology scheme in January 2021, under which
mobile providers agreed to offer additional mobile data to support disadvantaged children with
remote learning. BT Mobile, EE, giffgaff, iD Mobile, LycaMobile, O2, Sky Mobile, Smarty, Tesco
Mobile, Three, Virgin Mobile and Vodafone support the initiative, which is due to run until July 2021.
Families of disadvantaged students in years 3 to 13, and those in further education who are
customers of a participating provider and do not have fixed broadband at home, who cannot afford
additional data for their devices and are experiencing disruption to their face-to-face education, can
apply for the extra data through schools, trusts and local authorities. Several providers have zero-
rated data charges to popular learning portals, as shown in Figure 14.
Figure 14: Covid-19-related support for vulnerable customers: 2020/2021
Provider Announced Measures taken for remote learning* and other support
BT/ EE/ January 2021 Zero-rated data to several education sites including BBC Bitesize and Oak
Plusnet National Academy
‘Lockdown Learning’ support scheme for pupils and families who have
limited access to the internet, offering free mobile data and wi-fi vouchers
iD Mobile January 2021 Unlimited data to pre-pay and pay-monthly customers
LycaMobile February 20GB of free data per month to eligible families for home learning
2021
O2 March 2020 Zero-rated access to more than 20 support, financial guidance and advice
websites including Citizens Advice, Money Advice Services, Mind
June 2020 Zero-rated access to websites supporting victims of crime, sexual abuse
domestic violence situations and vulnerable children
January 2021 40GB extra data for families with disadvantaged pupils in years 3 to 11
Zero rated data access to Oak National Academy
Sky Mobile January 2021 100GB extra to pay monthly customers
Smarty January 2021 Unlimited data to pre-pay and pay-monthly customers
Tesco January 2021 20GB extra to pay-monthly customers
Three April 2020 Zero-rated NHS video consultations provided by Attend Anywhere
January 2021 Unlimited data to pre-pay and pay-monthly customers
Zero-rated data access to Oak National Academy
Virgin January and Zero-rated Oak National Academy learning resources website
Media February 20GB additional mobile data per month for families in financial difficulties
2021 Free data, minutes, and texts for vulnerable customers
Help for Home Learners launched to provide 1,500 laptops and mobile
dongles to school children and young adults struggling to learn virtually
Vodafone March 2020 Zero-rated access to NHS UK online, including the websites of NHS England,
Northern Ireland, Scotland and Wales. Includes VOXI customers
January and Free and discounted access to online education platforms Azoomee: (three
February months free access), MarcoPolo World School (60-day free trial),
2021 SchoolOnline.co.uk (33% off subscription), New Skills Academy (76% off
courses). 350,000 free 30GB SIMs for families (since November 2020) and
extended by another 150,000
Source: Provider websites / media reports / Pure Pricing.
Note: Mobile providers also started to offer a range of support in March 2020.
25You can also read