Bae urban economics City of Sunnyvale Housing Strategy
←
→
Page content transcription
If your browser does not render page correctly, please read the page content below
bae urban economics

City of Sunnyvale Housing Strategy
Prepared by BAE Urban Economics with Support from
PlaceWorks, Goldfarb & Lipman, and Novin Development
Approved October 13, 2020
bae urban economics
          March 4, 2020

          Jenny Carloni, Housing Officer
          Trudi Ryan, Community Development Director
          City of Sunnyvale
          456 W. Olive Ave.
          Sunnyvale, CA 94086

          Dear Ms. Carloni and Ms. Ryan:

          We are pleased to submit the enclosed City of Sunnyvale Housing Strategy Report. This report
          summarizes some of Sunnyvale’s most pressing housing challenges and presents strategies to
          address these challenges.

          We hope that this report is helpful in assisting the City with its ongoing efforts to address a
          wide range of housing needs within the community.

          Sincerely,

          Matt Kowta, MCP                                            Stephanie Hagar, MCP
          Managing Principal                                         Associate Principal

San Francisco              Sacramento             Los Angeles                     Washington DC                New York City
2600 10th St., Suite 300   803 2nd St., Suite A   448 South Hill St., Suite 701   1140 3rd St. NE, 2nd Floor   234 5th Ave.
Berkeley, CA 94710         Davis, CA 95616        Los Angeles, CA 90013           Washington, DC 20002         New York, NY 10001
510.547.9380               530.750.2195           213.471.2666                    202.588.8945                 212.683.4486
                                                         www.bae1.com
Table of Contents EXECUTIVE SUMMARY ................................................................................................................ i INTRODUCTION .......................................................................................................................... 1 Council Direction on Issues to Study .......................................................................................... 1 Community Engagement Process ............................................................................................... 2 Report Organization ..................................................................................................................... 4 OVERVIEW OF EXISTING CONDITIONS ....................................................................................... 6 Demographic Trends .................................................................................................................... 6 Housing Cost Burden and Overcrowding .................................................................................... 9 Housing Market Characteristics ............................................................................................... 11 MOBILE HOME PARK HOUSING ISSUES .................................................................................. 17 Sunnyvale Mobile Home Park Background ............................................................................. 17 Mobile Home Park Housing Considerations ............................................................................ 25 Potential Strategies for Addressing Mobile Home Park Housing Needs ............................... 26 Community Input on Mobile Home Park Strategies ................................................................ 31 AGE-FRIENDLY HOUSING ISSUES ............................................................................................ 33 Age-Friendly Housing Background ........................................................................................... 33 Age-Friendly Housing Considerations ...................................................................................... 36 Potential Strategies for Addressing Age Friendliness in Housing .......................................... 38 Community Input on Age-Friendly Housing Strategies ............................................................ 40 SUPPLY-SIDE HOUSING ISSUES .............................................................................................. 42 Supply-Side Housing Issues Background ................................................................................ 42 Supply-Side Housing Considerations ....................................................................................... 47 Potential Supply-Side Housing Strategies ............................................................................... 48 Community Input on Supply-Side Housing Strategies ............................................................ 59 DEMAND-SIDE HOUSING ISSUES ............................................................................................ 61 Demand-Side Housing Issues Background ............................................................................. 61 Demand-Side Housing Considerations .................................................................................... 65 Potential Demand-Side Housing Strategies ............................................................................ 66
Community Input on Demand-Side Housing Strategies ......................................................... 70
RECOMMENDED STRATEGY PRIORITIZATION ......................................................................... 71
 Policy Selection Methodology ................................................................................................... 71
 Implementation Priority Rankings ............................................................................................ 73
 Policy Goals ............................................................................................................................... 75
List of Tables
Table 1: Historic and Projected Population and Household Growth, Sunnyvale and the
Two-County Subregion, 2000-2040 ................................................................................................ 7
Table 2: Multifamily Rental Housing Stock, City of Sunnyvale, Q4 2018 (a) .............................. 13
Table 3: Mobile Home Park Strategy Priority Ranking from Community Engagement
Process ............................................................................................................................................ 32
Table 4: Sunnyvale Age-Friendly Survey Findings, Top Issues Identified as Very
Important or Extremely Important, 2018 ...................................................................................... 34
Table 5: Age-Friendly Housing Strategy Priority Ranking from Community Engagement
Process ............................................................................................................................................ 41
Table 6: Regional Housing Needs Assessment Allocation Progress, City of Sunnyvale,
01/31/2015-01/31/2023............................................................................................................ 43
Table 7: Employment and Housing Unit Growth, 2007-2018 ..................................................... 44
Table 8: Supply-Side Housing Strategy Priority Ranking from Community Engagement
Process ............................................................................................................................................ 60
Table 9: Demand-Side Housing Strategy Priority Ranking from Community Engagement
Process ............................................................................................................................................ 70
Table 10: Summary of Tier Recommendations and Implementation Requirements................. 74
List of Figures
Figure 1: Household Income, 2012-2016 ...................................................................................... 7
Figure 2: Household Income Distribution Among Renter Households, Sunnyvale and
the Two-County Subregion, 2012-2016 .......................................................................................... 8
Figure 3: Age Distribution, 2012-2016 ........................................................................................... 9
Figure 4: Housing Cost Burden by Tenure and Household Income Level, Sunnyvale
Households, 2011-2015 ................................................................................................................ 10
Figure 5: Persons per Room, City of Sunnyvale, 2012-2016 ...................................................... 11
Figure 6: Occupied Housing Units by Tenure, 2012-2016 .......................................................... 12
Figure 7: Units by Type of Structure, 2012-2016 ......................................................................... 12
Figure 8: Average Multifamily Rental Asking Rents and Vacancy Rates, City of
Sunnyvale, 2009-2018 (a) (b) ....................................................................................................... 14
Figure 9: Median Home Sale Prices, Selected Santa Clara County Cities, December
2018 ................................................................................................................................................ 15
Figure 10: Median Home Sale Price Trends, 2009-2018............................................................ 16
Figure 11: Mobile Home Parks in Sunnyvale, 2020..................................................................... 18
Figure 12: Sunnyvale Mobile Home Park Resident Demographic Overview, 2012-2016 ......... 20
Figure 13: Length of Current Leases in Sunnyvale Mobile Home Parks Represented in
Mobile Home Park Owner Survey .................................................................................................. 22
Figure 14: Length of Residency in Sunnyvale Mobile Home Parks Represented in
Mobile Home Park Owner Survey .................................................................................................. 22
Figure 15: Mobile Home Space Rents Reported in Responses to Sunnyvale Mobile
Home Park Resident Survey .......................................................................................................... 23
Figure 16: Percent of Monthly Income Spent on Housing Costs Among Respondents to
Sunnyvale Mobile Home Park Resident Survey ............................................................................ 24
Figure 17: Household Income Among Respondents to Sunnyvale Mobile Home Park
Resident Survey .............................................................................................................................. 24
Figure 18: Projected Growth in the Population Age 65+, Santa Clara County, 2019-
2040 ................................................................................................................................................ 33
Figure 19: Sunnyvale Age-Friendly Survey Findings, Anticipated Home Modification
Needs, 2018 ................................................................................................................................... 35
Figure 20: Affordability of Market-Rate Rental Units for Low-Income Households by
Household Size, Sunnyvale, 2018................................................................................................. 62
Figure 21: Affordability of Market-Rate Rental Units for Moderate-Income Households
by Household Size, Sunnyvale, 2018 ............................................................................................ 63
Figure 22: Affordability of For-Sale Housing for Four-Person Households by Income
Level, Sunnyvale, 2018 .................................................................................................................. 64
Figure 23: Affordable Home Sale Price for a Four-Person Moderate-Income Household,
With and Without City Down Payment Assistance, 2018 ............................................................. 65
EXECUTIVE SUMMARY
The City of Sunnyvale has a long-standing history of proactively addressing housing issues
though a range of City ordinances, policies, and strategies. These ordinances, policies, and
strategies include the City’s Below Market Rate (BMR) Ordinance, density bonuses for
affordable projects, rezoning industrial land to accommodate residential uses, adopting
specific plans to allow for higher-density residential and mixed-use development, reducing
parking ratios for affordable projects, and other housing-related programs and policies.

Despite the City’s progress in addressing local housing needs, Sunnyvale still faces significant
challenges in ensuring that the City’s housing stock serves the full spectrum of affordable and
other housing needs. Sunnyvale households have some of the highest housing costs in the
nation, presenting limited options affordable for low-income and moderate-income
households. Meanwhile, new state laws have strengthened the mandate that local
jurisdictions ensure the production of affordable units, making it ever more crucial that
Sunnyvale consider a broad range of strategies for addressing a wide range of housing needs.

In response to these challenges, the Sunnyvale City Council has identified the development of
a comprehensive housing strategy as a key priority for the City. The City commissioned a team
led by BAE Urban Economics and supported by PlaceWorks, Goldfarb and Lipman, and Novin
Development to analyze housing issues in Sunnyvale, conduct an extensive community
engagement process, and prepare the Housing Strategy that is included in this report.

Council Direction on Issues to Study
The Sunnyvale City Council identified four main issues for the City’s Housing Strategy to
address:
   1) Strategies to address housing affordability challenges in mobile home parks;
   2) Strategies to improve age-friendliness in housing;
   3) Strategies to increase the supply of affordable housing (supply-side strategies); and
   4) Strategies to enable households to better afford, maintain, and retain housing
       (demand-side strategies).

The following report includes a chapter on each of these four topics, providing background
analysis and recommendations on each topic.

While the four topic areas that City Council identified for this Housing Strategy do not include a
direct focus on homelessness, addressing housing issues related to these four topics will play
a key role in supporting City and County efforts to reduce and prevent homelessness. The
policy recommendations in this study include policies to create housing that lower-income
Sunnyvale residents can afford and help residents maintain and retain their housing. These
types of strategies help to prevent housing insecurity that can lead to homelessness and are

                                                 i
critical in enabling individuals and families to transition out of homelessness and into a home
that they can afford. While emergency and transitional housing and other resources for those
experiencing homelessness serve a crucial role in addressing homelessness, facilitating the
production of affordable housing and addressing factors that lead to housing insecurity are
also important elements of any long-term plan to reduce homelessness in the region.
Community Engagement Process
The process for developing the Housing Strategy described in this report included an extensive
outreach process over a year-long period to obtain input on the Housing Strategy from key
stakeholders and the community at large. This process included:
• A community meeting at the outset of the process;
• Meetings with mobile home park owners and residential developers;
• Surveys of mobile home park owners, mobile home park residents, and the
community at large;
• Five open house events, including one focused on mobile home park housing issues
and one focused on age-friendly housing issues;
• A pop-up event at the Urban Village Farmers’ Market; and
• A City Council Study Session.
These events provided a number of opportunities for participants to ask questions and provide
input through informal one-on-one and small group discussions with City staff, the consultant
team, and other community members as well as to provide comments in writing and through
conversations with City staff and the consultant team. In addition, the final open house event,
Farmers’ Market pop-up, and community-wide survey asked participants to rank the strategies
presented in this report to guide the City’s prioritization for implementing various policies
pursuant to the Housing Strategy.
Input received from this community outreach process informed the policy discussion and
recommendations that are presented in this report, and the following report includes
summaries of the input received during the community engagement process as it relates to
each of the four Housing Strategy study issues.
Policy Recommendations
Table ES-1 below provides a summary of the policy recommendations from the Housing
Strategy process. As shown, the Housing Strategy process resulted in 13 recommended
policies, including policies that address each of the four Housing Strategy study issues initially
identified by the City Council. These policies were selected from a larger set of potential
policies that were evaluated during the Housing Strategy process, all of which are described in
the following report. The policy recommendations shown below were selected from this larger
set of policies based primarily on the input provided during the community engagement
process, with some adjustments based on feedback provided by the Sunnyvale City Council
during a study session on February 4th, 2020.
iiThe recommendations include three policies related to age-friendly housing, five policies to
address supply-side housing issues, three policies to address to demand-side housing issues,
and two policies to address mobile home park issues. More so than the policies related to the
three other Housing Strategy issues, the two recommended mobile home park policies are
closely linked to one another, with differing implications for each policy depending on the City’s
implementation of the other policy. Specifically, the City could choose to 1) adopt mobile
home space rent stabilization or rent control on its own; 2) pursue a Memorandum of
Understanding (MOU) or accord, in which case the City could consider space rent
control/stabilization if an agreement is not reached within a designated time frame. During
the City Council study session on February 4th, multiple members of the City Council expressed
an interest in pursuing the MOU or accord policy with a fixed time frame to establish an
agreement and an option to consider mobile home space rent control if an agreement is not
reached during the designated time frame. This is reflected in the staff recommendation.
Table ES-1 also includes a priority ranking for each of the recommended policy options other
than those related to mobile home parks, based on a three-tiered system. Policies in Tier 1
are those that are either currently underway or recommended as a priority for 2020 or 2021,
while policies in Tier 2 are recommended as a priority for 2021 or 2022. Policies in Tier 3
were identified as lower priority policies, and the timing for implementation of these policies
would be assessed once the City has implemented some of the higher-priority policies and also
would be subject to identification of necessary funding. The tier ranking for each
recommended policy was based on the strength of community support for each policy, the
level of new funding needed to implement the policy, the level of new City staff resources
needed to implement the policy, whether the policy would require a change to any City
ordinances, and the relative benefits and drawbacks of each strategy, as discussed in more
detail in the following report.
iiiTable ES-1: Summary of Final Strategy Implementation Tiers
Approved Tier Notes
1 Age-Friendly Housing Policy Options
a Protect At-Risk Affordable Senior Housing Projects and/or Preserve MHPs 3
b Promote New Age-Friendly Housing 2
c Adapt Homes to Age in Place 3
2 Supply-Side Housing Policy Options
a Increase Ownership Inclusionary Percentage 1
b Promote ADUs 1
c Modify Programs and/or Policies to Encourage Missing Middle Housing 3
Only within the follwing specific plans: El
d Up-Zone Land to Facilitate Increase Res Development 1 Camino Real, Lawrence Station, and Moffett
Park.
e De-Emphasize Dwelling Units per Acre as a Development Standard 3
3 Demand-Side Housing Policy Options
a Adopt a Right to Lease Ordinance 1
b Adopt a Tenant Protection/Relocation Assistance Requirement 2
c Establish a Safe RV Parking Program 3
4 Mobile Home Park Policy Options
*A six month check with Council will inform
how much progress has been made.This
a Mobile Home Space Rent Stabilization 2* check in will be schedule no later than 6
months after the December 8,2020 workplan
approval. If any Park Owners fail to comply
or participate by that time, the Council may
choose to end the MOU and immediately
begin on a Rent Stabilization Ordinance.
b Memorandum of Understanding/Accord 1*
Per AB 2782, long term rental agreements
entered into on or after 2/13/20 will be
subject to 4a/b.
Tier Legend:
1 = Currently under way or priority in 2020-21
2 = Priority in 2021-2022
3 = Timeframe to be Assessed
ivINTRODUCTION
The City of Sunnyvale has a long-standing history of proactively addressing housing issues
though a range of City ordinances, policies, and strategies. In 1980, the City adopted a Below
Market Rate (BMR) Ordinance that has generated hundreds of affordable units and millions of
dollars in funding for affordable housing over the past four decades. In addition to the BMR
Ordinance, the City has facilitated the development and preservation of affordable housing by
implementing density bonuses for affordable projects, rezoning industrial land to
accommodate residential uses, adopting specific plans to allow for higher-density residential
and mixed-use development, reducing parking ratios for affordable projects, and other
housing-related programs and policies.
Despite the City’s progress in addressing local housing needs, Sunnyvale still faces significant
challenges in ensuring that the City’s housing stock serves the full spectrum of affordable and
other housing needs. As residents in Silicon Valley, Sunnyvale households have some of the
highest housing costs in the nation, presenting limited options affordable for low-income and
moderate-income households. Meanwhile, new state laws have strengthened the mandate
that local jurisdictions ensure the production of affordable units, making it ever more crucial
that Sunnyvale consider a broad range of strategies for addressing a wide range of housing
needs.
In response to these challenges, the Sunnyvale City Council has identified the development of
a comprehensive housing strategy as a key priority for the City. The City commissioned a team
led by BAE Urban Economics and supported by PlaceWorks, Goldfarb and Lipman, and Novin
Development to analyze housing issues in Sunnyvale, conduct an extensive community
engagement process, and prepare the Housing Strategy that is included in this report.
Council Direction on Issues to Study
The Sunnyvale City Council identified four main issues for the City’s Housing Strategy to
address:
5) Strategies to address housing affordability challenges in mobile home parks;
6) Strategies to improve age-friendliness in housing;
7) Strategies to increase the supply of affordable housing (supply-side strategies); and
8) Strategies to enable households to better afford, maintain, and retain housing
(demand-side strategies).
The following report includes a chapter on each of these four topics, providing background
analysis and recommendations on each topic. The community engagement process for the
Housing Strategy also included public outreach events to address these four topic areas and
solicit input from local residents, property owners, and other stakeholders and interested
parties, as discussed in more detail below.
1Relationship Between this Housing Strategy and Homelessness Reduction and Prevention
While the four topic areas that City Council identified for this Housing Strategy do not include a
direct focus on homelessness, addressing housing issues related to these four topics will play
a key role in supporting City and County efforts to reduce and prevent homelessness. In part,
this is because the availability of affordable housing is critical in enabling individuals and
families to transition out of homelessness and into a home that they can afford. Further,
households that live in homes that they can afford and are not experiencing high or severe
housing cost burdens are less likely to experience financial hardship that could result in
eviction or foreclosure, and therefore are potentially at a reduced risk for becoming homeless
in the first place. In addition to housing affordability, these four topic areas relate to other
factors that affect whether many Sunnyvale residents are able to stay in the housing that they
already have, thereby further addressing challenges that could lead some households to
become homeless. While emergency and transitional housing and other resources for those
experiencing homelessness serve a crucial role in addressing homelessness, facilitating the
production of affordable housing and addressing factors that lead to housing insecurity are
also important elements of any long-term plan to reduce homelessness in the region.
Community Engagement Process
The process for developing the Housing Strategy described in this report included an extensive
outreach process to obtain input on the Housing Strategy from key stakeholders and the
community at large. This process included the following:
• Community Meeting on February 12, 2019. This meeting provided an initial
introduction to the Housing Strategy process, presented preliminary background
information, and offered an opportunity for Sunnyvale residents and the general public
to provide input.
• Mobile Home Park Owners Meeting on February 28, 2019. Participants in the meeting
included owners of mobile home parks in Sunnyvale and their representatives, City
staff, and members of the consultant team. The meeting focused on options for
addressing mobile home park housing issues in Sunnyvale.
• Residential Developer Stakeholders on February 28, 2019. Participants in the
meeting included market-rate and affordable housing developers and operators, City
staff, and members of the consultant team. The meeting focused on strategies to
increase the supply of affordable housing in Sunnyvale, including the rental
inclusionary housing ordinance that the City has since adopted.
• Mobile Home Park Owner Survey in March and April of 2019. The survey asked mobile
home park owners questions related to park characteristics, lease provisions, and
length of residency among mobile home park owners and renters. The survey also
asked park owners to provide input on potential strategies for addressing mobile home
park issues in Sunnyvale.
2• Mobile Home Park Resident Survey during April and May of 2019. The survey asked
mobile home park residents questions about current space rents, whether
homeowners have outstanding loans on their homes and the monthly loan amount,
residents’ income and housing cost burden, and lease terms, among other topics.
The survey also asked mobile home park residents to provide input on potential
strategies for addressing mobile home park issues in Sunnyvale.
• Mobile Home Park Residents Community Open House on June 3, 2019. This meeting
provided information on Sunnyvale’s mobile home parks and presented potential
strategies for addressing mobile home park housing issues in Sunnyvale. The meeting
was held in an open-house format, providing an opportunity for attendees to ask
questions and provide input through informal one-on-one and small group discussions
with City staff, the consultant team, and other community members. Attendees
provided input on the strategies by voting for the strategies that they prefer using dot
stickers, providing written comments on easel pads and comment cards, and through
conversations with City staff and the consultant team.
• General Community Open House on June 6, 2019. This meeting provided information
on Sunnyvale housing needs and presented potential strategies for addressing all four
of the Housing Strategy study issues. The meeting was held in the same open-house
format as the June 3rd Open House, providing an opportunity for attendees to engage
in informal one-on-one and small group discussions with City staff, the consultant
team, and other community members. As in the June 3 Open House, attendees
provided input by voting for the strategies that they prefer using dot stickers, providing
written comments on easel pads and comment cards, and through conversations with
City staff and the consultant team.
• Age-Friendly Housing Open House on August 15, 2019. This meeting provided
information on housing needs among Sunnyvale’s senior population and presented
potential strategies for addressing age-friendliness in housing. The meeting was held
in the same format as the two prior open house meetings, with the same methods
available for attendees to provide input.
• General Community Open House on Strategy Options on October 24, 2019. This
meeting presented a range of options for strategies to address all four of the Housing
Strategy topic areas. The meeting was held in the same format as prior open house
meetings, with the same methods available for attendees to provide input. The study
team used input from participants to help gauge community interest in and support for
the different strategies.
• Urban Village Farmers’ Market Pop-Up on November 16, 2019. For this event, the City
set up a booth at the Urban Village Farmers’ Market. The booth included posters with
potential strategies related to all four Housing Strategy issues and invited passersby to
rank strategies related to each of the four issues in order of priority, providing input on
which strategies the City should prioritize. The booth also invited participants to
provide written comments and participate in informal discussion with City staff and the
consultant team.
3• General Community Open House on Strategy Prioritization on November 21, 2019.
This event was held in an open house format similar to the prior open house meetings
and used the same posters as the Farmers’ Market Pop-Up event. Like the Farmers’
Market Pop-Up, the meeting invited attendees to prioritize strategies related to each
topic and to participate in informal discussion with City staff and the consultant team.
• Online Survey during December 2019 and January 2020. The City posted and widely
advertised an online survey that asked the community at large to prioritize potential
strategies related to each Housing Strategy topic, similar to the prioritization by
participants at the Farmers’ Market Pop-Up and the November 21st Open House
Meeting.
• City Council Study Session on February 4, 2020. The study session provided the City
Council with an initial strategy prioritization for consideration. City Council asked
questions and provided feedback on the strategies and the public had an opportunity
to provide comments.
Input received from this community outreach process informed the policy discussion and
recommendations that are presented in this report, and the following chapters include
summaries of the input received during the community engagement process as it relates to
each of the four Housing Strategy study issues.
Report Organization
The remainder of this report is organized as follows:
• Overview of Existing Conditions. This chapter provides an overview of general
demographic and housing market conditions in Sunnyvale, which informed the
community engagement process and the remainder of this Housing Strategy Report.
• Mobile Home Park Housing Issues. This chapter provides background information on
mobile home park housing affordability issues, presents potential strategies related to
mobile home parks in Sunnyvale, and summarizes community and stakeholder
feedback on potential mobile home park strategies.
• Age-Friendly Housing Issues. This chapter provides background information on age-
friendly housing issues, presents potential strategies to address age-friendliness in
housing in Sunnyvale, and summarizes community and stakeholder feedback on
potential strategies to address age-friendliness in housing.
• Supply-Side Housing Issues. This chapter provides background information on recent
housing production trends in Sunnyvale, presents potential strategies to increase
Sunnyvale’s housing supply, and summarizes community and stakeholder feedback on
potential strategies to increase Sunnyvale’s housing supply.
• Demand Side Housing Issues. This chapter provides background information on
residents’ ability to afford housing in Sunnyvale, presents potential strategies to
improve residents’ ability to access, afford, and retain housing, and summarizes
community and stakeholder feedback on potential strategies to address demand-side
housing issues in Sunnyvale.
4• Recommended Strategy Prioritization. This chapter presents recommendations for
prioritizing implementation the strategies ultimately recommended in this report.
5OVERVIEW OF EXISTING CONDITIONS
This chapter provides an overview of overall housing conditions and trends in Sunnyvale as
well as an overview of the City’s demographic characteristics, including data on population and
household growth, housing costs and affordability, housing occupancy trends, and household
incomes. This chapter draws on data from the U.S. Census Bureau, the California Department
of Housing and Community Development (HCD), the California Department of Finance (DOF),
and other sources. To provide context, the following sections provide data on the City of
Sunnyvale as well as data on a two-county subregion consisting of Santa Clara County and San
Mateo County (referred to in this report as the Two-County Subregion). Subsequent chapters
of this report provide additional background information that relates specifically to each of the
four housing issues that the Sunnyvale City Council identified for the Housing Strategy. Most
of the background data provided in this report were assembled during the initial stages of the
Housing Strategy process in late 2018 and early 2019 to inform subsequent stages of the
community engagement and strategy development process. While the recent COVID-19
pandemic may have an impact on housing sales prices or rental rates, we do not have data on
these changes at this time.
Demographic Trends
This section provides an overview of Sunnyvale’s population and household characteristics,
including population growth trends, household incomes, and residents’ age distribution.
Population and Household Growth Trends
Sunnyvale has experienced long-term growth in population and households, consistent with
regional trends, and is projected to continue to grow over the foreseeable future. As of 2018,
the DOF estimated that Sunnyvale had a population of 153,389, approximately 5.6 percent of
the population in the Two-County Subregion. The City’s population grew slightly faster than the
population in Two-County Subregion between 2000 and 2018, increasing by 16 percent while
the Subregion experienced a 14 percent increase. Over the same period, the number of
households in Sunnyvale increased by eight percent while the number of households in the
Two-County Subregion increased by 11 percent. Projections from the Association of Bay Area
Governments (ABAG) anticipate that both the City and the region will continue to grow over the
next two decades, with a projected population increase of 48 percent in Sunnyvale and 24
percent in the Two-County subregion between 2020 and 2040. Table 1 shows population and
household estimates for Sunnyvale and the Two-County Subregion between 2000 and 2018,
as well as projected population and household growth in both geographic areas through 2040.
6Table 1: Historic and Projected Population and Household Growth, Sunnyvale and
the Two-County Subregion, 2000-2040
Projected % Change
City of Sunnyvale 2000 2010 2018 2020 2040 2000-2018 2020-2040 2000-2040
Population 131,844 140,081 153,389 149,935 222,205 16.3% 48.2% 68.5%
Households 52,573 53,384 56,578 56,935 84,170 7.6% 47.8% 60.1%
Projected % Change
Two-County Subregion 2000 2010 2018 2020 2040 2000-2018 2020-2040 2000-2040
Population 2,389,748 2,500,093 2,730,753 2,783,200 3,454,815 14.3% 24.1% 44.6%
Households 819,967 862,041 907,104 963,605 1,178,695 10.6% 22.3% 43.7%
Sources: Association of Bay Area Governments, Plan Bay Area Projections 2017 by Jurisdiction, California Department of
Finance, E-4, E-5, E-8; BAE, 2018.
Income Distribution
As shown in Figure 1, households in Sunnyvale tend to have slightly higher incomes than those
in the Two-County Subregion overall. With a median income of $109,799, the proportion of
Sunnyvale households with a median income over $100,000 per year is greater than in the
Two-County Subregion overall, which has a median household income of $100,906 per year.
Renter households in Sunnyvale also tend to have relatively high incomes, with approximately
51 percent of Sunnyvale renter households with annual incomes of $100,000 or more,
compared to 35 percent of the subregion’s renter households. The high income levels among
Sunnyvale’s renter population may be due in part to a lack of homeownership opportunities
that are affordable to middle-income households, causing many households to remain in
rental housing despite having relatively high incomes.
Figure 1: Household Income, 2012-2016
21.9%
Less than $50,000
25.4%
22.4%
$50,000 to $99,999
24.3%
20.4%
$100,000 to $149,999
18.6%
13.4%
$150,000 to $199,999
11.8%
21.9%
$200,000 or more
19.9%
0.0% 5.0% 10.0% 15.0% 20.0% 25.0% 30.0%
City of Sunnyvale Two-County Subregion
Sources: U.S. Census Bureau, American Community Survey 2012-2016 5-year sampling data, B19001; BAE, 2018.
7Figure 2: Household Income Distribution Among Renter Households, Sunnyvale
and the Two-County Subregion, 2012-2016
Sunnyvale 49.3% 50.7%
Two-County Subregion 64.8% 35.2%
0% 20% 40% 60% 80% 100%
Annual Household Income Less than $100,000
Annual Household Income of $100,000 or More
Sources: U.S. Census Bureau, American Community Survey 2012-2016 5-year sampling data; BAE, 2018.
Age Distribution
Sunnyvale’s population is slightly younger overall than the population of the Two-County
Subregion overall. According to ACS data collected between 2012 and 2016, the median age
among Sunnyvale residents was 35.4 years, compared to 37.6 years in the Two-County
Subregion. As shown in Figure 3, the City of Sunnyvale and the Two-County Subregion are
comparable in the proportion of the population that is under the age of 18. However,
Sunnyvale has a substantially larger population of younger working-age residents between the
ages of 25 and 34, which accounts for 21 percent of the City’s population and only 15 percent
of the population in the Two-County Subregion.
8Figure 3: Age Distribution, 2012-2016
22.4%
Under 18 22.6%
6.1%
18-24 8.4%
20.8%
25-34 15.1%
16.6%
35-44 14.8%
12.7%
45-54 14.4%
9.6%
55-64 11.7%
11.8%
65 or older 12.9%
0.0% 5.0% 10.0% 15.0% 20.0% 25.0%
City of Sunnyvale Two-County Subregion
Sources: U.S. Census Bureau, American Community Survey 2012-2016 5-year sampling data, B01001; BAE, 2018.
Housing Cost Burden and Overcrowding
Housing analysts and local, state, and federal housing programs often use housing cost
burden and overcrowding as key metrics to evaluate the extent to which households are
experiencing problems with securing affordable, adequate housing in a community. This
section provides an overview of these conditions in Sunnyvale and the Two-County Subregion.
Housing Cost Burden
HUD considers households to have a high housing cost burden if housing costs exceed 30
percent of the households’ monthly gross income. Households with housing costs that exceed
50 percent of monthly gross income are considered to be severely cost burdened. Households
with a high or severe housing cost burden may be forced to choose between paying for
housing costs and paying for other basic needs, and are often unable to accumulate savings,
cover an unexpected expense, or invest in goods or services to improve their long-term
financial stability, such as making a down payment on a house or pursuing educational
opportunities.
A significant portion of households in Sunnyvale have high housing costs relative to their
household incomes, with lower-income households having particularly high rates of housing
cost burden. Figure 4 provides information on the proportion of renter and owner households
in Sunnyvale with high housing cost burdens and severe housing cost burdens, by household
income level, as reported in the 2011-2015 Comprehensive Housing Affordability (CHAS) data
set. As shown, 33 percent of renter households and 24 percent of owner households have
either a high or severe housing cost burden. Among households with incomes equal to 30
percent of HUD Area Median Family Income (HAMFI) or less, 85 percent of renter households
and 59 percent of owner households have a high or severe housing cost burden. The
9prevalence of high and severe housing cost burden is slightly lower for households with
incomes equal to 31 to 50 percent of HAMFI, at 78 percent for renters and 49 percent for
owners. Among households with incomes equal to 51 to 80 percent of HAMFI, 56 percent of
renter and 34 percent of owners have a high or severe housing cost burden. Among
households with incomes above 80 percent of HAMFI, the rates of high and severe housing
cost burden decrease and are higher for owner households than for renter households. These
rates of high and severe housing cost burden are not unique to Sunnyvale; the proportion of
households with high and severe housing cost burden are slightly higher in the Two-County
Subregion than in Sunnyvale.
Figure 4: Housing Cost Burden by Tenure and Household Income Level, Sunnyvale
Households, 2011-2015
Renter Households
90.0%
80.0%
70.0%
60.0% 37.4%
50.0% 9.6%
74.1%
40.0%
30.0%
46.9% 16.3%
20.0% 40.8%
10.0% 22.0% 2.1% 16.3%
10.9%
0.0%
Up to 30% 31% to 50% 51% to 80% 81% to 120% Greater than All Renter
HAMFI HAMFI HAMFI HAMFI 120% HAMFI Households
Household Income Level
Cost Burden Above 30%, But Less Than 50% Cost Burden Above 50%
Owner Households
90.0%
80.0%
70.0%
60.0%
50.0%
40.0%
30.0% 50.5% 31.6%
13.5% 5.9%
20.0% 1.1% 9.8%
10.0% 17.7% 20.3% 24.8%
8.2% 10.2% 13.9%
0.0%
Up to 30% 31% to 50% 51% to 80% 81% to 120% Greater than All Owner
HAMFI HAMFI HAMFI HAMFI 120% HAMFI Households
Household Income Level
Cost Burden Above 30%, But Less Than 50% Cost Burden Above 50%
Note:
Data are based on HUD-defined household income limits. HAMFI = HUD Area Median Family Income.
Sources: U.S. Department of Housing and Urban Development, 2011-2015 Comprehensive Housing Affordability Strategy
(CHAS) data; BAE, 2018.
10Overcrowding
In addition to cost burden, overcrowding provides another important measure of housing
stress. According to HUD definitions, a household is considered to live in overcrowded
conditions when that household lives in a housing unit with more than one person per room.
HUD considers a household to be severely overcrowded if the household lives in a housing unit
with more than 1.5 persons per room. Under this definition, “rooms” include living rooms,
dining rooms, kitchens, bedrooms, finished recreation rooms, enclosed porches suitable for
year-round use, and lodger’s rooms, while excluding bathrooms, porches, balconies, foyers,
halls, and half-rooms.
As shown in Figure 5, overcrowding is significantly more prevalent among renter households in
Sunnyvale than among the City’s owner households. According to ACS data collected between
2012 and 2016, 2.2 percent and 0.3 percent of owner households were overcrowded or
severely overcrowded, respectively, compared to 7.7 percent and 4.3 percent of renter
households, as shown in Figure 5. These rates of overcrowding and severe overcrowding
among renters and homeowners were similar to rates of overcrowding among the same
groups in the Two-County Subregion overall. These data may indicate a shortage of rental
units that are large enough to accommodate larger households, and potentially indicates that
some renters are living in overcrowded conditions in order to be able to afford housing.
Figure 5: Persons per Room, City of Sunnyvale, 2012-2016
100% 0.3%
2.2%
4.3%
95%
7.7%
More than 1.50 Persons per
90% Room (Severely Overcrowded)
1.01 to 1.50 Persons per Room
97.5% (Overcrowded)
85%
Up to 1 Person per Room
88.0%
80%
75%
Owner-Occupied Renter-Occupied
Sources: U.S. Census Bureau, American Community Survey 2012-2016 5-year sampling data, B25014; BAE, 2018.
Housing Market Characteristics
This section provides an overview of Sunnyvale’s housing market, including the characteristics
of the City’s existing housing stock and housing prices and vacancy rates.
11Tenure and Housing Unit Type
Unlike the Two-County Subregion as a whole, Sunnyvale has a greater percentage of renter
households than owner households, which is consistent with the City’s large population
between the ages of 25 and 34. As shown in Figure 6, 54 percent of Sunnyvale households
are renters, compared to 43 percent of households in the Subregion overall.
Figure 6: Occupied Housing Units by Tenure, 2012-2016
53.6%
Renter Occupied
42.7%
46.4%
Owner Occupied
57.3%
0.0% 10.0% 20.0% 30.0% 40.0% 50.0% 60.0% 70.0%
City of Sunnyvale Two-County Subregion
Sources: U.S. Census Bureau, American Community Survey 2012-2016 5-year sampling data, B25003; BAE, 2018.
This above-average concentration of renter households is also consistent with the relative
prevalence of multifamily housing in Sunnyvale compared to in the subregion. Figure 7 shows
that 44 percent of Sunnyvale’s housing units are in multifamily buildings, compared to 34
percent in the Subregion. While multifamily units include owner-occupied condominiums and
single-family homes can serve as rental housing, cities with a large multifamily housing stock
tend to have higher proportions of rental housing.
Figure 7 also shows that Sunnyvale also has a substantial inventory of mobile homes, which
account for seven percent of the City’s housing stock. The chapter of this report that
addresses mobile home park housing issues discusses the City’s mobile home inventory in
more detail.
Figure 7: Units by Type of Structure, 2012-2016
70.0% 63.8%
60.0%
48.6%
50.0% 44.0%
40.0% 33.7%
City of Sunnyvale
30.0%
Two-County Subregion
20.0%
7.3%
10.0% 2.4% 0.1% 0.1%
0.0%
Single Family Multifamily Mobile Home Other
Sources: U.S. Census Bureau, American Community Survey 2012-2016 five-year sampling data, B25024; BAE, 2018.
12Multifamily Rental Market Trends
Data from CoStar indicate that Sunnyvale’s multifamily rental inventory consists primarily of
one-bedroom and two-bedroom units. As of the fourth quarter of 2018, CoStar tracked
18,023 market-rate multifamily rental units within the City of Sunnyvale, as shown in Table 2.1
As of the fourth quarter of 2018, the average rental rate among these units was $2,746 per
month. With an average unit size of 810 square feet, this equals a rental rate of $3.39 per
square foot per month. Among this sample, one- and two-bedroom units accounted for
approximately 80 percent of the total inventory, with average monthly rents of $2,495 and
$3,083, respectively. Studio units, which made up about 4.8 percent of the rental stock, had
an average monthly rent of $2,012, while units with three or more bedrooms made up only
about 2.2 percent of the rental stock and had an average monthly rent of $3,895.
The one-bedroom vacancy rate of 4.4 percent and the two-bedroom vacancy rate of 4.3
percent are slightly lower than the overall market’s rate of 4.5 percent. Studios and units with
three or more bedrooms have higher vacancy rates of 6.4 percent and 5.1 percent,
respectively.
Table 2: Multifamily Rental Housing Stock, City of Sunnyvale, Q4 2018 (a)
Num ber Avg. Size Avg. Monthly Vacancy
Unit Type (b) of Units (Sq. Ft.) Asking Rent Rate
Studio 873 470 $2,012 6.4%
1 bedroom 7,986 685 $2,495 4.4%
2 bedroom 6,411 985 $3,083 4.3%
3+ bedroom 389 1,271 $3,895 5.1%
All Unit Types 18,023 810 $2,746 4.5%
Notes:
(a) Data captures units in multifamily properties with at least 50 units.
(b) Unit totals may not equal the sum of the different unit types due to some units lacking classification by number of
bedrooms.
Sources: CoStar, 2019; BAE, 2019.
Multifamily rental rates in Sunnyvale have increased steadily over the past decade while
vacancy rates have generally remained low. Figure 8 shows the trends in average monthly
asking rents and vacancy rate across multifamily rental units in Sunnyvale over a ten-year
period. From 2009 to 2018, the rental rates increased by $1,200, a 78 percent increase.
While vacancy rates fluctuated somewhat during this period, the vacancy rate generally
remained at or below five percent, with the exception of a temporary increase to 6.6 percent in
2016, which was likely due at least in part to the delivery of 256 newly constructed units to
the City’s rental inventory in that year.
1CoStar provides unit type and size detail for approximately 87 percent of the units that CoStar tracks in the City of
Sunnyvale. While the distribution of units by size generally reflects the overall inventory, the exact proportions may
vary.
13Figure 8: Average Multifamily Rental Asking Rents and Vacancy Rates, City of
Sunnyvale, 2009-2018 (a) (b)
$3,000 7.0%
$2,746
$2,665
$2,564 $2,538
$2,378 6.0%
$2,500
Monthly Asking Rent
$2,168
Vacancy Rate
$1,978 5.0%
$2,000 $1,812
$1,692
$1,546 4.0%
$1,500
3.0%
$1,000
2.0%
$500
1.0%
$0 0.0%
2009 2010 2011 2012 2013 2014 2015 2016 2017 2018
Avg Asking Rent Vacancy Rate
Notes:
(a) Data captures units in multifamily properties with at least 50 units.
(b) Data reflects point-in-time, rather than annual average, market conditions of the last day of the respective year.
Sources: CoStar, 2019; BAE, 2019.
For-Sale Housing Market Trends
Housing costs in Sunnyvale are comparable to housing costs in many other nearby
jurisdictions. Figure 9 shows median home sale prices among single-family homes and
condominiums in Sunnyvale and six other Santa Clara County cities in December 2018. As
shown, the median sale price for single-family homes in Sunnyvale was $1,837,500, higher
than the medians in San Jose, Santa Clara, and Campbell but lower than the medians in
Mountain View, Cupertino, and Palo Alto. Condominium sale prices were slightly lower overall,
with a median of $1,192,500 in Sunnyvale in December 2018. Sunnyvale’s median
condominium sale price was higher than the median sale prices for condominiums in San
Jose, Santa Clara, Campbell, and Mountain View and lower than in Cupertino and Palo Alto.
14Figure 9: Median Home Sale Prices, Selected Santa Clara County Cities, December
2018
$3,000,000
$2,550,000
Median Single-Family Home Sale Price
$2,500,000
$2,250,000
$2,070,000
$2,000,000 $1,837,500
$1,500,000 $1,342,500
$1,250,000
$1,050,000
$1,000,000
$500,000
$0
San Jose Santa Clara Campbell Sunnyvale Mountain Cupertino Palo Alto
View
$1,800,000
$1,620,000
$1,600,000
Median Condominium Sale Price
$1,480,000
$1,400,000
$1,192,500
$1,200,000 $1,097,500
$1,000,000
$847,500
$800,000 $780,000
$704,000
$600,000
$400,000
$200,000
$0
San Jose Santa Clara Campbell Sunnyvale Mountain Cupertino Palo Alto
View
Sources: rereport.com, 2019; BAE, 2019.
Home sale prices in Sunnyvale have increased steadily over the past ten years, mirroring
countywide trends. Figure 10 shows median single-family and condominium sale prices in
Sunnyvale and Santa Clara County from 2009 through 2018. As shown, the median sale price
of both single-family homes and condominiums more than doubled during this period in both
the City and the County, with home prices in Sunnyvale generally remaining slightly higher than
in the County overall.
15Figure 10: Median Home Sale Price Trends, 2009-2018
$2,000,000
Median Single-Family Home Sale Price
$1,800,000
$1,600,000
$1,400,000
$1,200,000
$1,000,000
$800,000
$600,000
$400,000
$200,000
$0
2009 2010 2011 2012 2013 2014 2015 2016 2017 2018
Sunnyvale Santa Clara County
$1,400,000
Median Condominium Sale Price
$1,200,000
$1,000,000
$800,000
$600,000
$400,000
$200,000
$0
2009 2010 2011 2012 2013 2014 2015 2016 2017 2018
Sunnyvale Santa Clara County
Sources: rereport.com, 2019; BAE, 2019.
16MOBILE HOME PARK HOUSING ISSUES
Mobile home park residents face unique housing challenges due to key differences between
mobile home park ownership and ownership of other types of homes. Like other homeowners,
homeowners that live in mobile home parks own the homes that they live in. However,
homeowners that live in Sunnyvale’s mobile home parks do not own the land on which their
homes are located, and instead rent the spaces where their homes are located from the
owners of the mobile home parks.2 This means that the costs of mobile home ownership
include mobile home space rent in addition to any payments on loans that the homeowner
took out to finance the purchase of the mobile home. Mobile home buyers typically finance
their home purchase using chattel loans, which tend to have higher interest rates and shorter
loan terms than a traditional home mortgage loan, because mobile homes are generally not
eligible for the same types of mortgages that buyers use to finance the purchase of other types
of homes.
Residents in Sunnyvale’s mobile home parks have raised concerns about increases in mobile
home park space rents and have advocated for the City to adopt policies that will protect
mobile home park residents from the negative impacts of space rent increases. The City
Council has responded to these concerns in part by including mobile home park housing
issues as one of the focus areas for this Housing Strategy. This chapter provides background
information on Sunnyvale’s mobile home parks, mobile home park residents, and housing
considerations related to mobile home parks, as well as an overview of potential strategies for
addressing mobile home park housing issues in Sunnyvale.
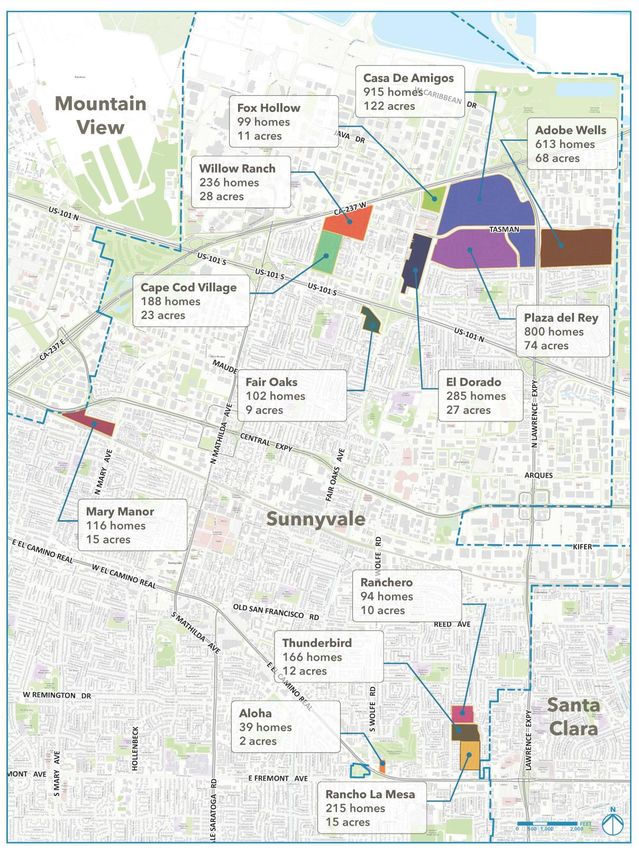
Sunnyvale Mobile Home Park Background
There are 13 mobile home parks in Sunnyvale with a total of 3,862 mobile homes, making
mobile homes a relatively substantial component of Sunnyvale’s housing inventory. In fact,
Sunnyvale is home to several of the largest mobile home parks in the state. Figure 11 shows a
map of the mobile home parks in Sunnyvale. According to American Community Survey (ACS)
data collected between 2012 and 2016, mobile homes account for approximately seven
percent of all housing units in the City of Sunnyvale, compared to just two percent of housing
units in the Two-County Subregion comprised of San Mateo and Santa Clara Counties.
Sunnyvale is home to 19 percent of the mobile homes in the Two-County Subregion, despite
the fact that only six percent of all housing units in the subregion are located in Sunnyvale.
2Although mobile home parks can be resident-owned, there are no resident-owned mobile home parks in the City of
Sunnyvale.
17Figure 11: Mobile Home Parks in Sunnyvale, 2020
Sources: City of Sunnyvale, PlaceWorks, BAE Urban Economics, 2019.
18Mobile Home Resident Demographic Characteristics
This Housing Strategy report analyzes the demographic characteristics of Sunnyvale mobile
home park residents using a detailed and rich data set published by the U.S. Census known as
the Public Use Microdata Sample (PUMS). Derived from a five percent sample of actual
responses from households responding to the American Community Survey, and available for
certain defined areas of 100,000 or more of population, known as “PUMAs” or Public Use
Microdata Areas, this data source allows for cross-tabulation of variables such as mobile home
residency and household income.3 The analysis presented in this chapter uses the data from
the 2012 through 2016 five-year survey period, the most recent data available at the time that
these data were first presented during community engagement events for the Housing
Strategy in early 2019.
The PUMS data indicate that residents living in mobile homes in Sunnyvale tend to be older
than Sunnyvale residents overall. According to the PUMS data summarized in Figure 12, the
median age among mobile home park residents in the PUMA that encompasses the mobile
home parks in Sunnyvale was 45, compared to 35 in the City of Sunnyvale as a whole. Among
mobile home park residents, 36 percent were over the age of 55, compared to just 21 percent
in the City of Sunnyvale overall. The difference in age between mobile home park residents
and residents in Sunnyvale overall is likely due in part to the presence of three mobile home
parks in Sunnyvale that are age-restricted to residents age 55 and older, totaling 523 units.
Households living in mobile homes in Sunnyvale also tend to have lower incomes than
households in the City as a whole but are significantly more likely to own their homes.
According to PUMS data collected between 2012 and 2016, households living in mobile
homes in the PUMA that encompasses the mobile home parks in Sunnyvale had a median
annual household income of approximately $62,900 (see Figure 12), approximately 57
percent of the citywide median annual household income of $109,800 during the same
period. Despite having lower incomes, approximately 86 percent of households living in
mobile homes in Sunnyvale owned their homes, compared to less than half in Sunnyvale
overall. Renter households in mobile homes in Sunnyvale tend to have lower incomes than
those that own their mobile homes, with a median of approximately $45,000 per year.
These data suggest that mobile homes provide a relatively affordable home ownership option,
including for many of Sunnyvale’s older residents, which is increasingly difficult to obtain
elsewhere in Sunnyvale or much of the rest of Santa Clara County. In addition, these data
indicate a potential overlap between policies that address mobile home park housing issues
and policies that address age-friendliness in Sunnyvale’s housing stock.
3 The PUMA that includes the mobile home parks in the City of Sunnyvale also includes one 112-unit mobile home
park in San Jose. Because the mobile home park in San Jose would comprise a small share (less than three
percent) of the mobile homes in this sample, this analysis assumes that the PUMS data for mobile home park
residents living in this PUMA are generally representative of mobile home park residents in Sunnyvale.
19You can also read