EUGENE HOUSING TOOLS & STRATEGIES EVALUATION - Prepared for: City of Eugene, OR January 2019
←
→
Page content transcription
If your browser does not render page correctly, please read the page content below
EUGENE HOUSING TOOLS & STRATEGIES
EVALUATION

Prepared for:
City of Eugene, OR

January 2019

TABLE OF CONTENTS

      Executive Summary .................................................................................................................. 2
Introduction ..................................................................................................................................... 2
Report Organization ........................................................................................................................ 2
Background Information ................................................................................................................. 2
Accessory Dwelling Unit Evaluation ............................................................................................... 5
Construction Excise Tax Evaluation ............................................................................................... 7
      Introduction............................................................................................................................ 10
Purpose of Study .......................................................................................................................... 10
Overview of Affordable Housing and Housing Affordability in Eugene ..................................... 11
      Background information ....................................................................................................... 12
Population and household characteristics ................................................................................. 12
Home Values and Rents .............................................................................................................. 21
      Accessory Dwelling Units....................................................................................................... 26
Who Lives in ADUs? ..................................................................................................................... 26
Benefits and Opportunities Associated with ADUs .................................................................... 26
Barriers to ADUs ........................................................................................................................... 27
ADU Feasibility.............................................................................................................................. 30
Recommendations on ADUs........................................................................................................ 33
      Construction Excise Tax ........................................................................................................ 34
Revenue Potential ........................................................................................................................ 34
Financial Feasibility Evaluation ................................................................................................... 35
Recommendations on CET .......................................................................................................... 41
Appendix I: Housing Tools & Strategies Inventory ..................................................................... 42
Appendix II: Best Practices Resources ....................................................................................... 47

 Eugene Housing Tools & Strategies Evaluation                                                                                                   1
EXECUTIVE SUMMARY
Introduction
Enabling quality housing at a range of price points is a high priority for the City of Eugene. In May 2018,
the Eugene City Council passed a motion to have staff implement a process to identify barriers to
housing affordability, availability, and diversity, and to suggest, evaluate, and recommend possible
strategies and tools to address the barriers. In support of that process this report provides findings
from an evaluation of a range of housing tools and strategies. The tool evaluation was conducted in
conjunction with the Housing Tools and Strategies Working Group, which made recommendations to
City Council on options to improve housing affordability, availability and diversity in Eugene. This
executive summary highlights key findings from the evaluation. The full report includes additional
background information, analytical results, and assumptions.
Report Organization
This executive summary provides an overview of the housing tools and strategies evaluation. The
report is organized into five chapters and two appendices. Following this executive summary, Chapter
II provides an introduction to the purpose of the study and an overview of affordable housing and
housing affordability in Eugene. Chapter III summarizes population and household characteristics for
Eugene and provides an overview of recent trends in market rate rents and sales prices and
construction permits. Section IV provides an evaluation of accessory dwelling units. The final chapter,
Section V, provides an evaluation of the Construction Excise Tax. Appendix I provides an inventory of
housing tools and strategies and Appendix II summarizes research on best practices for increasing
housing production.
Background Information
POPULATION AND HOUSEHOLD CHARACTERISTICS
This section summarizes demographic and housing characteristics for Eugene and other places in
Oregon. Figure 1 summarizes key population and household characteristics for Eugene, Lane County,
and Oregon as a whole. Figure 2 provides an overview of how Eugene has been growing compared to
select cities in Oregon.
Compared to other places in Oregon, Eugene is characterized as follows:
Higher share of individuals aged 18 to 24 years old. Young adults in the typical college-age
range account for 19 percent of Eugene’s total population. The 23,500 students enrolled at
the University of Oregon make the largest contribution to Eugene’s share of this age group.
Larger share of nonfamily households and people living alone. Thirty-three percent of
households are householders living alone while 15 percent are other nonfamily households,
which includes households made up of non-related housemates or roommates. Seniors make
up one quarter of householders living alone. The share of seniors among total one-person
households has grown from 21 percent since 2000.
Eugene Housing Tools & Strategies Evaluation 2 Relatively low income. At just under $45,000, median household incomes in Eugene are lower
than those in Lane County and in Oregon as a whole.
Higher overall poverty rate. Eugene’s overall poverty rate is 23.1 percent, compared to a rate
of 13.2 percent for Oregon as a whole. Family households account for about half of the people
living under the poverty line in Eugene. College students living in off-campus housing account
for about a third of people living under the poverty line, and other non-student individuals in
non-family households account for the remaining portion.1
More renters. Renter households account for 51 percent of total households in Eugene. Among
these households, one-quarter of householders are between ages 15 and 24, and one-quarter
are between ages 25 and 34. The other half of renter householders are 35 or older, including
14 percent over the age of 65.
Relatively large multifamily housing stock. Eugene has a larger share of “Missing Middle” and
apartment units and a smaller share of single-family detached units than other mid-sized cities
in Oregon. Twenty-eight percent of housing units in Eugene are in Missing Middle building
types, defined as duplexes, triplexes, cottages, courtyard units, rowhouses, and other smaller
multi-unit attached and detached housing units2, a higher share than in both Salem and Bend.
Thirteen percent of Eugene’s housing units are in apartment buildings with more than 20 units,
which is nearly double the shares of apartment units in Salem, Bend, and Springfield.
Compared to the select cities in Oregon, Eugene is:
Growing relatively slowly. Eugene is growing on par with Salem and Springfield, but more slowly
than Bend. Eugene’s population grew 17 percent from 2000 to 2016, while its housing stock
grew 15 percent over the same period. Eugene and Salem are adding houses at a slower rate
than Springfield and Bend. 3
FIGURE 1: SELECTED POPULATION AND HOUSEHOLD CHARACTERISTICS, EUGENE, LANE COUNTY, AND OREGON, 2012-
2016
Eugene Lane County Oregon
Population 161,649 360,273 3,982,267
Households 66,401 146,692 1,545,745
Median Household Income $44,859 $45,222 $53,270
Households Renting 51% 41% 39%
Households in Multifamily Units 32% 20% 20%
Population 18 to 24 Years 19% 13% 9%
Population Over 65 14% 17% 16%
People Living Alone 33% 29% 28%
Families with Children 24% 25% 29%
Sources: U.S. Census, 2010; ACS, 5-year estimates, 2012-2016; Strategic Economics, 2018.
1 Sources: ACS 5-year estimates, 2012-2016; Places with Populations of 10,000 or More and Statistically Significant Differences in Poverty
Rates with Exclusion of Off-Campus College Students: 2012-2016, https://www.census.gov/data/tables/2017/demo/income-
poverty/acs5yrs.html.
2 Missing Middle Housing, https://www.eugene-or.gov/3652/Missing-Middle-Handbook.
3 ACS 5-year estimates, 2012-2016.
Eugene Housing Tools & Strategies Evaluation 3FIGURE 2: EUGENE AND SELECT CITIES: POPULATION AND HOUSING UNIT GROWTH, 2000-2016
Eugene Bend Salem Springfield
Population, 2000 Census 137,893 52,029 136,924 52,864
Population, 2012-2016 ACS 161,649 84,416 161,975 60,611
Population Added 2000 - 2016 23,756 32,387 25,051 7,747
% Population Change, 2000-2016 17% 62% 18% 15%
Housing Units, 2000 Census 61,444 22,507 53,817 21,500
Housing Units, 2012-2016 ACS 70,649 37,406 61,987 25,368
Housing Units Added, 2000 - 2016 9,205 14,899 8,170 3,868
% Housing Unit Change, 2000-2016 15% 66% 15% 18%
Sources: U.S. Census, 2010; ACS, 5-year estimates, 2012-2016; Strategic Economics, 2018.
HOME VALUES, RENTS, AND CONSTRUCTION PERMITS
This section summarizes recent trends in market rate rents and sales prices, and construction permits
for Eugene.
The median sales price for an existing house in Eugene is about $315,000. However, the
median sales price for a newer home, built since 2014, is significantly higher at $449,000. 4
From 2013 to 2018, rents for multifamily units increased 22 percent, or on average $190 per
unit, after adjusting for inflation. Nearly half of the units built since 2013 are in zip code
97401, which covers downtown Eugene and north to the Beltline. In this zip code, rents grew
at a slower rate of 17 percent over the last five years.5
Over half of dwelling units permitted between 2008 and 2017 are in multifamily buildings.
Almost 57 percent of new dwelling units permitted in Eugene from 2008 through 2017 were
in 5-or-more-unit apartment buildings. An additional 32 percent of permitted units were single-
family dwellings. In contrast, accessory dwelling units, townhouses, and units in 2-4 unit
buildings made up just eight percent of total units permitted during that period. Permits for
manufactured homes make up the remaining dwelling units permitted at under three percent
of the total. 6
Townhomes and condominium units represented just 7.5 percent of total home sales in the
past year. These types of units are typically smaller and less expensive than single-family
detached units. However, very few of the townhomes and condominiums that sold in the last
year were built in the last decade; the handful of newer units that sold did so at relatively high
per square foot prices. The three most recently built townhomes that sold in the last year, (two
completed in 2015, and one completed in 2013) sold for $399,000 to $425,000, or $256 to
$289 per square foot. In contrast, the median price per square foot for the 165 single-family
detached homes that sold in Eugene built since 2014 was $199 per square foot. There were
no condominiums that sold in the past year built after 2008. 7
4 Redfin, Eugene Home Sales, October 16, 2017 through October 15, 2018.
5 Costar, Eugene Multifamily History Report, 2013 and 2018. Accessed October 15, 2018.
6 City of Eugene, Housing Mix Permit Details, 2001-2017.
7 Redfin, Eugene Home Sales, October 16, 2017 through October 15, 2018.
Eugene Housing Tools & Strategies Evaluation 4AFFORDABLE HOUSING AND HOUSING AFFORDABILITY IN EUGENE
This section provides on overview of affordable housing availability and issues related to income and
housing affordability in Eugene.
Household income needed to afford a house that costs $315,000 (the median price of all
homes that sold in the last year) is $68,000 per year to be considered affordable. As described
in the previous section Eugene’s median household income is $45,000.
The median monthly rental rate for market-rate multifamily units is not affordable for over two-
thirds of Eugene’s renter households. The median rent in multifamily rental buildings is
$1,058, which would require a minimum income of $42,300 to be considered affordable.
However, the median renter household has an income of $26,000.
A majority of renter households in Eugene are rent-burdened, and Eugene’s share of rent-
burdened households is substantially larger than Oregon overall. Fifty-eight percent of renter
households pay more than 30 percent of their income on rent, and of the total, 36 percent are
considered severely rent-burdened and pay more than 50 percent of their income on rent.
Designated, affordable units in Eugene, alone, are not enough to meet the housing needs of
Eugene’s lowest-income households. Deed-restricted, affordable units make up five percent
of Eugene’s housing stock, while 31 percent of Eugene households have incomes less than
$25,000, which is approximately 40 percent area median income for a four-person household,
and 50 percent area median income for a two-person household in Lane County. 8
Accessory Dwelling Unit Evaluation
The City of Eugene asked Strategic Economics to evaluate the effectiveness of accessory dwelling
units (ADUs) to help Eugene achieve its goal to enable quality housing at a range of price points. This
section of the executive summary provides an overview of ADUs and makes recommendations on how
Eugene could reduce barriers to their production.
ADUs, also sometimes referred to as “granny flats,” “in-law units,” or “backyard cottages,” are relatively
small housing units, typically ranging from studios to two bedrooms, added to the lots of single-family
homes. ADUs come in many forms and can be detached from or incorporated into the primary dwelling.
They can be newly constructed or converted from existing structures, such as garages. ADUs are
considered a type of “gentle density” in which building them increases the housing supply while
minimally impacting their neighborhoods. ADUs do not typically require the demolition of existing
buildings, and therefore have a significantly smaller displacement impact, compared to larger-scale
development.
KEY FINDINGS AND RECOMMENDATIONS ON ADUS
While Eugene allows accessory dwelling units in all residential zones (R-1, R-2, R-3, and R-4),
and the majority of Special Zones by right, very few ADUs have been permitted and built,
particularly since 2015. From 2008 to 2014, 66 ADUs were permitted, or approximately nine
per year. ADUs permitted during this timeframe represented 1.5 percent of total permitted
units. However, after the City of Eugene adopted more restrictive ADU requirements in July
2014, the annual number of ADU permitted units declined significantly. From 2015 to 2017,
8
“Lane County 2018 Rent Income Limits,” Oregon Housing and Community Services, 2018.
Eugene Housing Tools & Strategies Evaluation 5only seven ADUs were permitted in total, about two per year, representing just 0.3 percent of
housing units permitted in those three years.
Barriers to ADU production in Eugene are multi-faceted, and include:
o City and utility fees, including system development charges (SDCs), permit fees, and
EWEB fees, which can total more than $16,000 for one ADU. This added development
cost discourages homeowners, who typically have to pay out-of-pocket or borrow
against their own home equity to develop ADUs, from building them or from engaging
in the permitting process required to build them legally. Most SDCs in Eugene are tied
to a building’s unit count rather than scaled to its square footage. Therefore,
developers of ADUs pay SDCs at a rate similar to those for single-family homes. A
homebuilder interviewed for this study estimated that there are potentially 50 to 60
unpermitted ADUs built per year, and stated that SDC, utility, and other city fees are
his clients’ primary disincentive from following the City of Eugene’s established ADU
permitting process. Since such units are unpermitted and therefore not subject to City
review it would be very difficult for the City of Eugene to confirm this estimate.
o Minimum lot size requirements preclude the addition of an ADU on approximately 17
percent of single-family lots throughout Eugene. Single-family lots in most residential
areas must be larger than 6,100 square feet to be eligible for an ADU. Approximately
15 percent of single-family lots in most areas are smaller and would be ineligible for
ADUs under current regulations. In the Amazon, Fairmount, and South University
neighborhoods lots must be at minimum 7,500 square feet to be eligible for an ADU.9
In these three neighborhoods, ADUs are currently prohibited on one-half of single-
family lots.
o The requirement that owners must occupy either the primary or accessory unit
precludes owners of approximately one-fourth of single-family homes in Eugene from
adding ADUs. Of the 37,400 “1-unit detached” units in Eugene as of 2016,
approximately 9,100 were renter-occupied. 10 In other words, 24 percent of single-
family detached units are not occupied by the property owner, and therefore those
property owners would be unable to add ADUs to their lots under current regulations
unless they desire to live on-site. Multiple respondents to this study viewed this
requirement as arbitrary, and discriminatory against renter households, which make
up over half of all households in Eugene.
o Site design requirements are highly prescriptive. Property owners and builders
interviewed for this study outlined site design requirements that do not allow for
variations in topography, or for flexible standards for ADUs incorporated in, or
converted from existing buildings. Because many existing homes are incompatible with
ADU building requirements, many proposals for attached or converted ADU units are
considered ineligible. It was reported that ADUs proposed on sloped lots typically do
not move forward because applicants have difficulty meeting the standards. Eugene
requires adjustment review for ADU proposals requesting variances from these
standards, which opens the project up to public review and delays the project’s
timeline, adding to project cost.
o The minimum off-street parking requirement for ADUs adds to site development cost
and constrains site design possibilities. Current regulations require that single-family
homes with ADUs have a minimum of two off-street parking spaces, or one space per
9
Flag lots must be at minimum 12,500 square feet, excluding the “pole” portion of the lot. Flag lots were not considered in the minimum
lot size requirement geospatial analysis, due to the complex nature of identifying flag lots in the city’s parcel data.
10
ACS, 5-year estimates, 2012-2016.
Eugene Housing Tools & Strategies Evaluation 6unit. Property owners, developers and city staff said this requirement can be
challenging to meet from both a site design and financial feasibility perspective for
certain lots. Eliminating this regulation would likely have a relatively small impact on
the on-street parking supply since developers satisfying this regulation may need to
widen or add curb cuts, which reduces on-street parking supply.
The factors limiting ADU production in Eugene are multi-faceted, and there is no one silver
bullet that alone would better support their development. To encourage ADU production, the
City of Eugene would need to take a number of steps, depending on the political appetite for
increasing their supply. Options include adjusting the land use code and the structure of SDCs
and other city fees as they apply to ADUs, increasing community outreach and education
efforts regarding ADUs, and exploring ways to support applicants trying to build ADUs, who
typically are preempted from taking advantage of traditional financing mechanisms available
to professional developers.
These efforts together could potentially enable the addition of up to 43,000 units to Eugene’s
housing stock. While it is unlikely, of course, that every homeowner that is able would choose
to build an ADU, the sheer number of potential ADUs points to the great impact ADU-supportive
policy could have. If owners of just five percent of potential ADU lots were to build one, the
number of units added would be 2,150, which is equivalent to about one-third of all dwelling
units permitted in Eugene from 2008 through 2017.
Construction Excise Tax Evaluation
In 2016, the Oregon legislature passed SB 1533, which enabled municipalities to tax new
development based on construction cost, to fund affordable housing. Municipalities can levy a
construction excise tax (CET) of up to one percent of construction cost on residential projects, and on
an unlimited proportion of construction cost for commercial and industrial projects. There are nine
municipalities that have active CET policies. Bend, which was the first Oregon municipality to
implement a CET policy, as well as Medford, which was the most recent to do so, both levy a tax of just
one-third of a percent of construction cost. Most other municipalities with CETs, including Portland and
Milwaukie, have set the rate at one percent of construction cost. Corvallis is the only municipality to
charge a higher tax (1.5 percent) on commercial projects.
The City of Eugene is currently considering implementing a construction excise tax and has asked
Strategic Economics to evaluate the potential impact of such a tax on revenue for affordable housing
and on development feasibility of market-rate housing production.
KEY FINDINGS AND RECOMMENDATIONS ON CET
Revenue Potential: Implementing a CET valued at one percent of construction cost for
commercial and residential projects could raise up to $3 million per year for affordable
housing, based on recent development trends in Eugene.11 This assumes that the tax would
not have rendered any project infeasible, in which case the sum would be lower. Funds raised
could be used in a revolving fund to leverage affordable housing development.
Financial Feasibility: Financial feasibility is just one of several factors for cities to consider in
making decisions on implementing a new tax or fee. In order to provide the City of Eugene with
11 Estimate based on City-provided construction valuation data.
Eugene Housing Tools & Strategies Evaluation 7guidance on how a new construction excise tax could impact development decisions, Strategic
Economics conducted a pro forma analysis that tested the financial impact of a construction
excise tax of one percent on several housing prototypes. Financial feasibility was tested using
a static pro forma model that measures return on cost (or ROC, used for for-sale residential
development) or yield on cost (YOC, used for rental properties). Return on cost and yield on
cost are commonly used metrics indicating the profitability of development projects.
The financial feasibility analysis included four housing prototypes:
Single-Family Detached – An 1,800 square foot 3 bedroom, 2.5 bathroom for sale house at a
density of nine dwelling units per acre.
Townhouse – A 1,400 square foot 3 bedroom, 2.5 bathroom for sale townhouse at a density
of 13 dwelling units per acre.
Apartment – A 3-story wood frame apartment building with an average unit size of 864 square
feet and surface parking at a density of 30 units per acre. (This prototype does not represent
the denser multifamily construction that is occurring in the downtown.)
Cottage Cluster – A cluster of eight rental cottages with 800 square feet, 1 bedroom and 1
bathroom each at a density of 16 dwelling units per acre.
The results of the financial feasibility analysis are as follows12:
Single-Family Detached – According to the results of the pro forma analysis, the single-family
detached prototype meets the threshold of feasibility and the addition of a one percent
construction excise tax on the single-family detached prototype also marginally meets the
threshold of feasibility.
Townhome – According to the results of the pro forma analysis, the townhome prototype meets
the threshold of feasibility and the addition of a one percent construction excise tax on the
townhome prototype also meets the threshold of feasibility.
Low-Rise Apartment – According to the results of the pro forma analysis, the apartment
prototype only marginally meets the threshold of feasibility and the addition of a one percent
construction excise tax on the apartment prototype does not meet the threshold of feasibility.
Cottage Cluster – According to the results of the pro forma analysis, the cottage cluster
prototype does not meet the threshold of feasibility and the addition of a one percent
construction excise tax on the cottage cluster prototype also does not meet the threshold of
feasibility.
The financial feasibility analysis indicates that some types of residential development do not
meet the minimum threshold of feasibility or are marginally feasible even without the CET.
To address financial feasibility concerns, however, the City of Eugene could take a number of
steps, including:
o Phasing in a CET first with a one-third or one-half of one-percent tax rate. The City of
Bend, which was the first to implement a CET, uses one-third of a percent, and has
raised over $6.4 million for a revolving fund for affordable housing.
12Data sources for the financial feasibility analysis include: interviews with developers; RS Means; similar pro formas; and data provided by
the City of Eugene.
Eugene Housing Tools & Strategies Evaluation 8o Accompanying the implementation of a CET with regulatory/process improvements
that have the potential to reduce other development costs.
o Exempting some types of housing units, particularly those that meet other housing
goals, such as smaller, more affordable units, from paying the CET.
o Using a portion of revenue collected to assist in the production of qualifying market-
rate units.
Eugene Housing Tools & Strategies Evaluation 9INTRODUCTION
Purpose of Study
Enabling quality housing at a range of price points is a high priority for the City of Eugene. In May 2018,
the Eugene City Council passed a motion to have staff implement a process to identify barriers to
housing affordability, availability, and diversity, and to suggest, evaluate, and recommend possible
strategies and tools to address the barriers.
The process included the establishment of the Housing Tools and Strategies Working Group, a citizen
committee formed to make recommendations to City Council on options to improve housing
affordability, availability and diversity in Eugene. In support of all these efforts the City of Eugene hired
Strategic Economics to conduct research and analysis on housing policies and tools. This report is not
intended as a comprehensive affordable housing strategy or housing action plan, but rather provides
findings from a series of tasks coordinated with the work of the Housing Tools and Strategies Working
Group. For the process, Strategic Economics conducted the following tasks:
Evaluated data on demographics and housing. Strategic Economics analyzed a wide variety of
quantitative data, relying on U.S. Census and American Community Survey estimates for
demographic data, and on sources such as Costar and Redfin for housing market data. The
City of Eugene also provided Strategic Economics with housing unit building permit trend data.
Evaluated Accessory Dwelling Units. Strategic Economics performed multiple analyses
concerning Accessory Dwelling Units (ADUs) in Eugene. Strategic Economics analyzed: 1)
parcel data to consider how current ADU policies may be limiting ADU production and the
overall potential of ADUs as a tool to increase Eugene’s housing stock; 2) the Eugene land use
code to identify areas of conflicting interpretation on ADU policy; 3) existing literature on ADU
production in other cities; and 4) the financial feasibility of building an ADU under various
scenarios.
Evaluated the Construction Excise Tax (CET). Strategic Economics relied on building valuation
data from the City of Eugene to estimate the potential revenue of a Construction Excise Tax
(CET), and considered the impacts of a CET on the financial feasibility of development projects.
Conducted financial feasibility evaluation. Strategic Economics considered the feasibility of
various housing development types, including large-lot single family, townhome, multifamily,
cottage cluster, and accessory dwelling unit projects. Feasibility was analyzed under various
scenarios including the status quo, with reduced system development charges (SDCs), and
with a CET.
Interviewed homeowners, property owners, renters, developers, and city staff. Strategic
Economics contacted a variety of stakeholders and conducted interviews with city staff,
community members, and with individuals involved in the development community, including
professional real estate developers, architects, homebuilders, contractors, and homeowners
building ADUs.
Prepared summary descriptions of housing tools and strategies (Appendix I). Strategic
Economics researched and assembled a matrix of housing-focused tools typically used by
municipalities. The matrix includes tools on zoning strategies for market-rate housing
production, as well as developer incentives and local funding strategies for affordable housing
production.
Eugene Housing Tools & Strategies Evaluation 10 Conducted best practice research (Appendix II). Strategic Economics collected best practices
relevant to increasing housing production, and on ADU and CET policy specifically.
Overview of Affordable Housing and Housing Affordability in
Eugene
Because terms like housing affordability and affordable housing can be unclear, it’s important to
define terms when evaluating strategies or tools for housing production. “Housing affordability” is a
relative concept. Housing is generally considered “affordable” if monthly housing costs account for 30
percent or less of a household’s income. (For the purposes of this study we use 30 percent for renters
and 35 percent for home-owners.)
“Affordable Housing” typically refers to housing designated for households that cannot afford market-
rate housing. For such households, federal, state, and local governments may provide assistance in
two ways:
Government subsidies: Several federal and state funding sources provide funding to cover the
gap between what qualifying households can pay, and the cost of providing affordable housing.
In general, new affordable housing development requires a contribution from a local
government source in addition to state and federal funding.
Requirements or incentives for private sector contributions: Local governments can create
requirements or provide incentives for private development to contribute towards affordable
housing. For example, local governments may require private development to pay a tax
towards the provision of affordable housing (the construction excise tax), require a set
percentage of new units to remain affordable to low- or moderate-income households (an
inclusionary zoning requirement), or allow development at an increased height or density in
exchange for the provision of affordable units (density bonus).
These two methods are often combined in projects and most projects require multiple funding sources.
Units that are produced through either of these two methods are typically subject to a deed restriction
or covenant under which the property owner agrees to restrict the units to households in certain
income categories for a given amount of time, and to limit monthly rents or purchase prices.
Eugene has 3,406 protected affordable units with deed restrictions that specify income
requirements. These units are funded through a variety of sources, including federal, (low-
income housing tax credits, HOME project funds, Section 8) and others, and are managed by
a mix of non-profit and for-profit housing providers, and Homes for Good, the Lane County
housing authority.
These units are largely reserved for low- and very low-income households (with household
income under 50 percent of area median income).
These units make up approximately 5 percent of total units in Eugene.
Eugene Housing Tools & Strategies Evaluation 11BACKGROUND INFORMATION
This chapter summarizes population and household characteristics within the City of Eugene and
discusses how Eugene has been growing compared to other mid-size cities in Oregon. It also provides
a scan of recent trends in market-rate rents and sales prices and discusses recent development trends
for market-rate housing citywide. The demographic and housing information was used to inform the
evaluation of housing tools and strategies.
POPULATION AND HOUSEHOLD CHARACTERISTICS
Eugene is home to approximately 162,000 people, and 66,400 households. The average household
size in Eugene (2.3 persons per household) is slightly smaller than that of Oregon as a whole (2.5
persons per household) (Figure 3). More information on population growth is provided in a later section
of this chapter.
Eugene has a higher share of college-age residents, but fewer children and older adults relative to
Oregon as a whole. Approximately 19 percent of Eugene residents are 18 to 24 years old, compared
to 13 percent and nine percent in Lane County and Oregon respectively (Figure 4). The share of
children and adults over 45 living in Eugene is below the share of these two age groups for Oregon as
a whole.
Almost half of households living in Eugene are “nonfamily” households. Householders living alone
make up one third of households in Eugene and other nonfamily “roommate” households, make up a
larger share in Eugene than in Lane County and Oregon overall, while family households with and
without children both make up smaller shares (Figure 5).
FIGURE 3. POPULATION, HOUSEHOLDS AND HOUSEHOLD SIZE, EUGENE, LANE COUNTY
AND OREGON, 2012-2016
Eugene Lane County Oregon
Population 161,649 360,273 3,982,267
Households 66,401 146,692 1,545,745
Average Household Size 2.3 2.4 2.5
Source: ACS 5-year estimates, 2012-2016; Strategic Economics, 2018.
FIGURE 4. POPULATION BY AGE, EUGENE, LANE COUNTY AND OREGON, 2012-2016
Eugene Lane County Oregon
Count Share Count Share Count Share
Under 17 28,881 18% 68,745 19% 861,395 22%
18 to 24 31,511 19% 47,450 13% 365,086 9%
25 to 44 41,590 26% 86,725 24% 1,066,642 27%
45 to 64 36,333 22% 94,852 26% 1,054,570 26%
65 and up 23,334 14% 62,501 17% 634,574 16%
Source: ACS 5-year estimates, 2012-2016; Strategic Economics, 2018.
Eugene Housing Tools & Strategies Evaluation 12FIGURE 5. HOUSEHOLD COMPOSITION, EUGENE, LANE COUNTY AND OREGON, 2012-2016
40%
34% 35%
35% 33%
29% 28% 29%
30% 28%
25%
25% 24%
20%
15%
15%
12%
10% 9%
5%
0%
Families with Children Families without Children Other Nonfamily Households Householders Living Alone
Eugene Lane County Oregon
Source: ACS 5-year estimates, 2012-2016; Strategic Economics, 2018.
POPULATION AND HOUSING UNIT GROWTH
From 2000 to 2016, Eugene’s population grew 17 percent, while its housing stock grew just 15
percent over the same period. Figure 6 shows Eugene’s population and housing unit trends compared
to other mid-size cities in Oregon. Eugene and Salem are adding houses at a slower rate than
Springfield and Bend, with Bend growing much faster than any of the other cities studied.
FIGURE 6. POPULATION AND HOUSING UNIT GROWTH, EUGENE AND SELECT CITIES, 2000-2016
Eugene Bend Salem Springfield
Population, 2000 Census 137,893 52,029 136,924 52,864
Population, 2012-2016 ACS
161,649 84,416 161,975 60,611
Estimates
Population Added 2000 - 2016 32,387 25,051 7,747
23,756
Rate of Population Change 17% 62% 18% 15%
Housing Units, 2000 Census 61,444 22,507 53,817 21,500
Housing Units, 2012-2016 ACS
70,649 37,406 61,987 25,368
Estimates
Housing Units Added, 2000 -
9,205 14,899 8,170 3,868
2016
Rate of Housing Unit Change 15% 66% 15% 18%
Source: U.S. Census, 2010; ACS, 5-year estimates, 2012-2016; Strategic Economics, 2018.
Eugene Housing Tools & Strategies Evaluation 13STUDENT POPULATION AND INCOME LEVELS
Eugene, like many college towns, has a relatively large share of people that are highly educated.
Approximately 40 percent of people over age 25 in Eugene have a bachelor’s degree or higher, while
the proportion of Eugene residents with a high school degree or less is substantially lower than in both
Lane County and Oregon (Figure 7).
FIGURE 7. EDUCATIONAL ATTAINMENT FOR POPULATION AGE 25 AND OVER: EUGENE, LANE COUNTY, AND OREGON,
2012-2016
40% 38%
35% 35%
35% 34% 34%
30%
25%
25% 23%
20%
20% 17% 17%
15%
11% 12%
10%
5%
0%
High School Graduate or less Some College Bachelor's Degree Postgraduate Degree
Eugene Lane County Oregon
Source: American Community Survey 5-year Estimates 2012-2016; Strategic Economics 2018.
The median household income in Eugene is $44,859, which is slightly lower than that of Lane County,
($45,222) and of Oregon, ($53,270) (Figure 1). Eugene also has a relatively large share of very low-
income households, a trend which is partially attributable to the presence of the significant number of
college students. Approximately 31 percent of all Eugene households have incomes of less than
$25,000, compared to 23 percent for Oregon as a whole (Figure 8).
Eugene’s poverty rate was estimated at 23.1 percent overall, meaning approximately 36,000 Eugene
residents are living below the poverty line (Figure 9). The income thresholds that inform the poverty
rate, which are adjusted based on household size and set by the federal government, are not regionally
adjusted to account for cost of living variations.13 Therefore, the poverty rate is an inadequate metric
for understanding a region’s housing affordability. However, the U.S. Census Bureau analyzes how
college students statistically affect college towns’ income characteristics, and thus provides a glimpse
at college students’ impact on household incomes in Eugene.
Off-campus college students make up over 11 percent of Eugene’s “Poverty Universe.”14 Because they
are such a large share of Eugene’s population and have relatively low incomes, typically relying on
13 The poverty line threshold for a one-person household in 2016 was $11,880. The thresholds for a two-person household was three-person
household was $16,020, for a three-person household was $20,160, and for a four-person household was $24,300.
14 The number of people in the Census Bureau’s “Poverty Universe” calculation does not include students in college dormitories, or others
in institutionalized group quarters, nor does it include children under age 15 who are not related to the adult members of their household
(e.g. foster children).
Eugene Housing Tools & Strategies Evaluation 14part-time employment, stipends, or assistance from their families, the presence of college students
has the potential to pull household income data downward and increase the city’s poverty rate. There
are approximately 23,500 students enrolled at the University of Oregon and many more college
students enrolled at other institutions in Eugene. Of University of Oregon students, 77 percent or about
18,000 live off-campus (and not with their families). After excluding off-campus college students, there
are estimated to be approximately 25,200 non-student residents under the poverty line in Eugene.15
16 In other words, off-campus college students account for about 30 percent of Eugene residents in
poverty as defined by the federal government (Figure 9).
FIGURE 8. HOUSEHOLD INCOME DISTRIBUTION: EUGENE, LANE COUNTY, AND OREGON, 2012-2016
35%
30%
25%
20%
15%
10%
5%
0%
Less than $25,000 to $50,000 to $75,000 to $100,000 to $125,000 to $150,000 to Over $200,000
$25,000 $50,000 $75,000 $100,000 $125,000 $150,000 $200,000
Eugene Lane Oregon
Source: ACS 5-year Estimates 2012-2016; Strategic Economics 2018.
15 Benson, Craig and Alemayehu Bishaw, “Examining the Effect of Off-Campus College Students on Poverty Rates,” U.S. Census Bureau,
2017.
16 ACS, 5-year estimates, 2012-2016.
Eugene Housing Tools & Strategies Evaluation 15FIGURE 9. EUGENE RESIDENTS IN POVERTY BY STUDENT STATUS, 2012-2016
7,321 10,748
College Students
Non-College Students 112,459 25,233
Total "Poverty Universe" Population 119,780 35,981
- 20,000 40,000 60,000 80,000 100,000 120,000 140,000 160,000 180,000
Above Poverty Line Below Poverty Line
Source: ACS 5-year estimates, 2012-2016; Strategic Economics, 2018.
HOUSING TENURE AND COST-BURDEN
Over half of Eugene households are renters, compared to both Lane County and Oregon overall, where
renters represent approximately 40 percent of households.17
The median income for renter households is $26,064, which is substantially lower than that of
households overall. The median renter household would therefore require a maximum rent of $650
per month to be considered “affordable.” Households that spend more than 30 percent of their income
on housing costs are considered “cost-burdened,” while households that spend more than 50 percent
of income on housing costs are considered “severely cost-burdened.” A larger share of renters in
Eugene are considered rent-burdened and severely rent-burdened, compared to renter households in
Lane County and Oregon. While 58 percent of households in Eugene are rent-burdened and 36 percent
are severely rent-burdened, 50 percent and 26 percent of Oregon households are rent-burdened and
severely rent-burdened respectively, as shown in Figure 11.
A similar share of Eugene owner households is “mortgage-burdened” and “severely mortgage-
burdened” as in both Lane County and Oregon overall. For the three geographies, 34 to 36 percent of
owner households with mortgages are mortgage-burdened, and 13 to 15 percent are severely
mortgage-burdened.
17 American Community Survey 5-year estimates, 2012-2016.
Eugene Housing Tools & Strategies Evaluation 16FIGURE 10. HOUSING TENURE IN EUGENE, LANE COUNTY AND OREGON, 2012-2016 ESTIMATES
70%
61%
59%
60%
51%
49%
50%
41%
40% 39%
30%
20%
10%
0%
Eugene Lane Oregon
Owner-occupied units Renter-occupied units
Source: ACS 5-year estimates 2012-2016; Strategic Economics, 2018.
Eugene Housing Tools & Strategies Evaluation 17FIGURE 11. RENT BURDEN IN EUGENE, LANE COUNTY AND OREGON, 2012-2016 ESTIMATES
70%
60% 58%
54%
50%
50%
40% 36%
30%
30%
26%
20%
10%
0%
Eugene Lane Oregon
Renter Households spending greater than 30% of income on rent
Renter Households spending greater than 50% of income on rent
Source: ACS 5-year estimates 2012-2016; Strategic Economics, 2018.
HOUSING TENURE AND AGE
About one quarter of renters fall in the typical college age range of 15 to 24 years of age (Figure 12).
An additional 25 percent are in the 25 to 34 year range. The rest, or about one half are older than 35
with 14 percent older than 65.
Eugene Housing Tools & Strategies Evaluation 18FIGURE 12. EUGENE RENTER HOUSEHOLDERS BY AGE, 2012-2016
Householder 65 and Over
14.4% Householder 15 to 24 Years
25.5%
35.2%
24.9%
Householder 25 to 34 Years
Householder 35 to 64 Years
Source: ACS 5-year estimates, 2012-2016; Strategic Economics, 2018.
HOUSING STOCK
Although Eugene’s housing stock is largely made up of single-family homes, the share of apartments
has been increasing in recent years. According to U.S. Census ACS data single-family homes make up
55 percent of Eugene housing units, compared to 63 percent in Lane County and 64 percent in Oregon
as a whole (Figure 13). Apartments make up 26 percent of housing units in Eugene, a substantially
larger share than in Lane County or Oregon.
Eugene’s housing stock is more diverse than that of the other mid-size cities in Oregon studied, and
has the largest share of units in multifamily buildings with more than 20 units (Figure 14). Eugene’s
share of units in buildings with 20 or more units is nearly double that of the other cities. Eugene also
has the second largest share of Missing Middle units, and second lowest share of single-family
detached units, after Springfield.
FIGURE 13. HOUSING UNITS BY TYPE: EUGENE, LANE COUNTY AND OREGON, 2012-2016 ESTIMATES
Eugene Lane County Oregon
Number Percent of Number of Percent of Number of Percent of
Housing Type of Units Total Units Units Total Units Units Total Units
Single Family 39,078 55% 99,028 63% 1,085,466 64%
Townhome 4,068 6% 8,022 5% 76,043 4%
Duplex 2,694 4% 5,201 3% 49,582 3%
Triplex, Fourplex 4,109 6% 6,673 4% 74,915 4%
Apartments 18,224 26% 24,413 15% 274,442 16%
Mobile Home, Other 2,476 3% 14,900 9% 145,842 8%
Total Units 70,649 100% 158,237 100% 1,706,290 100%
Source: Social Explorer, American Community Survey 5-year estimates, 2012-2016; Strategic Economics, 2018
Eugene Housing Tools & Strategies Evaluation 19FIGURE 14. HOUSING STOCK BY UNITS IN STRUCTURE: EUGENE AND SELECT CITIES, 2012-2016
Eugene Bend Salem Springfield
1-Unit Detached 55% 69% 60% 54%
Missing Middle - Under 5 Units (a) 15% 15% 14% 20%
Missing Middle - 5 to 19 Units (b) 12% 6% 13% 10%
20+ Units 13% 6% 7% 8%
Other (Mobile Home, RV) 4% 4% 6% 9%
Source: American Community Survey 5-year estimates, 2012-2016; Strategic Economics, 2018.
Notes:
(a) Includes "1 unit-attached" units, duplexes, triplexes, and fourplexes. Note that the ACS does not provide data on ADUs,
specifically.
(b) Missing Middle housing typically includes "walk-up" multiplexes that contain up to 20 units.
HOUSING CONSTRUCTION PERMITS
As shown in Figures 15 and 16, permitted units of new single-family homes in Eugene have made up
32 percent of all permitted housing units since 2008, with 44 percent of those single-family units
permitted in the last two years. Permitted units for apartments have increased since 2011, with
permitted units for new apartments making up 57 percent of the total over the ten year period.
However, permitted units for one-to-four-unit “Missing Middle” housing types, which include ADUs,
duplexes, townhomes, triplexes and fourplexes, have lagged. These housing types, which make up 15
percent of Eugene’s housing stock, accounted for just nine percent of permitted units from 2008-
2017. For every Missing Middle unit in a one-to-four-unit building permitted in Eugene, four single-
family units are permitted. There have been very few permitted units in recent years for ADUs in
particular. From 2008 to 2014, approximately nine ADUs were permitted per year, representing 1.5
percent of total permitted units during this timeframe. However, after the City of Eugene adopted more
restrictive ADU requirements in July 2014, the annual number of ADU permitted units declined
significantly. From 2015 to 2017, only seven ADUs were permitted in total, about two per year,
representing just 0.3 percent of housing units permitted in those three years.
Eugene Housing Tools & Strategies Evaluation 20FIGURE 15. HOUSING UNITS PERMITTED IN EUGENE BY TYPE, 2008-2017
Number of
Permitted Percent of Total
Housing Type Units (a) Permitted Units
Single Family 2,166 32%
Duplex 165 2%
Accessory Dwelling Unit 73 1%
Townhouse 117 2%
Manufactured Home (b) 165 2%
Triplex, Fourplex (c) 190 3%
Apartments (5+ Units) 3,800 57%
Total 6,676 100%
Source: City of Eugene Planning Division, 2018; Strategic Economics, 2018
Notes:
(a) These data are imprecise and should be used as an estimate. The City is
currently developing a system for collecting and analyzing building permit data.
(b) Manufactured home units include units in home parks and outside home
parks.
(c) Triplex and fourplex permitted unit counts include "Apartments 1-4 unit"
permits which, according to city staff, are predominantly tri- and fourplexes.
FIGURE 16. EUGENE HOUSING UNITS PERMITTED BY TYPE, 2008-2017 (a)
1,000 Apartments (in 5+ unit-buildings)
900
800 Single-family
700 Homes
600
500
400
300 Manufactured
Homes
200 Missing Middle
Units
100
0
2008 2009 2010 2011 2012 2013 2014 2015 2016 2017
Source: City of Eugene, 2018; Strategic Economics, 2018.
Notes:
(a) These data are imprecise and should be used as an estimate. The City is currently developing a system for collecting and
analyzing building permit data.
(b) Missing Middle permitted units include permits for duplex, ADU, townhouse, triplex, and fourplex units.
HOME VALUES AND RENTS
Recent data for home sales shows that the typical for-sale home in Eugene is unaffordable for
approximately 66 percent of households. As shown in Figure 18, the median sales price of detached
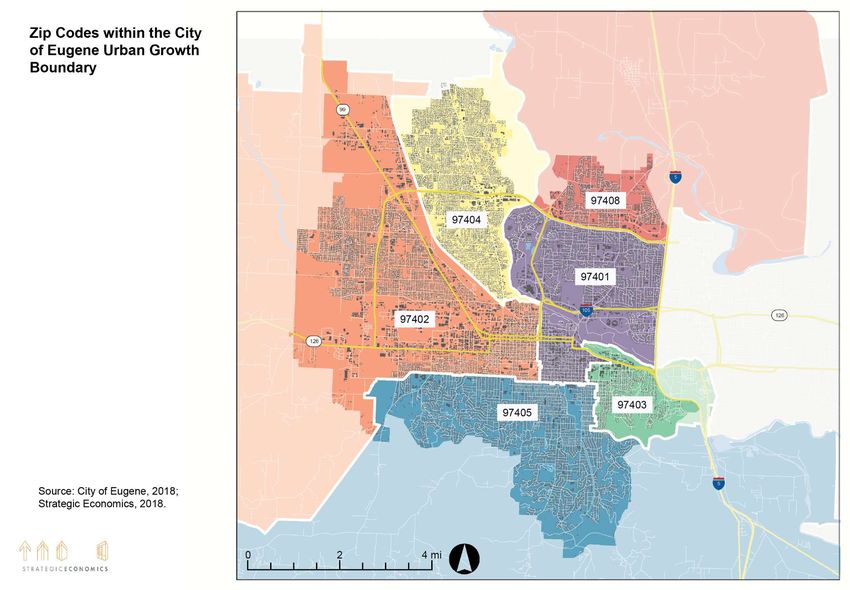
Eugene Housing Tools & Strategies Evaluation 21single-family homes that sold, which account for 92 percent of total sold homes, was $315,000, which requires a minimum annual income of $68,000 18 19 Newly constructed, detached single-family homes are larger, and substantially more expensive than existing single-family homes overall (Figure 19). The median single-family home built since 2014 that sold in the previous year was 19 percent larger than the overall median, and cost 26 percent more. Only two townhomes that sold over this period were built since 2014, both of which were at the Lucia in the Friendly neighborhood. 20 These units, which are 1,464 square feet, sold for approximately $422,000, reflecting a cost of $257 per square foot. In contrast, single-family homes built since 2014 in the same zip code, 97405, sold for $224 per square foot.21 Note that no condos built since 2014 sold in the past year, as no condos have been built in Eugene since 2008. Zip code sales data shows that there is both a larger supply of homes for-sale in west and northwest Eugene neighborhoods, and that these homes tend to be sold at relatively lower prices. In contrast, there were fewer homes that sold in south and east Eugene, and these homes tended to sell at significantly higher prices (Figure 20). See Figure 17 for a map of zip codes within Eugene’s Urban Growth Boundary. 18 Sales of multi-unit buildings, such as duplexes, were excluded from this analysis. 19 Minimum income was calculated assuming monthly housing costs should not exceed 35 percent of household income to be considered affordable. It is based on a 30-year fixed rate mortgage, and incorporates property tax, and homeowners’ insurance, but no down payment cost. 20 Both townhomes were built in 2015. 21 The 97405 zip code covers South Eugene, including Friendly, College Hill, South Hills, and Fox Hollow neighborhoods. Eugene Housing Tools & Strategies Evaluation 22
FIGURE 17. EUGENE ZIP CODES

Eugene Housing Tools & Strategies Evaluation   23
FIGURE 18. SUMMARY OF SOLD HOMES IN EUGENE, 10/16/2017 TO 10/15/2018
                                                   Condo                  Townhouse             Detached Single Family
 Count                                               140                         61                             2,462
 Median Sales Price                           $167,000                      $235,000                          $315,000
 Median Sq. Ft.                                       953                         1360                              1690
 Median Price per Sq. Ft.                           $175                          $173                              $186
 Median Year Built                                  1975                          1980                              1975
Source: Redfin, 2018; Strategic Economics, 2018.

FIGURE 19. SUMMARY OF RECENTLY BUILT, SOLD HOMES IN EUGENE, 10/16/2017 TO 10/15/2018

                                          Detached Single Family Built Since 2014
 Count                                                                                  165
 Median Sales Price                                                             $399,000
 Median Sq. Ft.                                                                       2010
 Median Price per Sq. Ft.                                                             $199
 Median Year Built                                                                    2017
Source: Redfin, 2018; Strategic Economics, 2018.

FIGURE 20. DETACHED SINGLE-FAMILY HOME SALES IN EUGENE BY ZIP CODE, 10/16/2017 TO 10/15/2018

                            All Detached Single-Family                 Detached Single-Family Built 2014 or Later
                                Count        Median Sale Price                        Count           Median Sales Price
         97401                    348                  $345,000                           10                     $453,500
         97402                    558                  $257,950                           30                     $321,200
         97403                      92                 $421,264                             3                    $455,000
         97404                    557                  $295,000                           81                     $386,289
         97405                    703                  $351,750                           16                     $544,975
         97408                    201                  $379,900                           25                     $449,900
Source: Redfin, 2018; Strategic Economics, 2018.

From 2013 to 2018, effective rents in multifamily apartment buildings increased 22 percent on
average, or $190 per unit, after adjusting for inflation. Over this period, Eugene saw an increase in
2,441 apartment units. The 21,528 multifamily units in this analysis likely account for between 60
and 65 percent of Eugene’s rental units.22 Figures 21 and 22 show unit and rent growth broken out
by zip code. Nearly half of new units added over this period were in zip code 97401, which also is
home to over half of Eugene’s multifamily unit stock. Units in this zip code also saw a milder rent
increase, of just 17 percent. Rent rates grew the fastest in zip code 97404, northwest Eugene, which
saw a rent increase of 63 percent, over this period, while adding 172 multifamily units. South Eugene,
or zip code 97405, saw the slowest growth in multifamily units, adding just 10 units over the period,
while rents increased 18 percent. 23

22 American Community Survey, 5-year estimates, 2012-2016.
23 Costar, 2018. Note that Costar data does not incorporate information on rentals in smaller-scale buildings, including single-family homes
or small multiplexes.

Eugene Housing Tools & Strategies Evaluation                                                                                  24
FIGURE 21. EUGENE MULTIFAMILY UNITS BY ZIP CODE, 2013-2018
97408
97402
97405
97404
97403
97401
0 2000 4000 6000 8000 10000 12000
2013 Units Units Built 2013 to Present
Source: Costar, 2018; Strategic Economics, 2018.
FIGURE 22. EUGENE MULTIFAMILY RENTS BY ZIP CODE, 2013-2018, IN 2018 USD
97408
97402
97405
97404
97403
97401
$0 $200 $400 $600 $800 $1,000 $1,200 $1,400
2013 Rents* Overall Rent Increase Since 2013
Source: Costar, 2018; Strategic Economics, 2018.
Eugene Housing Tools & Strategies Evaluation 25ACCESSORY DWELLING UNITS This chapter summarizes the evaluation of Accessory Dwelling Unit (ADU) policy in Eugene. Strategic Economics conducted several analyses to evaluate the potential to increase ADU production, including: 1) conducting a parcel analysis to consider how current ADU policies may be limiting ADU production and the overall potential of ADUs as a tool to increase Eugene’s housing stock and the overall potential of ADUs as a tool to increase Eugene’s housing stock; 2) reviewing the Eugene land use code to identify areas of conflicting interpretation on ADU policy; 3) reviewing existing literature on ADU production in other cities; and 4) conducting an analysis of the financial feasibility of building an ADU under various scenarios. An ADU, also sometimes referred to as a “granny flat,” “in-law unit,” or “backyard cottage,” is a housing unit of modest size, typically ranging from studios to two bedrooms, added to the lot of single-family home. ADUs come in many forms. They can be detached from or incorporated into the primary dwelling. They can be newly constructed or converted from existing structures, such as garages. ADUs are considered a type of “gentle density” in which building them increases the housing supply while minimally impacting their neighborhoods. Who Lives in ADUs? ADUs have been promoted in high-cost cities to meet the needs of aging homeowners. An ADU could provide retirees with both an additional income source, and a means to “age in place.” A 2014 survey of over 200 Portland homeowners with ADUs found that owners are typically older than ADU tenants. The median age of ADU owners in Portland was estimated to be 53, while that of tenants was 36. 24 The vernacular nicknames for ADUs suggest that they are inhabited primarily by family members, be it an elderly parent or an adult son or daughter. However, in regions with high housing costs, homeowners are increasingly building ADUs as units on the general rental market. A study that surveyed homeowners that had recently built ADUs in Seattle, and Portland, and Vancouver, BC, found that over half of the 414 respondents’ ADUs were occupied by “arm’s length renters,” or those with no previous relationship with the owner. Friends and family occupied approximately 30 percent of ADUs, and the remaining respondents reported their ADUs were either unoccupied or occupied by homeowners.25 Benefits and Opportunities Associated with ADUs An effective ADU policy can contribute to achieving or maintaining affordability while accommodating growth because ADUs are a relatively low cost housing type since there are no land costs and because they capitalize on existing infrastructure. Other benefits of ADUs include: ADUs do not require the demolition of existing buildings, and therefore have a significantly smaller displacement impact, compared to larger-scale development. 24 Brown, Martin and Jordan Palmeri, “Accessory dwelling units in Portland, Oregon: evaluation and interpretation of a survey of ADU owners,” Oregon Department of Environmental Quality, 2014. 25 Chapple, Karen, Jake Wegmann, Farzad Mashhood, and Rebecca Coleman. “Jumpstarting the Market for ADUs: Lessons Learned from Portland, Seattle, and Vancouver.” The Terner Center for Housing Innovation, 2018. Eugene Housing Tools & Strategies Evaluation 26
You can also read