ANSWERING THE CALL: FORCIBLY DISPLACED DURING THE PANDEMIC - JDC Paper Series on Forced Displacement, No. 2 - August 5, 2021
←
→
Page content transcription
If your browser does not render page correctly, please read the page content below

ANSWERING THE CALL:
FORCIBLY DISPLACED
DURING THE PANDEMIC
JDC Paper Series on Forced Displacement, No. 2 – August 5, 2021

Jeffery Tanner, Harriet Mugera, Domenico Tabasso, Maja Lazić and Björn Gillsäter
EXECUTIVE SUMMARY

The emergence of COVID-19 has underscored the critical importance of reliable data
in managing global humanitarian and development challenges, especially when
addressing the needs of vulnerable populations, such as forcibly displaced people
(FDPs).

It is clear that we need more and better socioeconomic data—as well as a thorough
analyses of that data—to better inform the design of policies and interventions. Data
deficiencies are particularly acute for vulnerable populations confronting challenges
emerging after the onset of the COVID-19 pandemic, in interrelated areas such as
health care, employment/income, education, and freedom of movement.

This paper takes stock of what is known about the experience of FDPs during the
pandemic; we summarize projections of the expected socioeconomic impact of the
pandemic on those affected by forced displacement, using data from simulations and
scenarios developed by other researchers; and we highlight results from high-
frequency phone surveys covering eight country-level data collection exercises in
Bangladesh, Chad, Djibouti, Ethiopia, Iraq, Kenya, Uganda, and Yemen.

Pre-existing evidence indicates that COVID-19 has resulted in a drastic reduction in
the movement across borders and resettlements. For example, as of May 2020, nearly
100 countries had temporarily denied access to their territory; by May 2021 almost 60
countries still denied access. Modeling and simulation analyses conducted in specific
areas estimate an increase in poverty among the forcibly displaced and their host
communities as a result of the simultaneous effects of COVID-19 and other
aggravating socioeconomic factors. In Lebanon, due to the occurrence of COVID-19
during a deep economic and social crisis, the number of Syrian refugees below the
national poverty line is expected to increase by 430,000 in 2021 compared to the
period just prior to the pandemic.

                                         1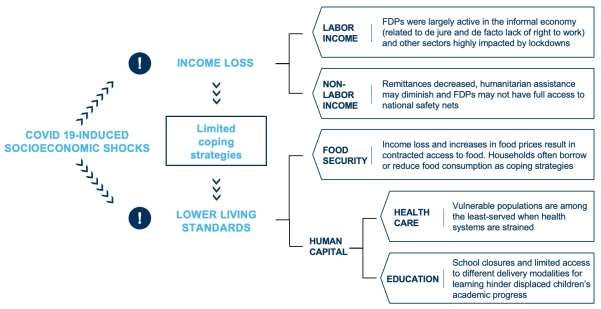
The results from the eight countries surveyed suggest that, in line with the hypotheses
in the JDC’s first paper on this topic, the socioeconomic wellbeing of both forcibly
displaced and host populations have deteriorated during COVID-19, negatively
impacting wages and employment, non-labor income, food security, and access to
health and education.
       •   Displaced populations in the surveyed countries tend to be employed in
           sectors more vulnerable to economic shocks. These displaced populations
           experienced employment losses at rates at least as large if not greater than
           hosts. Work among female and camped laborers seem particularly
           negatively affected. Labor market recovery, when observed, appears slow.
       •   Forcibly displaced persons rely disproportionately on international
           assistance, especially during crises such as the current economic
           downturn. In Djibouti, 88 percent of village-based refugees and 62 percent
           of urban refugee households rely on humanitarian aid compared to only 4
           percent for their host counterparts.
       •   COVID-19 has negatively affected access to health care for many
           households, including those in FDP households. Displaced populations
           typically faced greater challenges accessing medical care than national
           households in Djibouti, Chad, Ethiopia, Kenya, and Iraq.
       •   Food insecurity for the displaced is pervasive across most countries
           surveyed. Nearly 90 percent of refugees in Chad are now severely food
           insecure—more than 25 percentage points higher than for Chadian hosts’
           households. For the displaced, financial constraints were often the most
           frequently cited barrier to accessing health services and food resources.
       •   School closures at the onset of the pandemic inhibited learning
           opportunities for children from forcibly displaced households. The closures
           often removed protective measures, exposing them to greater risks and
           reducing their chances of returning to school when they reopen. In Ethiopia,
           only 20 percent of refugee children were attending primary school and 5
           percent attended secondary school before the pandemic; while schools
           were closed during the pandemic, only 5 percent of primary school refugee
           children and 1 percent of secondary school children had any education
           engagement.

                                           2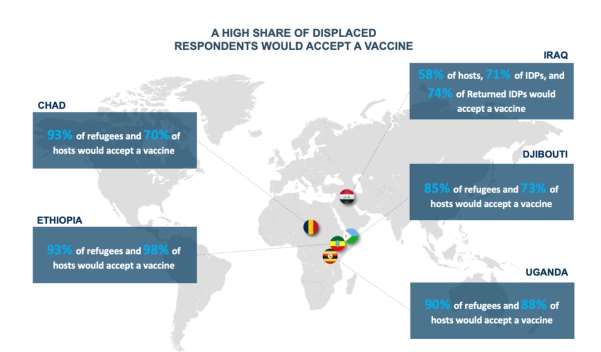
•    The surveys in Chad, Djibouti, Ethiopia, and Iraq showed that FDPs are
                extremely willing to be vaccinated against the spread of the virus. However,
                receptivity is likely to be severely inhibited if there are personal financial
                costs of the vaccine.
           •    Displaced populations very often fare worse than hosts, but not always.
                Refugees and hosts in Uganda had similar struggles in accessing needed
                medical care over the course of the pandemic; the share of Internally
                Displaced Persons (IDPs) and hosts in Yemen with poor access to health
                care showed nearly identical increases during the pandemic; in Iraq, host
                respondents’ unemployment was more volatile and averaged slightly
                higher than IDPs or returning IDPs; and in Bangladesh, teen educational
                engagement (though not necessarily attainment) was higher among
                refugee households compared to the hosts after the onset of the pandemic.

These data sources, although instructive and a promising start, are not necessarily
representative of displaced populations globally. Furthermore, because this is an
interim report, the data from the high-frequency phone surveys have not yet been
harmonized, so direct ordinal comparisons between countries cannot be made. Going
forward, we recommend bolstering and establishing tools that collect regular and
robust data on representative samples of both displaced and non-displaced
populations in line with international standards to facilitate ex ante standardization and
ex post harmonization. Ideally done in collaboration with national statistical offices to
build sustainable capacity, these tools could include a continuation of the existing high-
frequency phone surveys, paired with face-to-face surveys when possible. Inclusion
of the forcibly displaced in national data collection exercises allow for these
populations’ integration into policy responses as well as humanitarian and
development interventions.1

1
  This version was first made available online on August 5, 2021. The paper carries the names of the authors and should be
cited accordingly. The findings, interpretations, and conclusions expressed in this paper are entirely those of the authors. They
do not necessarily represent the views of the Joint Data Center on Forced Displacement, UNHCR, The World Bank, the
Managing Committee of the Joint Data Center on Forced Displacement, or the governments any of those entities represent.

                                                                3
ACKNOWLEDGEMENTS
We wish to express our sincere gratitude to Sajjad Malik (Director for the Division of
Resilience and Solutions, UNHCR) who chaired the Decision Meeting, and to Xavier
Devictor (Manager, Fragility, Conflict and Violence Group, World Bank) and Carolina
Sánchez-Páramo (Global Director, Poverty and Equity Global Practice, World Bank)
for overall guidance and advice. Special thanks are due to the teams and their Task
Team Leads for the country-specific data collection efforts, preparing the
corresponding analytical pieces and comments on the paper: Nandini Krishnan and
Maria Eugenia Genoni for Bangladesh; Aboudrahyme Savadogo for Chad; Bilal
Malaeb for Djibouti; Christina Wieser for Ethiopia; Lokendra Phadera for Iraq; Utz
Pape for Kenya; Aziz Atamanov for Uganda; and Sharad Tandon for Yemen.
The team received valuable comments from Carolina Sánchez-Páramo, Gero
Carletto, Rebecca Lacroix, Clementine Nkweta-Salami, and Betsy Lippman who
served as peer reviewers. Thanks also goes to colleagues in UNHCR for their
insightful comments and suggestions, including Sumbul Rizvi, Principal Advisor on
Internal Displacement; Tarek Abou Chabake and the Global Data Service Team;
Theresa Beltramo, Jedediah Fix, Rebecca Telford, Cirenia Chavez Villegas, Ann
Burton, and the Public Health Section team from the Division of Resilience and
Solutions, Georgia Christina Kosmidou Bradley on behalf of the UNHCR country
economists, and Micaela Malena from the Division of International Protection.
The entire team at the Joint Data Center on Forced Displacement supported the paper
with their critical review and useful comments at various stages. Special thanks go out
to Arthur Alik-Lagrange for early guiding comments and to Leila Aghabarari and Kiarã
Soobrayan for providing drafting and editorial support.
The authors are grateful to Mike Kelleher for his editorial support and Intellishore for
their support in visualizing the data and messages in the paper.
4Finally, we gratefully acknowledge contributions made to the Joint Data Center by the
government of Denmark represented by the Danish Ministry of Foreign Affairs, the
European Union (Directorate-General for International Partnerships), and the U.S.
Government represented by U.S. Bureau of Population, Refugees, and Migration
(PRM).
All errors and omissions are the authors’. Contacts: jtanner@worldbank.org;
hmugera@worldbank.org; tabasso@unhcr.org; lazic@unhcr.org;
bgillsater@worldbankgroup.org.
5CONTENTS
Executive Summary ............................................................................................................ 1
Acknowledgements ............................................................................................................ 4
Contents .............................................................................................................................. 6
1 Introduction ...................................................................................................................... 8
2 Background .................................................................................................................... 12
3 Conducting high-frequency phone surveys................................................................. 16
4 Observed socioeconomic welfare during the pandemic ............................................. 21
4.1 Income loss risk ......................................................................................................... 21
4.1.2 Labor income ................................................................................................. 22
4.1.3 Non-labor income .......................................................................................... 25
4.2 Living standards: Health, food security, and education .............................................. 28
4.2.2 Health ............................................................................................................ 28
4.2.3 Food access and food security ...................................................................... 32
4.2.4 Education ........................................................................................................ 35
5 Household COVID-19 responses .................................................................................. 38
5.1 Shocks and coping mechanisms ........................................................................... 38
5.2 COVID-19 awareness, behaviors, and vaccine receptivity .................................... 39
6 Conclusions and next steps .......................................................................................... 41
References ........................................................................................................................ 44
Annexes ............................................................................................................................. 48
Annex 1: Bangladesh ...................................................................................................... 48
Annex 2: Chad................................................................................................................. 49
Annex 3: Djibouti ............................................................................................................. 50
Annex 4: Ethiopia ............................................................................................................ 51
Annex 5: Iraq ................................................................................................................... 52
Annex 6: Kenya ............................................................................................................... 53
Annex 7: Uganda ............................................................................................................. 54
Annex 8: Yemen .............................................................................................................. 55
6List of Figures:
Figure 1: Conceptual Model of the multidimensional socioeconomic effects of COVID-19 on
Forcibly Displaced People ..................................................................................................... 9
Figure 2: COVID-19 and restrictions on access around the world ....................................... 10
Figure 3: Refugee employment rates before and during COVID-19, Kenya 2020................ 14
Figure 4: Estimated increase of population in poverty from Q1 2020 to Q4 2021; Syrian
refugees and host communities in Lebanon and Kurdistan Region of Iraq. ......................... 15
Figure 5: Timeline of data collection rounds and covid-19-related restrictions ..................... 18
Figure 6: High-Frequency Phone Surveys that include displaced samples.......................... 19
Figure 7: Camp, Non-Camp and Host unemployment in Iraq .............................................. 24
Figure 8: Households reporting income by source in Djibouti .............................................. 26
Figure 9: Share of Returning IDP, Host, and IDP households that received public distribution
system transfers in Iraq ....................................................................................................... 27
Figure 10: Share of respondents with poor access to health care in Yemen ....................... 29
Figure 11: Food Insecurity in Chad, January-February 2020 ............................................... 33
Figure 12: Educational engagement for refugee households’ children in Ethiopia ............... 36
Figure 13: FDPs acceptance of vaccinations ...................................................................... 40
71 INTRODUCTION
The emergence of COVID-19 has highlighted the critical importance of quality data in
managing global development challenges, particularly for vulnerable populations. In
this paper we detail the socioeconomic experience of forcibly displaced populations 2
and their hosts during the COVID-19 pandemic, based on pre-existing evidence and
on recent high-frequency survey exercises where more than 90,000 interviews were
conducted. This is the first comprehensive presentation of the results from these data-
collection exercises. The results are of an interim nature: they will be presented in
greater detail in forthcoming studies by the World Bank, UNHCR, JDC, and others.
The World Bank-UNHCR Joint Data Center on Forced Displacement’s first working
paper on the pandemic—Highly vulnerable yet largely invisible: Forcibly displaced in
the COVID-19-induced recession—ended with a call regarding data:
“More and better data are needed to design policies and interventions to
improve the lives of forcibly displaced people (FDPs) and their host
communities. Such data can also improve our understanding of risk factors
and the implications of COVID-19 for nationals and the forcibly displaced.”
In this second working paper, we answer this call (in part) by:
1) taking stock of emerging data and evidence on the socioeconomic experience
on those affected by forced displacement during the pandemic, presenting evidence
from simulations and scenarios developed by several experts and actors;
2) presenting and analyzing data from high-frequency phone surveys
commissioned by the World Bank, UNHCR and/or the Joint Data Center, in countries,
often involving multiple data-collection rounds; and,
3) connecting, where possible, the evidence from the high-frequency phone
surveys to policy responses to the pandemic (as relevant to those forcibly displaced),
with specific references to access to health services and food security.
2For a definition of displacement, please see the UNHCR Glossary:
https://www.unhcr.org/glossary/#displacement.
8Whenever feasible, we are deliberate in the references to specific groups of those
forcibly displaced, such as refugees and internally displaced, and we highlight
differences and similarities in socioeconomic indicators between these groups when
comparing with host communities and national averages. This includes the
fundamental difference that refugees (and asylum seekers) fall under the protection of
international law while internally displaced persons (IDPs) are under the primary
responsibility of the national authorities. For the purpose of understanding the
terminology in the paper in relation to forced displacement, the reader is referred to
the UNHCR Master Glossary of Terms.
In tracing out the implications of the pandemic, we follow the conceptual model
developed in the JDC’s first working paper (see Figure 1). Specifically, we explore lost
income, whether from labor or non-labor income, and lowered living standards, such
as reduced access to food, health, and education services.
Figure 1: Conceptual Model of the multidimensional socioeconomic effects of
COVID-19 on Forcibly Displaced People
Adapted from Vishwanath, Alik-Lagrange, and Aghabarari, 2020.
The model identifies COVID-19-induced socioeconomic shocks as the element which
triggered the effects categorized in the figure, including direct health effects and
indirect macroeconomic effects. Importantly, governments’ responses to the pandemic
have exerted immediate restrictions on the daily life of their citizens, with impacts
9across the five dimensions. The most apparent restriction has been the abrupt
reduction in internal and international mobility: in response to the spread of COVID-
19, closures of borders and severe internal limitations on the freedom of movement
have been adopted across all parts of the world. According to data collected by
UNHCR, at the end of May 2020, 99 countries denied access to their territory3. These
closures affected any persons who wanted to cross the borders, and no exceptions
were made for asylum seekers.4 At the same time, 65 countries were applying some
form of restrictions on access, with exceptions for asylum seekers.5 One year later, 57
countries still deny access and 73 retain restricted access.6 7
Figure 2: COVID-19 and restrictions on access around the world
Border closures have also affected the global number of resettlement departures,8
which dropped from around 64,000 in 2019 to 22,800 in 2020. The trend is confirmed
in 2021, with only 4,500 resettlement departures taking place in the first three months
of the year.9 These numbers and trends must be taken into account when evaluating
the evidence emerging from the high-frequency phone surveys.
This paper provides an overview of select country-level reports from the high-
frequency phone surveys prepared by teams from the World Bank, UNHCR, or Joint
Data Center, often in partnership with national statistical offices and other actors.
3
UNHCR, 2021a.
4
Note that the principle of non-refoulement requires that while States have the responsibility to protect public health and can
temporarily close their borders, exceptions are to be in place for those persons seeking international protection. For a definition
of non-refoulement, please see the UNHCR Glossary: https://www.unhcr.org/glossary/#non-refoulement.
5 The eight whose individual socioeconomic situations are analyzed in the high-frequency phone survey part of this paper, and
all applied a partial or complete closure of their borders.
6 UNHCR COVID-19 Platform, Temporary Measures and Impact on Protection, https://im.unhcr.org/covid19_platform/, as
consulted on May 14, 2021. In May 2020, no data was available for 27 countries; in May 2021, no data was available for 34
countries. See also UNHCR, 2021a.
7
Among the 57 countries denying access is one of the eight which will be analyzed in the high-frequency phone survey section
in this paper; four more of the eight countries still have some forms of restriction to access in place.
8 For a definition of resettlement, please see the UNHCR Glossary: https://www.unhcr.org/glossary/#resettlement
9 Data from UNHCR Resettlement Data Finder, as consulted on May 14, 2021. Also see the JDC paper Highly vulnerable yet
largely invisible: Forcibly displaced in the COVID-19 induced recession.
10Specifically, the data come from surveys conducted in Bangladesh, Chad, Djibouti,
Ethiopia, Iraq, Kenya, Uganda, and Yemen. Although centrally coordinated, the data
presented in those reports was collected by different teams using different
questionnaires and approaches. Because the resulting differences in the data have
not (yet) been harmonized, point estimates between countries cannot be statistically
combined or directly numerically contrasted. Rather, this paper presents a collection
of individual country analyses of related constructs in which we note country findings
and point out where those findings tend to point in the same or different directions
between countries.
The paper concludes by summarizing findings and outlining next steps, highlights the
importance of continued collection of such data – including through engagements that
build the capacity of national statistical offices, and suggests some directions for
further analytical and data collection work.
112 BACKGROUND
During the first months of the COVID-19 pandemic, the emerging consensus on the
modes of transmission of the disease led to severe concerns regarding consequences
in environments such as camps, often characterized by a high population density,
limited access to health services, considerable levels of malnutrition, and limited
financial resources. Moreover, these elements were compounded by the difficulties of
conducting effective testing campaigns in developing countries, which host the large
majority of displaced people. These concerns have led researchers to investigate the
health and socioeconomic consequences of the pandemic among those forcibly
displaced. Despite these efforts, until recently the living conditions and life trajectories
of those forcibly displaced during the pandemic have been poorly documented due to
a lack of widespread, reliable data. Nonetheless, the limited available evidence
indicates the importance of a deeper understanding of the consequences of COVID-
19 on these vulnerable people. For example, evidence from Greece shows refugees
experiencing infection rates which are 2.5 to 3 times higher than those of the general
population.10 Nonetheless, to date, some of the forecasts from the early months of
the pandemic, pointing towards dramatic consequences for the forcibly displaced, 11
have not fully materialized.
While policy responses and recovery plans of developed countries have helped reduce
the impact of the economic consequences (as compared to the 2008 recession), this
has not been the case for poorer countries. The IMF indicates that low- and middle-
income countries, which have already suffered extensively from the pandemic, might
still have to deal with more significant mid-term losses. 12 Forcibly displaced
populations hosted in developing countries—which make up 90 percent of all those
forcibly displaced globally—are unlikely to be immune from these effects.
Early surveys conducted by the International Labour Organization and Fafo Institute
for Labour and Social Research indicated that in Jordan almost half of the respondents
10
Kondilis et al., 2021; Matlin et al., 2021.
11
See Truelove et al., 2020.
12
IMF, 2021
12who were employed before the COVID-19 outbreak were out of work in April 2020.13
Refugees were particularly affected: a third of surveyed Syrians (displaced and living
in Jordan) who were employed before the crisis had lost their jobs permanently,
compared to 17 percent of surveyed host Jordanians.14 Later data confirmed these
findings: according to a study published in November 2020, the employment share fell
by 28 percent among refugees during lockdown, compared to a 19 percent decrease
for non-refugees.15 Figures from Lebanon, a country hit by a deep economic and
social crisis, compounded by COVID-19 (and later by the dramatic explosion that
occurred in the port of Beirut in August 2020), suggest an even more dramatic impact:
by April 2020, 60 percent of Syrian refugees had been permanently laid off and 31
percent temporarily lost their jobs (the corresponding figures for Lebanese workers
were 39 and 38 percent, respectively).16 The very high proportion of refugees who
lost their jobs in the aftermath of the pandemic relates to their sector of employment.
Most Syrian refugees in Lebanon, in fact, work in agriculture or construction (men) and
household services (women). These are sectors characterized by a high degree of
informality, in which the absence of a contract makes permanent layoffs very easy.
More recent evidence from Kenya, one of the countries analyzed in more detail later
in this paper, indicates that after the beginning of the pandemic the employment rate
among working-age refugees went down to one in ten persons, versus four in ten in
the Kalobeyei camp and two in ten in Kakuma before the COVID-19 pandemic (see
also Figure 4).17
The consequences of COVID-19 on the labor market were also presaged in a July
2020 study by the Center for Global Development. Based on data from eight hosting
countries before COVID-19, the report estimated that refugees were 60 percent more
likely than host populations to be working in sectors highly likely to be impacted, such
as accommodation and food services, manufacturing, and retail.18 Early results from
high-frequency phone surveys conducted in Uganda also showed how the likelihood
13
Kebede et al., 2020b.
14
Ibid.
15
Cefalà et al., 2020.
16
Kebede et al., 2020c.
17
World Bank, 2020a.
18
Dempster et al., 2020.
13of work stoppages varied across different sectors, although in this case the most-
affected refugees were those employed in the services sector.19
Figure 3: Refugee employment rates before and during COVID-19, Kenya 2020
80% 71
70
60 53
50 43
40
30 23
20 12 9
10
0
Kalobeyei Kakuma National
Employment Rate
Before COVID-19 During COVID-19
Source: data and figures from World Bank, November 2020. “Kenya Economic
Update, November 2020: Navigating the Pandemic”. World Bank, Kenya:
Nairobi. Available at:
https://openknowledge.worldbank.org/handle/10986/34819.
Note: Pre-pandemic data from Kalobeyei Socioeconomic Survey, 2018;
Kakuma Socioeconomic Survey, 2019; World Bank estimates 2019 for National
Employment Rate. Data for the period throughout the pandemic from the
Kenya COVID-19 Rapid Response Phone Survey, May-October 2020 (see also
“Socioeconomic Impacts of COVID-19 in Kenya on Households : Rapid
Response Phone Survey, Round 1”).
Evidence from the Mashreq region shows how COVID-19 has aggravated the
socioeconomic conditions of both those forcibly displaced and their hosts, with
consequences on their poverty levels. Specifically, a JDC-supported World Bank-
UNHCR report estimated that 4.4 million people in the host communities and 1.1
million among those forcibly displaced have been driven into poverty in the immediate
aftermath of the COVID-19 crisis in Lebanon, three governorates of Jordan, and the
Kurdistan Region of Iraq.20 Recently updated figures21 for Lebanon indicate that, by
the end of 2021, an additional 2.5 million Lebanese individuals and 430,000 Syrian
19
Atamanov et al., 2020.
20
World Bank-UNHCR, 2020.
21
World Bank-UNHCR, 2021.
14refugees will be forced into poverty, as calculated based on the national poverty line
(see also Figure 4).22 More generally, the ILO estimated that the pandemic led to a
56 percent increase in poverty rates in low- and lower-middle-income countries for
workers in the informal sector, where the large majority of forcibly displaced are
employed.23
The evidence summarized in this section highlighted efforts by various actors to fill the
data gap regarding the effects of COVID-19 on the most vulnerable populations.
However, these efforts often only provide a temporary snapshot of their living
conditions. In contrast, data from the high-frequency phone surveys can help provide
policy-makers, practitioners, researchers, and other stakeholders with up-to-date
information on both the forcibly displaced and their host communities.
Figure 4: Estimated increase of population in poverty from Q1 2020 to Q4 2021;
Syrian refugees and host communities in Lebanon and Kurdistan Region of Iraq.
60
Percentage Point Increase
50
40
30
20
10
0
Lebanon KRI
Refugees Host
Source: “2021 Compounding Misfortunes: an update to the study”, World Bank-UNHCR Report, 2021.
22
This change will take place with respect to what was observed in the first quarter of 2020. As already mentioned previously, it
is important to note that in Lebanon COVID-19 has contributed to a worsening of an already existing economic crisis.
23
ILO, 2020b.
153 CONDUCTING HIGH-
FREQUENCY PHONE
SURVEYS
Following calls for better data to understand the implications of COVID-19 for host
populations and the forcibly displaced, the Joint Data Center (JDC) worked with its
parent institutions to help answer that call. In collaboration with World Bank and
UNHCR teams, the JDC identified six countries 24 that could either: (1) integrate a
representative sample of FDPs into the ongoing high-frequency phone surveys that
were being undertaken by the World Bank on the host populations to monitor welfare
and behavioral changes during the pandemic; or (2) execute a parallel survey on the
forcibly displaced alongside those national surveys.25 By August 2021, four of the six
countries in which the JDC has supported data collection—Chad, 26 Djibouti,
Ethiopia, 27 and Iraq—had collected at least one round of data and conducted
preliminary analyses. In addition to these four countries, the JDC has supported the
analysis of similar data from Yemen and Bangladesh.
Beyond the JDC, UNHCR worked directly with World Bank country teams in Kenya
and Uganda to build out phone surveys on displaced populations complementary to
the World Bank’s phone surveys of those host populations.
In the following sections, we summarize socioeconomic microdata indicators from
more than 90,000 interviews conducted after the onset of the pandemic (March 2020)
in these eight countries. 28 Figure 5 chronicles the timeline of the rounds of data
24
Countries were selected as an availability sample based on the criteria of having a significant level or share of displaced
persons (proxied by being an IDA-18 RSW or GCFF country), availability of a sampling frame, interest from World Bank and
UNHCR teams, and in some cases the capacity and interest of the national statistical agency. Because countries were not
selected to be representative (or indicative) of all countries worldwide with displaced populations, the collection of results here
is not representative of all countries with displaced populations or of displaced populations globally. For example, as a
convenience sample, this collection of countries has few examples from some regions (South Asia) or none from others (the
Americas). Planned expansions of this work look to take on countries from those regions.
25
Although some national HFPS samples may have picked up some displaced households in their sample, without dedicated
oversampling there would generally be too few of them to make robust conclusions on sub-groups of FDPs.
26
NB: Planned data collection on refugees in Chad concluded just prior to the civil unrest of Spring 2021.
27
NB: Planned data collection on refugees in Ethiopia concluded just as the 2020 Tigray conflict started.
28
See the following resources for the countries from which the results in this paper were drawn:
16collection in these countries. The figure illustrates how the surveys were fielded during
the time when countries implemented restrictions in freedom of movement, outside
activities, and in-person school attendance. Although the survey questionnaire for
each of the countries has a common root, local adaptations were made in the timing,
number of rounds, and content of each survey wave across the eight countries. 29
Specifics of sampling strategies differ across the countries, but each population
sample has been drawn and adjusted to make it as representative as possible of the
populations described in Figure 6. Because the data collection instruments are not
identical across countries and the data have not yet been harmonized (as these are
still interim results), point estimates cannot be directly compared between countries;
rather, this paper summarizes trends within countries and (at most) observes whether
those trends are materially similar or dissimilar across countries.30
.
Bangladesh: See Impacts of COVID-19 on Work and Wages in Cox's Bazar, Status of Education Among School-Aged Children
in Cox’s Bazar (forthcoming) and Impacts of COVID-19 on Food Security in Cox's Bazar: Food Consumption, Coping and
Assistance for first round on refugees and nationals and Impacts of COVID-19 on Work and Wages in Cox's Bazar : Part 1 -
Rohingya Camps for the second round.
Chad: Brief(s) forthcoming
Djibouti: See Monitoring the socio-economic impacts of COVID-19 on Djiboutian and refugee households in Djibouti – results
from R3
Ethiopia: See Monitoring COVID-19 Impact on Refugees in Ethiopia – Report No. 1 and Monitoring COVID-19 Impact on
Refugees in Ethiopia – Report No. 2 for information on refugees.
Iraq: Report Forthcoming
Kenya: See https://www.kenyacovidtracker.org/rrps and Socioeconomic impacts of COVID-19 in Kenya
Uganda: For information on refugees see Monitoring Social and Economic Impacts of COVID-19 on Refugees in Uganda :
Results from the High-Frequency Phone Survey - First Round, and Third Round Results for Ugandans can be found here. A
policy paper comparing refugee and Ugandan welfare can be found here.
Yemen: See presentation on COVID-19 and Forced Displacement in the Global South
29
Details can be found in the country annexes of this paper.
30
That is, we make positive comparisons but not superlative or mathematical comparisons or rank countries.
17Figure 5: Timeline of data collection rounds and covid-19-related restrictions
Notes: data on dates of restrictions from Thomas Hale, Noam Angrist, Rafael Goldszmidt, Beatriz Kira, Anna Petherick, Toby Phillips, Samuel Webster, Emily Cameron-Blake, Laura Hallas,
Saptarshi Majumdar, and Helen Tatlow. (2021). “A global panel database of pandemic policies (Oxford COVID-19 Government Response Tracker).” Nature Human Behaviour.
https://doi.org/10.1038/s41562-021-01079-8. In the original data, restrictions are categorized on a 0 to 3 scale, 0 meaning no restrictions, 3 meaning the strictest restriction. For simplicity we use the
same color for any degree of restriction and white only for no-restriction periods. In Iraq, school closures started in February 2020. All countries reported the onset of the pandemic as March 2020,
with the exception of Iraq that indicated February 2020.
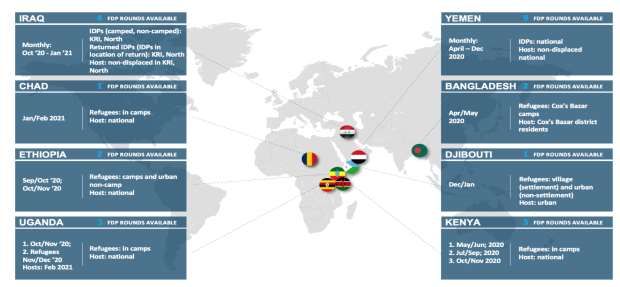
18Figure 6: High-Frequency Phone Surveys that include displaced samples
Notwithstanding the considerable technical challenges in using phone surveys to
collect data and generate reliable statistics, 31 these surveys strive to be
representative of the displaced and host populations they sample, both through robust
sampling strategies and ex post weighting. In each of these countries, teams collected
data on a sample of a defined, policy-relevant forcibly displaced population (or
populations). Each country also has collected data contemporaneously on a defined
host population—either a national sample of non-displaced households or a sample
of non-displaced households living in the same administrative area as the FDPs.32
Nonetheless, HFPS instruments are typically characterized by a shorter survey length
and do not provide control of the interview environment to allow pursuit of sensitive
topics. Phone surveys also encounter significant challenges in overcoming sampling
and selection bias, including the risk of not capturing the most vulnerable, which they
31
Although phone surveys are a useful tool during the pandemic in that they avoid becoming vectors of spread through physical
interactions, they can only reach respondents who have access to an active mobile phone line, and may therefore
systematically exclude poorer households to some extent. To overcome that potential bias, the phone surveys reported here
applied re-weighting techniques to provide statistics that are as representative as possible of the defined host and displaced
populations. For a discussion on overcoming challenges endemic to phone surveys, see Tanner, Jeffery 2021, “The Pitfalls and
Potential of High-Frequency Phone Surveys During COVID-19,” Forced Migration Review, 66.
32
Each set of surveys employs probability sampling with a sampling strategy that aims to yield a representative sample of
households that have access to a mobile phone. Recognizing challenges of selection biases in phone ownership, non-
response, and attrition, the teams applied ex post sampling weights using time-invariant demographic information from the
most recent face-to-face survey, census, or listing exercise (which generally have a much lower sampling bias) to adjust the
sample to mirror the general displaced and non-displaced populations in the country (or geographic area) as closely as
possible.
19aim to overcome through careful probability sampling strategies and ex-post
weighting. Therefore, such surveys are appropriately seen as instruments
complementary to traditional face-to-face surveys. At the same time, they are ideal
tools for providing timely evidence to inform (and to some extent validate) modeling
and simulation analyses, as well as to rapidly produce reliable statistics and to collect
data where face-to-face contact is not feasible (as with the pandemic).
The results presented here are descriptive rather than causal: we can observe
changes in outcomes during the pandemic, and we can posit that the pandemic
contributed to those changes, but we cannot isolate the magnitude of the effect of the
pandemic. Moreover, as noted, the data have not been harmonized between
countries, so direct quantitative comparisons between countries’ statistics cannot be
made. Instead, we report country-level findings and note where they are materially
similar or dissimilar across countries. Finally, because data collection and analysis
continue in several of these countries, and fine-tuning of analyses may be carried out,
the results presented here are both interim and preliminary in nature. Even so, as a
collection of country analyses, the results from these eight countries are instructive
(even if not conclusive) in understanding the range of experiences of host and
displaced populations during COVID-19.
204 OBSERVED
SOCIOECONOMIC WELFARE
DURING THE PANDEMIC
High-frequency phone survey data from Bangladesh, Chad, Djibouti, Ethiopia, Iraq,
Kenya, Uganda, and Yemen from March 2020 through March 2021 provide compelling
insights on the realities facing FDPs 33 and non-displaced populations during the
COVID-19 pandemic. We organize this data to follow the hypotheses laid out at the
beginning of the pandemic in Figure 1, that COVID-induced socioeconomic shocks
have direct effects in lowering living standards, and indirect effects as income loss
induces negative coping strategies resulting in lower welfare indicators. We
summarize observed outcomes for income-loss risk (including both labor and non-
labor income) and living standards (including health, food access and food security,
and education), pointing out how FDPs have fared over time and in comparison to host
populations.34
4.1 Income-loss risk
As described in the model in Figure 1, loss of income (cash and in-kind benefits) from
labor or non-labor sources is a significant risk for FDPs and hosts that can cascade to
create or exacerbate additional welfare challenges. Preliminary estimates from
Uganda suggest that poverty among refugees increased by 7 percentage points, up
from 44 percent to 51 percent over the pandemic period. Indeed, 89 percent of
refugees in Uganda estimated that their total income has decreased compared to the
period before the pandemic. Similarly, in Chad, some 75 percent of the host and the
refugee population reported a drop in income. We find evidence of such decreases in
welfare for a large share of displaced households in Bangladesh, Chad, Djibouti,
Ethiopia, Uganda, and Yemen.
33
The forcibly displaced referred to in Bangladesh, Chad, Djibouti, Ethiopia, Kenya, and Uganda are refugees, whereas those
referred to in Iraq and Yemen are IDPs and, in the case of Iraq, returned IDPs.
34
The original model also included housing, voicing the concern that the welfare of refugees’ (and perhaps IDPs to an extent)
depends on their housing environment, including being in and out of camps, and the variation between and within hosting
communities. While the phone surveys did not collect data on the latter, we do intersperse camp/non-camp differences
throughout the discussion here.
214.1.2 Labor income
The global economic slowdown and the resulting evaporation of labor demand,
together with local pandemic-related restrictions, were expected to adversely affect
the ability to work and earn an income for many households. Evidence from the
surveys indicate that in most of the countries analyzed, displaced populations
experienced employment losses. The rate of these losses was often equivalent to or
greater than losses experienced by host populations—although there are important
exceptions. Further, labor market outcomes for the female displaced populations may
be worse than males or non-displaced. When a labor market recovery has been
observed in these countries, that recovery appears to be slow—particularly for
displaced populations.
As hypothesized in the JDC’s first COVID-19 paper, the data indicate that refugees in
the contexts analyzed are very often employed in the informal sector and as casual
laborers. The surveys indicate that the majority of refugees who reported to be working
in Chad, Djibouti, Ethiopia, and Kenya were employed in informal sectors and did
unskilled jobs. Pandemic-related movement restrictions may have been particularly
detrimental to such workers as their labor market positions are especially vulnerable:
they do short-term and often unspecialized work which frequently requires travel, and
they are largely replaceable.
In Ethiopia,35 less than 20 percent of refugee respondents were working in October
2020 compared to almost 90 percent for hosts. When asked why they had lost work,
61 percent of refugees surveyed attributed their job losses to COVID-19; while 23
percent pointed to seasonality or the casual nature of their work as the reason they
were not currently working. Before the pandemic 46 percent of Chadians and 51
percent of refugees in Chad reported working, out of which 30 percent of refugees
were working within refugee camps. By early 2021, 21 percent of refugees had
stopped working, compared to 9 percent of Chadians.
In the context of the highly regulated labor market in the Cox’s Bazar36 refugee camps,
work opportunities were already severely limited prior to the pandemic because of
35
See Monitoring COVID-19 Impact on Refugees in Ethiopia – Report No. 1
36
See Impacts of COVID-19 on Work and Wages in Cox-s Bazar: Part 1 – Rohingya Camps
22restrictive policies by the Government of Bangladesh that prohibit formal employment
and a September 2019 government ban on using cash in camps. Incentives given by
humanitarian operations to refugee volunteers were the only formally recognized cash
streams, but when those operations contracted due to COVID-19 concerns, work
opportunities dwindled, even as more people were looking for ways to supplement
household welfare. The employment rate for refugees dropped from 64 percent in
camps in 2019 to just 23 percent in the Spring of 2020, and it was largely unchanged
six months later. Similarly, in Uganda37 13 percent of refugees stopped working since
the lockdown and 50 percent of work stoppage was directly related to COVID-19.
Gender differences in the labor market are also apparent for Rohingya refugees in
camps in Bangladesh. Though female labor force participation is increasing rapidly,
they are still less likely to look for work than males and are less likely to find it. From
2019 to late 2020, male labor force participation grew from 64 percent to 83 percent,
but employment rates (those among the working-age population currently engaged in
any income-generating activity) nearly halved from 61 percent to 33 percent.
Concurrently, female labor statistics exhibited even more radical swings. Female labor
force participation more than quadrupled from 9 percent to 40 percent from 2019 to
Oct-Dec 2020, but their struggle to find work is evidenced by the precipitous drop in
employment among females from 78 percent to 9 percent. Lockdown activity
contractions in Bangladesh have likely induced more people to look for work but the
market has been unable to accommodate the surge in labor supply. In Djibouti,38 46
percent of female breadwinners (the household’s primary earner as identified by the
respondent) among displaced people reported to have worked in the week before the
onset of the pandemic, compared with 58 percent of male breadwinners.
In Iraq, IDPs are more likely to be looking for work than their non-displaced
compatriots, but IDPs, returning IDPs and hosts have unemployment rates similar to
the national averages. Between October 2020 and January 2021, unemployment rose
in all groups. But while unemployment rose the most for returning IDPs from 13 to 22
percent, it was most volatile and ended highest for hosts at 26 percent. Similarly hosts
37
See Monitoring Social and Economic Impacts of COVID-19 on Refugees in Uganda : Results from the High-Frequency
Phone Survey
38
See Monitoring the socio-economic impacts of COVID-19 on Djiboutian and refugee households in Djibouti
23had slightly higher unemployment rates than IDPs living out of camps; however,
camped IDPs consistently had the highest unemployment rates in Iraq, ending at 46
percent (See Figure 6). The data from Iraq suggest that female IDPs may be
increasingly likely to participate in the labor force, and unemployment among those
who do participate appears to be falling slightly.
Figure 7: Camp, Non-Camp and Host unemployment in Iraq
100 %
90
80
70
60
50
40
30
20
10
0
Oct-20 Nov-20 Dec-20 Jan-21
Camp IDP Non-Camp IDP Host
In Djibouti, less than half of village (settlement)-based refugee breadwinners and
around two-thirds of urban refugee breadwinners were employed in late 2020/early
2021. Of those that were employed prior to the onset of the pandemic, 16 percent of
village-based refugee breadwinners and 7 percent of urban refugee breadwinners who
were employed prior to the onset of COVID-19 no longer had a job by the start of 2021.
The data suggest that as governments ease lockdown measures, signs of labor
market recovery are often slow and heterogeneous across countries and within
countries across time for both hosts and the displaced. In Kenya, for example,
employment rates are slowly improving. Employment rates for host breadwinners rose
from 50 percent to 61 percent over the five months from June to November 2020;
refugee employment rates were far lower but also saw an increase over the same
period from 6 percent to 16 percent.
24In Uganda, employment rates for the host population have fully rebounded to pre-
pandemic levels, yet employment among refugees is still lower than before the
pandemic. In just over a month, refugee employment dropped from 43 percent in
October-November 2020 to 36 percent in December. Moreover, the share of refugee
households with a family business still has not reached pre-pandemic levels.
From early in the pandemic in Bangladesh, both hosts and refugees living in Cox’s
Bazar who worked during the lockdown reported reduced earnings, across all
employment types. In Ethiopia’s September survey, almost 45 percent of refugees
(versus 20 percent of hosts) reported that their wages were reduced due to
deteriorations in their employment situation. By January in Chad, income decreased
for more than 70 percent of all households (72 and 74 percent for hosts and refugees,
respectively); income from agricultural activities alone declined for 70 percent of
refugee households since the onset of pandemic.39
4.1.3 Non-labor income
As countries suffered the negative effects of the pandemic, there was concern that the
displaced would not have full access to national safety nets, that humanitarian needs
would not be fully met, and that remittances would decrease. Survey data indicates
that displaced populations were often far more likely to rely on non-labor income than
hosts, but while some countries saw those sources decrease, reductions were more
heterogeneous than anticipated.
Remittances are one of the main sources of income for many refugee and host
households in Djibouti and Ethiopia. Among those refugees relying predominantly on
remittances in Ethiopia, one-third reported a decline in remittances in September.
A significant share of non-labor income for both hosts and refugees comes from
government and international assistance—which increased during the pandemic in
some of the countries surveyed but decreased in others. Although wage work was the
dominant income source among urban nationals in Djibouti (the host sample), urban
39
Labor income is an important indicator, though it does not lend itself well to phone surveys. Such surveys are generally too
short to be able to ask in-depth questions on income composition to allow estimation of total income changes. Rather, phone
surveys are more likely to ask respondents whether they believe income has increased.
25refugee households were far more likely to receive non-wage income including
remittances, government, and international assistance (See Figure 8). This pattern is
particularly pronounced for households based in refugee villages, 88 percent of whom
rely on international assistance.
Figure 8: Households reporting income by source in Djibouti
100 %
90
80 76
70 62
56 58
60
50 44
40
27
30
20 15
10 4
0
Family Business Pension and Remittances and Assistance from
and Waged Work assistance from assistance from INGO
government family and friends
Urban Nationals Urban Refugees
In Ethiopia, government and the international community responded to the difficulties
faced by refugee households, nearly one-third of whom received assistance between
the outbreak of the pandemic in March and October 2020. That assistance increased
for a significant share of refugee households in the form of free food, direct cash
transfers, and food or cash for work (by 41, 35 and 26 percentage points, respectively).
Similarly, across the first three rounds of the Uganda survey, humanitarian assistance
continued to be the main source of income for refugees. By December, almost 90
percent of refugees reported that they received assistance from humanitarian
agencies such as UNHCR and WFP, and by March 2021, 26 percent of households
reported receiving assistance at levels that were the same or higher than they received
before the pandemic.
Illustrating just how heterogeneous the availability of government assistance can be,
the four monthly surveys from October 2020 through January 2021 tracked receipt of
Iraq’s large Public Distribution System (PDS) social safety net program for hosts, IDPs,
and returning IDPs. Despite the fact that all of those groups were eligible to receive
26those benefits, returning IDPs were consistently more likely to participate than non-
displaced households, who in turn were consistently more likely to receive PDS
benefits than IDPs. This result held despite volatility in receipt over the four months.
By January 2021, 78 percent of returning IDPs, 66 percent of hosts, and 45 percent of
IDPs received PDS transfers in the previous month. Among IDPs, however, camped-
IDPs received PDS assistance at rates very similar to non-displaced households, but
assistance for non-camped IDPs in Iraq was significantly lower (68 percent in January
for camped versus 38 percent for non-camped).
Figure 9: Share of Returning IDP, Host, and IDP households that received public
distribution system transfers in Iraq
90 %
80 78
70 69
66.9 66.5
60 60.8
56 55.7 53.9
50 49.8
46.8 45.6
42.1
40
30
20
10
0
October November December January
IDP Returning IDP Non-Displaced
However, in Chad, 59 percent of host-country households and 69 percent of refugee
households experienced a decrease in transfers and assistance by early 2021. Half of
refugee households experienced a decline in assistance from NGOs and international
agencies. Moreover, 68 percent of Chadian and 63 percent of refugee households
received transfers and assistance less frequently than before the pandemic.
274.2 Living standards: Health, food security, and education
Both as a direct result of COVID-19-induced shocks, and as a result of coping
mechanisms necessitated by income loss, living standards were anticipated to decline.
Across the eight countries surveyed, health and food security consistently declined
during the pandemic, and often at disproportionate levels for the displaced. However,
while most of these countries also saw precipitous declines in education engagement,
we find an interesting exception in Bangladesh. The declines in living standards are
often mirrored in declines in optimism (Chad) and mental health (Uganda).
4.2.2 Health
The inability to access health care during the pandemic is a public health concern, and
as Figure 1 notes, there was concern that vulnerable households like FDPs would be
underserved. The surveys showed that although trajectories of improving or
deteriorating access to medical care differ from country to country, displaced
households typically faced greater challenges than their hosts when looking to access
medical care in Chad, Djibouti, Iraq, and Kenya—frequently citing financial constraints.
Despite this common cleavage between FDPs and hosts, we see that IDPs and host
households followed similar (negative) trends in health care access in Yemen as did
refugees and hosts in Uganda, and refugees and hosts had converging access to
medicines in Ethiopia.
As with so many dimensions of well-being, the pandemic has been disruptive to
progress in health care access, as illustrated by Figure 8 from Yemen. Despite the
repeated challenges faced by Yemen, just prior to the pandemic non-displaced and
internally displaced households reported identical improvements in gaining access to
health care, as the share with poor access to health care dropped roughly 10
percentage points. However, there is a clear discontinuity at the onset of the pandemic
in March 2020 that completely erased those improvements, followed by a reversal of
fortune in which an increasingly large share of the population had poor access to
health care through July 2020. By December 2020, access to health care for Yemeni
IDP and host households had still not recovered to levels observed more than a year
earlier.
28Figure 10: Share of respondents with poor access to health care in Yemen
50 %
45
40
35
30
25
20
15
10
5
0
Host (pre-pandemic) IDP (pre-pandemic)
Host (post-pandemic) IDP (post-pandemic)
In Uganda, refugees and hosts also followed a similar track. One in five households
were not able to access medical treatment when needed between March and October
2020, but by November that ratio had risen to one in four and by March 2021 it was
one in three.
However, the balance of countries surveyed indicate that FDPs most often have worse
health care access. In Chad, refugee households are less likely to indicate in surveys
that they have needed medical care recently; however as of January 2021, among
host and refugees who do need care, refugees are less likely to receive it. Seventy
percent of refugee households report needing medical care during the pandemic
compared to 83 percent of the host country population; however, 35 percent of refugee
households were not able to access health care when needed, compared to 22
percent of Chadian households. Similarly, in Djibouti, far fewer urban refugees were
able to access health care than urban hosts (66 versus 90 percent, respectively)
between December 2020 and February 2021.
29You can also read