Annual Air Monitoring Network Plan for Minnesota 2019 - Air quality July 2018
←
→
Page content transcription
If your browser does not render page correctly, please read the page content below
Air quality

July 2018

Annual Air Monitoring Network Plan
for Minnesota 2019
Where and how the MPCA monitors ambient air for pollutants that affect human
health
Federal Regulation
40 CFR § 58.10 Annual monitoring network plan and periodic network assessment.
(a)(1) Beginning July 1, 2007, the state, or where applicable local, agency shall submit to the Regional
Administrator an annual monitoring network plan which shall provide for the documentation of the
establishment and maintenance of an air quality surveillance system that consists of a network of SLAMS
monitoring stations that can include FRM, FEM, and ARM monitors that are part of SLAMS, NCore, CSN,
PAMS, and SPM stations. The plan shall include a statement of whether the operation of each monitor
meets the requirements of appendices A, B, C, D, and E of this part, where applicable. The Regional
Administrator may require additional information in support of this statement. The annual monitoring
network plan must be made available for public inspection and comment for at least 30 days prior to
submission to the EPA and the submitted plan shall include and address, as appropriate, any received
comments.

Authors                                                 Editing and graphic design
Kurt Anderson                                           Cover photo courtesy of MPCA
Kristie Ellickson
Dennis Fenlon
Kellie Gavin
Steve Irwin
Margaret McCourtney
Cassie McMahon                                          The MPCA is reducing printing and mailing costs
Kari Palmer                                             by using the Internet to distribute reports and
Rick Strassman                                          information to a wider audience. Visit our
Monika Vadali                                           website for more information.
                                                        MPCA reports are printed on 100% post-
Contributors/acknowledgements                           consumer recycled content paper
Shawn Nelson                                            manufactured without chlorine or chlorine
Christine Steinwand                                     derivatives.

Minnesota Pollution Control Agency
520 Lafayette Road North | Saint Paul, MN 55155-4194 |
651-296-6300 | 800-657-3864 | Or use your preferred relay service. | Info.pca@state.mn.us
This report is available in alternative formats upon request, and online at www.pca.state.mn.us.

Document number: aq10-16a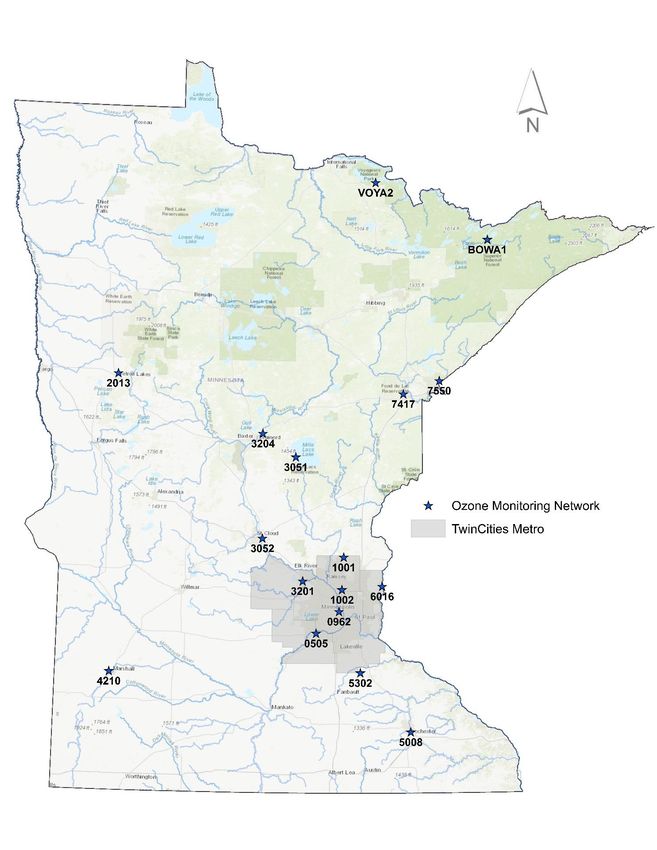
Table of contents
List of tables ............................................................................................................ iii
List of figures ........................................................................................................... iv
Acronyms, abbreviations, and definitions ................................................................. v
Introduction.............................................................................................................. 1
Network overview .................................................................................................... 1
   Minimum monitoring requirements ................................................................................................................ 1
   Monitoring objectives ...................................................................................................................................... 2
   Site selection .................................................................................................................................................... 2
   Network scales ................................................................................................................................................. 2
   Regional network assessment .......................................................................................................................... 3
Quality Assurance/Quality Control (QA/QC) Program ............................................... 8
Types of networks .................................................................................................... 9
   State and Local Air Monitoring Stations (SLAMS) ............................................................................................ 9
   Air Quality Index (AQI) ...................................................................................................................................... 9
   Chemical Speciation Network (CSN)............................................................................................................... 13
   Interagency Monitoring of Protected Visual Environments (IMPROVE) ........................................................ 13
   National Atmospheric Deposition Program (NADP) ....................................................................................... 14
   Near-road air quality monitoring ................................................................................................................... 15
   National Core Monitoring (NCore) ................................................................................................................. 16
   Industrial networks......................................................................................................................................... 17
   Photochemical Assessment Monitoring Stations (PAMS) .............................................................................. 17
   Clean Air Status and Trends Network (CASTNET)........................................................................................... 18
Parameter networks ............................................................................................... 19
   Criteria pollutants ........................................................................................................................................... 23
      Particulate matter ................................................................................................................................................24
           Ultrafine Particulate Matter (UFP) .................................................................................................................................... 24
           Fine particulate matter (PM2.5) ......................................................................................................................................... 24
           Coarse particulate matter (PM10-2.5) .................................................................................................................................. 28
           PM10 ................................................................................................................................................................................. 29
           Total suspended particulate matter (TSP) ......................................................................................................................... 30
      Lead (Pb) ..............................................................................................................................................................33
      Ozone (O3) ............................................................................................................................................................34
      Oxides of nitrogen (NOX) ......................................................................................................................................36
      Sulfur dioxide (SO2) ..............................................................................................................................................38
      Carbon monoxide (CO) .........................................................................................................................................40
   Air toxics ......................................................................................................................................................... 42
      Air Toxics Data Explorer .......................................................................................................................................42
      Metals ..................................................................................................................................................................43

2019 Annual Air Monitoring Network Plan • July 2018                                                                                            Minnesota Pollution Control Agency
                                                                                                i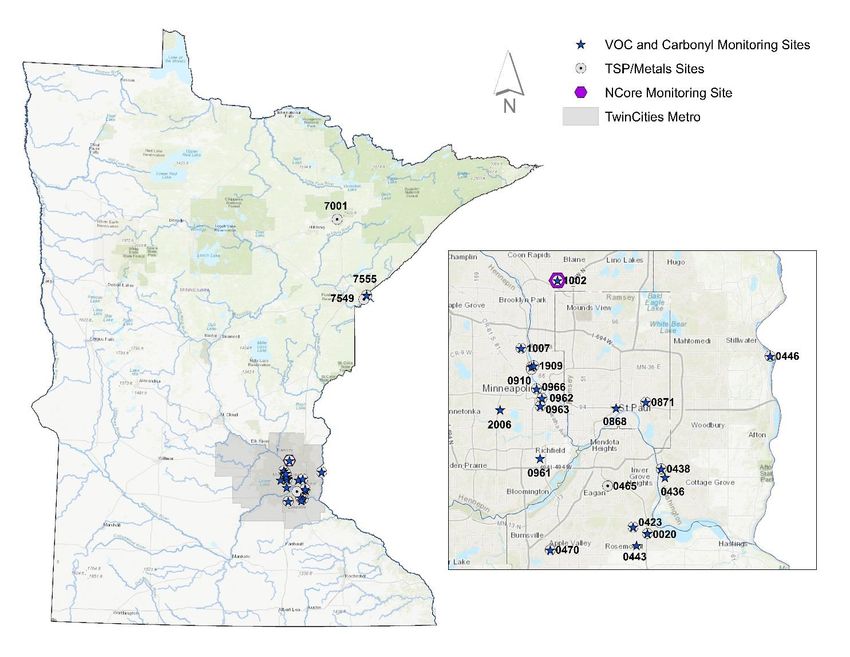
Volatile organic compounds (VOCs) and carbonyls...............................................................................................44
   Atmospheric deposition ................................................................................................................................. 46
      Acid deposition (NTN) ..........................................................................................................................................46
      Mercury (Hg) deposition (MDN) ...........................................................................................................................46
   Hydrogen sulfide (H2S).................................................................................................................................... 47
   Total reduced sulfur (TRS) .............................................................................................................................. 47
   Meteorological data ....................................................................................................................................... 48
   Special studies ................................................................................................................................................ 48
      Black carbon.........................................................................................................................................................48
      Community air monitoring project .......................................................................................................................48
      Silica sand mining and facility-related monitoring ................................................................................................49
      Polycyclic aromatic hydrocarbons (PAHs) .............................................................................................................50
      Assessing Urban Air Quality Project .....................................................................................................................50
      Visibility ...............................................................................................................................................................51
Network changes .................................................................................................... 53
   2018 Network changes ................................................................................................................................... 54
   2019 Proposed changes.................................................................................................................................. 55
Public inspection period.......................................................................................... 56

2019 Annual Air Monitoring Network Plan • July 2018                                                                               Minnesota Pollution Control Agency
                                                                                       ii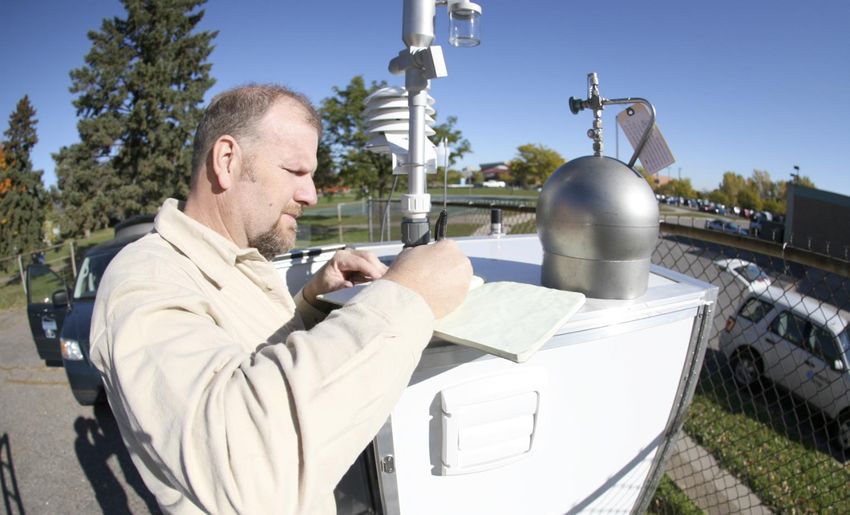
List of tables
Table 1: Monitoring objectives and siting scales ....................................................................................................................3
Table 2: Site information – Greater Minnesota sites active in 2018 ......................................................................................4
Table 3: Site information – Twin Cities metropolitan area sites active in 2018 .....................................................................6
Table 4. Highest observed AQIs in Minnesota, 2017. ...........................................................................................................12
Table 5: Near-road parameters ............................................................................................................................................15
Table 6: NCore monitoring network site parameters ...........................................................................................................16
Table 7: 2018 Site parameters – Greater Minnesota ...........................................................................................................20
Table 8: 2018 Site parameters – Twin Cities metropolitan area ..........................................................................................21
Table 9: Methods and equipment used for parameter networks in Minnesota ..................................................................22
Table 10: EPA National Ambient Air Quality Standards (NAAQS), as of April 2018 ..............................................................23
Table 11: Minnesota Ambient Air Quality Standards for TSP ...............................................................................................30
Table 12: 2018 Metals monitored by MPCA .........................................................................................................................44
Table 13: 2018 Carbonyls monitored by MPCA ....................................................................................................................44
Table 14: 2018 VOCs monitored by MPCA ...........................................................................................................................45
Table 15: Community air monitoring project sites and dates of operation .........................................................................49
Table 16: Changes proposed in the 2018 Annual Network Plan ..........................................................................................54
Table 17. Changes actually made to the network in 2018 ...................................................................................................54
Table 18: 2019 Proposed Changes........................................................................................................................................55

2019 Annual Air Monitoring Network Plan • July 2018                                                                           Minnesota Pollution Control Agency
                                                                                     iii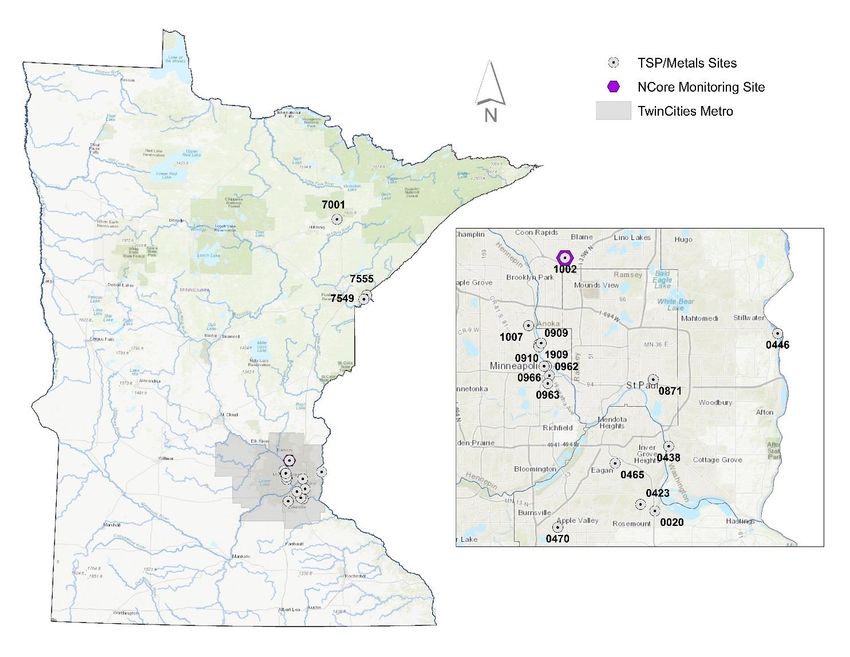
List of figures
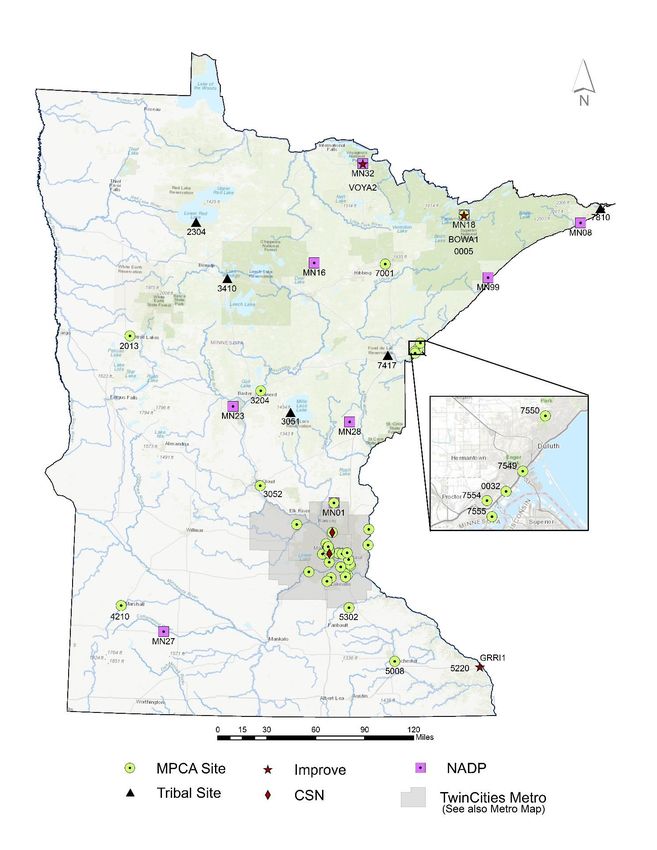
Figure 1: 2018 Air quality monitoring sites in Greater Minnesota .........................................................................................5
Figure 2: 2018 Air quality monitoring sites in the Twin Cities metropolitan area ..................................................................7
Figure 3: 2018 AQI monitoring network in Minnesota. Fine particles (PM2.5) and ozone are the pollutants that most
strongly influence daily AQI values. ......................................................................................................................................10
Figure 4. AQI categories........................................................................................................................................................10
Figure 5: 2017 daily AQI category counts in Minnesota cities. .............................................................................................11
Figure 6. Annual statewide AQI category counts. ................................................................................................................11
Figure 7. Number of yellow AQI days with smoke ................................................................................................................12
Figure 8. Number of air quality alerts issued in Minnesota counties, 2017. ........................................................................13
Figure 9: 2018 PM2.5 monitoring sites in Minnesota ............................................................................................................25
Figure 10: Annual PM2.5 concentrations compared to the NAAQS, 2015-2017 ...................................................................26
Figure 11: 24-hour PM2.5 concentrations compared to the NAAQS, 2015-2017 ..................................................................26
Figure 12: PM2.5 daily average concentrations at several Minnesota sites, March 2017 .....................................................27
Figure 13: PM2.5 average hourly concentrations at several Minnesota sites, weekdays, March 2017 ................................28
Figure 14: 2018 PM10 monitoring sites in Minnesota ...........................................................................................................29
Figure 15: 24-hour PM10 concentrations compared to the NAAQS, 2015-2017...................................................................30
Figure 16: 2018 TSP monitoring sites in Minnesota .............................................................................................................31
Figure 17: Annual average TSP concentrations compared to the secondary MAAQS, 2017 ................................................32
Figure 18: 24-hour (daily) TSP concentrations compared to the primary and secondary MAAQS, 2017 ............................32
Figure 19: 2018 Lead monitoring sites in Minnesota ...........................................................................................................33
Figure 20: Lead concentrations compared to the NAAQS, 2015-2017. ................................................................................34
Figure 21: 2018 Ozone monitoring sites in Minnesota .........................................................................................................35
Figure 22: 8-hour average ozone concentrations compared to the NAAQS, 2015-2017 .....................................................36
Figure 23: 2018 NOx monitoring sites in the Twin Cities metropolitan area ........................................................................37
Figure 24: Annual average NO2 concentrations compared to the NAAQS, 2017 .................................................................37
Figure 25: 1-hour NO2 concentrations compared to the NAAQS, 2015-2017 ......................................................................38
Figure 26: 2018 SO2 monitoring sites in the Twin Cities metropolitan area.........................................................................39
Figure 27: 1-hour SO2 concentrations compared to the NAAQS, 2015-2017 .......................................................................39
Figure 28: 2018 CO monitoring sites in the Twin Cities metropolitan area..........................................................................40
Figure 29: 8-hour average CO concentrations compared to the NAAQS, 2017 ...................................................................41
Figure 30: 1-hour average CO concentrations compared to the NAAQS, 2017 ...................................................................41
Figure 31: Air Toxics Data Explorer for formaldehyde, data year 2016 ................................................................................42
Figure 32: 2018 Air toxics monitoring sites in Minnesota ....................................................................................................43
Figure 33: Atmospheric deposition sites in Minnesota ........................................................................................................46
Figure 34: Locations of community air monitoring project sites in the Twin Cities metropolitan area ..............................48
Figure 35: PAH monitoring sites near the Twin Cities ..........................................................................................................50
Figure 36: Class I areas in Minnesota impacted by regional haze ........................................................................................51
Figure 37: Reasonable progress visibility goal for the Class I Boundary Waters Site, 2004-2015 ........................................53
Figure 38: Reasonable progress visibility goal for the Class I Voyageurs Site, 2004-2015 ...................................................53
2019 Annual Air Monitoring Network Plan • July 2018 Minnesota Pollution Control Agency
iv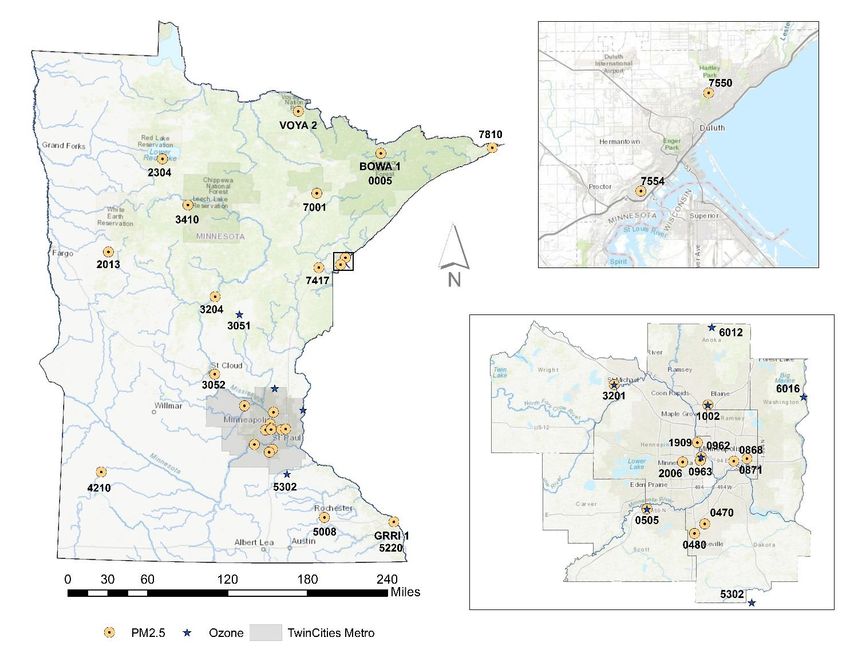
Acronyms, abbreviations, and definitions
AIRNow – air quality forecasting program
Air Toxics – suite of parameters that includes VOCs, carbonyls, and metals
AQI – Air Quality Index
AQS – Air Quality System: EPA's repository of ambient air quality data
BAM – Beta Attenuation Monitor
CAA – Clean Air Act
CAS – Chemical Abstracts Service
CASTNET – Clean Air Status and Trends Network
CBSA – Core Base Statistical Area
CFR – Code of Federal Regulations
Class I area – remote area with pristine air quality
CO – carbon monoxide
Criteria Pollutants – the six pollutants regulated by the 1970 Clean Air Act (particulate matter, ozone,
nitrogen dioxide, sulfur dioxide, carbon monoxide, and lead)
CSN – Chemical Speciation Network
DNR – Department of Natural Resources
EPA – U.S. Environmental Protection Agency
FEM – Federal Equivalent Method
FRM – Federal Reference Method
GC/MS – Gas Chromatography/Mass Spectrometry
H2S – hydrogen sulfide
HAP – Hazardous Air Pollutant
Hg – mercury
HPLC – High Pressure Liquid Chromatography
ICAP-AES – Inductively Coupled Plasma Atomic Emission Spectrometry (a technique used for metals analysis)
IMPROVE – Interagency Monitoring of Protected Visual Environments
LADCO – Lake Michigan Air Directors Consortium
MAAQS – Minnesota Ambient Air Quality Standard
MDH – Minnesota Department of Health
MDN – Mercury Deposition Network
MOA – Memorandum of Agreement
MPCA – Minnesota Pollution Control Agency
MSA – Metropolitan Statistical Area
NAAQS – National Ambient Air Quality Standard
NADP – National Atmospheric Deposition Program
NCore – National Core Monitoring Network
NDDN – National Dry Deposition Network
NO – nitric oxide
NO2 – nitrogen dioxide
NOx – oxides of nitrogen
NOy – total reactive nitrogen
NTN – National Trends Network
O3 – ozone
PAH – Polycyclic Aromatic Hydrocarbon
PAMS – Photochemical Assessment Monitoring Stations
Pb – lead
PM4 – particulate matter less than 4 microns in diameter
PM2.5 – particulate matter less than 2.5 microns in diameter (fine particulate matter)

2019 Annual Air Monitoring Network Plan • July 2018                          Minnesota Pollution Control Agency
                                                      v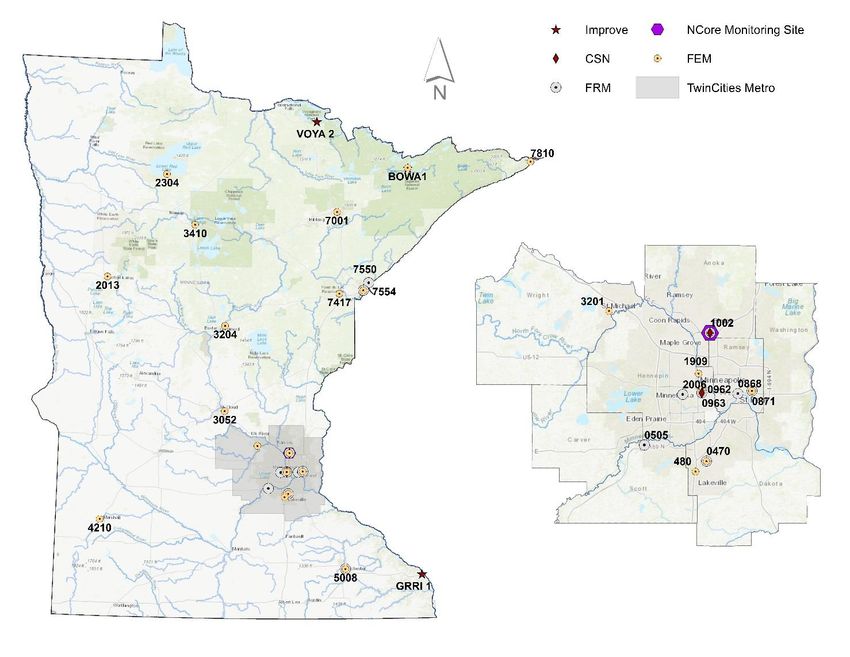
PM10-2.5 – particulate matter between 2.5 and 10 microns in diameter (coarse particulate matter)
PM10 – particulate matter less than 10 microns in diameter
ppb – parts per billion
ppm – parts per million
PQAO – Primary Quality Assurance Organization
QAPP – Quality Assurance Project Plans
QA/QC – Quality Assurance/Quality Control
QMP – Quality Management Plan
SIP – State Implementation Plan
SLAMS – State and Local Air Monitoring Stations
SO2 – sulfur dioxide
SPM – special purpose monitoring
TO-11A – EPA method for analyzing carbonyls utilizing HPLC
TO-15 – EPA method for analyzing VOCs utilizing GC/MS
TPY – tons per year
TRS – total reduced sulfur
TSP – total suspended particulate matter
U of M – University of Minnesota
UFP – ultrafine particles (particulate matter less than 0.1 microns in diameter)
USDA – United States Department of Agriculture
USDOI – United States Department of the Interior
USG – unhealthy for sensitive groups
VOC – volatile organic compound

2019 Annual Air Monitoring Network Plan • July 2018                            Minnesota Pollution Control Agency
                                                      vi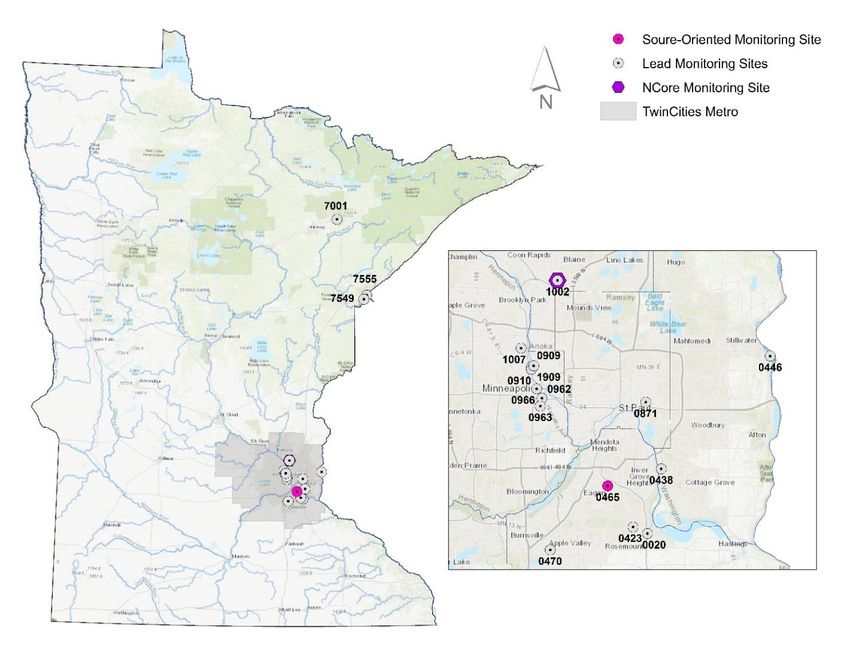
Introduction
The Minnesota Air Monitoring Network Plan is an annual report required under the Code of Federal
Regulations [40 CFR § 58.10(a)(1)]. The purpose of this plan is to provide evidence that the Minnesota
Pollution Control Agency (MPCA) air monitoring network meets current federal monitoring requirements, to
detail any changes proposed for the 18 months following publication, to provide specific information on
each of the MPCA's existing and proposed monitoring sites, and to provide the opportunity for the public to
comment on air monitoring activities conducted by the MPCA. The plan also includes information on known
industrial monitoring activities and special air monitoring projects occurring in the state.
The MPCA monitors outdoor air quality throughout Minnesota. The data collected by the MPCA helps
determine major sources of ambient air pollution in Minnesota, and whether we are protecting the public
from its harmful health effects. Data are also used to address ways to reduce pollution levels and track
concentrations of pollutants over time.
The MPCA's air quality data are used to determine compliance with National Ambient Air Quality Standards
(NAAQS) and Minnesota Ambient Air Quality Standards (MAAQS). In 1970, the Clean Air Act (CAA)
established NAAQS for six pollutants known to cause harm to human health and the environment. The CAA
requires the MPCA to monitor these pollutants, called criteria pollutants, and report the findings to the U.S.
Environmental Protection Agency (EPA). The criteria pollutants are particulate matter, lead, ozone, nitrogen
dioxide, sulfur dioxide, and carbon monoxide. The MPCA monitors criteria pollutants to comply with the
CAA.
The MPCA also monitors Minnesota's air for other pollutants, called air toxics. Air toxics include a wide
range of chemicals that are known or suspected to affect human health. These pollutants do not have
federal standards; however, levels found in Minnesota are compared to health benchmarks established by
the Minnesota Department of Health (MDH), the EPA, and the State of California.
Network overview
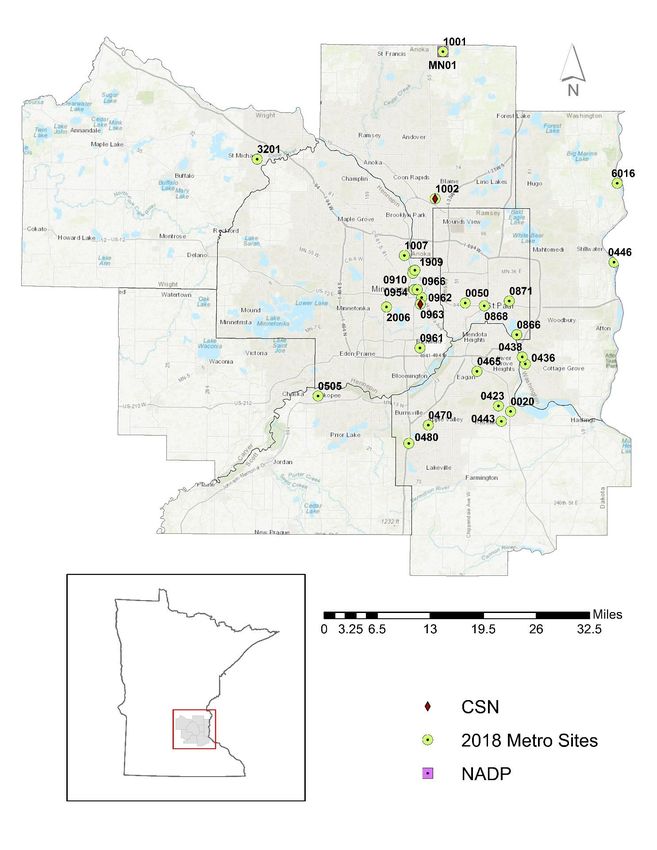
The MPCA monitors ambient air quality at 54 sites throughout Minnesota (Figure 1). This includes
monitoring at five tribal sites, three Interagency Monitoring of Protected Visual Environments (IMPROVE)
sites, two Chemical Speciation Network (CSN) sites, and nine National Atmospheric Deposition Program
(NADP) sites. In addition to these sites, there is a network of industrial air quality monitors that must
conform to EPA standards but are owned and operated by the specific industrial facility.
Site location is partly dependent upon population density; therefore, the majority of sites are in the Twin
Cities metropolitan area. For the purposes of this report, any sites in the following eight counties are
considered to be in the Twin Cities metropolitan area: Hennepin, Ramsey, Wright, Anoka, Washington,
Dakota, Scott, and Carver. The area of the state that lies outside the Twin Cities metropolitan area is
commonly referred to as Greater Minnesota.
The maps on the following pages show sites labeled according to their MPCA, NADP, or IMPROVE site
identification numbers, throughout Greater Minnesota (Figure 1 and Table 2) and in the Twin Cities
metropolitan area (Figure 2 and Table 3).
Throughout the report, sites are referred to using the site name or the city where the site is located and the
MPCA, NADP, or IMPROVE site identification number.
Minimum monitoring requirements
The EPA establishes the minimum number of monitoring sites required to meet national ambient monitoring
objectives. The minimum monitoring requirements are codified in Appendix D of 40 CFR Part 58. Minimum
2019 Annual Air Monitoring Network Plan • July 2018 Minnesota Pollution Control Agency
1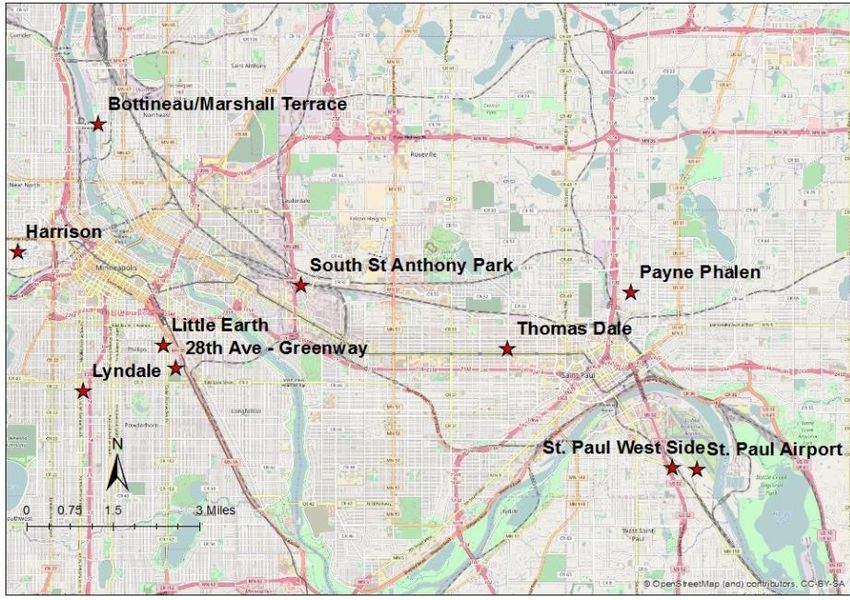
monitoring requirements are specific to each individual pollutant (e.g. ozone, PM2.5) or are objective-based
monitoring networks (e.g. NCore, PAMs). Minimum monitoring requirements typically rely on population
and/or air pollution emissions data. Minnesota currently meets all minimum air monitoring requirements.
Appendix B provides a detailed description of these requirements.
Monitoring objectives
When designing an air monitoring network, one of the following six objectives should be considered:
1. Highest concentrations expected to occur in the area covered by the network
2. Representative concentrations in areas of high population density
3. Impact of specific sources on ambient pollutant concentrations
4. General background concentration levels
5. Extent of regional transport among populated areas and in support of secondary standards
6. Welfare-related impacts in the more rural and remote areas
Site selection
The selection of air monitoring sites is usually based on at least one of the following objectives:
Determine representative concentrations and exposure in areas of high population density
Determine the highest concentrations of pollutants in an area based on topography and/or wind
patterns
Judge compliance with and/or progress made towards meeting the NAAQS and MAAQS
Track pollution trends
Determine the highest concentrations of pollutants within the state based on the known
atmospheric chemistry of specific pollutants and wind patterns
Determine the extent of regional pollutant transport to and from populated areas
Determine to what extent major sources impact ambient pollution levels
Validate control strategies designed to prevent or alleviate air pollution
Provide a database for research and evaluation of air pollution effects
Determine general background concentration levels
The exact location of a site is most often dependent on the logistics of the area chosen for monitoring, such
as site access, security, and power availability.
Network scales
The EPA developed a system which specifies an exclusive area, or spatial scale, that an air monitor
represents. The goal in establishing air monitoring sites is to correctly match the spatial scale that is most
appropriate for the monitoring objective of the site (Table 1). The representative measurement scales are:
Micro Scale (10-100 m) – defines the concentrations in air volumes associated with area dimensions
ranging from several meters up to about 100 meters. Measurements on the micro scale typically
include concentrations in street canyons, intersections, and in areas next to major emission sources.
Middle Scale (100-1,000 m) – defines the concentration typical of areas up to several city blocks in
size, with dimensions ranging from about 100 to 1,000 meters.
2019 Annual Air Monitoring Network Plan • July 2018 Minnesota Pollution Control Agency
2 Neighborhood Scale (1-4 km) – defines concentrations within some extended area of the city that
has relatively uniform land use with dimensions in the one to four kilometers range. Generally,
these stations represent areas with moderate to high population densities.
Urban Scale (4-50 km) – defines the overall, citywide conditions with dimensions on the order of
four to 50 kilometers. This scale represents conditions over an entire metropolitan area, and is
useful in assessing city-wide trends in air quality.
Regional Scale/Background (50-1,000 km) – usually represents a rural area of reasonably
homogeneous geography and extends from tens to hundreds of kilometers.
National/Global – concentrations characterizing the nation and the globe as a whole.
Table 1: Monitoring objectives and siting scales
Monitoring Objective Appropriate Siting Scales
Highest Concentration Micro, Middle, Neighborhood (sometimes Urban)
Population Exposure Neighborhood, Urban
Source Impact Micro, Middle, Neighborhood
General/Background Urban, Regional (sometimes Neighborhood)
Regional Transport Urban, Regional
Welfare – Related Urban, Regional
Regional network assessment
In addition to this air monitoring network plan, the EPA requires states to complete a network assessment
every five years. Under the direction of the Lake Michigan Air Directors Consortium (LADCO), Minnesota
collaborated with other states in our region to develop the first network assessment, which was completed
in 2010, http://www.ladco.org/reports/general/Regional_Network_Assessment/index.html. The network
assessment provides a detailed evaluation of the regional air monitoring network, including network history,
a re-evaluation of the types of pollutants monitored, and an evaluation of the network's objectives and
costs. It also includes spatial analyses of ambient air monitoring data and a reconsideration of monitor
placement based on changes in land use and population.
For the 2015 Network Assessment, the MPCA again collaborated with other EPA Region 5 states. The results
of the 2015 Regional Network Assessment can be found on LADCO’s website, at
http://www.ladco.org/reports/general/Regional_Network_Assessment/RNA15.html.
Key findings of the 2015 Network Assessment:
Criteria pollutant monitoring networks are adequate to meet EPA’s minimum monitoring criteria.
Monitoring equipment is aging and will require replacement in the coming years. The PM2.5 filter-
based monitoring network in Minnesota was replaced in 2008, but is no longer being supported
by vendors. Inability to access parts for instrument repairs may require instrument replacement
sooner than anticipated.
Disinvestment or relocation of existing PM2.5 and ozone monitoring sites is very difficult due to
stringent EPA criteria for shutdown.
Using these criteria, amongst all ozone and PM2.5 monitors in the state, only three PM2.5 monitors
are eligible for disinvestment. These include monitors in Duluth, Virginia, and St. Cloud. While
these monitors are eligible for disinvestment, we feel these monitors are valuable for spatial and
temporal coverage and we do not intend to shut down these monitors at this time.
2019 Annual Air Monitoring Network Plan • July 2018 Minnesota Pollution Control Agency
3Table 2: Site information – Greater Minnesota sites active in 2018
Year
Site ID City Site name Address/Location LAT LONG started
FWS Wetland
Management
27-005-2013 Detroit Lakes District 26624 N Tower Rd 46.8499 -95.8463 2004
27-007-2304*** Red Lake Red Lake Nation 24760 Hospital Drive 47.8782 -95.0292 2014
27-017-7417*** Cloquet Fond du Lac Band 28 University Rd 46.7137 -92.5117 2015
Leech Lake Nation:
27-021-3410*** Cass Lake Cass Lake 200 Sailstar Dr 47.38443 34.60166 2018
27-031-7810*** Grand Portage Grand Portage Band 27 Store Rd 47.9701 -89.6910 2005
Brainerd Lakes
27-035-3204 Brainerd Regional Airport 16384 Airport Rd 46.3921 -94.1444 2004
27-049-5302 Stanton Stanton Air Field 1235 Highway 17 44.4719 -93.0126 2003
27-075-0005
MN18*
BOWA1** Ely Fernberg Fernberg Rd 47.9466 -91.4956 1977
Southwest
Minnesota Regional
27-083-4210 Marshall Airport West Highway 19 44.4559 -95.8363 2004
27-095-3051*** Mille Lacs Mille Lacs Band HCR 67 Box 194 46.2052 -93.7594 1997
27-109-5008 Rochester Ben Franklin School 1801 9th Ave SE 43.9949 -92.4504 1997
27-137-0032 Duluth Oneota Street 37th Ave W & Oneota St 46.7516 -92.1413 1985
27-137-7001 Virginia Virginia City Hall 327 First St S 47.5212 -92.5393 1968
27-137-7549 Duluth Michigan Street 1532 W Michigan St 46.7694 -92.1194 1994
27-137-7550 Duluth U of M - Duluth 1202 East University Circle 46.8182 -92.0894 1998
Laura MacArthur
27-137-7554 Duluth School 720 N Central Ave 46.7437 -92.1660 2012
27-137-7555 Duluth Waseca Road Waseca Industrial Rd 46.7306 -92.1634 2001
27-145-3052 Saint Cloud Talahi School 1321 University Ave SE 45.5497 -94.1335 1998
GRRI1** Winona Great River Bluffs 43605 Kipp Dr 43.9373 -91.4052 2002
MN08* Hovland Hovland (open field) 47.8472 -89.9625 1996
Marcell Marcell Experimental
MN16* Balsam Lake Experimental Forest Forest 47.5311 -93.4686 1978
MN23* Pillager Camp Ripley (open field) 46.2494 -94.4972 1983
U of M SW Agricultural
Research and Outreach
MN27* Lamberton Lamberton Center 44.2369 -95.3010 1979
Audubon Center of the
MN28* Sandstone Grindstone Lake North Woods 46.1208 -93.0042 1996
MN32* Voyageurs National Park -
VOYA2** International Falls Voyageurs Sullivan Bay 48.4128 -92.8292 2000
MN99* Finland Wolf Ridge 6282 Cranberry Rd 47.3875 -91.1958 1996
*NADP Site ID **IMPROVE Site ID ***Tribal Site
2019 Annual Air Monitoring Network Plan • July 2018 Minnesota Pollution Control Agency
4Figure 1: 2018 Air quality monitoring sites in Greater Minnesota
2019 Annual Air Monitoring Network Plan • July 2018 Minnesota Pollution Control Agency
5Table 3: Site information – Twin Cities metropolitan area sites active in 2018
Year
Site ID City Site name Address LAT LONG started
27-003-1001
MN01* East Bethel U of M - Cedar Creek 2660 Fawn Lake Drive NE 45.4018 -93.2031 1979
Anoka County
27-003-1002 Blaine Airport 2289 Co Rd J 45.1407 -93.2220 1979
Flint Hills Refinery
27-037-0020 Rosemount 420 12821 Pine Bend Tr 44.7632 -93.0325 1972
Flint Hills Refinery
27-037-0423 Rosemount 423 2142 120th St E 44.7730 -93.0627 1990
Flint Hills Refinery
27-037-0443 Rosemount 443 14035 Blaine Ave E 44.7457 -93.0554 2008
27-037-0465 Eagan Gopher Resources Hwy 149 & Yankee Doodle Rd 44.8343 -93.1163 2006
27-037-0470 Apple Valley Westview School 225 Garden View Dr 44.7387 -93.2373 2000
27-037-0480 Lakeville Near Road I-35 16750 Kenyon Ave 44.7061 -93.2858 2015
27-053-0909 Minneapolis Lowry Ave 3104 N Pacific St 45.0121 -93.2767 2013
27-053-0910 Minneapolis Pacific Street 2710 N Pacific St 45.0083 -93.2770 2015
27-053-0954 Minneapolis Arts Center 528 Hennepin Ave 44.9790 -93.2737 1989
Richfield
27-053-0961 Richfield Intermediate School 7020 12th Ave S 44.8756 -93.2588 1999
Near Road
27-053-0962 Minneapolis I-35/I-94 1444 18th St E 44.9652 -93.2548 2013
27-053-0963 Minneapolis Andersen School 2727 10th Ave S 44.9535 -93.2583 2001
27-053-0966 Minneapolis City of Lakes Building 309 2nd Ave S 44.9793 -93.2611 2002
27-053-1007 Minneapolis Humboldt Avenue 4646 N Humboldt Ave 45.0397 -93.2987 1966
Bottineau/Marshall
27-053-1909 Minneapolis Terrace 2522 Marshall St NE 45.0136 -93.2721 2017
St. Louis Park City
27-053-2006 St Louis Park Hall 5005 Minnetonka Blvd 44.9481 -93.3429 1972
27-123-0050 St. Paul Lexington Avenue 1088 W University Ave 44.9556 -93.1459 1987
27-123-0866 St. Paul Red Rock Road 1450 Red Rock Rd 44.8994 -93.0171 1997
Ramsey Health
27-123-0868 St. Paul Center 555 Cedar St 44.9507 -93.0985 1998
27-123-0871 St. Paul Harding High School 1540 East 6th St 44.9593 -93.0359 1998
27-139-0505 Shakopee B.F. Pearson School 917 Dakota St 44.7894 -93.5125 2000
St. Paul Park
27-163-0436 St. Paul Park Refinery 436 649 5th St 44.8473 -92.9956 1989
St. Paul Park
27-163-0438 Newport Refinery 438 4th Ave & 2nd St 44.8599 -93.0035 1995
27-163-0446 Bayport Point Road 22 Point Rd 45.0280 -92.7742 2007
Marine on St. St. Croix Watershed
27-163-6016 Croix Research Station St. Croix Trail N 45.1680 -92.7651 2012
St. Michael
27-171-3201 St. Michael Elementary School 101 Central Ave W 45.2092 -93.6690 2003
*NADP Site ID
2019 Annual Air Monitoring Network Plan • July 2018 Minnesota Pollution Control Agency
6Figure 2: 2018 Air quality monitoring sites in the Twin Cities metropolitan area
2019 Annual Air Monitoring Network Plan • July 2018 Minnesota Pollution Control Agency
7Quality Assurance/Quality Control (QA/QC) Program
The purpose of the QA/QC program is to assure the quality of data obtained from the MPCA air monitoring
networks. The MPCA meets or exceeds the QA requirements defined in 40 CFR Part 58 and all applicable
appendices.
The QA/QC program includes, but is not limited to, the following activities:
Instrument performance audits
Monitor siting evaluations
Precision and span checks
Bias determinations
Flow rate audits
Leak checks
Data validation
For independent quality assurance activities, the MPCA participates in the National Performance Audit
Program and the Performance Evaluation Program for criteria pollutant monitoring. Additional inter-
laboratory comparisons are performed periodically for air toxics monitoring.
As the Primary Quality Assurance Organization (PQAO) for ambient air monitoring activities in Minnesota,
the MPCA operates under an EPA-approved Quality Management Plan (QMP) and utilizes Quality Assurance
Project Plans (QAPP) for each statewide monitoring network. The primary purpose of the QAPP is to provide
an overview of the project, describe the need for the measurements, and define QA/QC activities that apply
to the project. All other ambient air monitoring initiatives including state, tribal, and industrial projects must
have an MPCA-approved monitoring plan for each specific project.
As part of the instrument performance audit, each monitoring site is assessed to ensure that all applicable
EPA siting requirements are fully met. This also includes a safety inspection to assure a safe work
environment for site operators and staff.
To meet the minimum monitoring requirements for the Minneapolis-St. Paul MN-WI Metropolitan Statistical
Area (MSA) the MPCA and Wisconsin Department of Natural Resources (DNR) Bureau of Air Management
entered into a Memorandum of Agreement (MOA) in January 2011. The MOA formalized the collective
agreement between the two States per requirements of 40 CFR Part 58 Appendix D, Section 2(e). The MOA
is due for renewal in 2018 and, while the MPCA reconfirmed with the Wisconsin DNR that all monitoring
requirements are currently being met, MPCA is working with Wisconsin DNR to update the agreement and
complete the renewal.
2019 Annual Air Monitoring Network Plan • July 2018 Minnesota Pollution Control Agency
8Types of networks
Air monitoring networks are designed to satisfy a variety of purposes, including monitoring compliance with
the NAAQS, public reporting of the Air Quality Index (AQI), assessing population exposure and risk from air
toxics, determining pollution trends, monitoring specific emissions sources, investigating background
conditions, and evaluating computer models. Below are descriptions of the existing monitoring networks in
Minnesota.
State and Local Air Monitoring Stations (SLAMS)
The SLAMS network consists of about 3,500 monitoring sites across the United States. Size and distribution
of the sites are largely determined by the needs of state and local air pollution control agencies to meet
their respective State Implementation Plan (SIP) requirements and monitoring objectives. Most monitoring
sites in Minnesota are part of the SLAMS network. Sites in the SLAMS network may also belong to other
monitoring networks, as described below.
Air Quality Index (AQI)
The AQI was developed by the EPA to provide a simple, uniform way to report daily air quality conditions.
Minnesota AQI numbers are determined by measurements of six pollutants: fine particles (PM2.5),
particulate matter (PM10), ground-level ozone (O3), sulfur dioxide (SO2), nitrogen dioxide (NO2), and carbon
monoxide (CO). The pollutants that most commonly influence the daily AQI, however, are fine particles and
ozone. While official AQI values are determined on a daily basis, EPA’s NowCast AQI values are updated
hourly, and posted on the MPCA’s website at https://www.pca.state.mn.us/air/current-air-quality, to help
inform the public of current air quality conditions and trends. There are currently 49 monitors located at 29
sites in the full AQI network in Minnesota; however, PM2.5 and ground-level ozone and contribute the most
to air quality conditions in Minnesota (Figure 3).
2019 Annual Air Monitoring Network Plan • July 2018 Minnesota Pollution Control Agency
9Figure 3: 2018 AQI monitoring network in Minnesota. Fine particles (PM2.5) and ozone are the pollutants that most
strongly influence daily AQI values.
Figure 4. AQI categories
0
Good
50
Moderate
100 Unhealthy for
Sensitive Groups
150
Unhealthy
200
Very Unhealthy
300
The AQI categories developed by the EPA are green (good), yellow (moderate), orange (unhealthy for
sensitive groups or USG), red (unhealthy), and purple (very unhealthy) (Figure 4). In the past, MPCA offered
AQI forecasts of these categories for only the Twin Cities and Rochester. Starting June 1, 2017, the MPCA
began issuing daily forecasts for the majority of its AQI monitor locations through MPCA’s AQI website, the
Minnesota Air mobile app, Twitter, and to individuals who have signed up to receive e-mailed forecasts. If it
is suspected through forecasting or monitoring that the daily AQI will be over 100, the MPCA will issue an Air
Quality Alert to be disseminated by the National Weather Service, GovDelivery, the Minnesota Air mobile
app, Twitter, the media, and to individuals who have signed up to receive e-mail alerts. Forecasts and alerts
allow the public to be proactive about protecting their health and reducing their own contributions to
emissions and exposure to air pollution. At no cost, the public can download the Minnesota Air mobile app
and sign up for emailed forecasts and alerts from MPCA’s AQI website
(https://www.pca.state.mn.us/air/current-air-quality).
In 2017, across all monitored locations in Minnesota, the majority of days were categorized as green for air
quality (Figure 5). Ely experienced the highest number of green air quality days (352) compared to the Twin
Cities metropolitan area, which experienced the lowest number of green air quality days (265). The lower
number of green AQI days in the Twin Cities is expected, since the AQI is based on pollutants that are more
abundant in and around urban areas.
2019 Annual Air Monitoring Network Plan • July 2018 Minnesota Pollution Control Agency
10Figure 5: 2017 daily AQI category counts in Minnesota cities.
Count of Max of AQI
Grand Portage, Red Lake Nation, and Virginia AQI days are based on PM2.5 monitoring results only. Voyageurs National
Park results are based on ozone monitoring results only.
Statewide, the trend in the number of green AQI days has been increasing since 2008, suggesting that
overall air quality is improving (Figure 6). In fact, 2017 was the first year on record in Minnesota with no
monitored orange air quality days.
Figure 6. Annual statewide AQI category counts.
2019 Annual Air Monitoring Network Plan • July 2018 Minnesota Pollution Control Agency
11Despite the lack of orange AQI days, Figure 7. Number of yellow AQI days with smoke
yellow AQI days increased from 85 to 116
days from 2016 to 2017, which was
partially due to the prevalence of wildfire
smoke during the summer and fall. MPCA
meteorologists determined 18 yellow AQI
days occurred in the warm season during
wildfire smoke episodes transported into
Minnesota from Canada and the western
US. Smoke had the greatest impacts from
northwest into central Minnesota and the
Twin Cities, with 13 smoky yellow AQI
days in the Metro (Figure 7).
While the daily AQI never officially
reached over 100, the top five AQI days
came close (Table 4). Three of the top
five days were due to ozone formation on
dry, warm, sunny days. One of the days in
southwest Minnesota was to due heavy
wildfire smoke that looped around the
state to the east and then came back
from the south ahead of a warm front.
Finally one winter day made the top five due to a strong temperature inversion and light winds trapping fine
particles next to the surface.
Table 4. Highest observed AQIs in Minnesota, 2017.
Alert
Date AQI Pollutant Location Weather factors issued?
North
6/9 99 Ozone Metro Sunny skies, temperatures in the mid-80s, dry relative humidity. N
7/6 99 Ozone East Metro Sunny skies, temperatures in the low-90s, dry relative humidity. N
6/2 96 Ozone Mille Lacs Sunny skies, temperatures in the mid-80s, dry relative humidity. N
9/1 96 PM2.5 Marshall Wildfire smoke Y
1/16 93 PM2.5 East Metro Strong temperature inversion and light winds. Y
2019 Annual Air Monitoring Network Plan • July 2018 Minnesota Pollution Control Agency
12The MPCA issued five air quality alerts on days where there was a good Figure 8. Number of air quality alerts
chance of AQIs over 100, two of which were top five AQI days. The Twin issued in Minnesota counties, 2017.
Cities Metro experienced the highest number of alerts, at three days;
portions of western and central Minnesota had two days with air quality
alerts, while the other highlighted counties only received one alert
(Figure 8). Northeastern Minnesota did not have any air quality alerts
issued in 2017.
The three days on which alerts were issued where monitored
concentrations were not in the top 5 AQI days, were April 8 and
September 14 and 15. The April 8 alert was due to a narrow plume of
smoke from seasonal burning in eastern Kansas that only briefly
impacted air quality monitors in western Minnesota. The September 14
and 15 alerts were issued due to the potential for high ozone. Air
flowing in from the south had some of the highest concentrations of the
season, but a stray cluster of thunderstorms saved Minnesota from the
orange AQIs.
No changes are planned for the AQI monitoring network sites in 2019.
Chemical Speciation Network (CSN)
The CSN network is an EPA effort to gather data on the chemical composition of urban PM2.5 and to provide
a basic, long-term record of the concentration levels of selected ions, metals, carbon species, and organic
compounds found in PM2.5. The EPA established this network, which consists of approximately 300
monitoring sites nationwide. CSN data can be useful for assessing trends and developing mitigation
strategies to reduce emissions and ambient pollutant concentrations.
The programmatic objectives of the CSN network are:
Temporal and spatial characterization of aerosols
Air quality trends analysis and tracking progress of control programs
Comparison of the urban chemical speciation data set to the rural data collected from the IMPROVE
network
Development of emission control strategies
There are currently two CSN sites in Minnesota, located in Minneapolis at the Andersen School (0963) and at
the NCore site in Blaine (1002).
No changes are planned for the CSN network in 2019.
Interagency Monitoring of Protected Visual Environments (IMPROVE)
The IMPROVE Aerosol Network is a cooperative rural air quality monitoring effort between federal land
managers; regional, state, and tribal air agencies; and the EPA. This program was established in 1985 in
response to the 1977 CAA Amendments to aid in developing Federal and State implementation plans for the
protection of visibility in Class I areas. Class I areas are national parks overseen by the U.S. Department of
the Interior (USDOI) and national forests and wilderness areas overseen by the United States Department of
Agriculture (USDA). The IMPROVE network comprises 156 monitoring sites nationwide, 110 of which are
intended to represent visibility conditions in Class I areas.
The objectives of the IMPROVE network are:
To establish current visibility and aerosol conditions in Class I areas
2019 Annual Air Monitoring Network Plan • July 2018 Minnesota Pollution Control Agency
13 To identify chemical species and emission sources responsible for existing man-made visibility
impairment
To document long-term trends for assessing progress towards the national visibility goal
To, in conjunction with the enactment of the Regional Haze Rule, provide regional haze monitoring
that is representative of all visibility-protected federal Class I areas (where practical)
The IMPROVE monitors collect PM2.5 speciation data; they are, therefore, a key component of the EPA’s
national fine particle monitoring network, and are critical to tracking progress related to the Regional Haze
Regulations. Minnesota has three IMPROVE Aerosol Network sites (Figure 1). The sites are located at the
Voyageurs National Park (VOYA2, U.S. Department of the Interior), near the Boundary Waters Canoe Area
Wilderness near Ely (BOWA1, U.S. Department of Agriculture), and Great River Bluffs State Park (GRRI1,
Minnesota Department of Natural Resources).
No changes are planned for the IMPROVE network in 2018.
National Atmospheric Deposition Program (NADP)
Atmospheric deposition is monitored through the NADP program at over 250 sites, spanning the continental
United States, Alaska, Puerto Rico, and the Virgin Islands (http://nadp.slh.wisc.edu/). There are two sub-
networks in Minnesota: the National Trends Network (NTN) and the Mercury Deposition Network (MDN),
with nine NTN and four MDN sites in Minnesota (see Figure 33).
The NTN network collects weekly precipitation samples for pH, sulfate, nitrate, ammonium, chloride, and
base cations (such as calcium and magnesium). This network provides long-term, high-quality data for
determining spatial and temporal trends in the chemical composition of precipitation.
The MDN network collects precipitation samples for analysis of total mercury and methylmercury
concentrations. The objective is to develop a national database of the weekly concentrations of total
mercury in precipitation, along with the seasonal and annual flux of total mercury in wet deposition.
Samples are collected weekly and sent to Frontier Geosciences, Inc. for analysis.
The MDN monitoring site at the Anoka Airport in Blaine (1002) was closed at the beginning of 2018. No
other changes are planned for the NADP network this year.
2019 Annual Air Monitoring Network Plan • July 2018 Minnesota Pollution Control Agency
14Near-road air quality monitoring
Air pollution can be higher close to roadways. In 2010, the EPA introduced a new air monitoring network to
measure air pollution levels near heavily trafficked roadways. Near-road air monitoring sites are required to
be located within 150 feet of the busiest roadways across the country. As a minimum, near-road monitoring
sites are required to measure hourly levels of nitrogen dioxide (NO2), carbon monoxide (CO), and fine
particles (PM2.5).
In Minnesota, the MPCA has installed two near-road monitoring sites. The first near-road monitoring site
(0962) began operating along the I-94 and I-35W freeway commons near downtown Minneapolis on
January 1, 2013. The second near-road monitoring site (0480) began operating along I-35 in Lakeville on
January 1, 2015. Various parameters are being measured at each of the near-road sites (Table 5).
Table 5: Near-road parameters
TSP and Metals
MPCA
PM2.5 FEM
Carbonyls
Site City name Site name Other parameters
ID
VOCs
NOx
CO
O3
Meteorological Data,
Near Road Ultrafine Particle Counter,
0962 Minneapolis I35/I94 X X X X X X X Black Carbon
Near Road
0480 Lakeville I35 X X X Meteorological Data
The MPCA near-road air quality monitoring is described in more detail on the MPCA near-road website at
https://www.pca.state.mn.us/air/near-road-monitoring.
No changes are planned for the near-road network in 2019.
2019 Annual Air Monitoring Network Plan • July 2018 Minnesota Pollution Control Agency
15National Core Monitoring (NCore)
In October 2006, the EPA established the National Core (NCore) multi-pollutant monitoring network in its
final amendments to the ambient air monitoring regulations for criteria pollutants (codified in 40 CFR Parts
53 and 58). EPA requires each state to have at least one NCore site; there are approximately 75 sites
nationwide, mostly in urban areas.
Each NCore site must measure a minimum number of parameters (Table 6).
Table 6: NCore monitoring network site parameters
Parameter Comments
Organic and elemental carbon, major ions and trace metals (24 hour average
PM2.5 speciation every 3rd day)
PM2.5 FRM mass 24 hour total mass every third day
PM2.5 mass One hour reporting interval (continuous)
PM(10-2.5) mass In anticipation of a PM(10-2.5) standard (continuous)
Ozone (O3) Continuous monitor consistent with other O3 sites
Carbon monoxide (CO) trace Continuous monitor capable of trace levels (low parts per billion [ppb] and
level below)
Sulfur dioxide (SO2) trace level Continuous monitor capable of trace levels (low ppb and below)
Total reactive nitrogen
(NO/NOy) Continuous monitor capable of trace levels (low ppb and below)
Wind speed and direction, temperature, barometric pressure, and relative
Surface meteorology humidity
Each site in the NCore monitoring network addresses the following monitoring objectives:
Report data on a timely schedule to the public through
The AIRNow data reporting website (https://www.airnow.gov/)
Air quality forecasting
Other public reporting mechanisms
Support the development of emission strategies through air quality model evaluation and other
observational methods
Track long-term trends of criteria and non-criteria pollutants and their precursors for the
accountability of emission strategy progress
Establish nonattainment/attainment areas via comparison and compliance with the NAAQS
Support scientific studies ranging across technological, health, and atmospheric process disciplines;
support long-term health assessments that contribute to ongoing reviews of the NAAQS
Support ecosystem assessments, recognizing that national air quality networks benefit ecosystem
assessments and, in turn, benefit from data specifically designed to address ecosystem analysis
In 2011, the MPCA began operating the full suite of NCore parameters at the Anoka County Airport in Blaine
(1002). The Anoka County Airport monitoring station is located approximately 11 miles north of downtown
Minneapolis and approximately 15 miles northwest of downtown St. Paul. Appendix B of the 2010 Annual
2019 Annual Air Monitoring Network Plan • July 2018 Minnesota Pollution Control Agency
16You can also read