The wealth of generations - John Daley and Danielle Woods - December 2014
←
→
Page content transcription
If your browser does not render page correctly, please read the page content below

December 2014

  The  wealth  of  generations
  John Daley and Danielle Woods

The wealth of generations

Grattan Institute Support   Grattan Institute Report No. 2014-13, December 2014
                             This report was written by John Daley, Grattan Institute CEO and Danielle Wood, Fellow. Ben
                             Weidmann, Cameron Harrison, Cassie McGannon and Amelie Hunter provided extensive
                             research assistance and made substantial contributions to the report.

                             We would like to thank numerous people from the public policy community, the private sector,
                             and the members of Grattan Institute’s Public Policy Committee for their helpful comments.

                             The opinions in this report are those of the authors and do not necessarily represent the views
                             of Grattan Institute’s founding members, affiliates, individual board members, reference group
                             members, or reviewers. Any remaining errors or omissions are the responsibility of the
                             authors.

                             Grattan Institute is an independent think-tank focused on Australian public policy. Our work is
                             independent, practical and rigorous. We aim to improve policy outcomes by engaging with
                             both decision-makers and the community.

                             This paper uses unit record data from the Household, Income and Labour Dynamics in
                             Australia (HILDA) Survey. The HILDA Project was initiated and is funded by the Australian
                             Government Department of Social Services (DSS) and is managed by the Melbourne Institute
                             of Applied Economic and Social Research (Melbourne Institute). The findings and views
                             reported in this paper, however, are those of the authors and should not be attributed to either
                             DSS or the Melbourne Institute.

                             For further information on the Institute’s programs, or to join our mailing list, please go to:
                             http://www.grattan.edu.au/

                             This report may be cited as:
                             Daley, J., Wood, D., Weidmann, B. and Harrison, C., 2014, The Wealth of Generations, Grattan Institute

                             ISBN: 978-1-925015-65-2

                             All material published or otherwise created by Grattan Institute is licensed under a Creative Commons
                             Attribution-NonCommercial-ShareAlike 3.0 Unported License

Grattan Institute 2014
The wealth of generations

Overview
We have come to expect that each generation will be better off          In the past, each generation took out more from the budget over
than its parents: wealthier, healthier and better housed. But the       its lifetime than it put in. This generational bargain was
world is changing. Today's generation of young Australians may          sustainable when incomes rose quickly, as they did for 70 years.
have lower standards of living than their parents at a similar age.
                                                                        Yet government transfers from younger to older cohorts are now
Over the last decade, older households captured most of the             so large that future budgets may not be able to afford them as the
growth in Australia's wealth. Despite the global financial crisis,      population ages. In other words, the generational bargain is at
households aged between 65 and 74 today are $200,000                    risk. Many expect that incomes will rise more slowly over coming
wealthier than households of that age eight years ago.                  decades. If so, the last decade in the United States and Britain
Meanwhile, the wealth of households aged 25 to 34 has gone              illustrates the potential outcomes. The wealth and incomes of
backwards.                                                              younger age groups in these countries have fallen behind those of
                                                                        their parents at a similar age.
In part, the wealth of generations has diverged because of the
boom in housing prices. Older households made big capital gains.        Although older generations will ultimately pass on much of their
With lower and falling rates of home ownership, younger                 accumulated wealth, this may not help younger generations
households shared less of this windfall.                                much. On current trends, inheritances are typically received later
                                                                        in life and primarily benefit those who are already wealthy. Gifts to
Incomes also grew fastest for older Australians, allowing them to       younger generations are typically small, and also primarily benefit
add more to their wealth by saving. Households aged 55-64               well-off households.
saved $12,000 in 2010, up from $1000 in 2004. Households aged
25 to 34 controlled their spending just as tightly, but their savings   Governments can choose to prevent the next generation being
only increased to $11,000 in 2010 from $4000 in 2004, because           worse off than its parents. Targeting the Age Pension, reducing
their incomes did not rise as much.                                     superannuation tax concessions and shifting towards asset taxes
                                                                        could reduce the transfers between today's younger taxpayers
Governments are also spending much more on older households             and older retirees. These reforms would fall most on those who
for pensions and services, particularly health. In 2010,                have benefited from windfalls, government largesse, and paying
governments spent $9400 more per household over 65 than they            lower taxes while deficits accumulated. And we shouldn’t delay:
did six years before. Budget deficits funded much of the increased      later implementation may leave a younger generation even worse
spending. Future taxpayers will have to repay the debt, dragging        off, as they miss out on the benefits their parents enjoyed.
further on the prosperity of younger generations.

Grattan Institute 2014                                                                                                                      2
The wealth of generations

                            Table of contents
                            Overview......................................................................................................... 2

                            1      Introduction ............................................................................................ 6

                            2      Growing wealth has not benefited the young ....................................... 12

                            3      Spending policies increasingly benefit older Australians ...................... 21

                            4      Economic growth cannot be relied on to save the day ......................... 31

                            5      Wealth begets wealth: consumption and inheritance ........................... 36

                            6      International experience highlights the risk of lower growth ................. 41

                            7      What governments should do .............................................................. 46

                            Appendix B: Variations in income growth by gender and income level......... 49

                            Appendix C: Methodology for decomposing health spending ....................... 51

                            References ................................................................................................... 54

Grattan Institute 2014                                                                                                                       3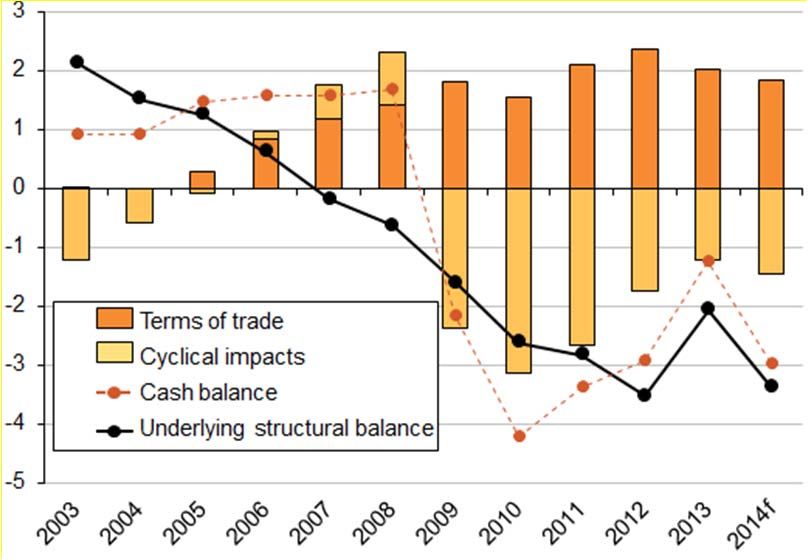
The wealth of generations

Table of figures
Figure 1.1: Big changes in household balance sheets were a consequence of savings, capital appreciation and government debt ............... 8
Figure 2.1: Those over 45 became much richer, while the wealth of younger cohorts stagnated ................................................................... 13
Figure 2.2: Households over 65 captured a growing share of total wealth ...................................................................................................... 13
Figure 2.3: Over half of household wealth is in property.................................................................................................................................. 14
Figure 2.4: Younger people are less and less likely to own homes ................................................................................................................. 14
Figure 2.5: Home ownership declined most for the young and poor ............................................................................................................... 15
Figure 2.6: Real house prices have outstripped full-time weekly earnings since 1998 .................................................................................... 16
Figure 2.7: Households’ savings increased between 2004 and 2010.............................................................................................................. 17
Figure 2.8: Consumption increased for older households, but their incomes rose even faster ....................................................................... 18
Figure 2.9: All those over 25 had higher incomes in 2011 than 1986 .............................................................................................................. 18
Figure 2.10: Household incomes increased for all age groups ........................................................................................................................ 19
Figure 2.11: Over 35s own property worth more than 8 years ago.................................................................................................................. 20
Figure 3.1: The generational bargain transfers substantial resources from younger to older households ...................................................... 22
Figure 3.2: Governments spend more on older households due to health, the Age Pension and low taxes ................................................... 23
Figure 3.3: Health spending and cash benefits for over 65s have increased significantly ............................................................................... 23
Figure 3.4: Government health spending increased the most for the over 70s ............................................................................................... 25
Figure 3.5: All age groups contributed to the growth in government health spending ..................................................................................... 26
Figure 3.6: Taxes increased less for older households because of the decrease in income tax ..................................................................... 27
Figure 3.7: IGR assumes slower non-demographic growth in health spending ............................................................................................... 28
Figure 3.8: The Australian Government budget has been in structural deficit for almost a decade ................................................................ 29

Grattan Institute 2014                                                                                                                                                                     4

The wealth of generations

Figure 4.1: Historically there have been generation-long periods of stagnant incomes .................................................................................. 31
Figure 4.2: Terms of trade added to income growth in the 2000s, but will drag in the next decade ................................................................ 33
Figure 5.1: High wealth per child for older age groups suggests inheritances may be sizeable ..................................................................... 37
Figure 5.2: People in their 50s and 60s receive larger inheritances ................................................................................................................ 38
Figure 5.3: Wealthy people of a given age are more likely to receive larger inheritances ............................................................................... 39
Figure 5.4: Inheritances greater than $100,000 tend to go to the already wealthy .......................................................................................... 39
Figure 5.5: Young people are most likely to receive a financial gift from their parents .................................................................................... 40
Figure 5.6: The median value of gifts received was small ............................................................................................................................... 40
Figure 6.1: Younger cohorts have lower incomes than their predecessors at the same age .......................................................................... 41
Figure 6.2: Despite higher education levels, younger cohorts have lower wages at a given age .................................................................... 42
Figure 6.3: Younger cohorts in the UK are much less likely to own their homes ............................................................................................. 43
Figure 6.4: Incomes of people aged 24 to 34 have declined relative to older workers .................................................................................... 44
Figure 6.5: Older households became wealthier over the last two decades .................................................................................................... 45
Figure A.1: Median wealth by age group ......................................................................................................................................................... 48
Figure B.1: Annual incomes for women (gross) ............................................................................................................................................... 49
Figure B.2: Annual incomes for men with high incomes (gross) ...................................................................................................................... 49
Figure B.3: Annual incomes for men on medium incomes (gross) .................................................................................................................. 50
Figure B.4: Annual incomes for men on low incomes (gross).......................................................................................................................... 50
Figure C.1: Split of demographic and non-demographic growth...................................................................................................................... 52

Grattan Institute 2014                                                                                                                                                                           5

The wealth of generations

1 Introduction
This report examines how the economic position of Australians of      we compare the outcomes for different generations when they are
different ages is changing. It analyses trends in household wealth,   at the same age. It is not particularly noteworthy that older people
incomes, and government taxes and transfers by age groups. It         tend to earn more and to have accumulated more wealth than
identifies which age groups are benefiting most from economic         younger people. However, it is noteworthy if the income of a
and policy changes.                                                   subsequent generation is lower than the income of a previous
                                                                      generation when they were at the same age.
1.1     “Generations” and “age groups”: key concepts for this
        report                                                        1.2   The drivers of future prosperity

The report considers the economic position of people of different     Lifetime economic well-being depends on consumption
ages at different points in time.                                     opportunities across different stages of a household’s lifecycle.
                                                                      The long term economic position of households depends on a
A generation or birth cohort refers to a cohort of individuals born   number of factors:
at roughly the same time. People remain members of one
particular generation throughout their life. There is no fixed           net wealth – the store of resources that can be spent in future –
method for determining the bounds of an individual generation,           which depends on past savings, plus appreciation in asset
though the Australian Bureau of Statistics (ABS) tends to use a          values;
20-year range. A more accurate range might be 29 years – the             future income;
median age at which a woman today has her first child.1
                                                                         future government spending and its incidence by age;
An age cohort is the group of people within a particular age
bracket at a given point in time. For example, the 20 to 24 year         future taxes – which depend on future government spending,
old cohort in 2004 includes all those people born between 1980           plus any liability to repay accumulated government debt; and
and 1984. The same cohort in 2010 includes everyone born                 future inheritances and gifts.
between 1986 and 1990.
                                                                      This report is about how these factors have evolved, and might
In this report we mainly consider the economic circumstances for      develop in the future.
a particular age group at different points in time. In other words,
1
    ABS (2013b)

Grattan Institute 2014                                                                                                                    6
The wealth of generations
1.3 How the report analyses prosperity by age group is sluggish, then a younger generation can find itself poorer than
its parents at a similar age. The experiences of the United States
The overall wealth of generations is discussed in Chapter 2. The and United Kingdom over the last decade provide a cautionary
wealth of households, particularly those over 45, has increased as guide to how low or no economic growth can produce poor
a result of increasing house prices and a big jump in savings. economic outcomes for younger cohorts, as Chapter 6 describes.
Government benefits and services also increased over the last Government can affect these factors through age-based
decade, particularly for households over 65, as Chapter 3 government welfare, other spending, and taxes, particularly Age
describes. Twenty-year trends suggest that government Pension benefits and superannuation tax concessions.
spending on health services will continue to increase much Governments can also affect the prosperity of one generation
faster than GDP. relative to another through budget policy. If a government has
budget deficits and accumulates debt, it will affect future taxes
Over the last two decades, the dollar value of taxes also and services.
increased, but not as much as spending. As a result, budget
deficits increased, implicitly imposing significant increases in Whether a younger generation is ultimately worse off than its
future taxes on younger households. parents will depend on policy change, the state of government
finances, and economic growth. Chapter 7 outlines future work to
Future income depends primarily on economic growth rates, analyse the budget impact of different growth scenarios and
discussed in Chapter 4. Higher levels of income growth also make consider how plausible policy changes might affect the
it easier to save. There are substantial risks that future income prosperity of younger generations relative to their parents.
growth will be much slower than for recent decades.
Older generations may either consume or save their wealth.
Wealth that is saved will ultimately contribute to the future
economic resources of younger generations when it is passed on
as inheritances and gifts. However, as we discuss in Chapter 5,
many households never receive anything; most bequests are only
received later in life; and large bequests are primarily received by
those who are already well-off.
If the cost of government benefits and services continues to rise, if
governments accumulate significant debts, and if income growth
Grattan Institute 2014 7The wealth of generations
1.4 Different stories for different ages: what explains the Figure 1.1: Big changes in household balance sheets were a
changing wealth of the old and young consequence of savings, capital appreciation and government debt
Average annual change, 2014$ ‘000s
A snapshot of changes over the last decade indicates how much 30
Age of head
changes in the economy and government policy have affected the 25 of household
long-term economic position of households. By looking at swings 25-34
35-44
historically, we can understand which of these factors is likely to 20
45-55
be most important to the economic outcomes for future 55-64
15 65+
generations.
10
Box 1: The components of wealth
5
Changes in household wealth depend on saving, changes in the 0
value and mix of assets (predominantly owner-occupied housing
and superannuation) and liabilities. Other sources of changes in -5
wealth include higher education loans and inheritances and gifts. -10
Savings Other Inheritance Change in Future tax impact of
Figure 1.1 shows the average annual change in wealth between changes & gifts HECS annual increase in
2003-04 and 2009-10 from each of these sources. in wealth debt government debt
Annual changes in private wealth 2004 to 2010 to
Figure 1.1 also shows how changes in government debt can 2004 to 2010 2010 2014
affect the future tax liabilities of households. For consistency, we
Notes: Savings are calculated as average expenditure on goods and services less
examine average annual debt accumulated by governments disposable income between 2003-04 and 2009-10. The increase in HECS debt is
between 2003-04 and 2009-10. The debt is distributed among calculated from information on existing HECS liability provided in the 2003-04 and 2009-10
HES. Savings from gifts and inheritance are based on average value of gifts and
households by age group based on their estimated future share of inheritance in a given year, with the assumption that this income is saved at the same rate
taxes, assuming the historical distributions of taxes by age group as other income sources (HILDA survey). Changes in government debt per household are
remain the same and that the debt is paid down over 15 years. calculated as the total change in general government debt (Commonwealth, state and
territory). These changes are then apportioned to households based on their estimated
share of total tax liabilities for the next 15 years (Box 1). Households’ savings rates are
To show how much government debt per household grew positively skewed. To limit the impact of this skew on our analysis, we remove the lowest
annually between 2009-10 and 2013-14, the cost per household and highest deciles.
Source: Grattan analysis based on HILDA (2012), ABS (2011b), ABS (2011a) and
of paying down debt over this period is separately identified. Treasury (2013a)
Grattan Institute 2014 8The wealth of generations
Over the last six years, the wealth of households headed by those The remainder of this report explores these components of
55 to 65 and 65+ year olds increased faster than households in changes in economic prosperity in more detail.
any other age group. These households saved more but they
mainly benefited from capital appreciation (particularly rising 1.5 What the report does not do
house prices). Households headed by someone over 65 will be
relatively unaffected by the increase in government debt that The report focuses on indicators of financial wellbeing.
accumulated over this period. Retirees, who pay much less in
taxes, are unlikely to contribute much to paying off the debt. Other economic, social and environmental changes will also
affect the future welfare of today’s young. Higher youth
By contrast, the financial position of 25 to 34 year old unemployment may lead to long run unemployment, blighting the
households barely improved. These households did not benefit economic prospects of many who try to enter the workforce when
in the same way from the windfall gains in housing because most unemployment rates are relatively high. Yet while current rates of
bought at the end of the boom if they bought at all. Although they youth unemployment are high, they are still below those that
had higher HECS debts than their predecessors (as a result of persisted for several years in both the 1980s and 1990s.2 The
higher HECS charges and participation rates), the impact of size of the long-term impact of youth unemployment is beyond the
changes in these debts on overall wealth was relatively small. scope of this report. Future youth unemployment is closely tied to
overall rates of unemployment,3 which are difficult to forecast.
Because government debt increased rapidly, particularly since
2008, younger households will pay substantially higher future Climate change creates a substantial downside risk to the future
taxes than would otherwise be the case. Younger households living standards of young people.4 While beyond the scope of this
could face an additional $10,000 tax burden associated with each report, it is important in a holistic consideration of
year of growing debt between 2010 and 2014. intergenerational fairness. Climate change will have more impact
on those who are young today, and have longer to live. Attitudes
Some of this debt was due to cyclical deficits that may have to government policies to reduce carbon emissions are strongly
helped maintain incomes during the economic downturn. But correlated with age.5
there is also a sizeable structural component – the
Commonwealth Government had structural budget deficits of
more than two per cent of GDP for the past five years (Chapter 3).
The annual increase in future tax liability outweighs the annual 2
Borland (2014a)
3
savings of 25-34 year old households. Ibid.
4
Garnaut (2008)
5
The 2014 Lowy Institute Poll found that Australians under 45 years are more
likely to regard global warming as ‘a serious and pressing problem’ (51 per cent)
Grattan Institute 2014 9The wealth of generations
The report does not provide a comprehensive account of the few resources that they do not have opportunities to pursue lives
financial position of different generations over the lifecycle. that they have reason to value.8 Many believe there are good
Older Australians are right to point out that they have paid taxes reasons to try to reduce the gap in outcomes further.9 Yet many
over their lifetime and are entitled to support in retirement. This others oppose government interventions focused primarily on
generational bargain is longstanding. On current settings, people reducing the variability in outcomes, either because it mutes the
on average contribute to government budgets between the ages incentive for individual effort, or because it implies a much larger
of 24 and 58, and draw down when younger and older.6 role for the state.
Yet there are real questions about the quantum of this support, The report deals with fairness between different generations. It
how it should be targeted, and whether it will be sustainable in the raises different issues to fairness within generations. Fairness
future. There are concerns that the current policy settings will lead between generations depends on economic circumstances –
to younger generations putting considerably more into the system particularly asset price changes and income growth – and
than they take out over their lifetimes. Research underway at government policy, particularly age-based tax, welfare and benefit
Grattan Institute will look at this “generational accounting” for policies, and the scale of budget deficits. Unlike the outcomes
different generations under different policy assumptions. within a generation, individual talent and effort play little role. It is
difficult to justify making policy decisions that would leave a
The report also does not explicitly address issues of intra- subsequent generation worse off, particularly if that generation
generational fairness. In considering economic outcomes across has little or no say in the decisions.
generations we focus on the average (and median) outcomes for
different age groups. This conceals considerable variability within Intra-and inter-generational fairness are linked. If a generation
each age group. Some young people have seen their wealth grow does relatively badly, the poor of that generation may be
rapidly just as some older people struggle to make ends meet. particularly vulnerable. Indeed, people today who are both young
and poor are probably the most financially vulnerable group in
Large and increasing differences in income and wealth among society.10
people of a similar age raise important policy issues.7 It is difficult
to justify a political system that leads to some people having so
8
Sen (2009), p. 253-254; Daley, et al. (2013), p. 36-37.
9
OECD (2011), p. 40-41; Daley, et al. (2013), p. 36.
10
A higher percentage of people over 65 are estimated to live in poverty
compared with those 45 years and older (40 per cent). See: Lowy Institute (incomes below 50 per cent of median income) than for younger adults.
(2014), p. 9. However, the low levels of Newstart and Youth Allowance leave young people
6
Rice, et al. (2014) on income support particularly vulnerable. More than 55 per cent of those
7
OECD (2011) receiving Newstart and 50 per cent on Youth Allowance sit below the poverty
Grattan Institute 2014 10The wealth of generations A generation whose income is lower than that of its parents may also tend to be a particularly unequal generation. Wealth is likely to become more concentrated if a large part of a generation’s wealth is inherited rather than earned. Inheritances tend to concentrate wealth, as shown both by our study of Australia over the last decade, and international experience (see Section 5.2).11 Many interventions that are likely to reduce inter-generational inequality would probably also reduce intra-generational inequality. Which provides all the more reason to pursue them. line. This compares to 16 per cent on the Age Pension. Lower levels of home ownership among today’s young (Chapter 2) compounds their future vulnerability as home ownership provides significant protection against poverty for people as they get older. See: ACOSS (2014) 11 In periods when the return on capital is high relative to economic growth (which it may well be in decades to come – Chapter 4), inherited wealth becomes more important in determining the economic outcomes of future generations. See Picketty (2013) Grattan Institute 2014 11
The wealth of generations

2 Growing wealth has not benefited the young
Over the last decade, older households captured most of the             For example, an average 55 to 64 year old household was
growth in Australia's wealth. Despite the global financial crisis,      $173,000 richer in real terms in 2011-12 than was a household of
households aged between 65 and 74 today are $200,000                    that age in 2003-04 (1.9 per cent annual growth). The average 65
wealthier than households of that age eight years ago.                  to 74 year old household was $215,000 better off over the same
Meanwhile, the wealth of households aged 25 to 34 has gone              period (2.7 per cent annual growth) (Figure 2.1).
backwards.
                                                                        By contrast, younger age groups increased their net assets less.
In part, the wealth of generations has diverged because of the          The average 35-44 year old household was only $80,000 richer
boom in housing prices. Older households made big capital gains.        over the period than was a household of that age eight years
With lower and falling rates of home ownership, younger                 earlier (1.7 per cent annual growth). Those aged 25 to 34 on
households shared less of this windfall.                                average went backwards in real terms.

Incomes also grew fastest for older Australians, allowing them to       These averages may obscure some large differences within age
add more to their wealth through savings. Households aged 55-64         groups. Nevertheless, wealth for the median household in each
saved $12,000 in 2010, up from $1000 in 2004. Households aged           age group shows the same trends as for average wealth. The
25 to 34 controlled their spending just as tightly, but their savings   wealth of the median household over 55 grew strongly (more than
only increased to $11,000 in 2010 from $4000 in 2004, because           2 per cent annual growth), stagnated for households aged 35-44
their incomes did not rise as much.                                     (0.3 per cent annual growth) and declined for those aged 25-34
                                                                        (minus 2.7 per cent growth) (see Appendix A).12
2.1   Older age groups – but not others – are becoming more
      wealthy                                                           Aggregate wealth data based on the national accounts indicates
                                                                        that this generational divergence in wealth accumulation, coupled
Most age groups are more wealthy than they were in 2003-04,             with population ageing, means that older generations now hold
even though almost all age groups lost wealth between 2009-10           more of the total wealth in Australia. Households aged 65+ held
and 2011-12 in the aftermath of the global financial crisis. Yet it     26 per cent of total wealth in 2003-04. By 2011-12, they owned 30
was older households who captured much of the increase in               per cent (Figure 2.2).13
wealth over the decade.
                                                                        12
                                                                             ABS (2013c)
                                                                        13
                                                                             ABS (2014c)

Grattan Institute 2014                                                                                                                 12
The wealth of generations
Figure 2.1: Those over 45 became much richer, while the wealth of Figure 2.2: Households over 65 captured a growing share of total
younger cohorts stagnated wealth
Average wealth by age of head of household, 2012$ ‘000s Percentage of total wealth
1,200 35
2003-04 30
1,000 2005-06 2003-04
2009-10 2011-12
2011-12 25
800
20
600
15
400
10
200
5
0 0
15–24 25–34 35–44 45–54 55–64 65–74 75+ 15-24 25-34 35-44 45-54 55-64 65+
Age of head of household Age of head of household
Note: Estimates for households 15-24 and 75+ have high standard errors and should be Note: In compiling these estimates, the ABS uses estimates of national wealth from the
used with caution. The ABS apportions its household data by age group based on the age Australian System of National Accounts ABS (2013a) and distributes these across
of the head of the household (‘reference person’). The reference person is chosen by households by age group using information from the ABS Survey of Income and Housing
applying the following selection criteria, until a single appropriate reference person is and ABS Household Expenditure Survey ABS (Various years-b).
identified: (1) owner without a mortgage, owner with a mortgage, renter, other housing Source: Grattan analysis of ABS (2014c).
tenure; (2) one of the partners in a registered or de facto marriage, with dependent
children, one of the partners in a registered or de facto marriage, without dependent All age groups hold half or more of their assets in property, and
children, a lone parent with dependent children (3) the person with the highest income, (4) the rest in superannuation, financial assets such as bank
the eldest person. See: ABS (Various years-b). The analysis of wealth in this report
generally follows the ABS Survey of Income and Housing: ABS (2013c). We also analysed accounts and shares, and other wealth, such as house contents,
household wealth as reported in the HILDA survey from 2002 and 2010, which generally vehicles, and business wealth. Liabilities – primarily mortgages –
produced very similar results to those from the ABS survey. As the ABS survey has a
larger sample size, we have preferred it to the HILDA survey.
are significant for younger households, whereas those over 65
Source: Grattan analysis of ABS (2013c)
Grattan Institute 2014 13The wealth of generations
have few debts, and typically own their homes outright (Figure 2.2 Home ownership is declining, especially among the
2.3).14 young
Figure 2.3: Over half of household wealth is in property Home ownership rates have fallen over the last two decades for
Average wealth per household by type, 2012$ ‘000s all but the oldest households. While younger age groups have
1,400 always been less likely to own their home, ownership is
increasingly diverging by age.
1,200
Figure 2.4: Younger people are less and less likely to own homes
1,000
Home ownership rate (per cent) by age group
Net worth 90
All other
800 wealth
Other financial
600 assets 65+
Super 80
Other property 55-64
400
45-54
200 Home 70
All
0 35-44
Liabilities
60
-200
15-24 25-34 35-44 45-54 55-64 65-74 75+
-400
Age of head of household
50
25-34
Source: Grattan analysis of ABS (2013c)
40
1981 1986 1991 1996 2001 2006 2011
Source: Yates (2011a); see also Burke et al. (2014)
Home ownership has declined most amongst 25 to 44 year olds.
14
This analysis is consistent with RBA analysis of aggregate assets across the In 1981, more than 60 per cent of 25 to 34 year olds owned their
economy. See: RBA (2014a), p. 6.
Grattan Institute 2014 14The wealth of generations
own home.15 By 2011 only 48 per cent did so. The decline over Among younger households, home ownership rates are declining
the same period was 10 percentage points for those aged 35 to particularly for lower income households, which are likely to be
44 (Figure 2.4). An increasing proportion of those born after 1970 those with lower levels of education (Figure 2.5).
will never get on the property ladder.16 Alongside rising prices,
increasing education debts may also be discouraging younger A gap may be emerging between home ownership expectations
households from taking out mortgages to purchase a home. and reality. Despite falling rates of home ownership, around three
quarters of today’s 15 to 19 year olds consider home ownership
Figure 2.5: Home ownership declined most for the young and poor highly important. Just over 70 per cent consider it ‘extremely
Percentage point change in home ownership rates, 1981 to 2011 by age likely’ or ‘very likely’ that they will one day own a home.17
and income quintile
10% 2.3 Have the young missed out on the housing boom?
Because younger households are now less likely to own a home,
0% many members of the generation born after 1965 missed out on
rising housing wealth as house prices boomed from the mid-
1990s. Between 1995 and 2012, real house prices increased by
-10% 4.3 per cent a year, considerably faster than the growth in full-time
Income quintile
earnings (Figure 2.6).18
Lowest
2nd
3rd The housing price boom was a result of increasingly available
-20% 4th credit,19 falling interest rates, and construction of new dwellings
Highest
not keeping up with population growth in large cities.20 Other likely
causes were growth in household incomes as female workforce
-30%
participation increased (Section 3.1) and policy settings such as
the introduction of the capital gains tax discount in 1999 and
25-34 35-44 45-54 55-64
-40%
17
Mission Australia’s Survey of 14,000 15-19 year olds. See: Mission Australia
Source: Burke et al. (2014) based on ABS (Various years-a). (2014)
18
ABS (2013d). Growth rates are calculated based on median house prices.
19
Greater competition and product innovation associated with deregulation of
the financial sector resulted in cheaper and more accessible finance during the
15
Either outright or with a mortgage. 1990s. See: Ellis (2006); Productivity Commission (2004)
16 20
Kelly, et al. (2013) Productivity Commission (2004); Yates (2011b); Eslake (2014)
Grattan Institute 2014 15The wealth of generations
generous assistance for first home buyers.21 Because the boom Figure 2.6: Real house prices have outstripped full-time weekly
coincided with a record period of uninterrupted economic earnings since 1998
growth,22 expectations of future income growth are also likely to Index 1970=100
350
have played a role in increasing demand.
The rise in housing prices generated windfall gains for those who 300
owned property before 1995. These could be considered
unearned gains – the result of policy and economic factors rather 250
than productive activities or as compensation for taking an
investment risk.23
200
Real house prices
At the same time, younger generations are more likely to have
purchased their first house or upgraded their house during or after 150
the boom. Households that did not own property before the boom Real average
– disproportionately the younger generation – missed out on the full-time earnings
100
windfall boost in wealth from the price rises.24
50
21
Previously capital gains were taxed based on real (inflation adjusted) gains. In 0
September 1999, the arrangements were changed so that nominal gains were 1970 1975 1980 1985 1990 1995 2000 2005 2010
taxed but on a discounted basis (50 per cent discount provided the asset was Note: Earnings are total average weekly (ordinary time) earnings for full time adults
held for more than a year). Strong house price growth and low inflation increased deflated by the CPI.
the attractiveness of investing in property under the new regime. The Source: Yates (2011b)
Productivity Commission argued that these policy changes contributed to the
housing boom’s ‘second wind’. See: Productivity Commission (2004), p. XIX.
The fundamentals of the real estate market may keep house
22
Battellino (2010) prices high. Yet the windfall rise in prices is unlikely to be
23
Returns on housing investments would be expected to include some risk repeated. Many observers believe that future prices are unlikely to
premium. However, the very strong growth in prices over the past 15 years is a grow as quickly as they did over the last 15 years25 because
significant upside gain. The average return on housing over time is almost
certainly in excess of the risk adjusted return required to hold such assets.
24
Some argue that if people still live in their houses then the wealth gains from
higher house prices are notional rather than real. Ultimately if these households lifetimes these households still live in better houses than they could afford if they
choose to pass on their housing wealth rather than consume it, this could had bought after the boom.
25
mitigate concerns about intergenerational inequality (Chapter 6). But during their Eslake (2014); Fox and Tulip (2014), p. 27.
Grattan Institute 2014 16The wealth of generations
income growth is likely to be slower,26 and official interest rates their spending increased more than any other age group, their
are unlikely to fall much further. incomes grew even faster (Figure 2.8).
Recently, low interest rates have moderated the impact of higher Young households also saved more (Figure 2.7). They did so by
house prices on household budgets. Yet the expected repayment containing spending as their disposable incomes increased
burden – based on a longer term interest rate to account for the (Figure 2.8).29
expectation that variable interest rates will move up over time – is
at a 10-year average. In NSW and Victoria, where house prices Figure 2.7: Households’ savings increased between 2004 and 2010
have grown most strongly, the expected repayment burden is Savings as a proportion of disposable income (savings rate), per cent
close to a 20-year high.27 16%
2003-04
2.4 Older households saved more because their incomes 14% 2009-10
rose faster
12%
The windfall gains from the housing boom for many older
households were compounded as older groups saved 10%
substantially more over the last decade.
8%
Household wealth can increase either because asset values rise,
6%
or because households save more. Savings are particularly
important for young households that have few existing assets.
4%
Overall household savings increased markedly over the decade. 2%
The savings rate increased from just 0.4 per cent of after-tax
income in 2003 to 10 per cent in 2013.28 0%
15 to 24 25 to 34 35 to 44 45 to 54 55 to 64 65+
All age groups saved more of their income, but households aged Age of head of household
55-64 increased their savings most (Figure 2.7). Even though Note: Households’ savings rates are positively skewed. To limit the impact of this skew on
our analysis, we remove the lowest and highest deciles. Median household savings rates
are reported in Appendix A.
Source: ABS Household Expenditure Survey 2003-04 and 2009-10
26
Gruen and Wilcox (2014)
27
RBA (2014b)
28 29
ABS (2013a) ABS (2006); ibid.; ABS (2011b)
Grattan Institute 2014 17The wealth of generations
Figure 2.8: Consumption increased for older households, but their Figure 2.9: All those over 25 had higher incomes in 2011 than 1986
incomes rose even faster Median individual wage and welfare income before tax, 2011$
Change in household income and expenditure 2003-04 to 2009-10, $60,000
2010$ 1976
1981
5000 1986
Change in income $50,000 1991
Change in expenditure 1996
2001
4000 2006
$40,000
2011
3000 $30,000
2000 $20,000
$10,000
1000
$0
0 15-19 20-24 25-34 35-44 45-54 55-64 65-74 75-84 85+
15 to 24 25 to 34 35 to 44 45 to 54 55 to 64 65+ Note: Incomes are recorded in the Census as the total of wages and salaries, government
Age of head of household benefits, pensions, allowances and any other income they usually receive, before
deductions for tax, superannuation contributions, health insurance, amounts salary
Note: Households’ savings rates are positively skewed. To limit the impact of this skew on sacrificed, or any other automatic deductions. Because census participants are only asked
our analysis, we remove the lowest and highest deciles. about regular income, it is likely that most investment income (which can be irregular in
Source: ABS Household Expenditure Survey 2003-04 and 2009-10 nature) is not captured in the Census data. For this reason, the data are not directly
comparable to the household income data in Figure 2.10.
2.5 Income trends Source: Grattan analysis of ABS Census 1976-2011
These gains in income reflect broader trends. After incomes fell in The income drop for under 25s is not necessarily troubling.
real terms in the late 1970s and 1980s, median incomes before Median incomes for the 15-19 and 20-24 age groups fell as more
tax increased over the last two decades for all age groups except
the under 25s (Figure 2.9).
Grattan Institute 2014 18The wealth of generations
young people studied full-time or combined part-time work and Figure 2.10: Household incomes increased for all age groups
study, and consequently started to work full-time later in life.30 Household wage, business and welfare income before tax, 2012$ ’000s
200 2003-04
Nevertheless, the overall outcomes obscure some big differences. 2005-06
180 2007-08
Over the last two decades women and high-income men have 2009-10
earned much more than they used to. On the other hand, men on 160 2011-12
low incomes today earn little more in real terms than did low 140
income men 30 years ago (Appendix A).31
120
Household incomes have increased even faster. Between 2003- 100
04 and 2011-12 incomes increased for households of all age
groups. Wage growth was the major driver. Lower income 80
households (bottom four income deciles) also earned more as 60
female workforce participation increased.32 Otherwise, changes in
household composition and family formation have not significantly 40
affected household incomes in recent years.33 20
Income growth was strongest over the nine years for households 0
15-24 25-34 35-44 45-54 55-64 65+
headed by people aged 55-64 and 65+ (3.9 percent annual
growth), reflecting increasing participation rates. The incomes of Age of head of household
Note: These income estimates are based on aggregate estimates of national income from
households in other age groups grew by less than three per cent the Australian National Accounts. They are more comprehensive estimates of income than
annually over the period (Figure 2.10). the census estimates in Figure 1. The distribution of incomes by age of household head is
determined by the ABS using weights from the suite of ABS publications derived from the
ABS Survey of Income and Housing and Household Expenditure Survey.
Source: ABS (2014c).
30
2.6 Property and savings have driven wealth accumulation
Abhayaratna and Lattimore (2006)
31
Income trends for high income men are analysed by considering the income As a result of house price increases and invested savings, the
th
for men at the 80 percentile of the earnings distribution over time. Incomes for
low income men are assessed at the 20th percentile. Men in this group in the 25-
wealth (net of debt) of all age groups over 45 substantially
54 age cohorts have median incomes at least 30 per cent lower in real terms increased over the eight years to 2011-12. Property wealth
than the same group 30 years ago. ABS (Various years-a) increased most for 65 to 74 year olds – by $110,000 or 2.9 per
32
Greenville, et al. (2013); ibid. cent annual growth – and for those over 75 by $90,000 or 2.6 per
33
Ibid.
Grattan Institute 2014 19The wealth of generations
cent annual growth. For those aged between 55 and 75, higher Figure 2.11: Over 35s own property worth more than 8 years ago
superannuation balances also contributed to higher wealth (Figure Change in mean wealth per household, 2003-04 to 2011-12,
2.11). 2012$ ‘000s
300
At the same time, the net wealth of younger Australians
stagnated. Households headed by those under 35 have less 250
Net worth
wealth in their home than did the same group eight years ago.
200
And while today’s 34-55 year olds own houses that are worth
more, they had to borrow more to acquire them. Borrowing more Other financial
150 assets
relative to income is one way that younger generations are Super
adapting to declining housing affordability.34 100
Other property
Younger age groups today do own more “other financial assets” – 50 Home
including bank deposits and shares – than did their predecessors. 0 All other wealth
Compulsory superannuation should further boost their lifetime Liabilities
savings. -50
-100
15-24 25-34 35-44 45-54 55-64 65-74 75+
-150
Age of head of household
Note: A negative change in liabilities denotes an increase in the amount borrowed per
household in that age group.
Source: Grattan analysis of ABS (2014c)
34
Burke, et al. (2014)
Grattan Institute 2014 20The wealth of generations
3 Spending policies increasingly benefit older Australians
As well as benefiting from a housing windfall and increased 3.1 Contribution to the budget by age group
incomes, older generations over the last decade also benefited
Almost all age groups are net overall contributors to government
disproportionately from Australia’s tax and welfare system.
budgets. In other words, they pay more taxes (income and sales
Governments are spending much more on pensions and services, taxes) than they receive in government benefits, including both
particularly health, for older households. In 2010, governments welfare and government services. The average household moves
spent $9400 more on households over 65 than they did six years from being a net contributor to a net drawer on the budget when
before. Older Australians pay less in taxes than they receive in the head of household turns 58.36
benefits, while other age groups are net contributors to the
The scale of this transfer to older households is increasing, as
budget. This generational bargain is longstanding,35 but in the
Figure 3.1 shows.37 Most of the increase happened over the last
past two decades the size of the transfer has increased per
decade. In 2009-10, households 65 and over received $9400
household.
more in real terms per household in net benefits (cash assistance
In the past, each generation took out more from the budget over and benefits in kind minus taxes) compared to 2003-04. This
its lifetime than it put in. This part of the generational bargain was jump, much larger than for other households, was primarily a
sustainable when incomes rose quickly, as they did for 70 years. result of increased spending on health and the Age Pension, and
However, government transfers from younger to older cohorts are relatively small tax increases.
now so large that future budgets may not be able to afford them
This increased transfer to households 65 and over was not funded
as the population ages. Consequently, the generational bargain is
at the time through higher contributions from other age groups.
at risk.
36
Rice, et al. (2014), p.12-13
Furthermore, budget deficits funded much of the increased 37
To fully explain changes in spending at the household level, estimates should
spending over the last decade. Future taxpayers will have to control for changes in household size. Unfortunately the ABS does not equivalise
repay the debt, dragging further on the prosperity of younger the data in this way. In an analysis of trends in government health spending by
generations. age group, Tapper and Phillimore (2014) consider changes in household size by
age group over time. They find small declines in the size of young (14-44 year
old) and middle aged (45-64 year old) households and no change in the size of
elderly (65+ year old) households. This means that the increases in spending on
35
Barr (2001) argues that in addition to poverty relief, a key function of the young and middle aged households will be somewhat understated by the
welfare state is to act as a “piggy bank”, redistributing income over the lifecycle analysis. But the significant increase in spending for older households cannot be
for individual citizens. explained by changes in household size.
Grattan Institute 2014 21The wealth of generations
Figure 3.1: The generational bargain transfers substantial Government deficits, which have exceeded $40 billion a year for
resources from younger to older households four of the last five years.38
Average net benefits per household, 2010$
$35,000 3.2 More spending on older Australians
$30,000 1988-89
1993-94 Australian governments give direct (cash) assistance to support
1998-99
$25,000 2003-04
those most in need. They also provide most people with a range
2009-10 of services in kind, including subsidised access to education,
$20,000 health and housing services. Much of this support goes to older
$15,000 Australians. Households over 65 also receive more social
assistance benefits, primarily the Age Pension, and more
$10,000 government-funded health services than do other age groups
$5,000
(Figure 3.2).
$0 The cost of these services outweighs the much higher
government spending on education for other age groups,
-$5,000 particularly on school education for the children of households
-$10,000 headed by a person aged between 35 and 54. Meanwhile,
15-24 25-34 35-44 45-54 55-64 65+ because many more of them are retired, people in households
-$15,000 over 65 pay far less tax, particularly income tax, than does any
Age of head of household
other age group.
Note(s): Net benefits are social assistance benefits in cash, plus support in kind, minus
income and sales taxes. Age is by age of household reference person – households
headed by someone 35-44 receive higher net benefits than other younger households
because a greater number have school age children and therefore education spending is
higher on these households (Figure 2.11).
Source: Grattan analysis of ABS (2012) (Table 19).
Most age groups experienced a small increase in their net
transfers over the same period. Instead, it was funded through
budget deficits, as governments swung from substantial surpluses
to substantial deficits. The estimated cost of the increased net
transfer to 65 and over households was about $22 billion a year.
The transfer contributed substantially to Commonwealth 38
Treasury (multiple years)
Grattan Institute 2014 22The wealth of generations
Figure 3.2: Governments spend more on older households due to Figure 3.3: Health spending and cash benefits for over 65s have
health, the Age Pension and low taxes increased significantly
Government spending and taxation per household, 2010$ Change in government benefits per household (1988-89 to 2009-10),
2010$
50,000
16,000
40,000 Net
expenditure Other in kind
Education 14,000 Other in kind
30,000 Education
Health
12,000
20,000
10,000
10,000 Cash
8,000 Health
0 Income taxes
Indirect taxes 6,000
-10,000
65+
4,000
-20,000
15-24
55-64 2,000 Cash
-30,000 25-34
35-44 45-54 0
-40,000 Age of head of household 15-24 25-34 35-44 45-54 55-64 65+
Notes: Age is by age of household reference person – hence government spending on Age of head of household
schools is reflected by much more education spending on 35-44 year old households. Notes: Other in kind includes childcare assistance, other social security and welfare
Other in kind includes childcare assistance, other social security and welfare benefits, benefits, housing benefits and electricity concessions.
housing benefits and electricity concessions. Sources: Grattan analysis of ABS (2012), Table 19.
Sources: Grattan analysis of ABS (2012) (Table 19).
3.3 Welfare spending trends by age
The skew in assistance for older age groups has increased over
the last 20 years. Increases in government spending on health Welfare benefits (cash payments) increased more for households
and cash benefits for households over 65 have been larger than over 65 than they did for other age groups (Figure 3.3).
the increases in government spending for other age groups
(Figure 3.3). A household headed by someone over 65 today receives $4400
more in real terms in welfare benefits each year than did the
equivalent household 20 years ago. Most of this increase reflects
Grattan Institute 2014 23The wealth of generations
higher Age Pension expenditure. The largest increase ($3100 a less favourable treatment of account-based pensions under
year, an increase of more than 20 per cent) occurred between the means test; and
2003-04 and 2009-10. The underlying policy changes include:39
ceasing to index the Clean Energy Supplement.43
a reduction in the taper rate for the pension asset test in
2006-07, costing $1 billion a year;40 and The Abbott Government has proposed a number of other changes
an increase of more than 10 per cent in in the base pension that have not yet been passed by Parliament, including:44
rate in 2009 at a cost of about $3 billion a year. 41
lifting the Age Pension qualifying age further, from 67 to 70 by
A further increase of 1.7 per cent in the base pension rate was 2035;
introduced in 2010-11 to compensate for the introduction of the
carbon price, but not withdrawn when the carbon price was indexing the Age Pension and pension equivalent payments to
repealed.42 CPI rather than to growth in average full time weekly earnings;
There have been attempts to contain growth in spending on
suspension of the indexation of income and asset test
pensions. The Rudd Government increased the Age Pension
thresholds for three years from 2017; and
eligibility age from 65 to 67. Yet this will only be phased in
between 2017 to 2023. Other changes, passed by Parliament in
reduction of deemed income thresholds from 2017.
2014, include:
These measures will save a little in the short term, and much
more in the long run. As many of them do not take effect until
39
Tapper, et al. (2013) 2017, the 2014-15 Budget contains little detail about long run
40
Under the revised taper rate, pensioners lost only $1.50 per fortnight (rather savings. 45 The Parliamentary Budget Office has estimated that by
than $3) for every $1000 of assets above the threshold. See: Treasury (2007); 2025 these policy changes will save around $7 billion each year.46
Treasury (2006)
41
Includes age, disability and other pension payments. Treasury (2009), Budget
Paper No. 2. This increase was over and above the legislated increase in the
base pension rate by the growth in average weekly earnings. The Age Pension
is indexed twice annually to the greater of the growth in CPI or the Pensioner
and Beneficiary Living Cost Index (PBLCI). The new payment rates are then
43
benchmarked against the MTAWE. If the new payment rate is below the Social Services Amendment Bill No. 6 (2014)
44
benchmark (66.3per cent for couples) payments are increased to this Klapdor (2014a)
45
benchmark. See: Klapdor (2014b) Treasury (2014a) and Treasury (2013b)
42 46
Treasury (2011) PBO (2014)
Grattan Institute 2014 24You can also read