SENQU LED STRATEGY 2018-2038 - Adopted May 2018 - Senqu Local Municipality
←
→
Page content transcription
If your browser does not render page correctly, please read the page content below
SENQU LED STRATEGY
         2018-2038

       Adopted May 2018

  SENQU DRAFT LED STRATEGY 2018-2038   1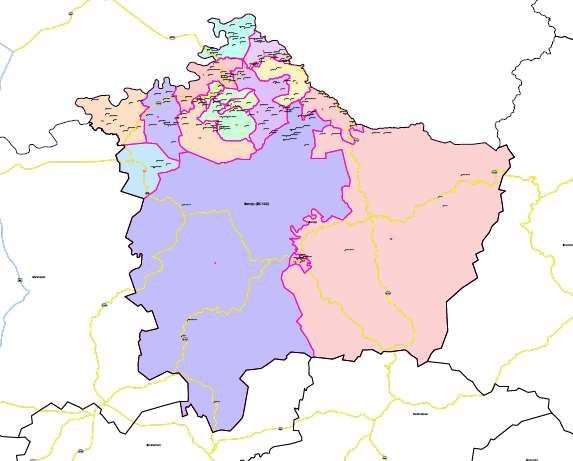
Contents
Tables ........................................................................................................................................................................................ 2
CHAPTER 1: LED PLANNING FRAMEWORK ................................................................................................................... 4
   1.          Introduction ............................................................................................................................................................ 4
   2.          Internal Perspective ................................................................................................................................................ 4
   3.          National Policy Framework ..................................................................................................................................... 5
   4.          Provincial Policy Framework ................................................................................................................................. 10
   5.          District Policy Framework .............................................................................................................................. 13
CHAPTER 2: SENQU CONTEXTUAL ANALYSIS ............................................................................................................ 15
   1.Introduction ..................................................................................................................................................................... 15
   2.          Socio-Economic Indicators .................................................................................................................................... 16
       2.1          Population Dynamics........................................................................................................................................ 16
       2.2          Human Settlements .......................................................................................................................................... 16
       2.3          Gender and Age ................................................................................................................................................ 17
       2.4         Population by population group, gender, age and households ........................................................................... 18
       2.5          HIV and AIDS Estimates .................................................................................................................................. 19
       2.6          Population Density ........................................................................................................................................... 20
       2.7          Development Indicators ................................................................................................................................... 20
   3.Economy .......................................................................................................................................................................... 31
       3.1          Global, RSA and Eastern Cape Economies ........................................................................................................ 31
       3.2.         Gross Domestic Product by Region (GDP-R) .................................................................................................... 33
       3.3.          Economic Growth Forecast .............................................................................................................................. 35
       3.4.          Gross Value Added by Region (GVA-R) ............................................................................................................ 36
       3.5.         Tress Index ...................................................................................................................................................... 41
       3.6           Location Quotient ............................................................................................................................................ 42
       3.7          Tourism ........................................................................................................................................................... 42
       3.8.         International Trade .......................................................................................................................................... 46
       3.9         Total Employment ............................................................................................................................................ 47
       3.10.        Income and Expenditure .................................................................................................................................. 51
       3.11.        Land ................................................................................................................................................................. 55
   4. LED Support System ....................................................................................................................................................... 56
CHAPTER 3: STRATEGIC SYNTHESIS ............................................................................................................................ 57
   1.          Introduction ...................................................................................................................................................... 57
   2.          Key Problem Statements ................................................................................................................................. 57
   3.          Comparative and Competitive advantages ................................................................................................... 60
CHAPTER 4: LED FRAMEWORK ...................................................................................................................................... 62
   1.          Introduction .......................................................................................................................................................... 62
   2.          Economic Vision ................................................................................................................................................... 62
   3.          LED Strategy Objectives ........................................................................................................................................ 63
   4.          LED Strategy Development Thrusts....................................................................................................................... 63
CHAPTER 5: LED PROGRAMMES & PROJECTS ........................................................................................................... 66
   1.           Introduction ......................................................................................................................................................... 66
   2           Locality Development ............................................................................................................................................ 66
   3           Enterprise Development ........................................................................................................................................ 67
   4           Livelihoods Programme ........................................................................................................................................ 70
   5           Skills Development Programme ............................................................................................................................ 70
   6           Institutional Development Programme ................................................................................................................. 71
CHAPTER 6: LED INSTITUTIONAL FRAMEWORK ...................................................................................................... 72
   1           Introduction .......................................................................................................................................................... 72
   2           Key LED Institutional Platforms............................................................................................................................ 72
   3.          LED Unit Human Resource Plan ........................................................................................................................... 74
CHAPTER 7: IMPLEMENTATION AND MONITORING ................................................................................................ 76
   1.          Introduction .......................................................................................................................................................... 76
   2.          Implementation Approach .................................................................................................................................... 76
   3           Monitoring & Evaluation Guidelines...................................................................................................................... 77

Tables
      Table 1: New Growth Path Job Drivers and Support Measures ........................................................................................ 7
      Table 2: Average Household Size .................................................................................................................................... 16
      Table 3: Population by gender........................................................................................................................................ 17
      Table 4. Population by population group, gender and age. ............................................................................................. 19
      Table 5.Number of HIV positive People, 2006-2016 ....................................................................................................... 20
      Table 6: HDI ................................................................................................................................................................... 21
      Table 7. Gini coefficient 2006-2016 ................................................................................................................................ 22
      Table 8. Percentage of people living in poverty by population group 2006-2016 ............................................................. 22
      Table 9. Highest level of education 15+ 2006-2016. ....................................................................................................... 24
      Table 10: Working age population in Senqu, JGDM, EC & National 2006 -2016 ............................................................ 25
      Table 11: Economically Active Population (EAP) – Senqu, JGDM, EC & National 2006-2016. ....................................... 26
      Table 12: The Labour Force Participation Rate - 2006-2016 .......................................................................................... 27
      Table 13: Household by dwelling type ............................................................................................................................ 28
      Table14: Household by Sanitation .................................................................................................................................. 28
      Table 15: Household by water ........................................................................................................................................ 29
      Table 16: Households with access to electricity .............................................................................................................. 29
      Table 17: Households by Refuse disposal 2016 ............................................................................................................. 30
      Table 18: EC Macro-economic Indicators and Projections 2014-2018 ............................................................................ 31
      Table 19: EC DM (GVA-R) ............................................................................................................................................. 32
      Table 20: GDP -R -Senqu. JGDM, EC & National 20016-2016 [R Billions, Current Prices] ............................................. 33
      Table 21: GDP 2006-2016 [ANNUAL PERCENTAGE CHANGE, CONSTANT 2010 PRICES] ...................................... 34
      Table 22: GDP JGDM Region 2006-2016 share and growth .......................................................................................... 35
      Table 23: GDP JGDM, 2006 TO 2021, SHARE AND GROWTH..................................................................................... 36
      Table 24: GVA by Broad economic sector – Senqu 2016 [R BILLIONS, CURRENT PRICES] ........................................ 36

                                                                SENQU DRAFT LED STRATEGY 2018-2038                                                                                            2
Table 25: GVA by Broad economic sector 2006-2016 (R millions 2010 constant prices) ................................................ 37
         Table 26: GVA Added by broad economic sector 2016-2021 (R Millions, constant 2010 prices) .................................... 41
         Table 27: No of trips by purpose of trips 2006-2016 ....................................................................................................... 42
         Table 28: Origin of tourists ............................................................................................................................................. 43
         Table 29: Bednights by origin of tourist 2006-2016 ......................................................................................................... 44
         Table 30: Total Tourism spending 2006-2016 (R Billions Current Prices) ....................................................................... 45
         Table 31 Tourism spend as a share of the GDP 2006-2016 ........................................................................................... 46
         Table 32: Merchandise exports and imports 2016 (R 1000 Current Prices) .................................................................... 46
         Table 33: Total employment per broad economic sector JGDM 2016 ............................................................................. 48
         Table 34: Formal and informal employment by broad economic sector 2016.................................................................. 49
         Table 35: Unemployment official definition 2006-2016.................................................................................................... 50
         Table 36: Unemployment rate 2006-2016 ...................................................................................................................... 51
         Table 37: Households by income category 2016 ............................................................................................................ 52
         Table 38: Annual total personal income 2006-2016 ........................................................................................................ 53
         Table 39: per capita income by population group 2016 (R current prices)....................................................................... 53
         Table 40: Index of buying power .................................................................................................................................... 54

Maps
         Map 1 Senqu Municipality Locality Map.......................................................................................................................... 15

Charts
      Chart 1:Population Pyramid 2016 vs 2021 ..................................................................................................................... 17
      Chart 2: Poverty Gap Rate ............................................................................................................................................. 23
      Chart 3: GDP 2006-2021 (AVERAGE ANNUAL GROWTH RATE, CONSTANT 2010 PRICES) .................................... 35
      Chart 4: GVA by Aggregate Sector 2016 ........................................................................................................................ 38
      Chart 5: GVA by primary sector 2006-2016 .................................................................................................................... 38
      Chart 6: GVA by Secondary sector 2006-2016 ............................................................................................................... 39
      Chart 7: GVA by tertiary sector 20016-2016 ................................................................................................................... 40
      Chart 8.Tress Index 2006-2016 ...................................................................................................................................... 41
      Chart 9: Location quotient Senqu vs national 2016......................................................................................................... 42
      Chart 10: Tourism spend per resident capita .................................................................................................................. 45
      Chart 11: International trade – Imports & Exports JGDM 2016 ....................................................................................... 47
      Chart 12: Index of buying power 2006-2016 ................................................................................................................... 55

                                                            SENQU DRAFT LED STRATEGY 2018-2038                                                                                     3
CHAPTER 1: LED PLANNING FRAMEWORK

    1. Introduction

What is local economic development? The South African Department of Co-operative Governance and
Traditional Affairs (COGTA) defines it as “an approach towards economic development which allows and
encourages local people to work together to achieve sustainable economic growth and development
thereby bringing economic benefits and improved quality of life for all residents in a local municipal area
(COGTA, May 27, 2016)”.

GIZ has through its LOCATI programme established the following principles in underpinning LED. These
are as follows:

    •    Create favourable locational factors, i.e. qualities which make your place a good place to do
         business.

    •    Promoting business. Businesses can be enticed to come to the area through reduced tariffs etc
         but not by creating unfair competition for existing businesses.
    •    Make local markets work better by “creating places and opportunities to match supply and
         demand, as well as to discover, propagate and promote new business opportunities.”

Principles are proposed to ensure that an LED Strategy has the outcome which it seeks by:
    • Establishing the difference between LED and community development. “LED is about creating
         functioning markets that encourage competitive businesses. Community development is about
         solving social problems (health, housing, education, neighbourhood), and it involves principles
         such as solidarity and support for the weak and marginalised.”
    • Introducing “clear market and business focus in LED. Conceptualise black empowerment and
         the promotion of emerging entrepreneurs from this perspective. Addressing market failure is the
         appropriate way to stimulate business opportunities, not by subsidising potential entrepreneurs
         or entertaining them with shallow training courses.”
    • Realising the opportunities involved in the better utilisation of local resources. Use the business
         skills of experienced businesspersons to strengthen the capabilities of emerging entrepreneurs?
    • “Instead of encouraging the creation of ineffective LED Fora, persuade local stakeholders to
         look for specific project ideas that are quickly implementable and will make a difference for
         local businesses. Encourage local stakeholders to establish a governance structure only when
         there is something to be governed, i.e. when some practical projects are under way.”
    • “Involving both the public and the private sector in LED.” It must be a partnership (JGDM LED
         Strategy, 2014: 4-8)”.

    2. Internal Perspective

             a. Sustainable Development Goals

These goals have an impact on the local implementation of LED and are as follows:

    1.   End poverty in all its forms everywhere
    2.   End hunger, achieve food security and improved nutrition, and promote sustainable agriculture
    3.   Ensure healthy lives and promote well-being for all at all ages
    4.   Ensure inclusive and equitable quality education and promote life-long learning opportunities for
         all
                                   SENQU DRAFT LED STRATEGY 2018-2038                                    4
5.    Achieve gender equality and empower all women and girls
    6.    Ensure availability and sustainable management of water and sanitation for all
    7.    Ensure access to affordable, reliable, sustainable, and modern energy for all
    8.    Promote sustained, inclusive and sustainable economic growth, full and productive employment
          and decent work for all
    9.    Build resilient infrastructure, promote inclusive and sustainable industrialization and foster
          innovation
    10.   Reduce inequality within and among countries
    11.   Make cities and human settlements inclusive, safe, resilient and sustainable
    12.   Ensure sustainable consumption and production patterns
    13.   Take urgent action to combat climate change and its impacts
    14.   Conserve and sustainably use the oceans, seas and marine resources for sustainable
          development
    15.   Protect, restore and promote sustainable use of terrestrial ecosystems, sustainably manage
          forests, combat desertification, and halt and reverse land degradation and halt biodiversity loss.
    16.   Promote peaceful and inclusive societies for sustainable development, provide access to justice
          for all and build effective, accountable and inclusive institutions at all levels
    17    Strengthen the means of implementation and revitalize the global partnership for sustainable
          development.

    3. National Policy Framework

The Constitution Act 108 (1996) recognises the importance of local government in economic
development in the statement: S152 (1) The objects of local government are—
(c) to promote social and economic development;

The White Paper on Local Government (1998), introduces the concept of “developmental local
government”, defined as: “Local government committed to working with citizens and groups within the
community to find sustainable ways to meet their social, economic and material needs, and improve the
quality of their lives.”

The Municipal Systems Act 32 (2000), which made integrated development planning compulsory, and
legislated a number of key LED functions, roles and responsibilities. The aim of the Act is : “To provide for
the core principles, mechanisms and processes that are necessary to enable municipalities to move
progressively towards the social and economic upliftment of local communities.” (JGDM LED Strategy,
2014:12)

The Integrated Sustainable Rural Development Strategy (ISRDS) of the DPLG now COGTA, which seeks to
“attain socially cohesive and stable communities with viable institutions, sustainable economies and
universal access to social amenities, able to attract skilled and knowledgeable people, equipped to
contribute to their own and the nation’s growth and development.” The main focus was on rural
development.

                                     SENQU DRAFT LED STRATEGY 2018-2038                                    5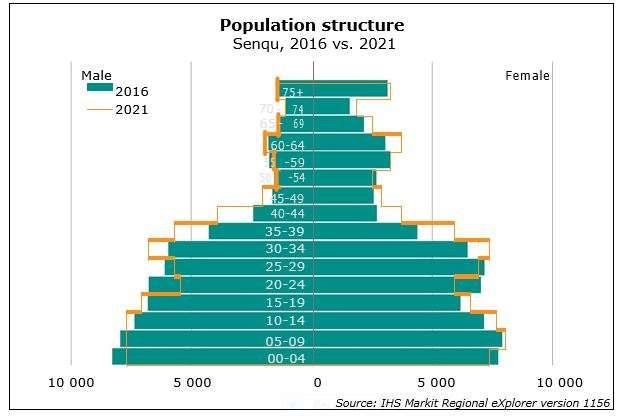
The Accelerated and Shared Growth Initiative for South Africa (AsgiSA). The overarching objectives are
to:
             o   Reduce the unemployment rate from 30% to 15% by 2014;
             o   Reduce poverty from one-third to one-sixth of the population by 2014; and
             o   Increase the annual GDP growth rate from the then average of 3% to 4,5% per year for
                 the period 2005 to 2009 and to 6% for the period 2010 to 2014. This target should create
                 a sustainable annual growth rate of 6%. (JGDM 2014:13). This is done by focussing on:
                 o     Macro-economic issues
                 o     Infrastructure
                 o     Education and skills
                 o     Sector development strategies
                 o     Second Economy, and small, medium and micro enterprise (SMME)
                       development governance and public administration.

The Joint Initiative on Priority Skills Acquisition Mandate (JIPSA) was launched in 2006, in support of
AsgiSA, to identify solutions to the major skills shortages.

The Strategic Plan for the Department of Agriculture, Forestry and Fisheries (2013/14 to 2017/18) has
the following goals:
              o SG 1 Increased profitable production of food, fibre and timber products by all categories
                       of producers
             o   SG 2: Sustained management of natural resources
             o   SG 3: Effective national regulatory services and risk management systems
             o   SG 4: A transformed and united sector
             o   SG 5: Increased contribution of the sector to economic growth and development
             o   SG 6: Effective and efficient governance (JGDM 2014:14-15)

The following sectors are highlighted as key – which are also critical elements of the JGDM agricultural
sector:

             o   Food security
             o   Cooperatives and smallholder farmers
             o   Agro-processing
             o   Forestry
             o   Fisheries (JGDM LED Strategy, 2014:14-15)

The New Growth Path is the South African Government’s job creation and economic development
strategy adopted in April 2011. It aims to grow employment by 5 million jobs by 2020, with most of these
jobs coming from the private sector. The two key variables which will affect the target are the rate of
economic growth which should be between 4% and 7% and the employment intensity of that growth.

The initial job drivers which have been identified are as follows:
                    1.     Public investment in infrastructure,
                    2.     Targeting more labour-absorbing activities across the main economic sectors,
                           agriculture and mining value chains, manufacturing and services,
                    3.     Opportunities in the knowledge and green economies,
                    4.     Leveraging social capital in the social economy and the public services, and
                    5.     Fostering rural development and regional integration. Spatial development.

                                      SENQU DRAFT LED STRATEGY 2018-2038                                    6
An overview of these job drivers and specific support measures is provided in the table below:

         Table 1: New Growth Path Job Drivers and Support Measures

#    Job Driver                    Activities and [Jobs]                     Support Measure                       Jobs

1    Infrastructure:-              ▪ Energy,    transport,     water    &    ▪   Public investment                 250,000
                                     communications;                         ▪   Skills development
                                   ▪ Construction    of    infrastructure,   ▪   Prevent non-competitive pricing
                                     operation,     maintenance         &    ▪   Procure local inputs
                                     manufacture.                            ▪   Renewable energy
                                                                             ▪   Labour based production
2    Main                      ▪ Agricultural smallholder schemes
                        Economic                                             ▪   Restructuring land reform         1,845,000
     Sectors:-                   [300,000]                                   ▪   Review mineral rights regime,
                               ▪ Agro-processing [145,000]                       lower input costs
                               ▪ Farming upgrades [660,000]                  ▪   Refocus beneficiation strategy
                               ▪ Mining [140,000]                            ▪   Manufacturing support (IPAP 2)
                               ▪ Manufacturing [350,000]                     ▪   Tourism marketing, training
                               ▪ Tourism services [250,000]                  ▪   Cultural industry support
                               ▪ Cultural industries
3    Knowledge & Green ▪ Green economy manufacturing                         ▪ Integrated Resource Plan for        400,000
     Economy:-                   [80,000]                                      electricity (IRP2)
                               ▪ Green       construct,      operation,      ▪ Appropriate RE pricing policies
                                 maintenance [220,000]                       ▪ Recycling schemes
                               ▪ Environmental       protection    and       ▪ New technology to SME
                                 biofuels                                    ▪ Support R&D and tertiary
                               ▪ Knowledge intensive sector, ICT,              education
                                 education,    healthcare,      mining,      ▪ Improve broadband access &
                                 pharmaceuticals,        biotechnology         cost
                                 [100,000]
4    Social capital and public ▪ Promote not-for-profit activity, co-        ▪ Address HIV/AIDS challenge          360,000
     services:-                  ops, NGO’s etc [260,000]                    ▪ Promote co-operatives
                               ▪ Improve public service health,              ▪ Develop     social    economy
                                 education, policing [100,000]                 linkages and support
                               ▪ Increased state procurement from
                                 social bus
5    Spatial      &      rural ▪ Rural development programmes                                                      650,000
     development                 [500,000 HH’s]
                               ▪ Support small scale agriculture
                               ▪ Increased     exports     to    SADC
                                 [150,000]
                               ▪ Improved regional logistics with
                                 “Smart Ports” and road & rail
                                 integrated
     Total Jobs created by 2020                                                                                    3,505,000

The microeconomic package involves targeted measures to control inflationary pressures and support
competitiveness and increased equity, which in turn makes the macroeconomic strategy sustainable and
viable. It includes reforms in policies on skills, competition, industry, small business, the labour market,
rural development, African integration and trade policy. It consists of ten programmes to control
inflationary pressures and inefficiencies combined with more pro-active strategies to support an inclusive
economy, social equity and regional development. The 10-point microeconomic package prioritizes the
development and implementation of:

                  ❑     Active industrial policy
                  ❑     Rural development policy
                  ❑     Competition policy
                  ❑     Stepping up education and skill development
                  ❑     Enterprise development: promoting small business and entrepreneurship; eliminating
                         unnecessary red tape
                                            SENQU DRAFT LED STRATEGY 2018-2038                                                 7
❑   Broad-based Black Economic Empowerment (BBBEE)
                  ❑   Labour policies
                  ❑   Technology policy
                  ❑   Developmental trade policies
                  ❑   Policies for African development

The NGP recognises the role of an effective, developmental state in achieving broad-based employment
growth and raise the issues of what the role of the state should be, the market and key market players
outside of the state, and social mobilisation and dialogue.

National Development Plan (Vision 2030) is a detailed blueprint for how the country can eliminate
poverty and reduce inequality by the year 2030 by attaining a decent standard of living such as Housing,
water, electricity and sanitation; Safe and reliable public transport; Quality education and skills
development; Safety and security; Quality health care; Social protection; Employment; Recreation and
leisure; Clean environment and Adequate nutrition. (Ecsecc 2017:4)
The broad objectives are:

    i     Providing overarching goals for what we want to achieve by 2030.
    ii    Building consensus on the key obstacles to us achieving these goals and what needs to be done
          to overcome those obstacles.
    iii   Providing a shared long-term strategic framework within which more detailed planning can take
          place in order to advance the long-term goals set out in the NDP.
    iv    Creating a basis for making choices about how best to use limited resources.

The main priorities are as follows:

              •       Uniting all South Africans around a common programme to achieve prosperity and
                      equity
              •       Promoting active citizenry to strengthen development, democracy and accountability
              •       Bringing about faster economic growth, higher investment and greater labour
                      absorption
              •       Focusing on key capabilities of people and the state
              •       Building a capable and developmental state
              •       Encouraging strong leadership throughout society to work together to solve problems

The National Spatial Development Perspective (NSDP) primary emphasis is to reconfigure spatial
relations and implement spatial priorities that meet the Constitutional directives of providing basic
services and alleviating poverty and inequality. The Joe Gqabi District is generally characterised by
medium environmental resource sensitivity and by low human need and economic activity. As outlined in
the District LED Strategy (UKDM 2009), the District and local municipalities (LMs) should focus on
encouraging the expansion of smaller rural nodes to create a critical mass for development, which should
in turn focus on specialising in key services unique to the area. Social investment, including social
transfers and skills development, together with basic infrastructural services, are recommended – a
coordinated development response, notably to human need, may be evidenced in the Integrated
Sustainable Rural Development Programme (ISRDP).

                                          SENQU DRAFT LED STRATEGY 2018-2038                                8
The National Framework for LED in South Africa identifies LED as a Key Performance Area (KPA) for local
government and sets out the roles and responsibilities of government in terms of LED. Framework strategies
include:
         ❑ Improve good governance, service delivery, public and market confidence in municipalities
            through an alignment of national, provincial and local programmes;

        ❑   Identify and exploit competitive advantage – more balanced development informed by a
            better understanding of local economic opportunities and constraints, achieved through
            spatial development planning and exploiting district (and metro) comparative and competitive
            advantages;

        ❑   Intensify enterprise support – SEDA should be the key vehicle for localised enterprise
            support;

        ❑   Sustainable Developmental Community Investment Programming, including building
            community and strong use of local procurement.
Local government is responsible for direct policy making (i.e. by-laws, proper rezoning of land,
administering policy programmes and projects, initiating economic development programmes). In
promoting LED the primary focus of local government is to: provide infrastructure and quality services;
manage spatial policies; ensure land use regulation and the administration of development applications;
manage service tariff policies; market the area; and manage a progressive property tax system.

Broad-Based Black Economic Empowerment Act (No. 53 of 2003) aims to substantially increase the
number of black (African, Coloured, Indian) people who have ownership and control of new and existing
enterprises, and the number of black people in executive and senior management positions. Among the
B-BBEE socio-economic strategies, the following are particularly relevant to this Plan: Preferential
procurement; and investment in black owned or managed enterprises.

National Small Business Act (No. 12 of 1996) provides a classification for SMMEs. The definition of a small
business, according to Act, provides for micro, very small, small and medium enterprises, by major
economic classes, according to employment, turnover and gross asset value.

Integrated Strategy on the Promotion of Entrepreneurship and Small Enterprises (2007) targets support to
priority areas and sectors as well as broadens support programmes and streamlining of support institutions.
National policies identified as relevant to entrepreneurship and small business development include the
National Industrial Policy Framework, which supports ASGISA and provides strategic direction for industrial
development (intensification and diversification into value-adding, labour-absorbing, knowledge economy)
together with key public sector principles with respect to the design and implementation of industrial and
sector policies. Other supportive national policies include: ASGISA; B-BBEE; the Micro-economic reform
strategy; the Draft Regional Industrial Development Strategy; National strategy for the development and
promotion of franchising in SA; Strategic framework on gender and women’s economic empowerment;
National youth enterprise strategy; Co-operatives policy and development draft strategy; and the Draft
strategy framework for forestry enterprise development.

South African Co-operatives Act (No. 14 of 2005) sets out legislation supporting co-operatives’
development in South Africa.

                                   SENQU DRAFT LED STRATEGY 2018-2038                                    9
4. Provincial Policy Framework

The Eastern Cape Vision 2030 is intended to mobilise all citizens and sectors of the Eastern Cape around
a common vision. It sets the development agenda and priorities for the next 15 years (2015-2030),
building on the Provincial Growth and Development Plan (PGDP) of 2004-2014.

The plan addresses the following priorities:

    i     Redistributive, inclusive and spatially equitable economic development and growth
    ii    Quality Health
    iii   Education, Training & Innovation
    iv    Institutional Capabilities

This set of priorities gives rise to the following five goals of the Vision 2030 PDP:

Goal 1: A growing, inclusive and equitable economy which seeks to ensure a larger and more efficient
provincial economy; more employment; and reduced inequalities of income and wealth.
Goal 2: A healthy population through an improved health care system for the Eastern Cape.
Goal 3: An educated, innovative citizenry.
Goal 4: Vibrant communities who make their own decisions unreliant on government.
Goal 5: Capable, conscientious and accountable institutions. This goal seeks to build capable, resilient
and accountable institutions to enable and champion rapid inclusive development.

The provincial priorities for 2017/18 have been pronounced as follows by the Premier of the Eastern
Cape:

    •     Development and implementation of a Provincial Spatial Development Framework, including
             o Small town revitalization

              o Local economic development
              o Integrated Human Settlements and
              o Improved roads network infrastructure
    •     Improved integration of government programmes and functional local government.
    •     Transforming agriculture (including aquaculture, fisheries and forestry)
    •     Improving the effectiveness of provincial institutions (departments and entities)
    •     Drive the seven-point education plan.
    •     Improving provincial infrastructure through the Rapid Response Team and the implementation
          of the 2030 Infrastructure Plan.
    •     ICT in province, including: Bhisho campus network; broadband and use of transversal contracts.
    •     Improve health profile of province (ECSECC,2017:6)

These priorities were all restated in the 2018 State of the Province address with an emphasis on
improving infrastructure particularly roads and infrastructure provision and delivery, improving skills
levels, improvement of the economy through various iniatives in the automobile, tourism and agricultural
sector, integrated planning between all spheres of government and stakeholders, promotion of food
security and lastly ensuring the safety and security of citizens (SOPA Feb 2018)

Spatial Development Plan (SDP) sets out broad framework for the investment of public funding and
management of development in the Eastern Province. The following principles are therefore adopted:

                                    SENQU DRAFT LED STRATEGY 2018-2038                                     10
o A focus on developing nodes and areas where economic opportunities and resources exist, or
where such opportunities can be stimulated
o Investment should be targeted into areas where the economic opportunities and returns are
greatest
o Inter-departmental investment linkages should be identified in order to maximize benefits
and achieve a coordinated effort
o Social expenditure on basic infrastructure for basic needs should be specified as spin-offs
from economic development investments, wherever possible.
The Eastern Cape Industrial Strategy focus is on key economic sectors, namely:
o Agro-processing (especially biofuels)
o Forestry and timber industries,
o Tourism and cultural industries
o Business process outsourcing (BPO)
o Construction
o Chemicals
o Metals processing
o Auto sector
o Clothing and textiles
Eastern Cape Rural Development Strategy asserts that “rural development must be a process where
people are involved in creating a different society, an inclusive process of animating self organisation.
Rural Development must thus be premised on mobilisation and organisation of people within
communities. Government systems and structures must support such forms of organisation, and create
an environment where people’s own development and organisation can thrive.” (Draft Eastern Cape
Rural Development Strategy: pp 9).
The pillars of the Rural Development Strategy are:
· Land reform,
· Agrarian transformation and food security,
· Non-farm rural economy,
· Infrastructure,
· Social and human development
· Enabling environment
With particular reference to the development of the local economy in Joe Gqabi DM, the Strategy seeks
to:
· Reduce the barriers to economic development due to land tenure –
o Facilitate the acceleration of land redistribution for sustainable rural development;
o Facilitate access to tenure security that creates socio-economic opportunities for people
living and working on farms and in communal areas;
o Facilitate access to rights in land, including land ownership and sustainable
development;
· Provide an environment which is pro-poor and LED-enabling:
o Provide efficient state land management that supports social and economic
development;
o Accelerate participation, equity and productivity in agricultural development
o Facilitate and support access to markets and distribution channels for rural farmers
o Provide water and sanitation infrastructure to rural areas
SENQU DRAFT LED STRATEGY 2018-2038 11o Facilitate accelerated access to energy
o Co-ordinate and ensure access to quality services
· Create economic opportunities for sustainable livelihoods through non-farm activities, including:
o Agro-processing
o Forestry
o Marine and in-land fisheries
o Tourism
o Other LED and small-scale initiatives
o Improve rural roads, transport and logistics network
The Eastern Cape Provincial Industrial Development Strategy (PIDS) has 3 strategic imperatives:
· Economic Growth: Increasing economic growth through strengthening of existing sectors and
investment into new high potential industrial sectors, coupled with state investment in
infrastructure.
· Labour Absorption: Improved labour absorption through skills development, especially for the
youth, and through spatial spread of sectors, especially manufacturing industry.
· Job Retention: The net retention of existing jobs through the development of sectoral industrial
policies and strategies and through the utilization of bridging and retraining strategies in
declining industries.
Six priority sectors have been identified:
· Ago-processing
· Petro-chemicals
· Automotive
· Tourism
· Capital goods
· Green industries – renewable energies
Within JGDM, the agro-processing, tourism, capital goods and green energies sectors are likely to be the
most relevant.
Eastern Cape Jobs Strategy has 5 pillars, namely:
· Retain existing jobs
· Stimulate new jobs in priority sectors
· Build our social economy
· Increase the pace of Provincial economic infrastructure investments in critical areas
· Radically improve our skills development processes.
Similar to other strategies, the Jobs Strategy highlights the following areas of comparative advantage for
the Eastern Cape, and indeed the JGDM:
· Agriculture and animal husbandry
· Fishing and aquaculture
· Minerals
· Energy
· Forestry
· Tourism
The JGDM is immediately positioned to take advantage of 3 out of 6 of these priority areas. Agriculture,
forestry and tourism have already been identified as potentially catalytic sectors on which to focus. In
SENQU DRAFT LED STRATEGY 2018-2038 12addition, there is scope to consider the development of aquaculture – especially trout – in the District
(JGDM LED Strategy, 2014:18)
The Eastern Cape Tourism Master Plan2009-2014 highlights 8 areas of intervention which are critical
when seeking to grow the tourism sector in the Eastern Cape, namely:
· Tourism product development
· Tourism marketing
· Human resource development
· The development of tourism relevant infrastructure
· Transformation of the tourism sector
· Tourism research and information
· Tourist safety and security
· Management of the tourism sector
LED Implementation at a Provincial Level
At a provincial level, the primary drivers of LED are the Departments of Economic Affairs, Environment
and Tourism (DEAET) and Agriculture. The Eastern Cape Development Corporation (ECDC) is also a
strategic partner herein (JGDM LED Strategy,2014:19-20).
5. District Policy Framework
The JGDM LED Strategy 2014 has the following goals:
❑ Goal 1: Grow priority sectors namely agriculture (including Forestry), agro-processing,
trade and tourism (Maintain current agricultural employment levels; Grow employment
in trade)
❑ Goal 2: Improve government capacity (Allow for only 12% vacancy rate in all government
institutions situated in JGDM)
❑ Goal 3: Stimulate economic growth through government and private sector investment
(Maintain current levels of government investment in JGDM to 2012, increasing to 2%
annually between 2012 and 2014; Match provincial economic growth rate ultimately
reaching a 4-5% growth rate)
❑ Goal 4: Environmental sustainability (Ensure that at least 10% of critically endangered,
endangered and vulnerable vegetation is formally conserved)
These goals and objectives are aligned into five strategic pillars, with associated programmes and
projects, as follows: Infrastructure Investment; Institutional Development; Investment Promotion; Sector
Development; and Environmental Management. Further, the LED Strategy argues that, in order to realise
the District vision and objectives, it is essential that an environment conducive to growth be created
which involves activities that both tackle constraints boost economic activity.
The 2007 District GDS Summit was convened following the National GDS, in June 2003, and the Eastern
Cape Job Summit, in February 2006, resulting in the GDS agreement, signed by key stakeholders, in line
with the national framework, notably ASGISA. The GDS Agreement is based on eight key anchor projects,
or priority programmes, which are in turn informed by, and related back to, the District IDP, targeted at
SENQU DRAFT LED STRATEGY 2018-2038 13driving growth and development in the District over the next five to ten years. The eight anchor
programmes are:
❑ The timber cluster development programme
❑ Maximizing tourism potentials in the District area
❑ Development programme for maximizing agricultural potentials
❑ Eradication of backlogs in water and sanitation
❑ Service upgrading in primary and secondary towns, key rural nodes and mobility corridors
❑ Improvement of access and linkages to basic services to support the economy
❑ Creation of a secure social safety net
❑ Governance and administration development programme
The District IDP is directed towards the JGDM’s vision of “An improved quality of life for all residents”
and its mission to “Fight poverty through stimulating the economy and by meeting basic needs,
improving service delivery quality and capacitating government and communities within a sustainable
environment.” The IDP aims to change the economic direction of the District, to bring in more investment
to the area, thereby impacting on poverty through job retention as well as job creation. The IDP looks at
the District economy as a whole and aims for a collective effort across sectors, departments and spheres.
An integral component of the IDP is the District SDF. Both the IDP and SDF are very closely aligned to the
PGDP, as well as being informed by the District GDS and the Rural Development Strategy.
The 2009 District Tourism Marketing and Development Plan is directed towards the vision “To develop
the district to become a leading tourist destination where all tourists can experience its unique natural
and cultural heritage in a secure and unspoiled environment, and where the tourism sector operates in a
coordinated, integrated and all inclusive manner for the benefit of all citizens.” Accordingly, the Plan’s
tourism mission is to:
o Provide an enabling environment in which the District tourism industry can thrive and as
a result benefit all citizens within the District.
o Facilitate and coordinate the management and development of the tourism sector in the
District in conjunctions with all key tourism stakeholders.
o Source appropriate funding for desired tourism development projects.
o Ensure institutional alignment of tourism plan with other programme and policy
documents.
o Strategically invest in the sector in order to enhance the value of tourist attractions
within the District, by providing adequate infrastructure and promoting the District as a
tourism destination.
To achieve this vision and mission, the Plan focuses on five areas, with associated objectives, of: Tourism
product development; Marketing and branding; Infrastructure development; Human resource
development; and the Creation of an enabling environment.
The overarching goal of the Southern Drakensberg Development Strategy is to improve the quality of life
of individuals in the eastern portion of the District, while the Strategy’s primary objective is to investigate
the opportunity to sustainably unlock the region’s economic potential while further aiming to strengthen
the environmental sustainability of IDPs and SDFs and addressing key structural and systems issues
inhibiting the economic potential of the area (JGDM LED Strategy2014: 23- 24).
SENQU DRAFT LED STRATEGY 2018-2038 14CHAPTER 2: SENQU CONTEXTUAL ANALYSIS
1.Introduction
Senqu Municipality (EC 142) is a landlocked, mountainous to undulating area adjoined, to the west and
east respectively, by the JGDM municipalities of Walter Sisulu and Elundini. It shares its northern border
with Lesotho and the Free State Province, while the Chris Hani Municipalities of Sakhisizwe and
Emalahleni lie to the south.
Map 1 Senqu Municipality Locality Map
Source: Demarcation Board 2017
Senqu extends over 7329.5km2, making it the second largest municipal area in the District. The Senqu
Local Municipality is comprised of a portion of the former Cape Border region as well as the former
Transkei Sterkspruit/Herschel magisterial district which is now designated as traditional authority land,
accounting for almost one quarter of municipal land, and is home to the majority of the local population.
Senqu is essentially rural in nature – developed urban land accounts for little over one percent of
municipal land – and claims no major urban economy, although it is home to the administrative seat of
the JGDM, being the town of Barkly East (including Nkululeko, Fairview, Lulama Hlanjwa). Other towns
include Sterkspruit, the major urban node of the area, and Lady Grey (including Transwilger, Kwezi
Naledi). Senqu’s major rural hamlets are Rhodes (incorporating Zakhele) and Herschel, together with and
85 remote rural villages situated in the foothills of the Maluti Mountains and Southern Drakensberg range
including Rossouw. (Senqu IDP 2011).
SENQU DRAFT LED STRATEGY 2018-2038 151. Socio-Economic Indicators
2.1 Population Dynamics
Senqu Municipality has a population of 134 150 which has grown to 140,720 (Statsaa, 2016). This makes it
the most populous municipality in the Joe Gqabi district. This slight increase in population is due to births
but it is not a significant increase. It is only a 1 % increase. The Eastern Cape in total in 2015 only has a
population of 6 916 200 which makes up 12,6% of the national total (StatsaaStatssa 2016). Provincially, for
the period 2011–2016 it is estimated that approximately 243 118 people will migrate from the Eastern
Cape (Statsaa 2016).
Household numbers are increasing from 33 904 (2001) to 38 046 (2011) with a slight drop to 35 597 in 2016
(Statssa,2016). This is due to the effects of urbanisation and participation in a world economy which means
that the cost of large families and households are prohibitive. This is shown in the statistics which show that
the average household size has dropped from 4 in 2001 to 3.5 in 2011 and 4 in 2016 (Statssa,2016).
Table 2: Average Household Size
Total population No of H/holds Average h/hold size
Municipality
1996 2001 2011 1996 2001 2011 1996 2001 2011
Joe Gqabi 324118 336413 337853 71162 84835 97775 4.6 4 3.5
Elundini 134077 135389 131656 29549 33209 37854 4.5 4.1 3.5
Senqu 129673 134326 131981 28056 33904 38046 4 4 3.5
Walter
60369 66698 74216 15557 17722 21875 4.5 3.8 3.4
Sisulu
EC Total 6036337 6163009 6246143 1303287 1481640 1687385 4.6 4.2 3.7
Source: StatsaaStatssa Census 2011
“Between 2006 and 2016 the population growth averaged 0.33% per annum which is significant lower
than the growth rate of South Africa as a whole (1.54%). Compared to Joe Gqabi's DM average annual
growth rate (0.65%), the growth rate in Senqu's population at 0.33% was about half than that of the
district municipality (SERO,2017:10)”
“Senqu's population is projected to grow at an average annual rate of 0.9% from 142 000 in 2016 to 148
000 in 2021 (SERO,2017:11).” The population projection shows an estimated average annual growth rate
of 0.9% between 2016 and 2021 against the “average annual growth for Joe Gqabi District Municipality,
Eastern Cape Province and South Africa at 1.1%, 1.0% and 1.4% respectively (SERO,2017:12)”.
2.2 Human Settlements
Senqu is a predominantly rural area, characterised by small settlements, limited urbanisation and
subsistence agriculture. The majority (85.74%, 2001 Census) of households are rural in nature, including
rural villages and farm households and the overwhelming majority (93.27%) of the local population live in
SENQU DRAFT LED STRATEGY 2018-2038 16the Sterkspruit sub-region. This dynamic is shifting with urban in-migration where “people are moving to
live in villages which are expanding towards the urban centre of Sterkspruit. The concept of a rural
countryside with scattered homesteads is disappearing.” (Senqu IDP 2011).
2.3 Gender and Age
Table 3: Population by gender.
Male Female Total
Senqu 66,400 75,400 142,000
Elundini 70,300 74,700 145,000
Walter Sisulu 41,800 44,200 86,000
Joe Gqabi 178,000 194,000 373,000
Source: IHS Markit Regional eXplorer version 1156
The male/female split in population was 88.1 males per 100 females in 2016. The Municipality has more
females (53.17%) than males due to high out migration of males looking for work due to historical factors.
In total there were 75 400 (53.17%) females and 66 400 (46.83%) males which differs to the district
average of females being 52.12% (Ecsecc,2017:13).
Chart 1. Population Pyramid 2016 vs 2021
SENQU DRAFT LED STRATEGY 2018-2038 17The population pyramid shows that in the future there is a decrease of young potential work force aged
between 20 to 34 from 27.9 % to 25.7 % as well as a decrease of young children aged between 0 to 14
years from 32.7 % to 31.4%. However, the fertility rate is expected to increase. (Ecsecc, 2017:13).
The largest population group is between 0-14 years of age who make up 32.7 % of the population
followed by age 22 to 44 at 27.9 % and then youth (15-24). This share of population is within the babies
and kids (0-14 years) age category with a total number of 46 400 or 32.7% of the total population. The
age category with the second largest number of people is the young working age (25-44 years) age
category with a total share of 27.9%, followed by the teenagers and youth (15-24 years) age category
with 26 800 people (Ecsecc,2017:14). This indicates a very youthful population that the LED Strategy
needs to find employment opportunities for in the future.
A comparison between the Senqu population pyramids of 2006 and 2016 indicate that persons aged 20-
34 increased from 24.8 % in 2006 to 27.9 % in 2016 whilst persons aged 0-14 decreased from 2006 to
2016 from 34.2 % to 32.7 %. The difference between male and female populations was small at 12.5 % for
females and 12.3 % for males in 2016 unlike in 2006 where males formed 13.3 % of the population with
females 14.6 % (Ecsecc,2017:15). If the population of 2016 is compared with that of South Africa as a
whole it shows that there is a higher fertility rate in the municipality and that the number of children
aged 0-14 years is larger at 32.7 % as opposed to 29.2 % (Ecsecc,2017:15).
2.4 Population by population group, gender, age and households
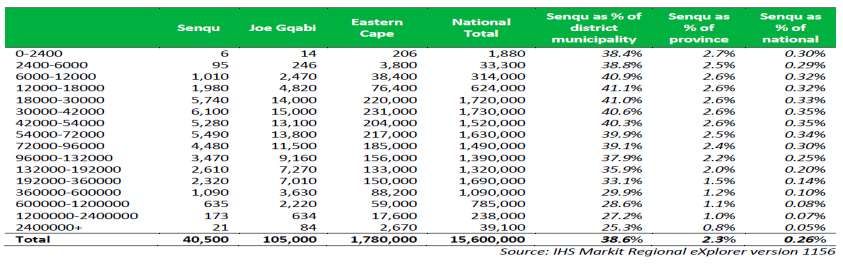
In 2016, the Senqu Local Municipality comprised of 40 500 households which is an average annual growth
rate of 1.15% in the number of households from 2006 to 2016. The average household size in the Senqu
Local Municipality is decreasing from approximately 3.8 individuals per household to 3.5 persons per
household in 2016 (Ecsecc,2017:17).
The composition of the households by population group shows that Africans are the largest group of
97.3% followed by whites at 1.2% and then Coloureds at 0.9%. The smallest population group by
households is the Asian population group with only 0.6% in 2016 (Ecsecc,2017:17).
SENQU DRAFT LED STRATEGY 2018-2038 18You can also read


