Fairhaven Economic Development Plan - Town of Fairhaven FXM Associates - Mass.gov
←
→
Page content transcription
If your browser does not render page correctly, please read the page content below
Fairhaven Economic Development Plan

              Prepared for

          Town of Fairhaven

               Prepared by

            FXM Associates

             December 2017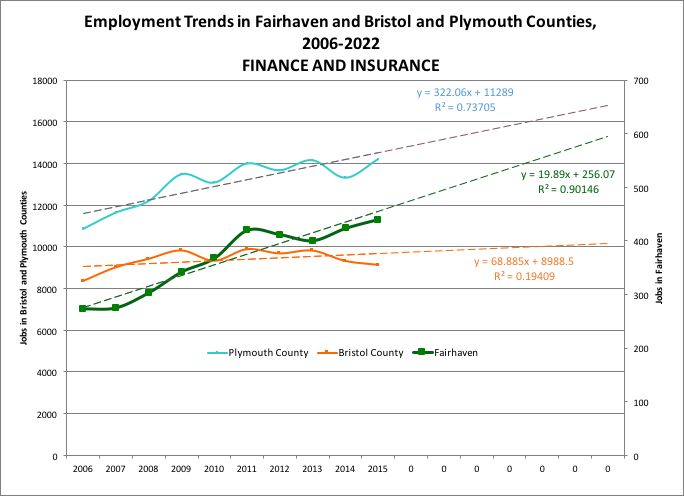
FXM Associates

                                  Contents

Section                                      Page

Introduction                                 3

Summary Findings                             4

Market Conditions and Trends                 5

Competitive Position                         28

Shared Workspaces                            39

Marketing                                    44

Funding Sources                              47

Appendices
    A. Shared Workspace Examples             51
    B. Highlights of Interviews              58
    C. Rental Housing Demand                 60
    D. Economic Development Goals            69

Fairhaven Economic Development Plan               2
FXM Associates
Introduction
FXM Associates has been retained by the Town of Fairhaven to prepare an
Economic Development Plan. The project has been funded by a grant from the
Massachusetts Community Compact Program. The Plan includes:
An assessment of market conditions and trends affecting potential job creation
and retention based on historical and projected growth in Fairhaven and the
larger market area comprising Bristol and Plymouth Counties, as well as trends
in net absorption of office, retail, and wholesale/industrial space in a real estate
submarket comprising Fairhaven and nearby Southcoast communities.
An assessment of Fairhaven’s competitive position with respect to taxes and
education, and the perceptions of developers and other interviewees on the
Town’s permitting processes compared to those in nearby communities.
A detailed analysis and discussion of potential opportunities for shared
workspaces. This subset of broader economic development potential was
selected for special attention by the Town’s Economic Development Committee,
based on inquiries received by local business and property owners and the
potential for such uses to reoccupy vacant and underutilized commercial space.
Discussion of potential marketing initiatives to promote and support economic
development in Fairhaven, and potential funding sources for additional economic
development initiatives.
Appendices including results of FXM’s Housing Demand Model, additional
information on shared workspaces, and a synopsis of the 12+ confidential
interviews conducted by FXM senior staff.
On September 9, 2017, FXM staff met with the Economic Development Committee
to kick off the project and to discuss key issues affecting economic development in
Fairhaven, objectives for the project, and potential contacts for interviews. The
Committee subsequently sent a list of potential contacts to FXM. A dozen
confidential personal interviews were completed. The Appendix section of this
report contains a synopsis of the key points made by the interviewees.
On November 16, 2017, FXM staff met with the Economic Development Committee
to present work in progress and to discuss the Goals and Objectives for economic
development articulated in the Town’s draft Master Plan, and/or other appropriate
goals for economic development. The Committee agreed to adopt the Master Plan’s
Goals for economic development with the exception of the waterfront component
(Goal 1), which they proposed to re-word. The Goals as accepted by the Committee
are included as Appendix D.
Fairhaven Economic Development Plan 3FXM Associates
Summary Findings
The prevailing sentiment among members of the Economic Development
Committee and businesses, developers, and property owners interviewed is that
Fairhaven should focus on helping existing businesses grow rather than
expending substantial effort to try to recruit outsiders. Examples include
maintaining the working waterfront and facilitating the retention as well as
expansion needs of successful restaurants and retailers and the emerging health
care sector. The latter could provide more jobs for local residents with
expanded workforce training in concert with existing workforce training
providers and community colleges.
Opportunities exist, based on historical and projected growth in jobs, as well as
declining vacancy rates in existing office space, to develop additional office
space in Fairhaven. Shared workspaces offer particular promise for reuse of
vacant and underutilized commercial buildings.
Prospects for reuse of vacant or underutilized buildings and buildable spaces,
now and in the foreseeable future, are most likely to be realized with zoning
changes that enable further office space development and mixed
residential/commercial uses.
Demand exists for market rate rental housing (especially of higher density) and
developing such housing could attract a skilled labor force from a broader area
as well as offer opportunities for younger households and empty nesters to
remain in Fairhaven.
Interviews revealed general satisfaction by businesses and developers with
Town permitting processes.
Fairhaven has a relatively high commercial tax rate compared to most nearby
communities, but substantially lower than that of New Bedford, which is
considered its chief competitor for development. The Town’s relatively low
residential tax assessments, rates, and per capita levies are a distinct
competitive advantage for attracting a skilled labor force.
Marketing content via a new or expanded website for economic development
should highlight the Town’s superior regional transportation accessibility and
infrastructure, population and economic stability, diversified businesses and
employment, cultural and recreational resources, and relatively affordable
housing with low tax rates.
Fairhaven Economic Development Plan 4FXM Associates Market Conditions and Trends This section includes analyses of demographic and business characteristics, comparing key population, household, workforce, and industry attributes in Fairhaven with those of Bristol and Plymouth Counties as well as Massachusetts overall. Prospective developers and businesses use these kinds of profiles when comparing alternative locations for investment. Additionally, the analysis can reveal where public and private sector economic development initiatives may be useful to enhance a community’s competitive profile. Historical and projected changes in employment by industry are then analyzed, given that job growth is typically the most reliable indicator of an industry’s strength in any community or region. Such analyses point out those industries with a local competitive advantage whose ability to add jobs might be enhanced with public or private initiatives such as infrastructure, workforce training, zoning changes, expedited permitting, or other actions. Projected growth in employment by industry is then translated into potential demand for space of a type suitable to accommodate growth in a given industry. The employment-driven space demand forecast is augmented by analysis of trends in the inventory, vacancies, net absorption, and lease prices in the local supply of office, retail, and wholesale/industrial space. This is the type of analysis done by or for virtually all prospective real estate developers, and the proprietary data source used by FXM (Co Star Property Information Systems) is the most comprehensive and widely used by real estate professionals. Because retailing is an important sector in Fairhaven, providing both jobs and tax revenues, FXM performed a retail opportunity/surplus analysis to show current leakage of consumer spending by store type and to identify prospective opportunities for additional retail development. Demographic and Business Characteristics The following section highlights demographic and business characteristics, comparing Fairhaven to Bristol and Plymouth Counties and Massachusetts overall. Fairhaven Economic Development Plan 5
FXM Associates

Population & Household Growth Compared

Demonstrated by the growth rates below, population and household growth in
Fairhaven lags considerably behind growth in both Bristol and Plymouth Counties,
and in the rest of the Commonwealth. Economic growth is closely tied to growth in
population and households, as local residents comprise the demand for goods and
services in the town and serve as a source of labor for town businesses.

                                                      Table 1

            Population                   Fairhaven            Bristol County        Plymouth County          State of MA
2022 Projection                            16,107                 573,266               533,071               7,103,376
2017 Estimate                              15,897                 559,805               515,428               6,861,490
Estimated Growth 2017-2022                 1.32%                   2.40%                 3.42%                  3.52%
Estimated Growth 2010-2017                 0.20%                   2.10%                 4.14%                  4.79%

           Households            Fairhaven     Bristol County Plymouth County                                State of MA
2022 Projection                    6,851          224,513         198,460                                     2,787,185
2017 Estimate                      6,736           218,711        190,870                                     2,682,402
Estimated Growth 2017-2022         1.71%            2.65%          3.98%                                        3.91%
Estimated Growth 2010-2017         1.00%            2.68%          5.38%                                        5.31%
Source: Environics Analytics, Spotlight, 2016, and FXM Associates

Household Incomes Compared

While incomes in Fairhaven are below the average incomes for Bristol and Plymouth
Counties as well as the rest of the state, the median is higher than Bristol County’s,
and the town’s poverty rate is lower than that of the Bristol County and
Massachusetts. The income data show a clear delineation between Fairhaven and
Bristol County on the one hand and Plymouth County and the State of
Massachusetts on the other. The town is more like surrounding Bristol County than
it is like bordering neighbor Plymouth County.

                                                      Table 2
                                              Fairhaven            Bristol County       Plymouth County       State of MA
                                          #               %         #          %           #       %          #         %
2017 Estimated Household Incomes
  Less than $25,000                      1468         22%         48,722       22%       27,422    14%    505,882     19%
  More than $150,000                     713          11%         27,294       12%       37,874    20%    517,798     19%
2017 Families by Poverty Status
  Families Below Poverty                 261          6.2%        14,257       9.8%      7,777     5.8%   140,682    8.4%
  Families Below Poverty with Children   161          3.8%        10,513       7.2%      6,171     4.6%   106,438    6.3%
                                                                    Bristol      Plymouth         State of
                                                  Fairhaven
                                                                    County        County            MA
2017 Estimated Average Household
                                                    $76,675        $81,616          $104,884 $102,378
Income
2017 Estimated Median Household
                                                    $62,929        $60,649            $79,189     $72,671
Income

Fairhaven Economic Development Plan                                                                                         6
FXM Associates
Workforce Characteristics
Workforce characteristics bear out the indications of the above income data.
Education levels in Fairhaven mirror those of Bristol County, and both are
considerably lower than those in Plymouth County and statewide. Fairhaven and
Bristol County have almost twice the proportion of people with less than a high
school diploma as have Plymouth County and the state and smaller proportions of
college graduates. The workforces in both Bristol County and Fairhaven are
relatively more blue-collar than those in Plymouth County and the rest of the state.
Vehicle ownership is similar across all geographic areas.
Table 3
Fairhaven Bristol County Plymouth County State of MA
# % # % # % # %
Education (Pop. Age 25 +)
Less than high school diploma 1,784 15% 68,056 17% 27,586 8% 493,613 10%
Bachelor's degree or higher 3,041 25% 99,461 25% 120,457 34% 1,925,651 40%
Occupation (Pop. Age 16 +)
White Collar 4,663 56% 159,229 58% 163,891 63% 2,322,054 67%
Blue Collar 1,816 22% 59,289 22% 45,696 17% 540,157 15%
Service and Farming 1,789 22% 54,930 20% 51,948 20% 627,817 18%
2017 Est. Households by Number
of Vehicles
No Vehicle 637 9% 23,010 11% 11,854 6% 334,370 12%
One Vehicle 2,335 35% 75,548 35% 59,531 31% 972,376 36%
Source: Environics Analytics Spotlight, 2016 (estimates updated from 2010 US Census)
Data in the following table show the proportion of the workforce (residents of
Fairhaven) by occupational classification compared to Bristol and Plymouth Counties
and Massachusetts overall. Noteworthy in this comparison is that, in spite of a high
concentration of health care jobs in town (see following business profile discussion)
Fairhaven Economic Development Plan 7FXM Associates
the proportion of residents employed in “Health Care Practitioner/Technician” is less
than in the counties and state overall, while “Health Support” is only slightly higher.
Table 4
Bristol Plymouth State of
Sector Fairhaven County County MA
Architecture/Engineering 1.6% 1.7% 1.5% 2.2%
Arts/Design/Entertainment/Sports/Media 1.0% 1.7% 1.8% 2.2%
Building/Grounds Cleaning/Maintenance 3.3% 3.2% 3.5% 3.5%
Business/Financial Operations 3.2% 4.1% 5.5% 6.0%
Community/Social Services 3.1% 1.7% 1.8% 2.0%
Computer/Mathematical 2.2% 2.4% 2.3% 3.8%
Construction/Extraction 5.1% 5.6% 5.2% 4.3%
Education/Training/Library 6.3% 6.0% 6.2% 7.2%
Farming/Fishing/Forestry 1.5% 0.5% 0.2% 0.3%
Food Preparation/Serving Related 6.4% 5.6% 6.4% 5.6%
Healthcare Practitioner/Technician 5.4% 5.7% 6.8% 6.4%
Healthcare Support 4.5% 4.2% 3.5% 2.7%
Installation/Maintenance/Repair 2.9% 3.2% 2.8% 2.4%
Legal 1.2% 0.8% 1.2% 1.4%
Life/Physical/Social Science 0.9% 0.7% 0.8% 1.8%
Management 9.5% 8.9% 10.5% 11.2%
Office/Administrative Support 12.9% 14.2% 13.3% 12.5%
Production 6.2% 6.9% 4.2% 4.4%
Protective Services 2.0% 2.7% 2.7% 2.2%
Sales/Related 9.3% 10.3% 11.2% 10.0%
Personal Care/Service 4.0% 3.9% 3.5% 3.7%
Transportation/Material Moving 7.7% 6.0% 5.3% 4.4%
Source: Environics Analytics Spotlight, 2016 (estimates updated from 2010 US Census)
Fairhaven Economic Development Plan 8FXM Associates
Housing Characteristics
The proportion of those in Fairhaven who own their homes is higher than in Bristol
County and in the state as whole. Additionally, the proportion of Fairhaven’s
housing stock built before 1939 is virtually the same as that in Bristol County and
the state. Fairhaven’s median home values are the lowest of those in all three
geographic areas examined, a possible advantage in attracting new residents.
Table 5
Fairhaven Bristol County Plymouth County State of MA
# % # % # % # %
Tenure (Occupied Housing
Units)
Owner-Occupied 4,852 72% 137,039 63% 145,377 76% 1,667,112 62%
Renter-Occupied 1,884 28% 81,672 37% 45,493 24% 1,015,290 38%
2017 Est. Housing Units by Year
Structure Built
Built 2010 or Later 219 3% 8,667 4% 12,517 6% 170,978 6%
Built 2000 to 2009 362 5% 17,216 7% 19,683 9% 219,300 7%
Built 1990 to 1999 557 7% 21,561 9% 18,662 9% 214,738 7%
Built 1939 or Earlier 2,589 34% 79,281 33% 47,179 22% 938,630 32%
Plymouth
Fairhaven Bristol County State of MA
County
2017 Est. Median All Owner-
$288,083 $306,041 $365,821 $369,832
Occupied Housing Value
Source: Environics Analytics Spotlight, 2016 (estimates updated from 2010 US Census)
Fairhaven Economic Development Plan 9FXM Associates
Fairhaven Business Profile
The table below shows establishments, jobs and sales by major industry group in
Fairhaven. 1 The greatest number of jobs in Fairhaven are in Health Care and Social
Assistance (primarily health care) followed by Retail Trade, Accommodation & Food
Services (hotels/motels and restaurants) and Manufacturing.
Table 6
Sectors Total Jobs Establishments Sales (000s)
11: Agriculture, Forestry, Fishing and Hunting 247 2 $1,342
23: Construction 533 75 $52,544
31-33: Manufacturing 927 77 $53,886
42: Wholesale trade 114 22 $131,701
44-45: Retail trade 1226 99 $185,587
48-49: Transportation and warehousing 68 121 $317,288
51: Information 88 13 $59,426
52: Finance and insurance 440 51 $43,738
53: Real estate and rental and leasing 24 28 $9,226
54: Professional, scientific, & technical svcs 441 57 $33,026
55: Management of companies and enterp 130 N/A N/A
56: Admin&supp. and waste mgt &remed. svcs 503 22 $13,061
62: Health care and social assistance 2311 154 $112,916
71: Arts, entertainment, and recreation 228 15 $17,058
72: Accommodation and food services 1028 63 $48,220
81: Other services (except pub admin) 513 93 $20,608
92: Gvt and gvt enterprises 653 32 N/A
TOTAL All Industries 9496 811 $1,352,219
Source: Massachusetts Department of Labor and Workforce Development, ES202 Reports,
2016, US DOC Regional Economic Information System, & Environics Analytics
1
The employment data shown in this report do not necessarily correspond to the jobs by
industry data in other reports. For example, the MassDOL ES202 data series counts only
those jobs covered by unemployment insurance, thereby excluding self-employed persons.
FXM uses another data source, the US Department of Commerce, Bureau of Economic
Analysis, Regional Economic Information System to adjust upward by industry the ES202
numbers to include self employed persons.
Fairhaven Economic Development Plan 10FXM Associates
The next table compares the distribution of employment in Fairhaven with the
overall distribution of jobs in Bristol and Plymouth Counties, ordered by their two-
digit North American Industry Classification System (NAICS) codes. The
percentages listed in each column indicate what proportion of the total jobs in the
given geography is employed in that industry. For example, 24.3% of the total jobs
in Fairhaven are designated as Healthcare & Social Assistance, compared to 17.6%
in Bristol County overall and 14% in Plymouth County. The industries and numbers
that are bolded are industries in which the proportion of total jobs in Fairhaven
exceeds the distribution of total jobs in Bristol and Plymouth Counties overall.
Fairhaven may have a comparative advantage in those industries evidenced by
their relatively high concentration. Those potentials and others are further explored
in the section on employment trends and projections.
Table 7
Fairhaven Bristol County Plymouth County
11- Forestry, fishing, and related activities 2.6% 1.3% 0.6%
23-Construction 5.6% 6.5% 7.9%
31-33-Manufacturing 9.8% 9.9% 4.6%
42-Wholesale trade 1.2% 0.0% 3.5%
44-45-Retail trade 12.9% 14.7% 12.3%
48-49-Transportation and warehousing 0.7% 0.0% 2.7%
51- Information 0.9% 1.5% 1.0%
52-Finance & Insurance 4.6% 3.5% 5.5%
53-Real estate and rental and leasing 0.5% 4.1% 4.7%
54-Professional, scientific, & technical svcs 4.6% 5.1% 6.6%
55-Management of companies and enterp 1.4% 1.3% 1.6%
56-Admin&supp. and waste mgt &remed. svcs 5.3% 5.8% 4.9%
62-Health care and social assistance 24.3% 17.6% 14.0%
71-Arts, entertainment, and recreation 2.4% 2.2% 2.9%
72-Accommodation and food services 10.8% 8.5% 7.9%
81-Other services (except pub admin) 5.4% 6.4% 6.6%
92-Gvt and gvt enterprises 6.9% 11.7% 12.7%
92-Gvt and gvt enterprises 11.3% 12.6% 12.3%
Source: Massachusetts Department of Labor and Workforce Development, ES202 Reports,
2016, US DOC Regional Economic Information System, 2016, and FXM Associates
Fairhaven Economic Development Plan 11FXM Associates
Wages in Fairhaven lag behind those statewide in most sectors. However, wages in
Fairhaven’s Agriculture, Forestry, Fishing, and Hunting (primarily fishing) are
significantly higher than industry-wide averages for the county and state as are
wages in Transportation and warehousing. Fairhaven’s average wages in
Manufacturing, Professional services, and all Industries combined are greater than
in Bristol County overall.
Table 8
Town as % Town as % Bristol State of
Sectors Fairhaven
of County of State County Massachusetts
11: Agriculture, Forestry, Fishing and Hunting $149,240 159% 264% $94,016 $56,576
23: Construction $55,848 91% 77% $61,256 $72,228
31-33: Manufacturing $78,000 119% 90% $65,728 $86,372
42: Wholesale trade $43,160 57% 46% $75,816 $93,548
44-45: Retail trade $24,336 83% 75% $29,224 $32,344
48-49: Transportation and warehousing $58,448 127% 110% $46,124 $53,144
51: Information $54,912 89% 52% $61,828 $105,768
52: Finance and insurance $48,984 75% 34% $64,896 $144,612
53: Real estate and rental and leasing $37,284 81% 50% $46,228 $74,568
54: Professional, scientific, & technical svcs $85,800 111% 71% $77,116 $121,160
55: Management of companies and enterp $54,933 37% 42% $147,160 $130,780
56: Admin&supp. and waste mgt &remed. svcs $30,472 92% 67% $33,228 $45,448
62: Health care and social assistance $44,304 101% 81% $43,992 $54,600
71: Arts, entertainment, and recreation $15,340 69% 41% $22,152 $37,284
72: Accommodation and food services $15,756 87% 67% $18,096 $23,348
81: Other services (except pub admin) $27,768 104% 76% $26,780 $36,348
92: Gvt and gvt enterprises $64,067 101% 88% $63,388 $73,060
Average All Industries $51,064 107% 76% $47,788 $67,444
Source: Massachusetts Department of Labor and Workforce Development, ES202 Reports,
2016
Fairhaven Economic Development Plan 12FXM Associates Employment Trends This part of the report focuses on potential for growth in those parts of the economy which are likely targets for Fairhaven’s development. The measure most used for market trends analyses is employment because jobs are a good indicator of the current status and future direction of a given industry. . Increasing employment indicates industries that are growing, whether through expansion of existing businesses or opening of new ones. Also, reasonably reliable historic data are readily available and can be used to project employment trends are readily available. The two sources used here for the employment trends graphs are the ES202 reports from the Massachusetts Department of Labor and Workforce Development, modified by the more inclusive (because it includes self-employment data) reports from the Regional Economic Information System (REIS) of the U.S. Department of Commerce, Bureau of Economic Analysis. When using historical data to produce future projections, it is important to consider the reliability of a given dataset. The statistic used to signify the reliability of a given projection is called the R2 calculation, and is presented alongside each projection given below. The closer the R2 value is to 1, the better the predictive value of past performance. A limiting factor on 2017 projections is the influence of the 2008-9 recession, which is still being felt in some sectors and may also affect the R2 values. For example, a sector might be showing strong growth since 2011 but the volatility introduced by the recession could pull down the projected future growth and also lower the R2 value of the projection. Meanwhile, it is still too soon to know whether and how post-recession growth will be sustained. The following graphs display trends and projections for the Town of Fairhaven and Bristol and Plymouth Counties. Note that because of the size differences, the graphs should be read on two axes, the counties on the left and Fairhaven on the right. Fairhaven Economic Development Plan 13
FXM Associates
Figure 1 shows these data for all industries.
Figure 1
Although the R2 values for the projection lines are not very high for Fairhaven and
Plymouth County, they are high enough to suggest upward trends for both since
the recession. By contrast, Bristol County’s projection, with a stronger R2, indicates
likely decline.
Office-using industries are a potential target for more growth and development. For
the purposes of this analysis FXM has defined office-using sectors by NAICS codes:
Professional Offices, Non-medical
51–Information
52-Finance and Insurance
53-Real Estate and Rental & Leasing
54–Professional, Scientific, and Technical Services
55–Management of Companies and Enterprises
561-Administrative and Support Services
Fairhaven Economic Development Plan 14FXM Associates
Figure 2 shows trends and projections for all office-using industries.
Figure 2
Employment Trends in Fairhaven and Bristol and Plymouth Counties,
2006-2022:
OFFICE-USING INDUSTRIES
70,000 2,000
y = 758.8x + 54006
R2 = 0.9264
65,000 1,800
y = 52.433x + 1008.4
2
R = 0.706
60,000 1,600
Jobs in Bristol and Plymouth Counties
55,000 1,400
y = 507.34x + 49025
Jobs in Fairhaven
2
R = 0.634
50,000 1,200
45,000 1,000
Plymouth County Bristol County Fairhaven
40,000 800
35,000 600
30,000 400
2006 2007 2008 2009 2010 2011 2012 2013 2014 2015 0 0 0 0 0 0 0
Trends in all three areas are positive with R2 values above .5, making the
projections reasonably reliable.
Fairhaven Economic Development Plan 15FXM Associates
Among the office-using industries, Finance and Insurance shows particularly strong
growth potential in Fairhaven and Plymouth County. As shown in Figure 3, the R2
for Bristol County is very low, making that projection weak compared to the other
two areas. The absolute number of jobs in Fairhaven is low, but they are trending
upward.
Figure 3
Fairhaven Economic Development Plan 16FXM Associates
The Accommodation and Food Services sector shows potential in Fairhaven.
Restaurants are the main component of this industry. Figure 4 shows strong growth
potential since the recession, but the R2 for Fairhaven is low relative to the
counties. The Town might want to take measures to attract some of that county
growth to Fairhaven.
Figure 4
Fairhaven Economic Development Plan 17FXM Associates
The Manufacturing industry in Fairhaven is distinctive in that it has been growing
and shows potential for more growth, unlike in either Plymouth or Bristol County. In
Fairhaven, this sector includes Titleist, FootJoy, and shipbuilding and repair
businesses. Figure 5 shows the trends and projections.
Figure 5
Fairhaven Economic Development Plan 18FXM Associates
The Healthcare and Social Assistance industry employs the largest number of
residents in the Town of Fairhaven and in both counties. It also shows the strongest
growth potential across all three areas. By 2022, this sector will employ almost half
of Fairhaven’s workforce. Figure 6 shows the trends and projections:
Figure 6
Fairhaven Economic Development Plan 19FXM Associates
The Retail Trade sector bears attention, because although it is not growing in
Fairhaven, the sector remains important in terms of both total employment and
economic activity for the immediate area. Retail employment in Plymouth County is
holding its own, albeit with a very weak projection to 2022, Bristol County overall
shows a slight downward trend, while Fairhaven exhibits a marked downturn and
downward trend since 2006, as shown in Figure 7.
Figure 7
Employment Trends in Fairhaven and Bristol and Plymouth Counties,
2006-2022
RETAIL TRADE
45000 1,500
40000 1,400
y = -295.51x + 40088
2
R = 0.5232
Jobs in Bristol and Plymouth Counties
35000 1,300
y = 8.5818x + 31102
2
R = 0.0025
Jobs in Fairhaven
30000 1,200
25000 1,100
y = -21.139x + 1460.4
2
R = 0.8976
20000 1,000
Plymouth County Bristol County Fairhaven
15000 900
10000 800
2006 2007 2008 2009 2010 2011 2012 2013 2014 2015 0 0 0 0 0 0 0
Fairhaven Economic Development Plan 20FXM Associates
Space Demand Through 2022
The above employment projections, with their relevant caveats, can be translated
into estimates of future demand for commercial space. Table 9 compiles these
projections, with projected job losses shown in red.
Table 9
Projected Space Demand Through 2022 Based on Historical Employment Trends
Fairhaven Bristol County Plymouth County
Fairhaven % Fairhaven %
Projected Projected of Bristol Projected of Plymouth
Projected Space Demand Projected Space Demand County Jobs Projected Space County Jobs
Sector New Jobs (SF) New Jobs (SF) 2015 New Jobs Demand (SF) 2015
31-33-Manufacturing 109 58,415 (15,826) - 4% (2,233) - 8%
44-45-Retail trade (125) - (3,020) - 3% (573) - 4%
Office-using
51- Information (18) - (761) - 2% 95 23,824 4%
52-Finance & Insurance 154 38,623 1,041 260,144 5% 2,563 640,674 3%
53-Real estate and Rental and Leasing 44 10,936 730 182,509 0.4% 1,443 360,676 0.4%
54 - Professional, Scientific, & Technical 68 17,071 1,543 385,719 7% 355 88,762 5%
56-Administrative & Support;Waste Mgt&Remed. 127 31,727 2,236 558,935 3% 561 140,330 4%
Subtotal Office-using 375 98,357 4,788 1,387,307 5,017 1,254,267
61-Educational services* 0 0 327 424,596 0% (168) -
62-Health care and Social Assistance 1,226 490,599 8,598 3,439,103 5% 6,440 2,575,825 6%
71-Arts, Entertainment, and Recreation 71 28,491 376 150,349 4% 229 91,644 3%
72 - Accommodation & Food Services 14 2,527 764 134,553 5% 1,904 335,185 5%
92-Government & gov't enterprises 7 3,445 1,320 660,003 2% 1,204 602,233 2%
TOTALS 1,678 681,835 (2,673) 6,195,911 11,820 4,859,154
* ES202 reports showed no Educational Services employment for Fairhaven
Source: Massachusetts Department of Labor and Workforce Development, ES202 reports (adjusted by REIS); FXM Associates
In the above table, there appears to be a data problem for Educational Services in
Fairhaven. ES202 reports show no jobs in this sector, across all years reviewed, but
Fairhaven is home to a maritime educational institution that should have appeared
in this category.
In the table, office-using industries are grouped since they require similar kinds of
space. Note that job growth for Fairhaven in all office-using industries, except
Information, is expected to be positive. Healthcare and Social Assistance is a major
employer and growth industry across all three areas, with implications for demand
for commercial space.
Retail Opportunity Gap/Surplus Analysis
Another approach to assessing potential opportunities for expanding retailing is a
retail opportunity gap/surplus analysis, a tool used by major retailers and chain
restaurants to gauge market demand and competition within a specified geographic
area. It presents a snapshot of the current consumer spending on various retail
categories within a specified geographic area alongside actual retail store sales in
those same categories within the same geographic area. Where expenditures by
households in the market area exceed sales in that market area, a gap or
opportunity exists for stores within the market area to “capture” more of those
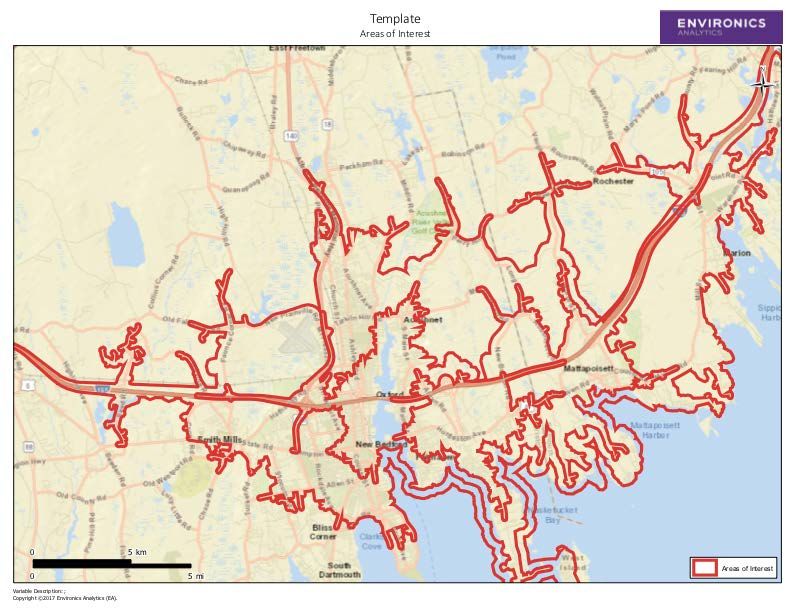
Fairhaven Economic Development Plan 21FXM Associates household expenditures. (This loss of potential sales is also called “leakage.”) Conversely, where market area household expenditures are less than actual sales categories, it indicates that stores in that retail category in the market area already attract consumer dollars from outside the market area and opportunities for additional retail activity are more limited. The retail gap/surplus analysis is a picture of current opportunities for retailers to newly locate or expand facilities based on a well-established principle drawn from empirical studies showing that people will typically purchase goods and services within the shortest available walk or drive time from where they live. The principle applies to comparable and competitive goods, services, and pricing: there is no guarantee of success based strictly on location advantage, which simply presents the opportunity. Retailers typically define market areas in terms of drive times, with a 15-minute drive time considered the maximum time consumers would be willing to drive for all but the largest stores and store types. Market support within a 5-minute drive time is considered the maximum time consumers would be willing to drive to smaller, convenience type retailers, and market demand within a 10-minute drive time is considered essential for most medium sized stores and restaurants. If a specific category of retail sales opportunity were shown for a 5-minute drive-time market area and held up at the 10-minute market area, then most retailers would consider market conditions favorable – from a demand standpoint – to locating or expanding a store within that market area. Figure 8 following shows the areas encompassed by a 5-, 10-, and 15-minute drive times. Fairhaven Economic Development Plan 22
FXM Associates

                                      Figure 8

The total number of households, their estimated spending on retail/restaurants, and
the estimated total store sales within this market area in 2017 are shown in Table
10 below.
                                       Table 10

At the level of total expenditures and store sales, Fairhaven is clearly already
drawing in consumer spending from beyond all three of its market areas, showing
little room for more growth in retail. When spending at the level of multi-digit

Fairhaven Economic Development Plan                                                23
FXM Associates
NAICS categories is examined, however, there appear to be areas where expansion
might be possible. Table 11 presents the results of the comparison of spending and
sales in selected retail store types, along with the translation of the gap identified
into square footage and then into an estimate of how many stores and square feet
might be captured by potential development in Fairhaven.
Table 11
Retail Opportunities in the Fairhaven Retail Market Area: 2017
Potentially
Supportable Potentially
Retail Stores Market Area Gap Supportable
SF Captured SF
Stores
4422 - Home Furnishing Stores $ 5,052,052 18,993 4,100 1
44422 - Nursery and Garden Centers $ 10,348,810 44,463 10,000 1
44612 - Cosmetics, Beauty Supplies and Perfume Stores $ 3,169,618 7,170 1,600 1
44814 - Family Clothing Stores $ 10,141,097 28,628 8,000 1
4529 - Other General Merchandise Stores $ 26,396,802 121,762 17,000 1
4539 - Other Miscellaneous Store Retailers $ 3,050,983 9,417 2,300 1
7223 - Special Foodservices $ 6,600,680 19,460 2,000 1
TOTALS $ 64,760,042 249,892 45,000 7
The estimates in the “Estimated Capturable” column are conservative and were
arrived at with considerable professional judgment based on past experience with
retail development. The estimations reflect the informed consideration that
Fairhaven would likely capture only a portion of the total new retail development
which might be attracted to the market area. Depending on town choices regarding
the role of retail in key development areas, the analysis shows opportunities that
could be attractive to several different types of retail stores with varying space
requirements. The total number of potentially supportable stores, however, is small
and suggests that efforts to attract more retail development might not be the best
use of scarce economic development resources. The preceding section on
employment trends in Fairhaven and Bristol and Plymouth Counties bears out this
assessment.
Fairhaven Economic Development Plan 24FXM Associates
Real Estate Supply Trends
With employment growth projected for office using industries, additional analyses
have been done to chart the trends in the supply of office space. Figure 9 shows
historical trends in the inventory and vacancy rates in Fairhaven and the local
market area, which includes New Bedford, Dartmouth, Westport, Acushnet,
Mattapoisett, Marion and Wareham. As the graph indicates, there has been little
change over the past 10 years in the inventory of office space in either Fairhaven or
the broader market area. Because of the growth in demand, noted in the previous
discussion of employment trends, vacancy rates are declining sharply – 2% in the
market area overall and virtually zero in Fairhaven.
Figure 9
Fairhaven & Local Market OFFICE Space Inventory and Vacancy Rates
2008-2017
4,500,000 10
4,000,000 9
8
3,500,000
7
3,000,000
Vacancy Rate (%)
6
Inventory SF
2,500,000
5
2,000,000
4
1,500,000
3
1,000,000
2
500,000 1
0 0
2008 2009 2010 2011 2012 2013 2014 2015 2016 2017
Fairhaven Inventory SF Local Market Inventory SF Fairhaven Vacant % Local Market Vacant %
Source: Co Star Property Information Systems, October 2017, and FXM Associates
Fairhaven Economic Development Plan 25FXM Associates
The next graph, Figure 10, shows trends in office space occupancy, further
confirming continued growth in market demand. The R-squares are very strong
and suggests continued growth, confirming the prior analysis of employment
trends.
Figure 10
Fairhaven & Local Market OFFICE Space Occupancy
2008-2022 Projected
780,000 y = 8477.6x + 641598
4,200,000
R2 = 0.8927
760,000
4,000,000
740,000 y = 33644x + 4E+06
R2 = 0.8744 3,800,000
720,000
Local Market SF
Fairhaven SF
700,000 3,600,000
680,000
3,400,000
Fairhaven Occupancy SF
660,000 Local Market Occupancy SF
Linear (Fairhaven Occupancy SF)
3,200,000
640,000 Linear (Local Market Occupancy SF)
620,000 3,000,000
2008 2009 2010 2011 2012 2013 2014 2015 2016 2017
Source: Co Star Property Information Systems, October 2017, and FXM Associates
Fairhaven Economic Development Plan 26FXM Associates
Figure 11 compares occupancy and rental rate trends. Average office gross rents in
Fairhaven spiked compared to the local market between 2011 and 2014 but have
since returned to close to the local market average of $15-16 per square foot per
year. While that rent level will not support new construction, with declining
availability (decreasing vacancy rates) in the existing supply, over time demand is
likely to force up average rents and create new opportunities for development,
particularly cost-effective rehabilitation and/or repositioning of existing buildings.
One of the advantages of shared workspaces, which will be discussed subsequently,
is that the prices per square foot that are typically charged tenants can
substantially exceed the average rents because of the shared services and facilities
they provide, as well as the fact that single tenants do not need to lease large
amounts of space.
Figure 11
Fairhaven & Local Market OFFICE Space Occupancy and Gross Rent
2008-2017
4,500,000 $25.00
4,000,000
$20.00
3,500,000
3,000,000
Goss Rent/SF/Year
$15.00
Occupancy SF
2,500,000
Fairhaven Occupancy SF
Local Market Occupancy SF
2,000,000
Fairhaven Office Gross Rent
$10.00
Local Market Office Gross Rent
1,500,000
1,000,000
$5.00
500,000
0 $-
2008 2009 2010 2011 2012 2013 2014 2015 2016 2017
Source: Co Star Property Information Systems, October 2017, and FXM Associates
Fairhaven Economic Development Plan 27FXM Associates Competitive Position One of the principal economic development issues raised by members of the Economic Development Committee is whether and to what extent the tax rates in Fairhaven – particularly the commercial tax rate, which is high relative to most of the surrounding communities - reflects town services that are competitive with other communities. While it is not possible within the scope of this study to analyze town services and infrastructure costs relative to other communities, it is possible to examine tax levies and rates on a per household and per job basis as a proxy for Fairhaven’s competitive fiscal position. The results, as discussed below, show that Fairhaven’s current tax policy favors residents with relatively low residential tax rates compared to surrounding communities. This is a competitive advantage not only for potential new residential development (workforce rental housing for example) but is also a feature that can help retain and attract businesses to locate in town and to promote that advantage to attract workers. The advantage extends to the quality of Fairhaven’s schools relative to regional norms, as will be shown subsequently. It should be noted that FXM’s interviewees did not mention Fairhaven’s commercial or residential tax rates when queried on potential competitive advantages or disadvantages for economic development. Another competitive issue – the Town’s permitting processes – received generally positive grades from local businesses and developers. This extended to the building department, public works, and general administrative functions. The single exception – noted by several interviewees -- was the propensity of some boards to extend their review into design details that were viewed as overreaching authority and delaying the approval process. Nevertheless, the objections were minor; Town government was viewed favorably overall and perceptions of doing business or developing in Fairhaven were positive and competitive compared to surrounding communities. Zoning – and appropriate zoning for commercial development removed from the existing commercial centers along Route 6, Alden Road, and Mill Street – is another matter. Lack of appropriately zoned land for office-type and mixed residential/commercial development was cited as constraining development potential in Fairhaven. Zoning is beyond the scope of this study and has been extensively addressed in the recent Master Plan update. Fiscal Comparison This section presents an analysis of where Fairhaven stands in terms of its existing tax policy compared to that of nearby communities: New Bedford, Acushnet, Dartmouth, Mattapoisett, Marion, Wareham, and Westport. Tax Rates Fairhaven’s commercial tax rate, while it is well below that of New Bedford, is the second-highest commercial tax rate of the eight communities included in the fiscal Fairhaven Economic Development Plan 28
FXM Associates

comparison. Interviews suggest that those who deal in commercial property
consider New Bedford to be Fairhaven’s principal competitor. As compared to New
Bedford’s $36.03 commercial rate, Fairhaven’s $24.27 is favorable. Additionally,
Fairhaven’s residential tax rate is close to average for the given communities.

                                                               Figure 12

                                                      Tax Rates (Per $1,000)
 $40.00
          $36.03
 $35.00

 $30.00

                             $24.27
 $25.00

 $20.00                                 $18.57
                   $16.69                                                                                            $17.25
                                                           $15.39
                                                 $14.44
 $15.00                                                                  $13.07
                                  $12.04                                                                                 $12.07
                                                                                    $11.41    $11.25
                                                                $9.70
 $10.00                                                                                                     $7.97

  $5.00

  $0.00
          New Bedford       Fairhaven      Acushnet       Dartmouth Mattapoisett    Marion   Wareham      Westport   Average

                        Commercial/Industrial                           Personal Property              Residential

Fairhaven Economic Development Plan                                                                                            29
FXM Associates
Residential and Commercial Property as Percent of Total Assessed
Valuation
According to the chart below, 13% of the total value of all property in Fairhaven is
commercial. In this measure, Fairhaven is comparable to Wareham and
Dartmouth, where 14% of assessed valuation is commercial. This proportion is
slightly below New Bedford’s, where 16% of assessed valuation is commercial.
Assessed valuations in Westport, Marion, Acushnet, and Mattapoisett are
significantly less commercial – ranging from 4% to 6% across the four towns.
Figure 13
Residential & Commercial Property % of Total Assessed Valuation
FY 2017
120%
100%
80% 83% 85% 93% 92% 91% 94%
82%
80%
60%
40%
20%
16% 14% 6% 5% 4%
14% 13% 6%
0%
New Bedford Dartmouth Wareham Fairhaven Westport Marion Acushnet Mattapoisett
Commercial Residential
Fairhaven Economic Development Plan 30FXM Associates
Residential and Commercial as Percent of Total Tax Levy
As displayed below, commercial properties comprise 23% of Fairhaven’s tax levy.
This number is higher than the proportion of total assessed valuation in Fairhaven
that is commercial, 13%, due to the town’s relatively high commercial tax rate. The
same occurs to an even higher degree in New Bedford, where commercial
properties account for 16% of the total assessed valuation (Figure 13) and 29% of
property tax revenues.
Figure 14
Commercial and Residential as % of Total Tax Levy
FY 2017
120%
100%
74% 93% 94%
65% 75% 82% 89% 92%
80%
60%
40%
29%
20% 23%
20%
14% 6% 6% 4% 3%
0%
New Bedford Fairhaven Dartmouth Wareham Acushnet Westport Mattapoisett Marion
Commercial Residential
It should be noted that special assessment districts (such as fire districts in
Dartmouth and Wareham, which are independent of municipal budgets) are not
included in this fiscal comparison and are therefore not included in the subsequent
per job and per capita tax comparisons.
Fairhaven Economic Development Plan 31FXM Associates
Assessed Valuation per Job
A comparison of assessed valuation per job shows that on this measure Fairhaven
ranks below the average of the local communities.
Figure 15
Assessed Valuation Per Job
FY 2017
$60,000
$49,349
$50,000 $47,082
$43,263
$39,455 $38,709
$40,000 $38,221
$36,950
$31,588
$28,982
$30,000
$23,761
$20,000
$15,961 $15,892
$14,588 $14,466 $14,010
$11,867
$10,000
$5,375 $4,945
$0
Acushnet Wareham Mattapoisett Westport Marion Dartmouth New Fairhaven Average
Bedford
Commercial/Industrial Personal Property
Fairhaven Economic Development Plan 32FXM Associates
Tax Levy Per Job
Next to New Bedford, Fairhaven has the highest tax levy per job of the eight
communities considered below.
Figure 16
Tax Levy Per Job
FY 2017
$900
$856
$800 $767
$686
$700 $666
$600 $582
$555
$538
$500
$500
$400 $375
$300
$250
$208 $213
$194 $183
$200 $180
$165
$120 $116
$100
$0
Acushnet Mattapoisett New Bedford Dartmouth Wareham Marion Fairhaven Westport Average
Commercial/Industrial Personal Property
Fairhaven Economic Development Plan 33FXM Associates
Residential Assessed Value Per Person
Assessed values for residential property are relatively low in Fairhaven compared to
surrounding communities. Only New Bedford and Acushnet have lower assessed
values per capita.
Figure 17
Residential Assessed Value Per Person
FY 2017
$350,000
$300,000 $289,240
$251,222
$250,000
$200,000 $186,826
$153,599
$150,000
$130,372
$122,641
$104,336
$97,633
$100,000
$46,522
$50,000
$0
Marion Mattapoisett Westport Average Dartmouth Wareham Fairhaven Acushnet New
Bedford
Fairhaven Economic Development Plan 34FXM Associates
Residential Tax Levy Per Person
The tax levy per person in Fairhaven is also low compared to the surrounding
communities. The revenues from Fairhaven’s relatively high commercial tax rate, as
well as relatively low assessed home values, allow citizens to pay less in residential
taxes.
Figure 18
Residential Tax Levy Per Person
FY 2017
$3,500
$3,300 $3,283
$3,000
$2,500
$2,000
$1,770
$1,489
$1,500 $1,410 $1,380
$1,265 $1,256
$1,000
$776
$500
$0
Marion Mattapoisett Average Westport Acushnet Wareham Dartmouth Fairhaven New Bedford
Fairhaven Economic Development Plan 35FXM Associates
Revenue by Source
In Fairhaven, 48% of total revenue comes from real and personal property taxes.
Local receipts for the town, which include fees and charges, are about average for
the area. Compared to most of the other surrounding communities, Fairhaven is
less reliant on property taxes as a revenue source.
Figure 19
Revenue by Source
80%
FY 2017
68%
70%
65% 65%
60% 57%
55%
51% 51%
50% 48%
47%
40%
33%
30% 26%
25% 24% 24%
22% 20% 20% 21% 21%
19% 21%
20% 18%
16%
14% 15%
10% 7% 8%
7% 5%
6% 5% 5%
4% 2% 3%
0%
0%
Dartmouth Acushnet New Bedford Fairhaven Mattapoisett Marion Westport Wareham Average
Tax Levy State Aid Local Receipts Other
Fairhaven Economic Development Plan 36FXM Associates
Jobs in Restaurants/Accommodations and Retail Trade
A high commercial tax rate can be explained by the mix of jobs in a community. A
commercial tax rate may be higher if a town has a relatively high proportion of jobs
that demand more public services, such as retail jobs, which generate more auto
trips and police work than most other industries. The graph below shows the
proportion of jobs in Fairhaven and the surrounding seven communities that are
restaurant/accommodations and retail industries. As displayed below, Fairhaven’s
high commercial tax rate is not explained by a high number of service-intensive
jobs in the town. In fact, Wareham and Dartmouth all have a substantially higher
proportion of jobs that are in service-intensive industries, and the commercial tax
rates in these towns are lower than in Fairhaven.
Figure 20
Percentage of Total Jobs that are in Restaurants/hotels and Retail
Trade
FY 2017
40% 38%
36%
35%
30%
26% 26%
25% 23%
21% 21%
20%
14% 14%
15%
10%
5%
0%
Wareham Dartmouth Westport Fairhaven Average Acushnet Mattapoisett New Bedford Marion
Fairhaven Economic Development Plan 37FXM Associates
Educational Services
The graph below compares 2017 MCAS performance for tenth grade students
attending Fairhaven High School to other public high schools in the region, as well
as to the statewide average. As shown, Fairhaven outperforms all but one local high
school in terms of average percentage of tenth graders achieving a rating of
“Proficient” or “Advanced” on the 2017 MCAS tests in Math and English.
Additionally, tenth grade students at Fairhaven High School scored considerably
higher than the statewide average for 2017.
Figure 21
Fairhaven Economic Development Plan 38FXM Associates
Shared Workspaces
At the initial meeting with the Economic Development Committee, some members
expressed interest in identifying models for shared workspaces that might be
applicable in Fairhaven. These can be an especially important opportunity for
Fairhaven given the high costs of new construction, vacancies in former retail
spaces, and interest already expressed to property owners and businesses. The
section is organized as follows:
Accelerators
Incubators
Life Sciences Incubators and Accelerators
Makerspaces
FabLab
Co-working Spaces
The Co-Working Industry
Demand for Co-working Space
• Trends in Independent Employment
• Trends in Remote Employment
• Trends in Small Business Employment
Building Reuse
Appendix
Examples
Funding Information
Useful sources
Accelerators
Business accelerators are as much programs as they are shared workspaces. In
other words, in addition to offering office space, accelerators consist of programs
aimed at accelerating the growth of startups. This programming generally includes
professional advice and guidance. Unlike a business incubator, where there is no
time limit on membership, startups are only in the accelerator for a limited
timeframe. The programming is more intense, earning accelerators the nickname
“business boot camps.” At the conclusion of their time in the accelerator,
businesses are considered “graduates.” Often upon graduating from an accelerator
startups will initiate their premier market launch. It is also customary for
Fairhaven Economic Development Plan 39FXM Associates accelerators to provide funding for startups, often through awarding grants or investing in equity. Accelerators can be operated publicly or privately, as well as through a public- private partnership. According to the Global Accelerator Report from 2015, 65% of accelerators are for-profit, with 35% non-profit. 2 MassChallenge, the largest business accelerator in Massachusetts and a non-profit, is run through a partnership between public and private organizations. MassChallenge benefits from partners that include the State of Massachusetts, as well as corporations such as Microsoft and CVS. More examples of business accelerators in Massachusetts can be found in the appendix. Incubators Like accelerators and co-working spaces, incubators are shared workspaces that offer infrastructural support such as mailboxes, printers, and IT assistance. Incubators, like accelerators, offer support services aimed at helping small businesses succeed. Incubators regularly host relevant events and classes for member startups. The key distinction between incubators and accelerators is the membership timeframe – incubators generally do not limit participation to any set amount of time. Therefore, the programming offered by incubators is markedly more passive than that of accelerators. About one-third of business incubators are funded by economic development organizations. Another 21% of incubators are funded by the government, and another 20% by colleges and universities. A much smaller proportion of incubators – around 6% - are privately funded and for-profit. 3 A list of Massachusetts-based business incubators can be found in the appendix. Life Sciences Industry – Incubators and Accelerators Massachusetts, as a leader in the life sciences industry, is home to a large number of incubators and accelerators that support businesses in this industry. Life sciences incubators and accelerators generally provide entrepreneurs with shared lab space and equipment. Examples of science-specific incubators, as well as information about funding opportunities for these types of initiatives, can be found in the appendix. Makerspaces http://gust.com/global-accelerator-report-2015/ 3 Linda Knopp (2007). "2006 State of the Business Incubation Industry". Athens, Ohio: National Business Incubation Association. Fairhaven Economic Development Plan 40
FXM Associates

Makerspaces share many characteristics with accelerators, incubators, and co-
working spaces, insomuch as each of these shared space models provides workers
with share facilities and services. The defining feature in a makerspace is the
workshop component. Makerspace members share common tools, ranging from 3D
printers and laser cutters to woodworking tools and sewing machines.

Makerspaces vary in the level of programming they offer. Some are comprised of
loosely-organized individuals sharing tools and space, while many other
makerspaces offer workshops, presentations and lectures focused on knowledge
sharing. Makerspace members generally engage in fields like science, technology,
and engineering, however some makerspaces support artistic endeavors as well.

Makerspaces are often hosted by schools, universities, and libraries. Most
Makerspaces are not-for-profit collectives, while some are for-profit or public-
private partnerships. 4 See the appendix for examples of makerspaces in
Massachusetts.

Fab Lab

FabLabs, short for fabrication laboratories, are a trademarked type of makerspace.
FabLabs are all part of a global network of labs, the first of which was created in
2001 by Professor Neil Gershend at the Center for Bits at Atoms at MIT. The Fab
Charter lays out requirements for FabLabs, which include certain required tools and
software, as well as mandates about some degree of public access. FabLabs are
usually run by local, non-profit organizations. 5

Coworking Space

Coworking spaces are membership-based shared office spaces that offer
infrastructural support such as wifi, printers, mailboxes, and IT services. Other
popular features are dedicated desks, private offices, and conference rooms. Unlike
business accelerators and incubators, co-working spaces generally do not offer
business-support programming. Coworking spaces are often run by an office
manager, and charge members per head or per desk. Those who are independently
employed, remote workers, and small businesses make up the majority of those
who utilize coworking spaces. Coworking offers these individuals a flexible and
affordable alternative to a traditional lease.

Coworking as a workspace model has gained significant popularity in recent years,
due largely to a growing contingent workforce, a rise in entrepreneurship, and
technological advancements that facilitate remote work. According to the 2017
Global Coworking Survey, there are about 1 million people working in coworking
spaces worldwide. Additionally, between 2015 and 2016 the number of coworking

4
    MassDevelopment Makerspace Report 2013
5
    https://makezine.com/2013/05/22/the-difference-between-hackerspaces-makerspaces-techshops-and-fablabs/

Fairhaven Economic Development Plan                                                                          41
FXM Associates spaces increased 49%. The demand section below will outline how this trend manifests itself in Fairhaven and the surrounding region. In its early stages, the coworking movement was dominated by large companies with locations primarily in major cities. WeWork, for instance, is now the sixth- most-valuable startup in the world, and their 273 locations (including six in Boston) capture 63% of coworking leasing activity. More recently, smaller companies have led the coworking movement into cities and towns of all sizes. As coworking has continued its mainstream expansion, boutique companies are operating independent coworking spaces in Massachusetts towns from the Berkshires to Cape Cod. Examples of large and small coworking organizations can be found in the appendix. In addition to meeting a potential demand for shared workspace, a coworking space might serve to repurpose one of Fairhaven’s vacant or underutilized properties as well. Historically, small town coworking spaces have taken up residence in repurposed structures such as abandoned warehouses, vacant retail stores, and former churches. The industry’s repurposing tendency is perhaps best embodied by WeWork’s recent purchase of Lord and Taylor’s flagship New York store for use as their new headquarters. A more local example exists in New Bedford, where the Groundwork coworking space occupies a former mill. Demand As stated above, most users of coworking spaces (79%) are independently employed, remote workers, or small business people. Trends in employment in these three groups can help to predict demand for coworking space in Fairhaven and the surrounding region. Trends in Self Employment In Bristol and Plymouth Counties there is considerable growth in self employment across all industries. In Bristol County, the number of jobs designated as self employment is projected to grow 11% between 2015 and 2022, adding a total of 2,968 jobs in this category. Self employment is expected to increase in Plymouth County as well, where 18% growth is expected between 2015 and 2022, adding a total of 5,781 jobs designated as self employment. While data on self employment across all industries for Fairhaven do not yield a reliable projection, there is steady, reliable growth in Fairhaven in the finance/insurance industry. Between 2015 and 2022, self employment in the finance/insurance industry is projected to grow 88% in Fairhaven, from 476 to 897 self employed persons. This pattern mirrors the national trend in self employment for this industry. The projection is based on historical trends and could suggest demand for over 100,000 square feet of coworking space in Fairhaven (though many will remain working from home). Trends in Remote Work Fairhaven Economic Development Plan 42
You can also read