Clare County Council Local Economic & Community Plan 2016 2021
←
→
Page content transcription
If your browser does not render page correctly, please read the page content below
Clare County Council

Local Economic & Community Plan

2016 - 2021

May 2016
1|Page
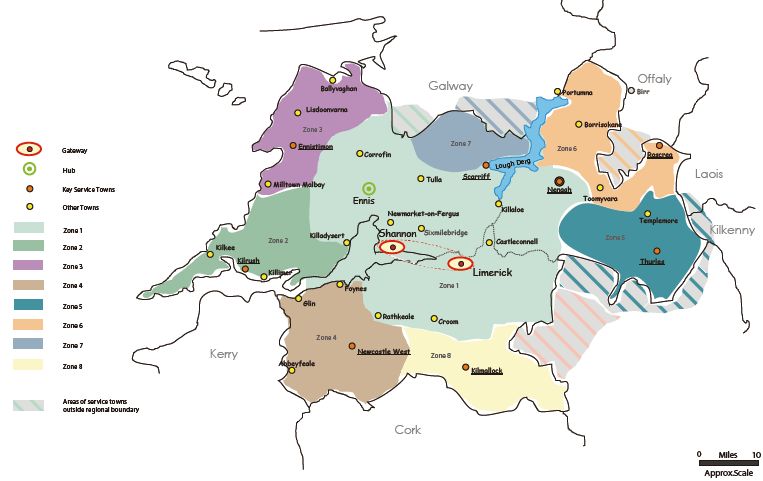
Table of Contents

1. Introduction ........................................................................................................................................ 4
2. Economic Development & Spatial Planning ........................................................................................ 4
   2.1 Relevant Programmes, Plans, Policies and Strategies .................................................................. 5
       2.1.1 National Context .................................................................................................................... 5
       2.1.2 Mid-West Regional Context ................................................................................................... 6
       2.1.3 Local context .......................................................................................................................... 7
3. Local, Community and Sustainable Development .............................................................................. 8
4. EU and National Targets ..................................................................................................................... 9
5. Participative Planning & Outcomes .................................................................................................... 9
6. Socio-Economic Evidence-Base ......................................................................................................... 10
   6.1 Introduction ................................................................................................................................ 10
   6.2 Population ................................................................................................................................... 10
       6.2.1 Population Change ............................................................................................................... 10
       6.2.2 Population Density ............................................................................................................... 11
       6.2.3 Population Migration ........................................................................................................... 12
       6.2.4 Population Dynamics – Long-term sustainability ................................................................ 12
       6.2.5 Population - Key Features .................................................................................................... 13
   6.3 Employment and Economy ......................................................................................................... 14
       6.3.1 Introduction ......................................................................................................................... 14
       6.3.2 Employment Rate................................................................................................................. 14
       6.3.3 Educational Profile of the Workforce .................................................................................. 14
       6.3.4 Age Profile and Gender Mix of the Workforce .................................................................... 15
       6.3.5 Employment Growth ............................................................................................................ 15
       6.3.6 Sectoral Employment ........................................................................................................... 16
       6.3.7 Location of Employment or Jobs.......................................................................................... 18
       6.3.8 Unemployment .................................................................................................................... 19
       6.3.9 Employment and Economy – Key Features ......................................................................... 19
   6.4 Education .................................................................................................................................... 20
       6.4.1 Education and Unemployment ............................................................................................ 20
       6.4.2 Educational Achievement by Sex ......................................................................................... 20
       6.4.3 Education – Key Features ..................................................................................................... 21
   6.5. Poverty Reduction...................................................................................................................... 21

2|Page
6.5.1 Introduction ......................................................................................................................... 21
6.5.2 People ‘At Risk of Income Poverty’, ‘Deprived’, in ‘Consistent Poverty’ ............................. 22
6.5.3 Income Inequality ................................................................................................................ 22
6.5.4 Community or Spatial Inequality ......................................................................................... 23
6.5.5 Poverty Reduction - Key Features ........................................................................................ 24
6.6 Research, Development and Innovation..................................................................................... 24
6.7. Climate Change and Energy ....................................................................................................... 24
6.8 Summary of Key Socio-economic and Environmental Findings .................................................. 25
6.8.1 Wellbeing and Quality of Life ............................................................................................... 25
6.8.2 Environmental Inheritance .................................................................................................. 26
6.8.3 Enterprise and Employment. ............................................................................................... 27
6.8.4 Research and Development ................................................................................................. 28
6.8.5 Education and Training ........................................................................................................ 28
7. Vision, Themes and High Level Goals................................................................................................ 28
8. Action Plan ........................................................................................................................................ 30
9. Consistency of LECP and Equality/Diversity Proofing ....................................................................... 52
9.1. Consistency of LECP with Core Strategy of the CDP and RPG.................................................... 52
9.2. Equality and Diversity Proofing .................................................................................................. 63
10. Monitoring, Review and Evaluation ................................................................................................ 72
Appendix I: List of Written Submissions ............................................................................................ 73
Appendix II: Public Consultation Workshop Attendees ..................................................................... 74
Appendix III: Members of the Clare Local Community Development Committee ............................. 76
Appendix IV: Members of the Economic Development & Enterprise Strategic Policy Committee –
Clare County Council ......................................................................................................................... 77
3|Page1. Introduction The requirement to make a six year Local Economic and Community Plan (LECP) is set out in section 66 of the Local Government Reform Act 2014. The purpose of the plan is to promote economic development and local and community development in the functional area of the Local Authority. The Local Authority, by way of its ‘Economic Development and Enterprise’ Strategic Policy Committee (SPC ) - see Appendix 4 for membership, is responsible for preparing the economic elements of the plan, while the Local Community Development Committee (LCDC) - see Appendix 3 for membership, is responsible for preparing the community elements of the plan. Both elements must be integrated and adopted by the Local Authority. The preparation of the LECP followed the five stage process set out in the Departmental guidelines which issued in January 2015. The consultative process has been core to the development of this six- year plan. The Plan includes objectives and actions that are focused on the promotion and support of the economic, local and community development of the County. The role of local government and its partnership with key stakeholders is central to the realisation of the plan which will be delivered through existing programmes. The achievement of EU 2020 and related national targets set the context for many of the benchmarks and targets that are developed for the various objectives in the Plan. In addition, the strategic actions, by means of which the objectives will be achieved, have their own indicators and these indicators will aid the measurement and evaluation of implementation. The plan is structured over nine further sections. Sections two to four set out the Plan’s: economic, spatial and policy context; underlying principles of Local, Community and Sustainable Development; EU and National targets. Section five outlines the consultation process and its outcomes, while section six presents an in- depth socio-economic profile of the county covering demographics, education, employment, poverty, research and development and climate change. Section seven sets out the Plan’s Vision and the Themes to be addressed as a result of both the consultation and the socio-economic profile. The High-Level Goals to be achieved under each Theme are also set out. Section eight contains the Action Plan where the objectives of each High Level Goal are presented in a Specific, Measurable, Achievable, Realistic and Timed manner. Benchmark data and targets are presented for all objectives. Strategic actions, by means of which Objectives will be achieved, have their own indicators of success and have a named Lead Partner. Section nine examines the consistency of the Plan with the County Development Plan and the Regional Planning Guidelines and also presents the findings of the Equality and Diversity-proofing of the Plan while section ten presents a brief overview of how the Plan will be monitored, reviewed and evaluated. 2. Economic Development & Spatial Planning The economic development role of local government is now regarded as a mainstream local authority function. The preparation and implementation of the economic elements of the LECP will require active engagement by all agencies and stakeholders that hold an economic and enterprise 4|Page
remit. The promotion of economic development and appropriate policy formulation will be of critical
importance in ensuring that the economy of County Clare grows to its full potential.

The Mid-West Regional Planning Guidelines 2010-2022 and the Clare County Development Plan
2011-2017 (as varied) and other programmes, plans, policies and strategies, as described in the
following sub-section, contain several opportunities that aim to ensure the county’s competitive
advantage in the areas of: international connectivity (Shannon International Airport); critical mass as
presented by the linked Gateway and Hub town (Limerick/Shannon/Ennis); road and rail
connectivity; educational facilities; natural resources such as the Shannon Estuary; tourism; and the
region’s capacity for renewable energy generation.

2.1 Relevant Programmes, Plans, Policies and Strategies
The following is a brief summary of the main provisions of each of the relevant documents at
national, regional and local level.

2.1.1 National Context
Ireland’s National Reform Programme sets out the broad macro-economic context and provides
updates on Ireland’s progress under the EU 2020 Strategy. The Government’s Medium Term
Economic Strategy 2014-2020 outlines the policy framework to re-build the Irish economy, achieve
sustainable economic growth, strong public finances and sustainable jobs.

National and Regional Action Plan for Jobs and Pathways to Work
The National Action Plan for Jobs (2016) and its derived Regional Plans in conjunction with Pathways
to Work 2016-2020 are government programmes which seek to: achieve increased employment and
enterprise creation; address unemployment, particularly long-term unemployment and youth
unemployment.

National Spatial Strategy (NSS) 2002 - 2020
The NSS provides a planning framework for delivering a more balanced social, economic and physical
development between the regions of Ireland. It proposes a more balanced pattern of spatial
development throughout Ireland, with continued growth in Dublin but with significant improvement
in the rate of development in nine Gateway locations and nine Hub towns. The strategy emphasises
the critical role of gateways and hubs in achieving balanced regional development and designates
Shannon as part of a linked Gateway with Limerick, while Ennis is designated as a Hub.

National Energy Efficiency Action Plan and Energy Efficiency Action Plan to 2020
The Third National Energy Efficiency Action Plan reaffirms the 20% energy saving target for 2020 by
means of increased energy efficiency and increased production from renewable sources.

National Renewable Energy Action Plan 2010-2020
The National Renewable Energy Action Plan (NREAP) sets out the Government’s strategic approach
to deliver on Ireland’s national target of 16% renewable energy under Directive 2009/28/EC.

Strategy for Renewable Energy 2012-2020
This document sets out the key actions to be pursued at national level to ensure Ireland will deliver
on its commitments to reduce greenhouse gases, increase renewable energy production and
improve energy efficiency. Key actions are identified for each sector.

5|Page
Smartertravel 2009-2020
Smartertravel 2009-2020 aims to ensure that transport policies underpin sustainable development
and highlights the need to change people’s travel behaviour in terms of choosing alternative modes
of transport to the private car. The National Cycle policy framework 2009-2020 seeks to ensure that
Development Plans incorporate the needs of cyclists in their policies.

River Basin Management Plans
The provisions of the Water Framework Directive (WFD) are implemented through River Basin
Management Plans. On the basis of River Basin Districts, 95% of the County is located within the
Shannon International River Basin (SIRB) with the remainder in the Western River Basin (WRB). The
River Basin Plans propose a programme of measures to achieve the objective of high or good water
quality status.

2.1.2 Mid-West Regional Context

Mid-West Regional Planning Guidelines (MWRPGs) 2010-2022
The Mid-West Regional Planning Guidelines (MWRPGs) 2010-2022 give effect, at a regional level, to
the national planning framework put forward in the National Spatial Strategy and National
Development Plan. The MWRPGs provide a regional framework for the formulation of policy and
strategy in the County Development Plan and seek to ensure the proper balance between the
settlements in the region with regard to development, population and services.

The MWRPGs 2010-2022 continue the ‘Zone’-based strategy that was provided in the 2004
Guidelines and outline the development potential and needs of each zone in turn. The zones
relevant to County Clare are 1, 2, 3, and 7, as illustrated in Figure 1 below.

Figure 1. Regional Development Zones

Source: Mid-West Regional Authority (2010)

6|Page
Mid-West Regional Retail Strategy
The Retail Strategy for the Mid-West region covers the period 2010-2016. This Retail Strategy
supercedes the previous 2002-2011 Regional Retail strategy and also replaces the Retail Strategy for
County Clare 2003-2011. The Regional Strategy is intended to provide a more strategic approach to
achieving a balance in retail development at regional level.

Mid-West Action Plan for Jobs
The Mid-West Action Plan for Jobs (MWAPJ) covers Clare, Limerick and Tipperary. It is based on the
principle that the best way to support job creation in towns and villages is to support agencies and
organisations to build on the particular strengths and assets of their area and drive new job creation
strategies and projects.

Joint Housing Strategy for Clare Local Authorities and Limerick City & County Councils
Part V of the Planning and Development Act 2000 (as amended) places an onus on all Local
Authorities to prepare a Housing Strategy for their areas.

Clare County Council in conjunction with Limerick County Council and Limerick City Council prepared
a Joint Housing Strategy for 2010-2017. This Housing Strategy replaces the Clare County Housing
Strategy 2007-2011. The Councils must ensure that sufficient and suitable land is zoned to meet the
requirements of the Housing Strategy over the lifetime of the Development Plan.

Strategic Integrated Framework Plan (SIFP) for the Shannon Estuary
In order to facilitate future economic development, and in keeping with the objectives of the
Regional Planning Guidelines, a Strategic Integrated Framework Plan (SIFP) has been prepared for
the Shannon Estuary. The SIFP is an inter-jurisdiction land and marine based framework to guide the
future development and management of the Shannon Estuary.

Limerick Clare Climate Change Strategy
The aim of this strategy is to identify the solutions to the challenge of reducing energy related
emissions and to outline the actions to be taken to meet the requirements under the Kyoto Protocol.

2.1.3 Local context

 Clare County Development Plan
The Clare County Development Plan 2011 – 2017 complements and supports the implementation of
planning and spatial policy expressed at local level and contains objectives that aid the economic,
social and cultural development of the county. The draft Clare County Development Plan 2017-2023
aims to establish an overall strategy for the proper planning and sustainable development of the
functional area of Clare County Council over a 6 year period and will replace the existing plan once
adopted.

Local Area Plans in County Clare
The Shannon Town and Environs Local Area Plan 2012-2018 aims to proactively pursue the
continued growth of Shannon as a centre of industrial and business excellence and to ensure that
Shannon, as a linked Gateway with Limerick, is a driver of County and regional prosperity by
harnessing its strategic location and access on the Atlantic corridor, in addition to its employment
base, international airport and other competitive advantages.

The Ennis and Environs Development Plan 2008-2014 also aims to encourage and support economic
growth in the Hub town. This Plan takes a holistic approach to future economic development,
recognising the range of sectors that contribute to the vibrancy of the local economy in Ennis.

7|Page
In addition to Local Area Plans for the Gateway and Hub town in County Clare, there are plans in
place for Kilrush Town and its Environs, West Clare, East Clare, North Clare and South Clare. These
Plans set out the policies and land use zoning objectives for each of the settlements in County Clare.

Clare County Council’s Economic Development Strategy 2011-2014
The Clare County Council Economic Development Strategy was an Action Plan implemented by Clare
County Council to improve the environment for economic development in County Clare so that the
County could avoid further erosion of its economic and employment base as well as its
competitiveness and position itself to take advantage of future economic growth. It aimed to
harness the powers and functions of the local authority to promote economic development in
County Clare.

3. Local, Community and Sustainable Development
Local government continues to play a key role in local and community development. The Local
Government Reform Act 2014 further strengthens this function by setting out the role of the Local
Community Development Committee (LCDC) and by establishing the Public Participation Network
(PPN). The PPN provides an opportunity to create a greater synergy between local government and
local and community development and will place local and community development at the heart of
local government.

The Local Authority’s role in terms of community initiatives and service provision at local level is
evident in the wide range of services that it delivers such as: libraries; leisure facilities and amenities;
arts programmes; estate management; urban and village enhancement schemes; playgrounds; burial
grounds; the provision of supports to Tidy Town groups, etc. These activities provide the Local
Government context in which the underpinning principles of ‘Local Development’, ‘Community
Development’ and ‘Sustainable Development’ are realised. These principles are deeply embedded in
the process by means of which the LECP was developed and in the values that underlie its vision and
objectives and are central to the manner in which its delivery will be monitored, reviewed and
evaluated.

Local development is defined as the collective effort of a community to improve local social and
environmental conditions and to provide opportunity for community, statutory agency and social
partners to act together for the benefit of the area – ADM. (1995) “An Integrated Local Development
Handbook”.

Community work or community development involves an analysis of social and economic situations
that leads to collective action for change. It is centred on a series of principles that seek to go
beyond consultation to participation and beyond capacity building to consciousness raising and
empowerment. It recognises the changing and often hidden nature of the structural inequalities
based on race, class, gender and disability to name a few. It seeks to transform rather than conform
to empower rather than control - Community Workers Co-operative (2010) “Towards Standards for
Quality Community Work; an All-Ireland Statement of Values, Principles and Work Standards”.

Sustainable development is defined as development which meets the needs of the present without
compromising the ability of future generations to meet their own needs.

8|Page
4. EU and National Targets
When considering the vision for the Plan and the themes which it would address, the LCDC and the
SPC paid particular heed to the EU’s growth strategy for the coming decade, known as Europe 2020.
This Strategy aims to create a Europe that is smart, sustainable and inclusive, delivering high levels
of employment, productivity and social cohesion. Five headline targets have been set at EU level
focusing on the areas of employment, research and development, climate change, education and
poverty.

Ireland has committed to achieving the EU 2020 targets and these are documented in the ‘National
Reform Programme Ireland April 2015’, as follows:
     1. Employment: that by 2020, the employment rate among the 20-64 year olds will have
        increased from the current 64% 1 to between 69% and 71% as measured by the Quarterly
        National Household Survey (QNHS).
     2. Research and Development: that by 2020, investment in R & D, between Public and Private
        expenditure, will be 2.2% of GDP or 2.5% of GNP.
     3. Climate Change and Energy: that by 2020,
            a. the emissions, not covered by the ‘Emissions Trading System’, will be reduced by
                21% of 2005 levels (20% of 1990 levels).
            b. the percentage of energy generated from renewable will be 16%.
            c. energy efficiency, in terms of ‘Primary Energy’, will have increased by 20%.

    4. Education: that, by 2020,
          a. the percentage of those 18-24 year olds, with Lower Secondary Education or less
              and not in further education/training, will be 8% (currently 10.6%) as measured by
              the Quarterly National Household Survey.
          b. the percentage of the 30-34 age group who have completed 3rd. Level education will
              be at least 60% (currently 49.4%) as measured by the Quarterly National Household
              Survey .

    5. Poverty: that, by 2020,
          a. the number experiencing ‘consistent poverty’ (who are both ‘at-risk-of’ poverty and
              experiencing ‘basic deprivation’) will be 2% or less of the population (6.3% in 2010)
              as measured by the Annual Survey of Income and Living Conditions (SILC) and
              Reported in Social Inclusion Monitor
          b. 200,000 less people will be living in ‘combined’ poverty (either ‘consistent’ poverty,
              ‘at-risk-of’ poverty or ‘basic deprivation’). Currently 277,000 people experience such
              conditions as measured by the Annual Survey of Income and Living Conditions
              (SILC) and Reported in Social Inclusion Monitor

5. Participative Planning & Outcomes
The LECP was developed through a public consultation process that involved a number of workshops
and written submissions - see Appendices I and II for a list of attendees and submissions. Each
workshop was fully briefed of their area’s social and economic assets as well as the challenges which
they faced. This briefing was based on the socio-economic and environmental profile that had been
developed (see section 6). The outcomes of the first round of public consultations and submissions
were presented to the Local Community Development Committee (LCDC) and the ‘Economic

1
 As measured by the Quarterly National Household Survey (QNHS). As QNHS Data is not available at County level this
profile uses county level trend data derived from the various censuses and compares those trends to the QNHS.

9|Page
Development and Enterprise’ Strategic Policy Committee (SPC). A first draft of a Vision, Themes, High Level Goals and Objectives was formulated (see section 7). In parallel, meetings were held with agencies in order to detail and map their services and supports and in order to identify any overlap or gap that existed. This helped inform the LCDC and SPC as to which agencies may be able to deliver on actions once they were identified. In the second and third round of public consultations, specific strategic actions, with potential Lead Agencies, were identified. These strategic actions were considered by the LCDC and the SPC. Further meetings were held with agencies to establish their agreement to Lead and, in some instances, to Partner in the delivery of strategic actions - see Section 8. This participative planning approach was quite similar to that involved in developing the County Development Plan and the Regional Planning Guidelines. 6. Socio-Economic Evidence-Base 6.1 Introduction This socio-economic profile of County Clare should be read in conjunction with the supporting document, containing the relevant Maps, Charts and Tables, which is available on http://www.clarecoco.ie/community/lecp/socio-economic-evidence-base-county-clare-2015- 21313.pdf The overall approach taken in developing the socio-economic profile was inter-generational (1981- 2011), gender-based (Female/Male) and spatial (County, Municipal District and Electoral Division). While generally drawing on Census of Population Data, most recent point-in-time data (eg. Live Register) was also presented. A number of topics were examined using this approach, namely, Population, Employment/Economy, Education, and Poverty Reduction/Social Exclusion, Research/Development/ Innovation and Climate Change/Energy. 6.2 Population 6.2.1 Population Change Over the period 1981-2011, the National and Regional populations grew by 33% and 25%, respectively. Clare’s population growth out-performed both by increasing from 87,567 to 117,196 (34%). However, in the period 2006-2011, the National and Regional population grew by 8.2% and 6.2%, respectively, while Clare’s population growth (5.6%) was less than both. The largest growth in the county’s population (9,271) took place in the period 1996-2002 and the next highest (7,673) in the period 2002-2006 and the third highest (6,246) in the period 2006-2011. The County’s population growth trend generally matched that of the State, although it exceeded it slightly in 2002 and 2006. Ennis Municipal District (MD) experienced the highest population growth (66%) of the four Municipal Districts, increasing from 19,907 (1981) to 33,010 (2011). Shannon MD (52%) and Killaloe 10 | P a g e
MD (39%) also experienced population growth greater than that of the County average. However,
West Clare MD only achieved 2.6% population growth over same period.

The more recent three census periods have been typified on the basis of the sectors that
contributed most to GDP growth. The period 1996 -2002 was typified by the major contribution of
‘export-oriented’ sectors leading to what was described as ‘export-driven growth’. The period 2002-
2006 was typified by the major contribution of the construction and home-market sectors leading to
what was described as ‘construction-driven growth’. The period 2006-2011 was typified as the
‘recession period’.

Ennis MD and Shannon MD achieved their greatest growth rates of 21% and 12%, respectively, over
the ’96-’02 period, suggesting that they were best placed to avail of ‘export-driven’ economic
growth.

West Clare MD achieved its highest population growth (6%) in the ’02-’06 period -‘construction
driven growth’, suggesting that it was best placed to avail of this form of growth. It appears that it
could draw on an under-employed farm-based pool of labour.

Killaloe MD experienced its greatest population growth (11%) in the period ’06-’11, suggesting that
its proximity to a major Gateway (Limerick/Shannon) was the reason for its above average growth in
the ‘recession period’. In terms of population change, it would appear that Gateways and their
environs are more resilient to economic downturns.

While the County’s Population increased by 5.6% in the period 2006-2011, the population of the
Towns and Villages increased by 9.3%. The strong trend of urbanisation resulted in almost 50% of
the County’s population living in Towns and Villages. The villages of Liscannor, Quin and
Sixmilebridge experienced population growth in excess of 50% while the villages of Corofin, Kilfenora
and Killaloe had population growth in excess of 25%. Clonlara, Crusheen, Kildysart, Ardskeagh,
Ardnacrusha and Inagh had population growth in excess of 20%. Ballycannon, Lisdoonvarna, Feakle,
Kilkee and Whitegate experienced population declines of -1%, -4%, -7%, -14% and -19%,
respectively. It is worth noting that while population growth was below average in W. Calre MD,
many of the Towns and Villages that experienced the highest population increases were in W. Clare
MD.

At Electoral Division (ED) level, it is noticeable that, while the county’s population grew by 34% in
the period 1981 – 2011, fifty seven of Clare’s 152 EDS experienced population decline over the
period. Thirty six declined by more than 10%. In contrast to the growth of the settlements in W.
Clare, the vast majority of the EDs in W. Clare experienced Population decline. It is interesting that
some of those EDs that displayed population growth over the 30 year period, actually experienced
population decline in the most recent census period.

6.2.2 Population Density
In 2011 all EDs in Ennis and Shannon MDs showed population densities of more than 22 People per
Ha. However, more than half the land mass of W. Clare MD had a population density of less than 12
people per Ha.

11 | P a g e
The perception that there has been a major shift in the relative population density in the County is
borne out by the shift in relative population density. In 1981, a large part of the county had a
population density >16 people per Ha. However, when this threshold was increased in line with
overall population increase (>22 people per Ha) in 2011 a much smaller part of the county achieved
this density. Relative density decline was particularly apparent in W. Clare MD. The concentration
(urbanisation) of the county’s population resulted in a significant shift in the balance of the
population towards Mid-Clare and South-East Clare.

6.2.3 Population Migration
An age-cohort analysis, by sex, of the 0-9 yr cohort of 1981 showed that, at county level, the 9,456
Males in the 0-9 age cohort had expanded by 222 in 1986 when they were aged 5-14 yrs. This
occurred as a result of net in-migration of children in that age group. Thereafter, this Male cohort
had declined by almost 2,000 by 2002 when it was aged 20-29. This decline could be partly explained
by attendance at Third level after which people continued to live outside the county. A similar
pattern was apparent in the Female cohort.

There was a very large net in-migration of approximately 1,200 in each sex in the 25-34 age-group of
2002 by 2006 when they were aged 3 0-39 and a further net in-migration (400 Males and 1,000
Females) by 2011 when they were aged 35-44. In fact, by 2011, Female net in-migration offset the
earlier net-outward migration. Overall there were more females in 2011 (9,106) than in the same
cohort (0-9 years) in 1981 (9,071). However, by 2011, the Male cohort of 2011 (8,717) was 8% (739)
smaller than in 1981 (9,456). The County seemed to attract Females to a far greater extent than
Males.

While the pattern of net out-migration in the years of 3rd. Level Education (15 – 24 yrs) was common
to all MDs for both sexes, the later pattern of recovery experienced at County level was not shared
by all MDs. The number of Males (2,718) and Females (2,973) in Ennis MD was 22% and 45% greater
than the same cohorts in 1981, but the number of Males (2,213) and Females (2,203) in W. Clare
was, respectively, 29% and 28% less than in 1981. Ennis MD had the greatest drawing power of all
MDs and W. Clare the least.

6.2.4 Population Dynamics – Long-term sustainability
A number of features indicate a population’s potential to socially and economically sustain itself into
the future. These include: the relative size and sex balance of the 15 year replacement population (0-
14 Years); the migration patterns and sex balance within the working age population (15-64 years);
the relative size of the 65+ age group. What may start off as a large cohort, sexually balanced, may
become quite small and sexually imbalanced as the working age population grows older. As a
consequence it may become less capable of sustaining the older age population (65+). These
features are examined by means of population pyramids.

The Population pyramid for County Clare indicates that in 2011, Males and Females in the 0-14 year
age groups (replacement age groups) constituted 22.2% of the County’s population. The older
population (65+) constituted 12.4% of the population. Females accounted for a greater share of
people aged 75+.

12 | P a g e
6.2.4.1 Replacement Population – Young People
In 2011, at National and Regional level, the youngest age groups (0-14) constituted 21.4% and
20.9%, respectively, compared to 22.2% for County Clare. A greater percentage of Clare’s population
was young (0-14) than was the case nationally or regionally. In fact, the 0-14 age group constituted
23.3% of the population in Ennis MD, 23% in Killaloe MD, 22.4% in Shannon MD, but only 20.4% in
W. Clare MD. West Clare MD had the weakest replacement population of the four MDs.

In terms of the Late Secondary and Third Level age groups (15-24 years), Males and Females
constituted 11.8% of the County’s population compared to 13.5% in Killaloe MD, 12.6% in Shannon
MD, 10.9% in W. Clare MD and 10.8% in Ennis MD. There are two likely reasons for these results.

Firstly, it was easier for 3rd. level students in the MDs of Killaloe and Shannon to travel to their
Colleges/Universities/ Institutes 3rd. than it is for their counterparts in the MDs of Ennis and W. Clare,
who had to move out of their MDs. Secondly, by taking up residence proximate to their 3rd. level
Universities/ Institutes, many students from the MDs of Ennis and W. Clare contributed to the
population of Shannon and Killaloe MDs, thus adding to the size of this age cohort in those MDs.

6.2.4.2 Older People
In 2011, 5.0% and 5.4% of the population, nationally and regionally, were 75+ yrs, compared to 5.2%
of County Clare’s population and compared to: 4.6% in Ennis MD; 3.5% in Shannon; 4.7% in Killaloe
MD and 7.4% in W. Clare MD. The percentage of the population that was 75+ yrs. in W. Clare MD
was almost 50% greater than the county average.

Overall, W. Clare MD displayed a much weaker population dynamic than any of the other MDs. A
smaller percentage of its population was in the replacement age bracket (0-14); a high percentage of
its population was 75+; it had the highest percentage of out-migration in the age group 15-24 years;
out-migration in the 15-24 age group was not replaced in later years to the same extent as other
MDs.

6.2.5 Population - Key Features
The pattern of population growth (34%) of County Clare over the period 1981-2011 generally
followed the National growth pattern. Population growth was greatest in the MDs of Ennis (66%),
Shannon (52%) and Killaloe (39%) and least in W. Clare (2.6%).

Different MDs experienced their greatest population growth in different census periods. Ennis and
Shannon MD’s had their largest population increases in the ‘export-driven’ period of 1996-2002. W.
Clare MD had its largest population increase in the ‘construction-driven’ period of 2002-2006.
Killaloe MD had its largest population increase in the ‘recession’ period of 2006-2011.

There was a strong trend of urbanisation with the result that by 2011 almost 50% of the County’s
population lived in Towns and Villages and, over the period 2006-2011, many of the towns and
villages experienced population growth that was more than twice the average county rate and many
of these towns and villages were located in W. Clare MD. Only five towns and villages experienced
population decline.

13 | P a g e
The relative population density of the county changed with the increasing urbanisation. All of the
EDs in the MDs of Ennis and Shannon had population densities in excess of 22 people per Ha, while
only 30% of EDs in W. Clare MD had such densities.

There was a pattern of significant net out-migration in the late Secondary school-going and 3rd. Level
age group (15-24) at county and MD level. However, this was not as marked in Killaloe and Shannon
MDs as a result of their proximity to the University City of Limerick where, the closer students were,
the more likely they were to continue living at home. While net out-migration in the 15-24 age
cohort was reversed in the older age groups (25-64), particularly among Females, W. Clare did not
experience such a reversal. In general, Clare attracted larger number of Females than Males in the
25-64 age-group.

6.3 Employment and Economy
6.3.1 Introduction
It should be noted that the usual analysis of CSO Census of Population data in relation to
Employment gives the impression that workers and jobs are co-located. It cannot be over-
emphasised that there is little basis for assuming that workers find jobs where they live, particularly
if they live in rural areas. Consequently, the workforce residing in any location should not be
equated with the number and type of jobs in that location or even proximate to it. Workers often
travel quite a distance to get to their place of work. The number, sector and location of jobs is
analysed later.

6.3.2 Employment Rate
The Employment Rate is defined as the percentage of any age group who are ‘At Work’.

In 2011, the National and Regional Employment Rates of working age (15-64) Males was 62.5% and
62.5%, respectively, compared to 63.7% for county Clare. The rate varied by as little as +/- 0.25%
across MDs in County Clare.

In 2011, the National and Regional Employment Rates of working age (15-64) Females was 55.2%
and 54.3%, respectively, compared to 55.4% for the county. However, the rate varied a lot across
MDs (+/- 2.20%) with Killaloe MD displaying the lowest Female Employment rate (53.5%).

The National Reform Programme aims to improve the Employment Rate of those aged 20-64 from
its current level of 64% (Q 4.-2014) to between 69% and 71% by 2020. Clare is quite likely to achieve
such targets, although such expectations need to be tempered by the historical decline in the Mid-
West’s share of National Employment from 8.63% (1998) to 7.93% (2014), which impacts on Clare’s
performance relative to the National performance.

6.3.3 Educational Profile of the Workforce
In 2011, the percentage of the National and Regional workforce with 3rd. level qualification was
40.9% and 38.5%, respectively, compared to 38.4% for county Clare. Both the Regional and County
3rd. level educational profile was well below the national average.

At county level, the percentage of the workforce with Lower Secondary or Less was 19%. A similar
pattern was apparent across the MDs as the educational profile of the workforce rapidly increased.

14 | P a g e
While females accounted for 47% of the overall workforce in 2011, they accounted for 57.5% of the
workforce with 3rd. level qualifications. While this pattern of above-average educational profile of
the Female workforce was reflected across all MDs it was particularly the case in W. Clare MD. It was
apparent that the feminisation of the workforce was accompanied by greater female than male
representation among those with 3rd. Level qualifications and particularly so in W. Clare MD.

6.3.4 Age Profile and Gender Mix of the Workforce
Over the period 1981-2011, county Clare experienced a decline in the share of overall workforce by
those 65+ (from 6.2% to 3.1%). The slightly older Male workforce (65+) in W. Clare MD and Killaloe
MD (3.6% and 3% Males), respectively may be due to the relatively high participation of Males in
Agriculture.

Over the period 1981-2011, County Clare experienced a decline in those aged 15-24 years from
21.8% to 5.9%. As a result of the decline in both older (65+) and younger (15-24)participation in the
workforce, by 2011, 91% of the workforce was aged 25-64 yrs, compared to 72% in 1981. This
compared to 92.0%, 91.2%, 91.2%, 89.8% of the workforce in the MDs of Ennis, Shannon, Killaloe
and W. Clare MD, respectively.

Over the period 1981-2011, it was apparent that people were retiring earlier and younger people
were entering the workforce later. Young people’s delayed entry to the workforce may be due to:
the recession affecting their employment prospects and/or stimulating their emigration; the trend to
continue longer in education.

It was also noticeable that, by 2011, the percentage of the workforce in the different age groups
which was accounted for by females was just 2% less than that accounted for by males. The one
exception was in the 25-34 age-group where Female participation (12.5%) exceeded that of Males
(11.8%).

The pattern of the County’s workforce by Age and by Sex was replicated across all MDs. By 2011,
young Female participation in the workforce (25-34) exceeded that of Males in all MDs, especially in
Ennis MD where Females accounted for 15% of the total workforce compared to 13.3% for Males. It
was also noticeable that, in Ennis MD, only 11.3% of the workforce was in the 55-64 age group
compared to 17.5% in W. Clare MD, suggesting people retired much earlier in Ennis MD.

6.3.5 Employment Growth
The percentage of the County’s residents who were employed grew by 58% from 28,835 to 45,688
(1981-2011) which was far in excess of the County’s population growth (34%).

In the same period, the Female workforce grew by 206% and the Male workforce grew by 11%, so
that, by 2011, Females accounted for 47% of the workforce compared to 24% in 1981. The very
rapid feminisation of the workforce was apparent.

6.3.5.1 Workforce Growth in the Municipal Districts
The workforce growth differed significantly across the Municipal Districts. Ennis MD experienced the
highest workforce growth (110%), compared to Shannon MD (84%), Killaloe MD (55%) and W. Clare
MD (17%). The gender composition of the growth also differed significantly between Ennis MD (Male

15 | P a g e
+54%, Female +239%), Shannon MD (Male +34%, Female +223%), Killaloe MD (Male +9%, Female
222%), W. Clare (Male -20%, Female +159%).

6.3.5.2 Male/Female Participation in the Municipal Districts
While at county level, males accounted for 6% more of the workforce, they only accounted for 4%
more in Ennis MD compared to 25% more in Shannon MD and 22% more in Killaloe and W. Clare
MDs. The rate of feminisation of the workforce in Ennis MD was well ahead of that in the MDs of
Shannon, Killaloe and W. Clare.

6.3.6 Sectoral Employment
At county level, the number of workers engaged in the different sectors in 1981 and 2011 showed a
57% decline in the Agriculture sector and a 300% increase in the numbers involved in ‘Other’
Services sector. The relative importance of the different sectors also changed. While Agriculture
accounted for 30% of the workforce in 1981 it accounted for only 8% in 2011.

Over the period 1981-2011, the importance of Manufacturing employment declined from 21% to
15% and employment in Construction from 9% to 5%. As a result of the strong shift to Service
Sectors (Transport, Public Admin, Professional Services and Other Services), these sectors accounted
for 52% of all employment in 2011 compared to 28% in 1981.

Between 2006 and 2011, employment declined by 5,000 to 45,600. This was due to declines in:
Construction (-3,600); Industries not Stated (-1,250); Manufacturing (-1,050); Transport and
Communications (-600). The decline was offset by increased employment in: Public and Professional
Services (+1,300); Agriculture (+450). Over the same period employment in Tourism-related
activities, Wholesale/Retail, Community/Social/Personal Services remained constant.

The relative significance of the different sectors in 2011 is apparent from the percentage of all
workers represented by: Professional and Public Services (25%); Manufacturing (15%);
Retail/Wholesale (12%); Finance/Real Estate (11%); Agriculture (8%); Transport/Communications
(6%); Tourism (7%); Construction (5%) and Community/Social/Personal Services (4%). The balance is
made up of ‘Not Stated’ category.

In Clare there are two Urban Districts (UDs - Ennis and Kilrush) and nine Rural Districts (RDs- Kilrush,
Kildysart, Ennistymon, Ballyvaughan, Corofin, Meelick, Scariff, Tulla, Ennis). The first four RDs and
part of Corofin RD approximate the W. Clare MD. Ennis RD extends south to Shannon and
Sixmilebridge and west to the border of Inagh and Lissycasey and approximates to Ennis MD. Scariff
RD and Tulla RD and part of Meelick RD approximate to Killaloe MD.

At the level of RDs and UDs, the number of workers living in them, in 2011, was as follows: Ennis RD
and UD (20,550), Meelick RD (6,300), Kilrush RD and UD (4,570), Ennistymon RD (3,950), Tulla RD
(3,150), Scariff RD (2,660), Kildysart RD (1,900), Corofin (1,400) and Ballyvaughan (1,100). The Ennis
to Limerick Suburbs reflected in the Ennis RD/UD and Meelick RD accounted for almost 60% of all
workers living in the County.

6.3.6.1 Agricultural Sector
In 1981, the Agriculture sector was the major source of employment in W. Clare MD and Killaloe MD
while the Manufacturing sector was the major source of employment in Shannon MD and Ennis MD.

16 | P a g e
However, by 2011, the numbers employed in Agriculture in W. Clare MD were outstripped by the
numbers employed in Professional Services, Other Services and Commerce in that order. In Killaloe
MD the numbers employed in Agriculture were outstripped by those employed in Professional
Services, Commerce and Manufacturing, in that order.

In the period 1981-2011, the number of Farms (by size) declined from 1,227 (< 10 Has), 2,058 (10-20
Has), 3,795 (>20 Has) to 180, 748, 2,501. Almost 60% (1,434) of all larger farms (> 20 Has) were
located in W. Clare Municipal District in 2011.

The number of farmers increased during the recession period from 3,500 approx. (2006) to 3,950
approx. (2011). This reversed the historical trend on declining farming numbers. However, this may
be due to the fact that during the construction period (2002-2006) many farmers reported
themselves as construction workers and had to revert to farming during the recession.

In 2011, the highest numbers of farmers and as % of RD’s workforce were as follows: Kilrush RD 814
(21%), Ennis RD 665 (4%), Ennistymon RD 538 (14%), Tulla RD 395 (13%), Scariff RD 369 (14%),
Kildysart RD 343 (18%), Meelick RD 304 (5%), Corofin RD 251 (18%) and Ballyvaughan RD 217 (20%).

While almost 60% of all workers were living in Ennis RD/UD and Meelick RD, only 25% of Agricultural
employment was located there.

6.3.6.2 Construction Sector
As noted earlier, employment in the Construction sector declined by 40% from 6,071 (2006) to 2,475
(2011), thus accounting for 3,600 of the overall 5,000 decline in employment. This percentage
decline was reflected across all RDs and UDs as follows: Ennis UD/RD declined from 2,476 to 974;
Kilrush UD/RD from 867 to 322; Meelick RD from 674 to 327 and in other RDs from approx. 400 to
160.

In 2011, the highest percentage of a RD’s workforce engaged in construction was in the RDs of
Kilrush, Kildysart at 7% each and Ennistymon, Scariff and Tulla at 6% each.

While almost 60% of all workers were living in Ennis RD/UD and Meelick RD, only 50% of
Construction employment was located there.

6.3.6.3 Tourism Sector
Employment in the Tourism sector remained stable over the period 2006-2011 at around 3,000 or
7% of the workforce.

In 2011, the highest percentage of a RD’s workforce engaged in Tourism was in the RDs of
Ballyvaughan (14%), Ennistymon (11%), Ennis RD (7%) and Kilrush RD (6%).

While almost 60% of all workers were living in Ennis RD/UD and Meelick RD, only 38% of Tourism
employment was located there.

6.3.6.4 Retail and Wholesale
Employment in Retail and Wholesale remained constant at 5,600 (12% all employment) over the
period 2006-2011. The slight decline in Ennis RD/UD of 60 was offset by an increase of 50 in Meelick
RD.

17 | P a g e
In 2011, the highest percentage of a RD’s workforce engaged in Retail and Wholesale was in the RDs
of Meelick (15%), Ennis (12%), Ennistymon (12%), Kilrush, Corofin, Kildysart and Scariff each 11%
with Tulla (10%) and Ballyvaughan (8%)

While almost 60% of all workers were living in Ennis RD/UD and Meelick RD, 62% (3,506) of Retail
and Wholesale workers lived there thus indicating an above-average concentration of Retail and
Wholesale workers living in these areas.

6.3.6.5 Changes in Sectoral Employment
By 2011, the Services Sectors (Transport Services, Public Administration Services, Professional
Services and Other Services) accounted for 54%, 53%, 50% and 51% of all employment in Ennis MD,
Shannon MD, Killaloe MD and W. Clare MD, respectively. The transition to the service sectors took
place to almost the same extent in all the MDs. The weakness of the Manufacturing sector for the
resident workforce in W. Clare was compensated for by the strength of the Agriculture sector. The
workforce residing in W. Clare MD moved quickly to a services-based employment without going
through a manufacturing period.

The 23% increase in the female percentage of the workforce was accounted for by the increased
percentage of Females in the ‘Professional Services’ (10%), Commerce (7%) and ‘Other Services’
(5%).

At Municipal District level, the largest feminisation of Professional Services took place in Killaloe
(+13%) and W. Clare (+11%) and in Other Services in W. Clare MD (+7%). By 2011, Female
employment across the fours Services Sectors (Transport, Public Admin, Professional Services, Other
Services) accounted for 32%, 31%, 30% and 28% of the total workforce, in the MDs of Ennis, W.
Clare, Killaloe and Shannon, respectively.

6.3.7 Location of Employment or Jobs
Location of jobs data is drawn from Place Of Work/School Anonymised Records (POWSCAR) based
on the Census of Population 2011. Twenty nine of Clare’s one hundred and fifty two Electoral
Divisions (EDs) had more than 200 jobs and accounted for almost 80% of all jobs in the county.
Twenty nine EDs had less than 35 Jobs each and were mainly located in North and North East Clare.
When agricultural jobs were removed there were twenty six EDs with more than 200 Jobs,
accounting for 83% of all non-agricultural jobs. There were sixty EDs with less than 35 non-
agricultural jobs. The dependence of many Rural EDs on Agricultural jobs was evident.

In 2011, almost 33,000 workers in Clare travelled to work. Three main employment centres provided
employment for more than 70% of Clare workers who travelled to work. One centre was that of
Ennis, Doora/Quin/ Newmarket where there were 10,000 jobs approximately occupied by Clare
Workers. In terms of local employment it is worth noting that more than 50% of these workers lived
in the area itself. A second centre was that of Shannon/Cratloe/Sixmilebridge where 7,500 jobs
approximately were occupied by Clare workers and another 3,000 approximately by workers who
travelled into this centre from outside the County, particularly from Limerick City/County. Again it is
worth noting that almost 45% of the Clare workers lived in the area itself. A third centre was located
in Limerick City and County where approximately 6,500 jobs were occupied by Clare Workers who
travelled there to work.

18 | P a g e
Many EDs surrounding these centres were heavily dependent on them for employment (more than
50% of their commuting workforce). There was a clear pattern that, as the distance from the main
centres of employment increased, the percentage of an ED’s commuting workforce declined. The
Ennis, Doora/Quin/ Newmarket centre of employment had the largest catchment and the Limerick
City and County centre the smallest. The first centre drew heavily on the workforce living in the EDs
to its North and West.

6.3.8 Unemployment
Respectively, in 2011, the National, Regional and County unemployment rates were, respectively,
15.0%, 14.6% and 15.1% with male unemployment rates of 22.3%, 21.7% and 21.8% and female
unemployment rates of 15.0%, 14.6% and 15.1%.

At County level, over the period 2006-2011, the Male Unemployment rate increased from 7% to 22%
and the Female Unemployment rate from 8% to 15%. This pattern was reflected across all Municipal
Districts with W. Clare MD experiencing the highest Male Unemployment Rate (24%).

Thirty two EDs experienced Male Unemployment rates between 26% and 46% and thirty two EDs
experienced Female Unemployment rates between 18% and 34%.

High Male Unemployment rates were generally associated with Towns and Villages, except in the
case of North-East Clare. High rates of Female unemployment were more closely associated with
urban centres. However, there were many urban centres which did not experience either high rates
of Male or Female Unemployment.

From a peak in 2011, the Male and Female Live Register unemployment numbers for the county had
fallen by 28% and 16%, respectively in mid-2015. For the Social Protection Centres of Ennis,
Ennistymon, Kilrush and Tulla, respectively, Male Unemployment numbers fell from their peak by
34%, 18%, 29% and 36% and Female unemployment numbers by 26%, 2%, 15% and 22%.

The 5,000 drop in the numbers at work was accounted for by a decline of 5,300 Males and an
increase of 300 Females.

There is no Annual report of employment at County level. There may be an assumption that changes
in the Live Register numbers reflect changes in the Employment numbers and that a decline of 100
in the ‘Live Register’ is matched by an increase of 100 in the number employed. However, this
assumption does not take account of net migration.

Consequently, the decline of 2,000 in the number of unemployed in the Live Register by the end of
2014 cannot be associated with similar increase in the number s employed. It is more likely that
emigration continued while employment increased and that this combination best accounted for the
Live Register figures.

6.3.9 Employment and Economy – Key Features
Over the period 1981 – 2011, there has been a dramatic shift from a predominantly Male
agricultural economy to an increasingly Feminised Services economy with Females constituting 47%
of the Workforce in 2011.

19 | P a g e
You can also read