Timescales of emergence of chronic flooding in the major economic center of Guadeloupe - Natural Hazards and Earth System Sciences
←
→
Page content transcription
If your browser does not render page correctly, please read the page content below
Nat. Hazards Earth Syst. Sci., 21, 703–722, 2021
https://doi.org/10.5194/nhess-21-703-2021
© Author(s) 2021. This work is distributed under
the Creative Commons Attribution 4.0 License.

Timescales of emergence of chronic flooding in the major economic
center of Guadeloupe
Gonéri Le Cozannet1 , Déborah Idier1 , Marcello de Michele1 , Yoann Legendre2 , Manuel Moisan2 , Rodrigo Pedreros1 ,
Rémi Thiéblemont1 , Giorgio Spada3 , Daniel Raucoules1 , and Ywenn de la Torre2
1 DRP/R3C,  BRGM, Orléans, 45000, France
2 DAT/GUA,   BRGM, Petit-Bourg, 97170, France
3 Dipartimento di Scienze Pure e Applicate (DiSPeA), Università di Urbino “Carlo Bo”, Urbino, Italy

Correspondence: Gonéri Le Cozannet (g.lecozannet@brgm.fr)

Received: 27 May 2020 – Discussion started: 17 August 2020
Revised: 22 December 2020 – Accepted: 11 January 2021 – Published: 22 February 2021

Abstract. Sea-level rise due to anthropogenic climate change       recurrent chronic flooding are required for the critical port
is projected not only to exacerbate extreme events such as         and industrial and commercial center of Guadeloupe. Similar
cyclones and storms but also to cause more frequent chronic        processes are expected to take place in many low-elevation
flooding occurring at high tides under calm weather condi-         coastal zones worldwide, including on other tropical islands.
tions. Chronic flooding occasionally takes place today in the      The method used in this study can be applied to other lo-
low-lying areas of the Petit Cul-de-sac marin (Guadeloupe,         cations, provided tide gauge records and local knowledge of
West Indies, French Antilles). This area includes critical in-     vertical ground motions are available. We argue that identify-
dustrial and harbor and major economic infrastructures for         ing times of emergence of chronic flooding events is urgently
the islands. As sea level rises, concerns are growing regard-      needed in most low-lying coastal areas, because adaptation
ing the possibility of repeated chronic flooding events, which     requires decades to be implemented, whereas chronic flood-
would alter the operations at these critical coastal infrastruc-   ing hazards can worsen drastically within years of the first
tures without appropriate adaptation. Here, we use informa-        event being observed.
tion on past and future sea levels, vertical ground motion,
and tides to assess times of emergence of chronic flooding
in the Petit Cul-de-sac marin. For RCP8.5 (Representative
Concentration Pathway 8.5; i.e., continued growth of green-        1   Introduction
house gas emissions), the number of flood days is projected
to increase rapidly after the emergence of the process so that     Chronic flooding is defined as flooding occurring at high
coastal sites will be flooded 180 d a year within 2 decades        tides under calm weather conditions (Ezer and Atkinson,
of the onset of chronic flooding. For coastal locations with       2014; Sweet and Park, 2014; Moftakhari et al., 2015; Mof-
the lowest altitude, we show that the reconstructed number         takhari et al., 2017; Dahl et al., 2017). For 30 years, reports
of floods is consistent with observations known from a pre-        from the Intergovernmental Panel on Climate Change (IPCC)
vious survey. Vertical ground motions are a key source of          have shown that mean sea level is rising due to anthropogenic
uncertainty in our projections. Yet, our satellite interferomet-   climate warming and that sea levels will continue rising in
ric synthetic-aperture radar results show that the local vari-     the future (Church et al., 2013a; Garner et al., 2018; Op-
ability in this subsidence is smaller than the uncertainties       penheimer et al., 2019). Therefore, risks of chronic flood-
in the technique, which we estimate to be between 1 (stan-         ing are expected to rise in an increasing number of locations
dard deviation of measurements) and 5 mm/yr (upper the-            in the future, including embankments in harbors, cities and
oretical bound). Despite these uncertainties, our results im-      settlements in sheltered areas, and other regions where ex-
ply that adaptation pathways considering a rapid increase in       treme events are rare enough to justify low protection lev-
                                                                   els (Stephens et al., 2018). Chronic flooding is already hap-

Published by Copernicus Publications on behalf of the European Geosciences Union.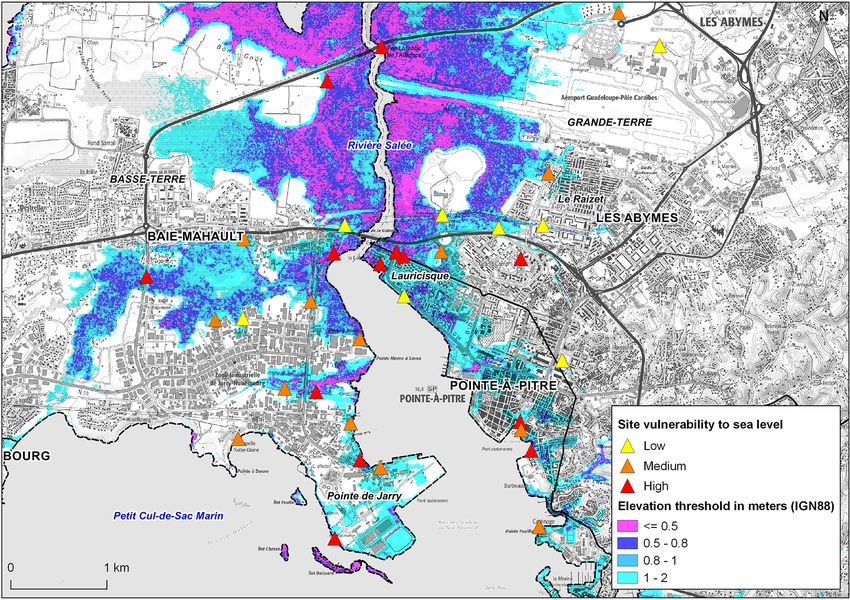
704    G. Le Cozannet et al.: Timescales of emergence of chronic flooding in the major economic center of Guadeloupe

pening now: for example, an acceleration in chronic flooding        bility in Guadeloupe (Fig. 1, Sect. 2). To do so, we quan-
has already affected coastal communities and transportation         tify the different phenomena causing present and future rela-
systems on the US eastern coast (Sweet and Park, 2014; Ja-          tive mean sea-level changes, as well as the high-water levels
cobs et al., 2018). There, the observed trends and accelera-        resulting from tides, surges and mean sea-level fluctuations
tion of chronic flooding events are consistent with observed        induced by regional circulations, excluding cyclone events
increases in mean sea levels (Sweet and Park, 2014). Among          (Sect. 3). In Sect. 4, we present the projected timescales of
coastal impacts of sea-level rise, risks of chronic flooding re-    emergence of recurrent chronic flooding for different scenar-
quire the most immediate adaptation response, in particular         ios and coastal settings. These results come with residual un-
in terms of coastal-defense upgrades and water network man-         certainties, which are discussed in Sect. 5, together with the
agement (Le Cozannet et al., 2017). Today, the topic is be-         significance of our results for the attribution of chronic flood-
coming even more urgent due to the observed acceleration of         ing events and for coastal management. Overall, our results
sea-level rise caused by the onset of Greenland and Antarc-         illustrate that the question of chronic flooding should deserve
tica ice-sheet melting (Dangendorf et al., 2017; Dieng et al.,      some attention on tropical islands concerned with adapting to
2017; Chen et al., 2017).                                           the future effects of sea-level rise.
   Despite the relative urgency of the topic, there is still lit-
tle awareness regarding chronic flooding and the potential
impacts in a number of regions. Global assessments avail-           2    Coastal settings
able today tend to focus on extreme events exacerbated by
                                                                    This study focuses on the coasts of the Petit Cul-de-sac
sea-level rise, without evaluating the significance of chronic
                                                                    marin, a large low-lying area located at the junction of Basse-
flooding (Oppenheimer et al., 2019). Studies raising aware-
                                                                    Terre and Grande-Terre, the two main islands of Guadeloupe,
ness on chronic flooding are mostly local and often focus on
                                                                    which are separated by a tight channel, the Rivière Salée
temperate areas such as the USA and New Zealand (Sweet
                                                                    (Fig. 1). This sheltered coastal area is characterized by large
and Park, 2014; Moftakhari et al., 2017; Dahl et al., 2017;
                                                                    mangrove areas, a reef barrier and active sedimentation pro-
Stephens et al., 2018). However, chronic flooding is also
                                                                    cesses. The area is recognized as being highly exposed to
a significant matter of concern on tropical islands, because
                                                                    marine flooding due to cyclones and tsunamis (Pedreros et
their low-lying areas are critical for human activities such as
                                                                    al., 2007, 2016). Yet, chronic flooding has received less at-
trade, transport and housing (Kumar and Taylor, 2015).
                                                                    tention so far, despite the fact that previous studies have ex-
   Here we focus on a tropical archipelago, Guadeloupe, lo-
                                                                    tensively inventoried the most vulnerable sites with respect
cated in the Lesser Antilles in the eastern Caribbean. Guade-
                                                                    to this process.
loupe is among the small-island regions where current flood-
                                                                       The low-lying areas of the Petit Cul-de-sac marin have
ing risks are primarily associated with the seasonal occur-
                                                                    been intensively urbanized over the last century. The major
rence of tropical cyclones (Krien et al., 2015; Rueda et al.,
                                                                    assets at risk include the following:
2017). Guadeloupe presents a complex and steep topography
due to its volcanic origin. Critical infrastructure is located in       – the industrial zone of Jarry (Baie-Mahault), located on
coastal low-lying areas, in particular in the former mangroves            the east side of the island of Basse-Terre; this area in-
of Petit Cul-de-sac marin, with the cities of Pointe-à-Pitre              cludes harbor, industrial, energy production, commer-
and Baie-Mahault, which include a power plant, port, and                  cial and storage facilities, which collectively constitute
airport facilities and commercial areas (Bourdon and Chioz-               the major economic center of Guadeloupe;
zotto, 2012). This high exposure to coastal hazards in a low-
lying area is typically representative of the current situation         – the landing area of the international airport in Guade-
on many inhabited high islands in tropical regions (Nurse et              loupe (Les Abymes);
al., 2014). Bourdon and Chiozzotto (2012) reported chronic
flooding events as well as damage to concrete infrastruc-               – the historical center of the city of Pointe-à-Pitre; this
tures due to salinization of groundwater. Yet, neither the link           area includes residential buildings and the main ferry
with climate-induced sea-level changes nor the timescales of              terminal of Guadeloupe;
emergence of recurrent chronic flooding have been charac-               – other residential buildings in the northern districts of the
terized so far, with more attention being given to extreme                Pointe-à-Pitre area (Lauricisque and Le Raizet, Fig. 1).
events such as cyclones and tsunamis (Pedreros et al., 2007;
Krien et al., 2015; Jevrejeva et al., 2020). For critical infras-      Mangrove areas have been largely reduced due to urban-
tructures, the current frequency of chronic flooding is not yet     ization since the 1950s (Fig. 2). In addition, 85 ha of land
affecting activities. Yet, this could be different in the future    have been reclaimed from the sea to facilitate harbor activi-
as sea level rises.                                                 ties (Roques et al., 2010). Land reclamation projects are still
   In this contribution, we aim to characterize the timescales      being investigated to further support the development of the
of emergence of chronic flooding in the area of the Petit           port of Guadeloupe.
Cul-de-sac marin, which is a hotspot for systemic vulnera-

Nat. Hazards Earth Syst. Sci., 21, 703–722, 2021                                      https://doi.org/10.5194/nhess-21-703-2021
G. Le Cozannet et al.: Timescales of emergence of chronic flooding in the major economic center of Guadeloupe                 705

Figure 1. The Petit Cul-de-sac marin area in Guadeloupe, showing urbanized areas and altitudes (map created by BRGM; data: IGN,
SHOM; © BRGM, IGN, SHOM).

   Surveys have shown that the highest water levels are ex-           – the international airport landing area (Les Abymes)
tending in the area of the Petit Cul-de-sac marin (Bourdon
and Chiozzotto, 2012): more frequent chronic flooding is re-          – a large part of the districts of Lauricisque and Bergevin
ported by interviewees in some of the reclaimed areas, and              (Pointe-à-Pitre) and some areas at Grand-Camp (Les
some local areas seem more often saturated with water. This             Abymes)
perception of rising coastal water levels is confirmed by ob-         – areas bounding Morne à Savon close to Jarry (Baie-
servations, such as soil compaction affecting roads built on            Mahault)
former mangroves, which could be due to higher groundwa-
ter levels reducing the load-bearing capacity of the backfill         – a large part of the port embankments in Jarry (Baie-
according to Bourdon and Chiozzotto (2012). Other signs of              Mahault).
rising coastal water levels include damage to concrete infras-
tructures due to the salinization of groundwater, the chronic        Hence, the observations and surveys above suggest that
flooding of the lowest zones, the destabilization of some         relative sea-level rise is causing chronic flooding and other
structure foundations and damage to the sewage system. Yet,       damage in Petit Cul-de-sac marin and in particular in Jarry
some of these impacts can also be caused by heavy rain (Pe-       (Baie-Mahault) and the Pointe-à-Pitre area. This is of major
dreros et al., 2016).                                             significance for the region, due to the critical economic role
   Fieldwork undertaken by Bourdon and Chiozzotto (2012)          of this area for the entire Guadeloupean archipelago.
has allowed for mapping the most vulnerable hotspots for
chronic flooding in the Petit Cul-de-sac marin area (Fig. 1).
                                                                  3     Data and methods
These include the following:
  – land area located close to the Rivière Salée, the saltwa-     3.1    From global to regional sea-level rise
    ter channel located between the two islands
                                                                  Contemporary global sea-level rise is due to ocean thermal
  – mangrove areas located between Gabarre and Le Raizet          expansion, the melting of mountain glaciers and ice sheets,
    (Pointe-à-Pitre)                                              and contributions from land water (Stammer et al., 2013).

https://doi.org/10.5194/nhess-21-703-2021                                   Nat. Hazards Earth Syst. Sci., 21, 703–722, 2021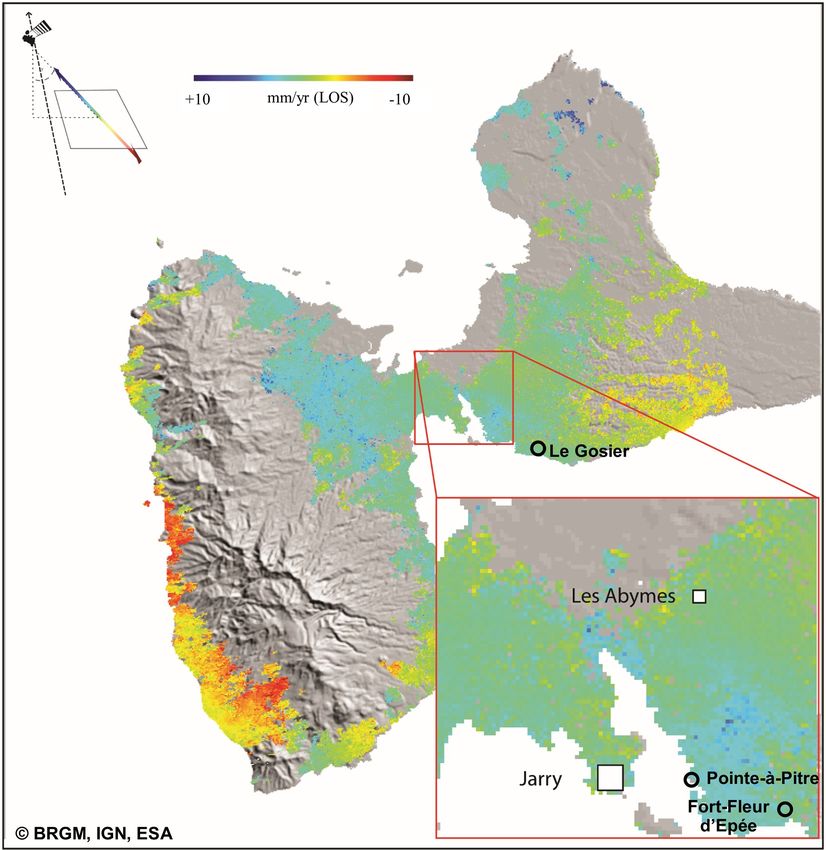
706     G. Le Cozannet et al.: Timescales of emergence of chronic flooding in the major economic center of Guadeloupe

Figure 2. Urbanization of the Petit Cul-de-sac marin area since 1960 (source: CPMG). (a) Construction of Bergevin embankments in Pointe-
à-Pitre in 1960, involving 20 ha of land reclamation; (b) Jarry before harbor development in 1964; (c) land reclamation in Jarry in 1970;
(d) Jarry and Pointe à Pitre in the 1990s.

Yet, regional sea-level changes in the Caribbean differ from           some regions, those from Meyssignac et al. (2012) perform
the global mean due to (1) sterodynamic sea-level changes              best at representing past sea-level changes and variability and
due to changes in the ocean density and circulation and in-            therefore represent the state of the art in this area (Carson et
verse barometer effects and (2) the changes in Earth’s grav-           al., 2017). They use the spatial patterns observed in the al-
itation, rotation and elastic response associated with current         timetry era on the one hand and those obtained from two
ice or water mass redistributions, as well as the viscoelastic         ocean models SODA and DRAKKAR on the other hand, thus
response of the solid Earth to the last deglaciation (glacial          resulting in three reconstructions, referred to as “Altimetry”,
isostatic adjustment, GIA) (Gregory et al., 2019). In this sub-        “Drakkar” and “Soda” hereafter.
section, we detail the data and methods used for evaluating
past and future sea-level changes in Guadeloupe.
                                                                       3.1.2   Future sea-level changes – likely range
3.1.1   Past sea-level changes
                                                                       We consider a sea-level scenario based on RCP8.5 (Repre-
The longest tidal record in Guadeloupe is short (19 years),            sentative Concentration Pathway 8.5), which assumes either
which prevents us from making a thorough characterization              an increase in greenhouse gas emissions over the remaining
of past sea-level change in this region. To complete these             decades of the 21st century (Riahi et al., 2017) or signifi-
data, we use sea-level reconstructions from 1950 to 2010 of            cant carbon emissions from the permafrost (Meredith et al.,
Meyssignac et al. (2012), which have been extensively ana-             2019). We do not consider other climate change scenarios
lyzed in the Caribbean (Palanisamy et al., 2012). Sea-level            such as RCP4.5 or RCP2.6, because they imply that all crit-
reconstructions use long (but pointwise) sea-level change              ical infrastructures related to energy and transport will un-
records from tide gauges with information from satellite al-           dergo a major transformation over the next decade (Rock-
timetry or ocean dynamic models to provide spatial maps                ström et al., 2017). Yet, there is no strong signal that such
of sea-level trends and variability (Meyssignac et al., 2012).         a transformation is being initiated (Nachmany and Mangan,
While sea-level reconstructions have limitations due to the            2018). Furthermore, we do not know how future energy and
lack of long-term in situ sea-level records for validation in          transportation infrastructures will look after such a trans-

Nat. Hazards Earth Syst. Sci., 21, 703–722, 2021                                        https://doi.org/10.5194/nhess-21-703-2021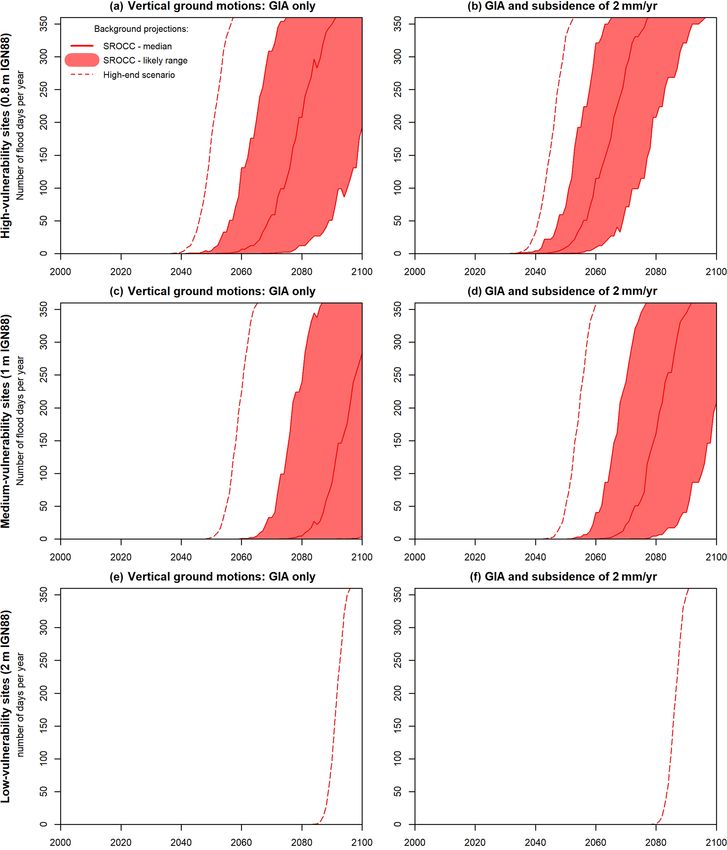
G. Le Cozannet et al.: Timescales of emergence of chronic flooding in the major economic center of Guadeloupe                  707

formation. This makes any assessment of their vulnerability         jections of each sea-level component provided in Thiéble-
highly speculative.                                                 mont et al. (2019) are estimated for the year 2100 only, we
   Sea-level projections from the fifth report of the Interna-      produce annual time series over the 21st century by fitting a
tional Panel of Climate Change (IPCC AR5) (Church et al.,           spline function to interpolate between the recent past (2007–
2013a) are available from the Integrated Climate Data Center        2020 period) and 2100. Then, we regionalize these values
of the University of Hamburg (http://icdc.cen.uni-hamburg.          following again the well-established approach of Slangen et
de/, last access: 11 February 2021) (Carson et al., 2016).          al. (2012).
Yet, the Antarctic contribution has been updated in the re-
cent IPCC Special Report on the Ocean and Cryosphere in a           3.2     Regional and local vertical ground motion
Changing Climate (SROCC). These projections superimpose
the regional effects of each component of future sea-level rise     Relative sea-level changes at the coast may be affected by
(Slangen et al., 2012, 2014; Gregory et al., 2019), that is,        regional and local vertical ground motion (Raucoules et al.,
sterodynamic effects, the melting of mountain glaciers and          2013; Woppelmann and Marcos, 2016; Martinez-Asensio
ice sheets, the contribution of land water, and GIA. These          et al., 2019). In the context of this study, regional vertical
projections do not include potential additional local verti-        ground motion may be due to regional tectonic processes,
cal ground motion (subsidence or uplift) due to regional to         whereas a local subsidence could be caused by changes in the
local natural or anthropogenic effects, which we evaluate           water content of reclaimed ground, causing sediment com-
in Sects. 3.2 and 4.2 below. For the sterodynamic effects,          paction.
we use the same climate models as in the IPCC AR5 and
SROCC reports, excluding the MIROC-ESM and MIROC-                   3.2.1    Regional vertical ground motion
ESM-CHEM climate models, which are outliers in this re-
gion. For all other components, we use the median and likely        We use different lines of evidence to characterize regional
projections of the latest SROCC report (Oppenheimer et al.,         vertical ground motion taking place at the scale of the is-
2019) and compute the regional effects in Guadeloupe us-            land. The first sources of information available are mea-
ing the regionalization method of Slangen et al. (2012) using       surements from four permanent Global Navigation Satel-
fingerprints for mass contributions.                                lite System (GNSS) stations located close to Jarry (Baie-
                                                                    Mahault) (Table 2, Fig. 4). For each of these stations, we
3.1.3   Future sea-level changes – high-end scenario                use two solutions from the Nevada Geodetic Laboratory and
                                                                    from SONEL (https://www.sonel.org/, last access: 11 Febru-
According to the SROCC, there remains a probability of              ary 2021) to evaluate potential subsidence or uplift trends
33 % for sea-level rise to lie outside the likely range. As the     at these stations (Santamaria-Gomez et al., 2017; Blewitt et
low bound of the likely range can be considered a minimum           al., 2018). Other GNSS stations are available, but they are
sea-level commitment (Le Cozannet et al., 2019), most of            not considered here either because their data times series
the discussion is focused on high-end scenarios, defined as         are too short (e.g., north Grande-Terre) or because they are
unlikely but possible scenarios above the likely range (Stam-       too close to the crater of the active volcano of La Soufrière
mer et al., 2019). The largest risks of exceeding the IPCC          of Guadeloupe, on the southern part of the western island
likely range are related to the melting of ice sheets in Antarc-    (Basse-Terre).
tica and Greenland, which involve processes that are not               The second source of information is sea-level time series
yet fully understood (Furst et al., 2015; DeConto and Pol-          at the tide gauge of Pointe-à-Pitre. This information can be
lard, 2016; Hanna et al., 2018; Pattyn, 2018; Edwards et al.,       used to further evaluate vertical ground motion, either by
2019; Oppenheimer et al., 2019). Today, high-end scenarios          combining it with regional sea-level trends from satellite al-
are increasingly considered relevant for the most risk-averse       timetry (Cazenave et al., 1999) or by analyzing the different
users (Nicholls et al., 2014; Hinkel et al., 2015; Hinkel et al.,   modes of spatial and temporal variability in sea-level time
2019), such as for the port, industrial and commercial facili-      series (Kopp, 2013). The first technique comes with large
ties of our case study.                                             uncertainties (Ablain et al., 2015; Le Cozannet et al., 2015;
   So far, IPCC authors have refused to provide projections         Woppelmann and Marcos, 2016). Yet, it can still be useful to
beyond the likely range, considering that existing results are      identify or reject very fast coastal vertical ground motion, on
not robust enough (Church et al., 2013b). Yet, since the            the order of centimeters per year, as shown for example in
AR5, other studies have proposed high-end scenarios (Jack-          the case of Manila in the Philippines (Santamaria-Gomez et
son and Jevrejeva, 2016; Le Bars et al., 2017; Kopp et al.,         al., 2012; Raucoules et al., 2013).
2017; Thiéblemont et al., 2019). Here, we use the global as-           Observations of vertical ground motion with GNSS sta-
sumptions of Thiéblemont et al. (2019) (their “high-end B”),        tions include the effects of the GIA, which are also included
which follow a “worst-model” approach, that is, not neces-          in regional sea-level-rise projections discussed in Sect. 3.1.
sarily the upper limit to sea-level rise but a set of upper val-       Overall, the tide gauge measurements are short-term
ues available from the literature (Table 1). As high-end pro-       (19 years; see Sect. 3.3) and the GNSS data include discon-

https://doi.org/10.5194/nhess-21-703-2021                                      Nat. Hazards Earth Syst. Sci., 21, 703–722, 2021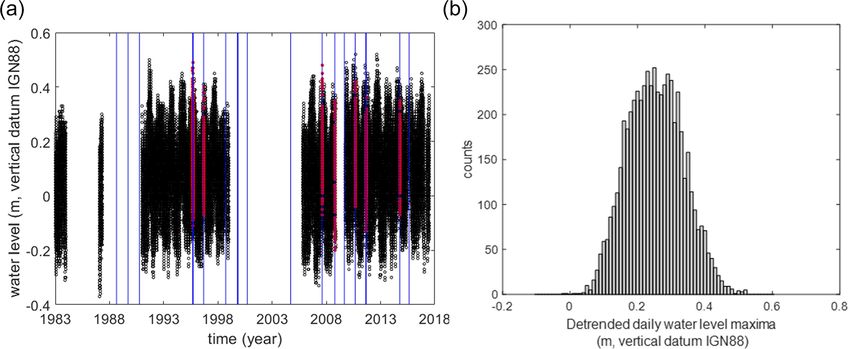
708       G. Le Cozannet et al.: Timescales of emergence of chronic flooding in the major economic center of Guadeloupe

Table 1. Assumptions for global mean contributions to sea-level changes by 2100 relative to 1986–2005 for the AR6 SROCC median and
likely range (in parentheses) and for our high-end scenario and its implications in Guadeloupe. (See Thiéblemont et al., 2019). Note: the likely
range of the sum is not equal to the sum of the likely range due to dependencies between components (Church et al., 2013a; Le Bars, 2018).
We extract Guadeloupe data at the following coordinates: 16◦ N, 61◦ W. The computation of the total uses the same dependency schemes as
the regional approach of Church et al. (2013a), which, together with the choice to remove MIROC-ESM and MIROC-ESM-CHEM models,
accounts for differences with the data published in SROCC (Oppenheimer et al., 2019).

  Component                            RCP8.5                          RCP8.5                          High-end     High-end
                                       IPCC AR6 SROCC (exclud-         IPCC AR6 SROCC                               Guadeloupe
                                       ing MIROC-ESM and MIROC-        Guadeloupe
                                       ESM-CHEM for sterodynamic
                                       effects)
  Sterodynamic effects                 0.30 (0.18 to 0.42) m           0.30 (0.23 to 0.37) m           –            0.37 m (based on worst model)
  Glaciers                             0.18 (0.10 to 0.26) m           0.17 (0.10 to 0.25) m           0.29 m       0.27 m
  Greenland ice sheet                  0.1 (0.04 to 0.22) m            0.09 (0.04 to 0.20) m           0.23 m       0.21 m
  (surface mass balance)
  Greenland ice sheet                  0.05 (0.02 to 0.09) m           0.05 (0.02 to 0.07) m           0.11 m       0.09 m
  (dynamic effects)
  Antarctic ice sheet (surface mass    −0.05 (−0.09 to −0.02) m        −0.05 (−0.09 to −0.02) m        0.0 m        0.0 m
  balance)
  Antarctic ice-sheet dynamic ef-      0.16 (0.02 to 0.37) m           0.20 (0.02 to 0.46) m           0.80 m       0.99 m
  fects
  Groundwater                          0.05 (−0.01 to 0.11) m          0.048 (-0.016 to 0.11) m        0.11 m       0.11 m
  GIA                                  –                               0.018 (0.005 to 0.031) m        –            0.031 m
  Total                                0.80 (0.52 to 1.16) m           0.82 (0.55 to 1.17) m           –            2.07 m

Table 2. Trends obtained from the two GNSS stations located close to Jarry.

                        GNSS station                    Solution of the Nevada Geodetic        Solution of the University of La
                                                        Laboratory (NGL)                       Rochelle (SONEL)
                        ABMF (Les Abymes)               −5.7 ± 1.9 mm/yr                       −4.2 ± 0.2 mm/yr, not robust
                        FFE0 (Fort Fleur D’Epée)        3.5 ± 1.6 mm/yr                        Not computed: not robust
                        Pointe-à-Pitre PPTG             −3.7 ± 3.3 mm/yr                       Not computed: too short
                        Le Gosier                       −0.3 ± 1.8 mm/yr                       Not computed: too short

tinuities, perhaps due to instrumentation changes or earth-                  this range of wavelengths, the SAR instruments can acquire
quakes. Hence, we do not expect to obtain a single reliable                  images in the day and at night, regardless of the meteorolog-
assessment, but instead, we use these lines of evidence to de-               ical conditions. The possibility of a continuous illumination
sign contrasting scenarios for future vertical ground motion.                of the radar and the orbital characteristics of the satellites
                                                                             makes it possible to distinguish two geometric configurations
3.2.2     Local vertical ground motion                                       for the acquisitions: the so-called “descending” orbits, during
                                                                             which the satellite moves approximately from the northeast
To characterize local vertical ground motion, we use                         to the southwest, and “ascending” orbits, during which the
synthetic-aperture radar (SAR) interferometry. This tech-                    satellite moves from southeast to northwest.
nique has increasingly been used in various fields of Earth                     In this study, we used 34 images of the Advanced Syn-
sciences since the 1990s to measure and detect the deforma-                  thetic Aperture Radar (ASAR) sensor of the European En-
tion of the ground surface (Gabriel et al., 1989; Massonnet et               visat satellite acquired between 19 January 2003 and 10 Jan-
al., 1993). The SAR is an active system, which sends out its                 uary 2010. The images belong to track/frame 75/315 in an
own source of illumination, emitting waves in the microwave                  ascending orbit (de Michele, 2010). All possible interfero-
field of the electromagnetic spectrum. A first antenna emits a               metric couples are calculated from 34 SAR data. We keep
signal (wave beam), which is then recorded by another or the                 only the differential interferograms characterized by a short
same antenna after its backscattering on the Earth’s surface.                perpendicular baseline, which determines the sensitivity of
As the atmosphere and the clouds are almost transparent in

Nat. Hazards Earth Syst. Sci., 21, 703–722, 2021                                                  https://doi.org/10.5194/nhess-21-703-2021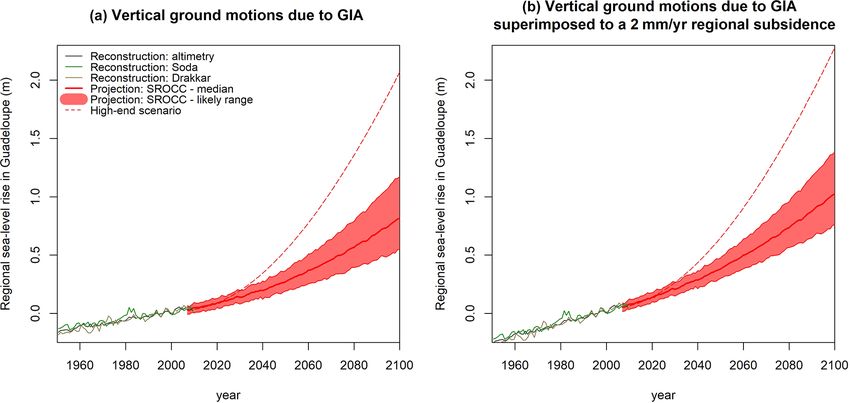
G. Le Cozannet et al.: Timescales of emergence of chronic flooding in the major economic center of Guadeloupe                     709

the signal to the topography and impacts the interferograms’         3.4    Exposure of coastal sites
quality due to geometric decorrelation. Thus, we will intrinsi-
cally use the interferograms that are not (or little) affected by    We evaluate the altitude of 34 priority coastal sites identified
the topography. We set the threshold of perpendicular base-          as vulnerable to chronic flooding by Bourdon and Chioz-
lines to 150 m. Thus, 65 differential interferograms with the        zotto (2012). No precise measurement of the altitudes is
short baseline are calculated.                                       given in this report, but we benefit from recent lidar mea-
   To exploit the entire interferometric SAR (InSAR)                 surements in Guadeloupe (Litto3D® – IGN & SHOM) to es-
database, we use a processing method known as the small              timate their altitude. This comes with the limitations of the
baseline subset or SBAS (Berardino et al., 2002). This               exact location of each site, with a few horizontal meters of
method, developed by Usai et al. (2003), is implemented in           geolocation errors potentially accounting for different pixels
the GAMMA tool chain (from Gamma Remote Sensing AG)                  in the lidar maps, and therefore errors in the evaluation of the
under the name of multi-baseline (Wegmüller et al., 2009).           altitude. The Litto3D© dataset itself has typically errors on
As a result, we produce a map of linear velocities, measured         the order of 0.2 m vertically. Bourdon and Chiozzotto (2012)
along the line of sight of the satellite, that is, making an angle   classified the coastal sites into three categories: low (8 sites),
of 23◦ on the vertical.                                              medium (13 sites) and high (13 sites) vulnerability to chronic
                                                                     flooding, based on multi-parameter analysis on the field and
3.3   Total water levels causing chronic flooding                    surveys (Fig. 1).

We compute the daily high water levels (one value per day)           3.5    Synthesis – evaluation of past and future chronic
using the hourly water level measurements of a tide gauge                   flooding
located at Pointe-à-Pitre (tide gauge location is 16.2244◦ N,
61.5315◦ W;         https://doi.org/10.17183/REFMAR#125).            We compute the number of chronic flooding days per year by
These measurements are provided by the French Naval                  computing the number of days the daily water level exceeds
Hydrographic and Oceanographic Service (SHOM) and                    given altitudes. Daily water levels are computed as the sum
available in the Refmar database (https://data.shom.fr/, last        of projected mean sea-level changes with the daily maxima
access: 11 February 2021). In June 2017, these data covered          of water levels resulting from tide, surges and mean seasonal
about 19 years of useful data, starting on 4 January 1983.           variations related to the regional circulations. As we are inter-
The observed tidal signal includes effects of the following          ested in chronic flooding, we exclude the water levels result-
phenomena: tides (tidal range up to about 0.40 m); mean              ing from cyclone events in the present study. Our approach
sea-level seasonal variations related to oceanic circulations        neglects the effect of sea-level rise on tidal characteristics
(ranging between about 0.1 and 0.3 m depending on the                (see Sect. 5.4), and we also note that although the coastline
years); and storm surges, caused by either tropical storms           is largely reclaimed and stabilized, the area is mostly free
or cyclones. Here we aim to characterize the highest water           from flood defenses such as small walls or dikes that could
levels per day, relative to mean sea level and representative        prevent chronic flooding from taking place.
of moderate conditions, that is, excluding effects of cyclone
events. To do so, we proceed as follows: after a quality
check and cleaning of the data, we identify 20 cyclones over         4     Results
the study period, representing 106 d, using IBTrACS data
                                                                     4.1    Regional sea-level rise
(Knapp et al., 2010), together with Météo-France informa-
tion. Data from these days are removed from our datasets.            Geocentric sea-level reconstruction projections for Guade-
Then, we keep only the years with a completeness of 90 %,            loupe are presented in Fig. 3a. The reconstructions are the
in order to properly account for mean sea-level seasonal             same as in Palanisamy et al. (2012): they display regional
variations. We also keep only days with no gaps in order to          sea-level changes that are similar to the global average from
properly account for the tide fluctuations in the distribution.      1950 to 2010. The projections correspond to the regionaliza-
The final dataset covers 16 years (1983, 1991 to 1997, 2006,         tion of the global values presented in Table 1. The regional
2007, 2010 to 2014, 2016, each covered at more than 90 %).           global median and likely sea-level projections in Guade-
Then, we detrend the data from observed sea-level rise at            loupe remain close to the global average (Oppenheimer et al.,
the tide gauge, over the period of observations (0.7 mm/yr).         2019). Yet, the high-end scenario is slightly higher in Guade-
Finally, we extract the daily maxima from these datasets             loupe than at a global scale. This is due to high-end scenarios
and reference them vertically with respect to the terrestrial        involving larger contributions from the Greenland ice sheet
vertical datum IGN88, for a mean sea level corresponding to          surface mass balance (Fürst et al., 2015) and Antarctic dy-
the one of 31 December 2016.                                         namics of marine ice sheets (Spada et al., 2013; Ritz et al.,
                                                                     2015; DeConto and Pollard, 2016; Edwards et al., 2019). In
                                                                     fact, the mass losses in these two polar regions change the
                                                                     Earth’s gravitational field and rotation in a way that cause

https://doi.org/10.5194/nhess-21-703-2021                                      Nat. Hazards Earth Syst. Sci., 21, 703–722, 2021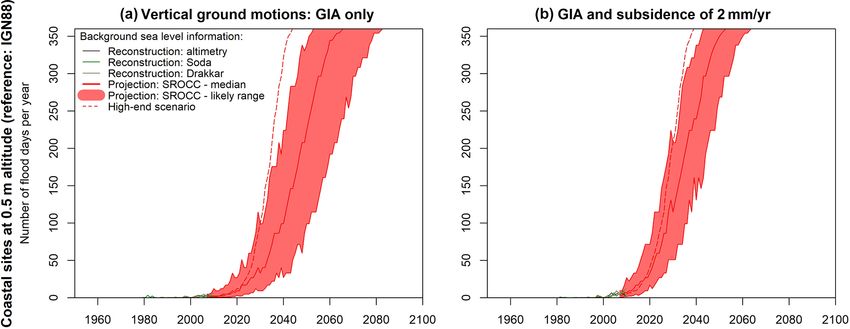
710      G. Le Cozannet et al.: Timescales of emergence of chronic flooding in the major economic center of Guadeloupe

Figure 3. Sea-level reconstructions and projections for Guadeloupe, with respect to 1986–2005: (a) assuming vertical ground motions
are due to GIA only and (b) assuming an additional regional subsidence of 2 mm/yr. The three reconstructions refer to those presented in
Palanisamy et al. (2012). The projections are regional implications of the Special Report on the Ocean and Cryosphere in a Changing Climate
(Oppenheimer et al., 2019). The high-end is the regional implication of the high-end projections presented in Thiéblemont et al. (2019).

sea levels to rise faster in tropical regions such as Guade-            (0.7 mm/yr) but not in the sea-level estimate from altimetry
loupe (Slangen et al., 2012, 2014; Kopp et al., 2014).                  and in the background vertical ground motion from Kopp et
                                                                        al. (2014). These GIA effects account for a subsidence of
4.2     Regional and local vertical ground motion                       approximately 0.18 ± 0.1 mm/yr according to the two GIA
                                                                        models used in the IPCC. Again, these estimate are uncer-
4.2.1    Regional vertical ground motion                                tain, and the error could exceed 1 mm/yr, as it is based on
                                                                        two GIA models only (Jevrejeva et al., 2014).
The results obtained by the two groups of the Nevada Geode-                Hence, we obtain contrasting trends (Tables 2 and 3),
tic Laboratory (NGL) and the University of La Rochelle                  which are consistent with those estimated from previous
(SONEL) are presented in Table 2. They reveal contrast-                 work (Sakic et al., 2020). They may reflect different verti-
ing trends, with one uplifting station and two others sub-              cal motion in the area of each GNSS station, some very local
siding. Yet, the quality of the data is also limited, with two          vertical ground motion not monitored by InSAR, or unreli-
time series displaying discontinuities potentially due to sys-          able trends due to system changes and short time series.
tem changes and two others that are too short. While the
area is affected by different earthquakes, including subduc-            4.2.2   Local vertical ground motion
tion earthquakes (low-angle thrust, e.g., in 1843), intraplate
events (e.g., 2004) and volcanic events, no obvious connec-             The multi-temporal processing of the data, carried out us-
tions with existing discontinuities in GNSS time series have            ing the GAMMA tool, delivers two products that highlight
been identified.                                                        the ground displacements on the islands of Guadeloupe and
   Furthermore, the tide gauge of Le Gosier does not mea-               its evolution during the observation period (2003–2010). In
sure a very rapid rate of relative sea-level rise but only a            short, we measure changes in distances between the ground
trend of 0.7 mm/yr, as with the Refmar data (Table 3). This             surface and the satellite at different passes over Guadeloupe.
estimate comes with large uncertainties due to relatively               These movements are displayed in color-coded form, where
short-term and scarce data, but it still suggests low verti-            red represents an increasing distance from the radar target of
cal ground motion at the tide gauge, since the geocentric               the satellite and blue represents a decreasing distance of the
sea-level-rise rates, as computed from satellite altimetry, are         radar target towards the satellite (convention chosen by the
1.9 ± 0.9 mm/yr (Palanisamy et al., 2012). Furthermore, the             authors). Given the configuration of the satellite and the data
background vertical ground motion computed directly from                acquisition geometry, we conclude that the ground move-
the sea-level time series is −0.05 ± 4 mm/yr (Kopp et al.,              ment highlighted in the linear velocity map (Fig. 4) could be
2014), suggesting again stability but with large uncertainties.         due to subsidence-type vertical motion (red) or uplift (blue)
   The effects of GIA are included in the geocentric ver-               or projection of horizontal movement onto the line of sight.
tical ground motion estimates from GNSS stations and in                 Figure 4 shows a ground movement around the Bouillante
the sea-level trend directly computed from the tide gauge               bay on the order of 3–6 mm/yr over the observation period,

Nat. Hazards Earth Syst. Sci., 21, 703–722, 2021                                          https://doi.org/10.5194/nhess-21-703-2021
G. Le Cozannet et al.: Timescales of emergence of chronic flooding in the major economic center of Guadeloupe 711
Table 3. Pointwise vertical ground motions estimates from different sources.
Source Reference frame Estimate Residual uncertainties
Global isostatic adjustment Geocentric 0.18 ± 0.1 mm/yr, based on two GIA Regional constraints on GIA models
models (GIA) models, as in Church et al. (2013) (Jevrejeva et al., 2014)
GNSS stations Geocentric From −5.7 to 3.5 ± 1.9 mm/yr Interventions on the devices, earth-
(Santamaria-Gomez et al., 2017; Ble- quakes
witt et al., 2018)
Satellite altimetry mean sea- Geocentric 1.9 ± 0.9 mm/yr (Palanisamy et al., Regional residual uncertainties as large
level rise 2012) as 1–2 mm/yr (Ablain et al., 2015)
Trend at the Pointe-à-Pitre tide Local terrestrial 0.7 mm/yr (see Sects. 3.3 and 4.3) Short time series (19 years) with gaps
gauge
Background subsidence at the Local terrestrial −0.05 ± 4 mm/yr (Kopp et al., 2014) Short time series (19 years) with gaps
Pointe-à-Pitre tide gauge
Yet, the area of the Petit Cul-de-sac marin, which is the
focus of this study, appears relatively stable: we find vertical
ground motion of 0.4 mm ± 1 mm/yr in Jarry (Baie-Mahault)
with respect to Les Abymes (close to the airport, Table 2).
The error is computed as 1 standard deviation of the ver-
tical ground motion measured in the 35 pixels in the Jarry
area. This is at the limit of the techniques, so this vertical
ground motion can be considered insignificant. Since there
are no measurements from the Envisat platform after Decem-
ber 2010, this velocity estimation via linear regression should
be considered carefully. In fact, non-linear ground motion
due to different phenomena (water table variations, local sub-
sidence and uplifts) and uncompensated tropospheric delays
could bias the velocity estimation for a short time of obser-
vation.
Furthermore, this first estimate is affected by the filtering
performed within the InSAR processing procedure. To com-
plete this error assessment, we also calculate an upper bound
for the error by dividing the typical residual error from the
atmospheric fluctuations (typically 10 mm on a single in-
terferogram at a city scale) (Williams et al., 1998) by the
mean duration between two acquisitions and the square root
Figure 4. Linear velocity map from the multi baseline InSAR of the number of independent interferograms (Le Mouelic et
method. These results are based on the analysis of 34 radar scenes al., 2005). We find 5 mm/yr for an upper bound of errors in
acquired between 2003 and 2010 by the ASAR sensor on Envisat
the InSAR-based vertical ground motion maps. While this is
of the European Space Agency (map created by BRGM; data: IGN,
ESA; © BRGM, IGN, ESA).
large, this is not sufficient to explain the discrepancies be-
tween different GNSS measurements.
Hence, the uncertainties associated with the measurements
of ground motion velocities range from 1 mm/yr (based on
perhaps due to very slow gravitational landslides or ground
the variability in observations) to 5 mm/yr (maximum possi-
subsidence. If these movements are revealed to be linear over
ble value). Given these uncertainties, we could not detect any
time, they will represent a major contribution to relative sea-
local vertical ground motion in the area of the Petit Cul-de-
level changes along the western coast of Basse-Terre for the
sac marin, suggesting that local increases in chronic flooding
decades to come. This could be further investigated in fu-
events are unrelated to rapid (centimetric) but local vertical
ture studies, also considering the fact that the observed signal
ground motion. Although the 7 years of the processed SAR
could result from complex 3-dimensional processes, which
archive is the longest data acquisition period available in the
could be characterized using both ascending and descending
region, combination with other missions (such as Sentinel-1)
modes when more SAR or GNSS data are available.
https://doi.org/10.5194/nhess-21-703-2021 Nat. Hazards Earth Syst. Sci., 21, 703–722, 2021712 G. Le Cozannet et al.: Timescales of emergence of chronic flooding in the major economic center of Guadeloupe
could be considered in further works to address other related blue line in Fig. 5 corresponds to the cyclone that induced
scientific questions such as the potential motion on the east- the strongest flood over the period of interest (Hugo, 1989).
ern coast of Basse-Terre. The daily maxima of total water levels shown in Fig. 5b
are caused not only by tidal variations but also by non-
4.2.3 Scenarios for vertical ground motion cyclonic surges and other processes causing seasonal to in-
terannual sea-level variations. For example, the largest water
To summarize, the vertical ground motion maps derived from level record over 1983–2016 corresponds to a seasonal-high
InSAR suggest stability with respect to a terrestrial reference monthly mean sea-level record. Hence, once removed from
frame in the area of Jarry (Baie-Mahault) and Pointe-à-Pitre, the cyclone events, we obtain a distribution of the highest
within the error of the InSAR technique. Hence, we reject the daily water levels, which are representative of moderate con-
hypothesis that each individual GNSS or tide gauge instru- ditions. As a consequence, the distribution of daily high wa-
ment considered above is measuring different vertical ground ter levels is suitable for the study of chronic flooding, driven
motion that is representative of some local processes such as by tides; seasonal variations in mean sea levels; and non-
sediment compaction linked to variations in the groundwa- cyclonic surges.
ter contents. Therefore, the contrasting trends given by the
different instruments could be due to very local processes af- 4.4 Exposure of coastal sites
fecting single antennas or to discontinuities due to system
changes. In fact, the trends range from −6 to 3.5 mm/yr (Ta- Table 4 shows the altitude of vulnerable coastal sites iden-
bles 2 and 3), which correspond to very rapid subsidence and tified by Bourdon and Chiozzotto (2012) based on lidar
uplift rates. Furthermore, all measurements are scarce and in- Litto3D© data (see Fig. 6 for exact location and altitude
clude discontinuities, to the point that they are considered not of these vulnerable coastal sites). This analysis shows that
robust as per the SONEL assessment. Hence, we suggest that the median altitude of high-vulnerability sites is 0.8 m in
these trends are suspect and more research is needed to un- the local reference frame (IGN88). Medium- and high-
derstand and project vertical ground motion trends in Guade- vulnerability sites have median altitudes of 1 and 2 m, re-
loupe. spectively, in the local reference frame. Some individual alti-
Based on these lines of evidence, we define scenarios for tudes are doubtful, suggesting errors in geo-referencing of
vertical ground motion in Jarry (Baie-Mahault). In a sim- the coastal site or in the lidar dataset itself, as discussed
ilar manner to climate scenarios for sea-level-rise projec- in Sect. 3.2. Due to these suspicious values, we consider
tions (Stammer et al., 2019), to address deep uncertainties here only the median altitude of each category of vulnerable
we define two scenarios for future vertical ground motion in coastal site.
Guadeloupe:
– vertical ground motion essentially due to GIA effects, 4.5 Synthesis – past and future chronic flooding
that is, of 0.18 ± 0.1 mm/yr of subsidence, based on an hazards for vulnerable coastal sites
assumption of no significant vertical ground motion and
the computation of errors in the Jarry area (Table 2, The number of submersions per day from 1950 to 2100 is
Fig. 3a) presented in Fig. 7 for the three idealized vulnerable coastal
sites and for the two subsidence scenarios. The results show
– a “high-end” subsidence scenario of 2.3 mm/yr, corre- that depending on the actual altitude of each site, a rapid
sponding to a possible regional subsidence of 2 mm/yr increase in the number of flood days per year is expected
superimposed onto a GIA-induced subsidence of to take place sooner or later during the second half of the
0.3 mm/yr, which is the upper bound of GIA effects ac- 21st century. This is consistent with previous work under-
cording to the IPCC projections (Table 2, Fig. 3b). taken in other coastal sites (e.g., Sweet and Park, 2014),
Furthermore, although we consider a linear rate of vertical and it can be explained by the projected acceleration of sea-
ground motion, we recognize that it may occur non-linearly, level rise after 2050 under RCP8.5. Furthermore, the mean
for example in the case of a tectonic or volcanic event. high water level in Guadeloupe is only 12 cm above mean
sea levels in Guadeloupe (source is SHOM – Naval Hydro-
4.3 Total water levels causing chronic flooding logic and Oceanographic Service). Therefore, the duration
of each chronic flooding event increases rapidly as well af-
Figure 5a shows the raw water level signal, and Fig. 5b shows ter the first events have been observed. For example, assum-
the distribution of total water level maxima obtained follow- ing that the first event is observed in 2050 at a given site,
ing the method described in Sect. 3.3. Figure 5a displays the mean sea level would exceed the local critical elevation by
cyclonic events as blue lines, which we further highlight in 2063 [2059, 2070] (median with the likely range in square
red where these events affect our dataset. Cyclone-induced brackets) for the ground motion scenario including GIA only,
storm surges can reach several tens of centimeters at Pointe- by 2057 for the high-end sea-level-rise scenarios involving
à-Pitre (e.g., ∼ 0.4 m for the David cyclone, 1979). The first large melting from Antarctica and even by 2056 if an ad-
Nat. Hazards Earth Syst. Sci., 21, 703–722, 2021 https://doi.org/10.5194/nhess-21-703-2021G. Le Cozannet et al.: Timescales of emergence of chronic flooding in the major economic center of Guadeloupe 713
Figure 5. Tide gauge data. (a) Time series of raw data (black: raw cleaned data; red: data removed from the analysis and corresponding to the
cyclones, identified with blue lines). (b) Distribution of total water level daily maxima, after the water level data post-processing described
in Sect. 3.3 (cyclone removed, year and day filtering, detrended sea-level rise).
Table 4. Altitude of coastal locations according to the lidar altitude dataset (reference: regional geodetic reference, IGN88). See Fig. 7 for
the precise location of each site.
Exposure to chronic flooding Mean Median Minimum Maximum Standard
(after Bourdon and Chiozzotto, 2012) value value deviation
Low 2.3 m 2.0 m 0.6 m 6.8 m 2.0 m
Medium 1.2 m 1.0 m −0.2 m 2.4 m 0.8 m
High 0.8 m 0.8 m −0.3 m 2.1 m 0.7 m
ditional subsidence of 2 mm/yr is accounted for. We do not 0.5 m, the model predicts 1 day of chronic flooding after the
know whether stakeholders will respond to early signals of 1990s (Fig. 8). Yet, there are also coastal sites where chronic
chronic flooding events or to later signals when flooding du- flooding has been observed, although the altitude according
rations increase. However, the study of Bourdon and Chioz- to the lidar dataset is well above 1 m (Bourdon and Chioz-
zotto (2012) was motivated by stakeholders being concerned zotto, 2012). This suggests that observed chronic flooding
about chronic flooding. This suggests that coastal adaptation (Sect. 2) is not yet completely driven by sea-level rise; on
practitioners are sensitive to early signals. the contrary, the interactions between sea levels, the ground-
In the remainder of this paper, we discuss to what extent water table and rainfall events, which we do not model here,
we can attribute observed chronic flooding to sea-level rise probably play a significant role today.
(Sect. 5.1), what are the times of emergence of chronic flood- To our knowledge, there are no observations or modeling
ing events depending on the scenario considered (Sect. 5.2), results allowing us to assess precisely the role of changing
the implications for coastal management (Sect. 5.3) and the groundwater levels in Jarry. Yet, the role of changing ground-
limitations of our approach (Sect. 5.4). water levels should not be ruled out because a significant part
of the infrastructure has been built on a former mangrove.
Reports from the administration in charge of implementing
5 Discussion flooding prevention policies acknowledge the role of rainfall
and water runoff, not only during cyclones but also during
5.1 Attribution of observed chronic flooding seasonal heavy-rainfall events (DEAL, 2015). The regulatory
documents remind us that in an urbanized area such as Jarry,
Whatever the scenario considered, Fig. 7 shows that chronic soil sealing prevents water from infiltrating the ground, and
flooding is not expected to emerge earlier than 2030 for an al- the water drainage system can be temporarily challenged.
titude of 0.8 m (reference frame is IGN88) corresponding to Hence, our results suggest that sea-level rise may already
an average high-vulnerability coastal site. Yet, the lidar data have caused chronic flooding at coastal sites with the lowest
show that some coastal sites have an altitude below this value altitudes. Yet, we do not formally attribute observed chronic
(Table 4, Fig. 6). For example, if we consider an altitude of flooding to sea-level rise alone because the lowest sites are
https://doi.org/10.5194/nhess-21-703-2021 Nat. Hazards Earth Syst. Sci., 21, 703–722, 2021714 G. Le Cozannet et al.: Timescales of emergence of chronic flooding in the major economic center of Guadeloupe
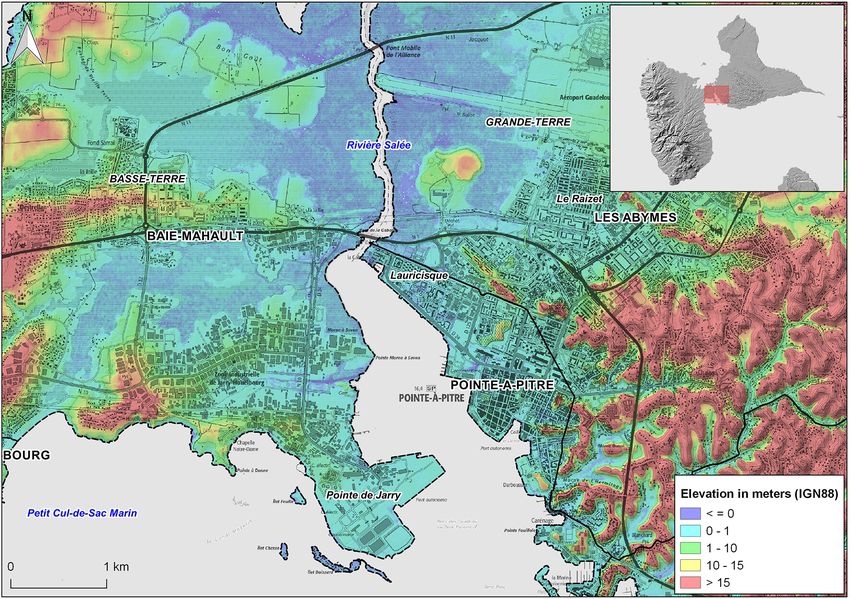
Figure 6. Vulnerable sites identified by Bourdon and Chiozzotto (2012) and their degree of vulnerability and altitude in the Petit Cul-de-sac
marin area in Guadeloupe (map created by BRGM; data: IGN, SHOM; © BRGM, IGN, SHOM).
not always those where chronic flooding has been reported. Despite being unlikely, high-end scenarios beyond the
Some of the chronic flooding events observed today may in- likely range can provide useful information for risk-averse
volve groundwater rise, rainfall and runoff as well (Bourdon users (Stammer et al., 2019), such as airport and harbor au-
and Chiozzotto, 2012; DEAL, 2015). thorities and the electricity or hydrocarbon providers in Jarry
(Baie-Mahault) (Fig. 1). For our high-end scenario, chronic
5.2 Emergence of chronic flooding flood events driven by sea-level rise occur 1 decade earlier
than for the upper bound of the likely range (dotted line in
For coastal sites above 0.8 m (IGN88), the onset of chronic Fig. 7). Furthermore, once the process is initiated, chronic
flooding is not projected to take place before the 2030s flood events happen every day 1 decade after their emer-
(Fig. 7). If we rely on the SROCC sea-level scenarios, the gence. Therefore, as expected, the high-end scenario leaves
high-vulnerability sites are projected to start experiencing even less time for adaptation than the baseline SROCC-based
chronic flooding in 2050 (2040 if we assume a regional subsi- sea-level-rise projections.
dence of 2 mm/yr) (Fig. 7). Yet, the number of flood days per
year increases rapidly after the emergence of chronic flood- 5.3 Potential measures to manage future chronic
ing: for example, high-vulnerability coastal sites are likely to flooding events
be flooded 180 d/yr between 2060 and 2100 (between 2050
and 2070 if we assume subsidence) (Fig. 7). This rapid in- A first measure to prevent the future impacts of chronic
crease in the number of flooding days will leave little time flooding would be to limit sea-level rise by reducing green-
for adaptation. The reasons for this are threefold: first, the house gas emissions. By doing so, chronic flooding would
low altitude and the absence of defenses in the Petit Cul-de- not be avoided in the locations identified as vulnerable in
sac marin; second, the variability in daily maxima of total the Petit Cul-de-sac marin, because sea level will continue
water levels is roughly 0.4 m only (Fig. 5); and third, most to rise at least at rates of 3 mm/yr for decades (Oppenheimer
of the coastal sites will start to experience chronic flooding et al., 2019). Yet, the impacts would emerge later and at
after 2050, that is, once sea-level rise has started accelerating slower rates, thus giving more time for adaptation. Further-
significantly as per RCP8.5 (Fig. 3). more, the structural changes in the economy that are required
Nat. Hazards Earth Syst. Sci., 21, 703–722, 2021 https://doi.org/10.5194/nhess-21-703-2021G. Le Cozannet et al.: Timescales of emergence of chronic flooding in the major economic center of Guadeloupe 715 Figure 7. Reconstruction and projections of chronic flooding events, for two subsidence scenarios and three idealized types of coastal sites in Jarry and Pointe-à-Pitre. The color code is the same as in Fig. 3. to achieve climate goals (Rockström et al., 2017) would of- the interactions between rainfall, groundwater flows and sea- fer an opportunity to reconsider the location and the nature level changes in the former mangrove areas, which include of critical infrastructures in Guadeloupe and elsewhere. fine sediments and porous soils. Hence, raising the ground Without climate change mitigation, adaptation of coastal levels could be an efficient adaptation measure. Yet, this mea- infrastructures will be required in the Petit Cul-de-sac marin, sure should be taken for a large number of already urbanized possibly as early as the 2030s, regardless of evolution in the locations, which could be a challenge for port maintenance intensity or the trajectory of tropical cyclones and hurricanes operations due to limited resources. for futures decades (Chauvin et al., 2020). Figure 7 shows Besides sea-level rise, other cascading impacts such as the that a small difference in the elevation of coastal areas allows combined effects of sea-level rise and wave changes could us to avoid chronic flooding for decades. Yet, small walls also affect port operability (Camus et al., 2019). Yet, our or dikes would not be efficient in this particular case due to understanding of the coastal area is that the most urgent https://doi.org/10.5194/nhess-21-703-2021 Nat. Hazards Earth Syst. Sci., 21, 703–722, 2021
716    G. Le Cozannet et al.: Timescales of emergence of chronic flooding in the major economic center of Guadeloupe

Figure 8. Reconstruction and projections of chronic flooding events, for two subsidence scenarios and a coastal site located at an altitude of
0.5 m (local reference frame, IGN88). The color code is the same as in Fig. 3.

climate-related challenge for Jarry (Baie-Mahault) is adap-              on almost all tropical islands worldwide over the coming
tation to chronic flooding induced by sea-level rise. Other              3 decades.
challenges include prevention of and preparedness for cy-
clones, heavy tropical rainfall and tsunamis and sustaining              5.4    Limitations of the approach and residual
ecosystem services (Pedreros et al., 2007; Krien et al., 2015;                  uncertainties
Jevrejeva et al., 2020; Chauvin et al., 2020). In particular,
one important issue will be the management of storm water
                                                                         Our results are associated with a number of residual uncer-
drainage in a context where the soil is largely impermeable
                                                                         tainties: first, more research would be needed to characterize
due to the sprawl of commercial and industrial areas.
                                                                         vertical ground motion on the islands and potentially define
   Overall, the situation in Guadeloupe is representative of
                                                                         more precise subsidence scenarios (Sect. 4.2). Together with
many other tropical islands where critical infrastructures are
                                                                         the actual rates of future sea-level changes, this local feature
located in low-lying-areas (e.g., atoll islands but also high is-
                                                                         is probably the largest source of uncertainty relevant to our
lands such as Réunion, the Society Islands in Polynesia, the
                                                                         estimate of times of emergence of future chronic flooding.
Lesser Antilles) and where extreme total water level events
                                                                            Other residual uncertainties relate to the assumption that
have relatively small amplitudes (Oppenheimer et al., 2019).
                                                                         the highest water levels are simply translated upwards as sea
In such areas, the increasing number of chronic flooding
                                                                         level rises. In fact, we assume here that the potential effect
events will become a challenge for coastal management.
                                                                         of the sea-level rise on the tidal characteristics is negligible
   To better manage adaptation to such chronic flooding
                                                                         in comparison to the sea-level-rise contribution itself. This
events, we could learn from areas that have experienced rapid
                                                                         assumption is supported by global studies showing that the
relative sea-level changes due to vertical ground motions. For
                                                                         Caribbean islands could be affected by an increase in M2
example, a village in the Torres Islands (Vanuatu) was relo-
                                                                         (and also S2 and O1) and mean high water levels (account-
cated in 2002–2004 due to chronic flooding events caused by
                                                                         ing only for M2, S2, K1 and O1) but in relatively small pro-
relative sea-level changes partly attributed to an earthquake
                                                                         portions (Pickering et al., 2017; Schindelegger et al., 2018).
(Ballu et al., 2011). Another earthquake that took place in
                                                                         For example, the amplitude of M2, S2, K1 and O1 would in-
2013 in the Philippines caused the subsidence of several is-
                                                                         crease by about 25, 10, 0 and 10 mm, respectively, assuming
lands (e.g., Batasan, Ubay) and chronic flooding events for
                                                                         no shoreline recession at the coast, for a uniform sea-level
up to 135 d/yr. Yet, people from these islands preferred ac-
                                                                         rise of 2 m, after Pickering et al. (2017). This implies that
commodating to chronic flooding in this case (Jamero et al.,
                                                                         taking into account this effect would only slightly modify
2017). Hence, the local adaptation response can be very dif-
                                                                         the projected times of emergence (Figs. 7 and 8) and that the
ferent depending on the local context. For Guadeloupe, it
                                                                         chronic flooding in the Petit Cul-de-sac marin would increase
would be interesting to build upon the experience of Mayotte,
                                                                         only slightly faster than the one predicted here.
another French island region with similar institutional con-
                                                                            In some areas, tide gauge data can contain a contribution
texts. In Mayotte, chronic flooding events emerged in 2019
                                                                         of the wave setup affecting all the surrounding area (regional
after a subsidence of about 0.2 m caused by the eruption of
                                                                         wave setup) or some specific ports (Thompson and Hamon,
a submarine volcano off the islands (Lemoine et al., 2018;
                                                                         1980; Bertin et al., 2015; Pedreros et al., 2018; Melet et al.,
Cesca et al., 2020). The rise in sea levels observed within
                                                                         2018). In the Petit Cul-de-sac marin, the wave setup contribu-
2 years in Mayotte is typically what is projected to take place
                                                                         tion is excepted to be negligible both at tide gauge locations

Nat. Hazards Earth Syst. Sci., 21, 703–722, 2021                                            https://doi.org/10.5194/nhess-21-703-2021
You can also read