Fine dust emissions from active sands at coastal Oceano Dunes, California - Atmos. Chem. Phys
←
→
Page content transcription
If your browser does not render page correctly, please read the page content below
Atmos. Chem. Phys., 19, 2947–2964, 2019
https://doi.org/10.5194/acp-19-2947-2019
© Author(s) 2019. This work is distributed under
the Creative Commons Attribution 4.0 License.

Fine dust emissions from active sands at coastal
Oceano Dunes, California
Yue Huang1 , Jasper F. Kok1 , Raleigh L. Martin1 , Nitzan Swet2 , Itzhak Katra2 , Thomas E. Gill3 ,
Richard L. Reynolds4 , and Livia S. Freire5
1 Department of Atmospheric and Oceanic Sciences, University of California, Los Angeles, Los Angeles, CA 90095, USA
2 Department of Geography and Environmental Development, Ben Gurion University of the Negev, Be’er-Sheva 84105, Israel
3 Department of Geological Sciences, University of Texas at El Paso, El Paso, TX 79968, USA
4 Department of Earth Sciences, University of Minnesota, Minneapolis, MN 55455, USA
5 Graduate Program in Environmental Engineering, Federal University of Paraná, Curitiba, PR 80060, Brazil

Correspondence: Yue Huang (hyue4@ucla.com)

Received: 7 July 2018 – Discussion started: 23 July 2018
Revised: 17 January 2019 – Accepted: 20 February 2019 – Published: 7 March 2019

Abstract. Sand dunes and other active sands generally have        hydrological cycle (Ramanathan et al., 2001; Miller et al.,
a low content of fine grains and, therefore, are not considered   2004), and producing risks to human health (Burnett et al.,
to be major dust sources in current climate models. However,      2014). Despite these critical impacts, simulations of dust
recent remote sensing studies have indicated that a surpris-      emissions in current climate models have large uncertain-
ingly large fraction of dust storms are generated from regions    ties, particularly in predicted rates and spatial patterns of dust
covered by sand dunes, leading these studies to propose that      emissions (Engelstaedter et al., 2006; Huneeus et al., 2011;
sand dunes might be globally relevant sources of dust. To         Kok et al., 2014b; Evan et al., 2015). These uncertainties
help understand dust emissions from sand dunes and other          arise in part from a lack of understanding (i) of the physics
active sands, we present in situ field measurements of dust       of the emission process and (ii) of the dust emission produc-
emission under natural saltation from a coastal sand sheet        tivity of different soil types.
at Oceano Dunes in California. We find that saltation drives         Most parameterizations of dust emissions account only
dust emissions from this setting that are on the low end of       for emission through soil aggregate fragmentation, which
the range in emissions produced by non-sandy soils for sim-       dominates for non-sandy soils (defined as containing > 10 %
ilar wind speed. Laboratory analyses of sand samples sug-         by mass of clay- and silt-sized soil fines; McKee, 1979),
gest that these emissions are produced by aeolian abrasion        and these parameterizations do not account for dust emis-
of feldspars and removal of clay-mineral coatings on sand         sion through removal of clay-mineral coatings or aeolian
grain surfaces. We further find that this emitted dust is sub-    abrasion, which might dominate emissions from sandy soils
stantially finer than dust emitted from non-sandy soils, which    (Shao et al., 1993; Alfaro and Gomes, 2001; Ginoux et al.,
could enhance its downwind impacts on human health, the           2001; Zender et al., 2003; Kok et al., 2014a). For both soil
hydrological cycle, and climate.                                  types, dust emission is facilitated by aeolian saltation (the
                                                                  ballistic motion of sand particles) and sandblasting (saltator-
                                                                  driven release of dust) (Shao, 2008). Sandblasting can emit
                                                                  dust in four primary ways:
1   Introduction
                                                                    1. fragmentation of aggregates of clay-sized (< 2 µm in di-
Dust emission by wind-blown (aeolian) processes produces               ameter) and silt-sized (2–63 µm in diameter) fine parti-
important effects on the Earth system, including modulating            cles in the soil (Kok, 2011);
the radiation budget (Miller et al., 2006; Kok et al., 2017),
modifying cloud microphysics (DeMott et al., 2015) and the

Published by Copernicus Publications on behalf of the European Geosciences Union.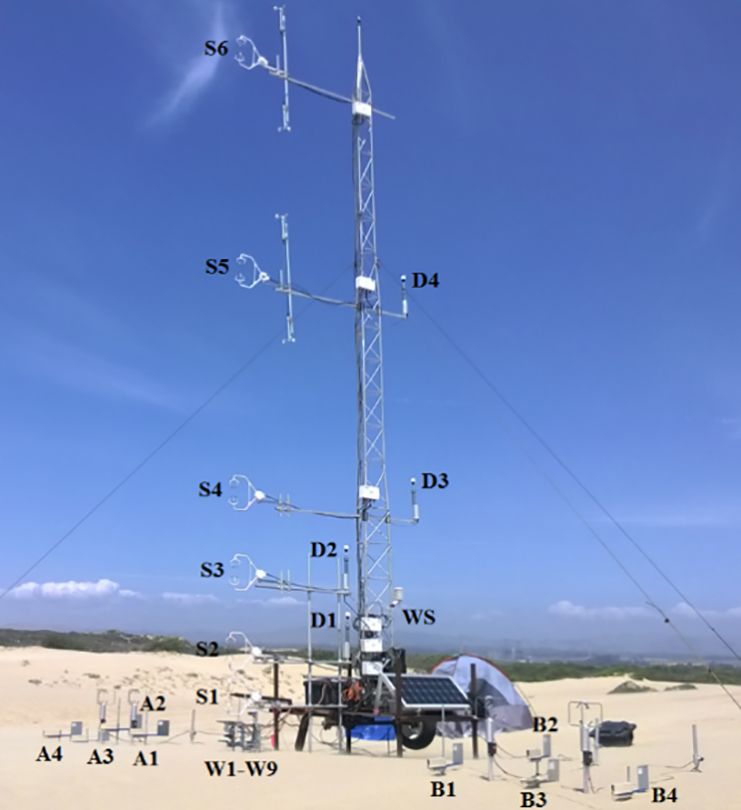
2948                           Y. Huang et al.: Fine dust emissions from active sands at coastal Oceano Dunes, California

 2. release of single fine particles trapped between the sand      ductivity of active sands are. Unfortunately, there are few
    particles (also referred to as “resident fines”) (Bullard et   measurements of dust emissions from active sands, espe-
    al., 2004);                                                    cially under natural field conditions (Bullard et al., 2004;
                                                                   Sweeney et al., 2016; Swet et al., 2019). To improve our un-
 3. rupturing of clay and oxide coatings attached to the sur-      derstanding of dust emission from active sands, we present
    faces of sand grains (Bullard et al., 2004, 2007); and         the first (to our knowledge) in situ field measurements of dust
 4. chipping or spalling of sand grains, for instance of sharp     emission under natural aeolian saltation from active sands
    corners, which is also known as aeolian abrasion (Kue-         at the coastal Oceano Dunes in California. Section 2 details
    nen, 1960; Whalley et al., 1987; Jerolmack and Brzin-          the field campaign setup, in situ data processing methods,
    ski, 2010; Sweeney et al., 2016).                              and laboratory techniques used to analyze sand samples. Sec-
                                                                   tion 3 presents results of the vertical dust mass flux, the par-
The relative importance of the four physical processes de-         ticle size distribution of emitted dust, the size-resolved sand-
pends largely on soil texture and composition: soil aggregate      blasting efficiencies, and the properties of sand samples. Sec-
breakage is likely most important for soils with a large frac-     tion 4 discusses dust emission processes at the study site and
tion of fine (clay- and silt-sized) grains (Shao, 2008; Kok et     their representativeness for dust emissions from other active
al., 2012; Swet and Katra, 2016), whereas removal of min-          sands, as well as the implications of our results for downwind
eral coatings and aeolian abrasion might be more important         human health, the hydrological cycle, and climate. Conclu-
for sandy soils (Kuenen, 1960; Bullard et al., 2004, 2007;         sions follow in Sect. 5.
Jerolmack et al., 2011; Crouvi et al., 2012). Many dust mod-
els use preferential source functions to identify emissions in
regions with a large content of fine grains held in soil aggre-    2   Methods
gates, which are implicitly used as a proxy for dust emissions
through aggregate fragmentation (Ginoux et al., 2001; Tegen        We conducted a field campaign from 15 May to 7 June 2015
et al., 2002; Zender et al., 2003). As a consequence, dust         on the southern edge of the Oceano Dunes State Vehicular
models weigh emissions heavily towards non-sandy soils,            Recreation Area (35.03◦ N, 120.63◦ W) where off-highway
and sandy soils are not treated as important dust sources in       motor vehicles were prohibited (Oceano Dunes State Vehic-
most current models (Shao et al., 1993; Ginoux et al., 2001;       ular Recreation Area, SVRA, map: http://ohv.parks.ca.gov/
Tegen et al., 2002; Zender et al., 2003; Ito and Kok, 2017).       ?page_id=1208, last access: 27 February 2019). At the time
   Although current models do not treat active sands (i.e.,        of measurements, the site was not downwind of any ve-
sands with active saltation transport; Swet et al., 2019) as       hicle activity and was completely nonvegetated and topo-
major dust sources, recent remote sensing observations found       graphically mostly flat. This active coastal sand sheet is fol-
a higher correlation between dust emission events and wind         lowed inland by low transverse dunes. These dunes are part
strength over dune-covered surfaces than over many other ge-       of the broader late Quaternary Guadalupe-Nipomo Dunes
omorphic units of the Sahara Desert, the Chihuahuan Desert,        Complex, which extends north–south along roughly 25 km of
the Lake Eyre basin, and the Taklamakan Desert (Baddock et         California’s Central Coast and is shaped by strong onshore
al., 2011; Bullard et al., 2011; Crouvi et al., 2012). Specifi-    (westerly) sea breezes transporting sand primarily derived
cally, Crouvi et al. (2012) found that more than 40 % of Sa-       from fluvial deposits of the Santa Maria River estuary at the
haran dust storms originated from sand dunes and that sand         south end of the dune field (Cooper, 1967; Orme, 1992; Pye
dunes had a higher land erodibility (regression of number          and Tsoar, 2009). Currently, active aeolian transport occurs
of dust storms against surface wind) than other soil types.        only within 1–2 km of the beach, but inactive, vegetation-
Based on these observations, Crouvi et al. (2012) proposed         stabilized transverse dune surfaces extend up to 18 km in-
aeolian abrasion on active sand dunes as an important dust         land.
emission mechanism. Although remote sensing observations              We erected a 10 m tower (Fig. 1) at a distance of ∼ 650 m
are informative for regional dust emission patterns (Prospero      from the shoreline to measure wind speed and direction, sand
et al., 2002; Crouvi et al., 2012), uncertainties in backtrack-    flux, and dust concentration from 15 May to 4 June 2015. We
ing satellite images to locate exact dust sources, combined        mounted six Campbell Scientific CSAT3 sonic anemometers
with the lack of information on dust concentration or com-         (Liu et al., 2001) on the tower, of which we used the three-
position, small-scale land–surface dynamics, and magnitude         dimensional winds measured by the lowest sonic anemome-
of wind stress (Bullard et al., 2011), impede the resolution of    ter (about 0.5 m above the surface) to determine shear stress
the productivity of active sands.                                  and shear velocity (details in Martin and Kok, 2017). In ad-
   Considering these limitations of satellite observations,        dition, we obtained the vertical profile of horizontal sand
field measurements of dust emission from active sands are          saltation flux q (z) from nine Wenglor YH03PCT8 electric
needed to inform whether active sands are indeed impor-            laser gate sensors (Barchyn et al., 2014), mounted at heights
tant contributors to the global dust cycle and, if so, what the    z spanning from 0.02 to 0.47 m above the surface. We con-
physics of the emission process and the dust emission pro-         verted the measured particle count to sand flux by calibrat-

Atmos. Chem. Phys., 19, 2947–2964, 2019                                             www.atmos-chem-phys.net/19/2947/2019/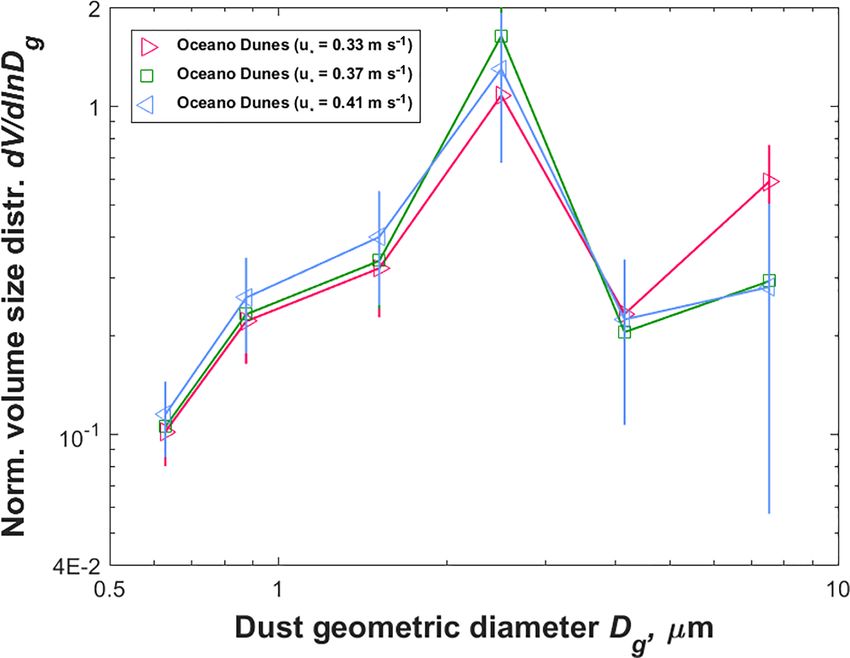
Y. Huang et al.: Fine dust emissions from active sands at coastal Oceano Dunes, California                                       2949

Table 1. The dust geometric and aerodynamic diameters of the
seven bin boundaries. Determination of the geometric diame-
ter ranges uses Lorenz–Mie theory such that they produce the
same range of scattered light intensity as the seven manufacturer-
provided polystyrene latex sphere (PSL) diameter sizes. The ranges
in geometric diameters derive from the uncertainty in the dust re-
fractive indices. We determined the aerodynamic diameter ranges
by applying Eq. (6) to the geometric diameter ranges.

  Polystyrene latex sphere   Dust geometric   Dust aerodynamic
  (PSL) diameter (µm)         diameter (µm)      diameter (µm)
  0.49                           0.51–0.54           0.68–0.72
  0.7                            0.73–0.77           0.97–1.03
  1                              1.01–1.03           1.35–1.37
  2                              2.18–2.32           2.91–3.09
  2.5                            2.67–2.90           3.56–3.87
  5                              6.11–6.31           8.15–8.41
  7                              8.89–9.40         11.85–12.53

ing to eight concurrently sampling Big Spring Number Eight
(BSNE) samplers (Fryrear, 1986; Goossens et al., 2000).
We then obtained the total sand flux by integrating the flux
through the depth of the saltation layer (see Martin and Kok,        Figure 1. The experimental setup at Oceano Dunes. Instrumenta-
2017; Martin et al., 2018). Furthermore, we obtained the             tion includes six sonic anemometers (S1–S6), nine Wenglor parti-
dust concentration profile using six identical optical parti-        cle counters (W1–W9), eight Big Spring Number Eight sand sam-
cle counters (OPCs) (the 212 ambient particulate profiler,           plers (A1–A4, B1–B4), four optical particle counters (D1–D4), and
manufactured by Met One Instruments, Inc.), of which we              a weather station with temperature and humidity sensors (WS) (fol-
                                                                     lowing Martin and Kok, 2017).
mounted four on the tower at four different heights at any
given time within 0.74–6.44 m above the surface (location
details in Table S1 in the Supplement). Each OPC measured
size-resolved aerosol concentrations using seven size bins           approximating dust as spherical particles. Specifically, we
with equivalent light scattering diameter ranges within 0.49–        calculated the light scattered by PSLs (refractive index: m =
10 µm, calibrated using polystyrene latex spheres (PSLs) (Ta-        1.59 − 0i) at the instrument’s laser wavelength (589 nm) and
ble 1, column 1). Of the seven size bins, we only used the           scattering angle range (90±60◦ ; information provided by the
smallest six bins. Past studies have found that the sampling         Met One engineering department), using the manufacturer-
efficiency (i.e., the ratio of particle concentration measured       provided size boundaries of each of the six OPC bins. For
by the sensor to the particle concentration in the ambient air;      each bin, we then determined the size range of dust parti-
Von der Weiden et al., 2009) can decrease strongly with wind         cles that would produce an equal range of scattered light, us-
speed for coarse particles; for instance, the loss rate can ap-      ing globally representative dust refractive indices (real part
proach 100 % for particles larger than 10 µm in diameter un-         n = 1.53±0.03 and imaginary part k = −10−2.5±0.3 , follow-
der strong wind events (Von der Weiden et al., 2009). As the         ing Kok et al., 2017). This operation yielded the corrected
dependence of sampling efficiency on wind speed and parti-           bin size boundaries for dust and their uncertainties (Table 1,
cle size was not provided by the instrument’s manufacturer,          column 2 and Fig. S4 in the Supplement).
we did not use the largest size bin (bin 7) and only used the           Using the instrumentation and procedure mentioned
smallest six bins (with PSL diameter ranging from 0.49 to            above, we obtained shear stress, total sand flux, and size-
7 µm; see Table 1).                                                  resolved dust concentration, which we averaged over 30 min
   The optical sizing of aerosols is sensitive to differences in     periods. We chose a 30 min averaging time interval be-
the refractive index between the measured aerosols and the           cause this interval is shorter than the typical timescale of
particles used to calibrate the instrument (Hinds, 1999). The        a mesoscale weather system but sufficient to capture most
manufacturer calibrated the OPCs against PSLs, following             of the turbulent energy spectrum (Stull, 1988; Sterk et al.,
the international standard ISO 21501-1:2009 (ISO, 2009).             1998). Furthermore, we intercalibrated the six OPCs to re-
We corrected the manufacturer-provided bin size limits to            duce systematic errors in the measured dust concentration
dust size limits using Lorenz–Mie theory (Bohren and Huff-           and to quantify the instrument uncertainty. To obtain mea-
man, 1983; Mätzler, 2002; Rosenberg et al., 2012), thereby           surements for this intercalibration, we mounted five OPCs

www.atmos-chem-phys.net/19/2947/2019/                                                 Atmos. Chem. Phys., 19, 2947–2964, 2019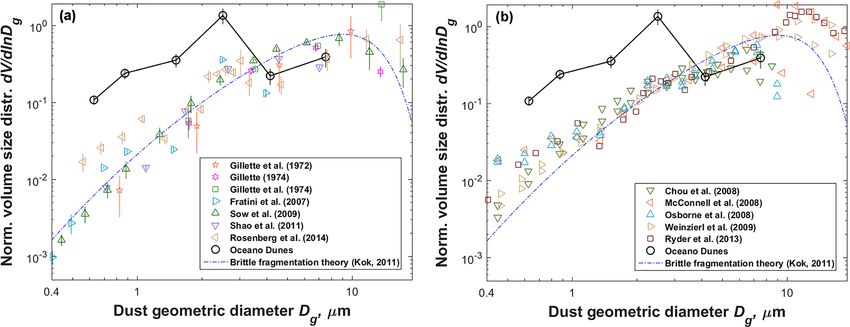
2950                            Y. Huang et al.: Fine dust emissions from active sands at coastal Oceano Dunes, California

(the sixth one malfunctioned after 25 May 2015) at the same             We used the size-resolved vertical dust flux obtained above
height and in a line perpendicular to the wind for 3 days (5, 6,     to calculate the particle size distribution (PSD) of emitted
and 7 June 2015) immediately following the field campaign            dust and the sandblasting efficiency, which together give in-
(Fig. S2 in the Supplement). Specifically, for each of the six       sights into the physical processes governing dust emission
size bins, we applied linear-least-squares regression on the         from active sands (Kok et al., 2014b; Mahowald et al., 2014).
aerosol concentration of each of the five OPCs against the           We computed the normalized volume PSD of dust at emis-
mean of the five OPCs (Fig. S3a in the Supplement). This             sion as
procedure yielded a concentration-dependent correction fac-            dVi             Fd,i
tor with uncertainty for each size bin of each OPC (Table S2                 =                     ,                            (4)
                                                                     d ln Di   Fd · ln (Di+1 /Di )
in the Supplement), which we propagated throughout our
analysis (Fig. S3b in the Supplement). For all of our subse-         where Di (µm) and Di+1 (µm) are the lower and upper
quent analysis, we did not use dust concentrations measured          boundary geometric diameter sizes, respectively, of the ith
by the malfunctioning OPC, because they did not satisfy our          size class (Table 1, column 2). The integral of d dV    i
                                                                                                                          ln Di over
data-quality control criteria (more details can be found in the      particle size thus yields unity. For each size bin we then ob-
Supplement).                                                         tained the sandblasting efficiency, which is the vertical dust
   We used the calibrated dust concentration to obtain the           flux produced by a unit horizontal sand saltation flux (Marti-
size-resolved mass flux of emitted dust using the gradient           corena and Bergametti, 1995),
method, which is analogous to the methods for determin-
ing vertical scalar fluxes from turbulent and molecular dif-                Fd,i
                                                                     αi =        ,                                              (5)
fusion in the atmospheric surface layer (Gillette et al., 1972;              Q
Shao, 2008). The gradient method assumes constant dust flux
within the surface layer, neutral atmospheric stability (see         where Q (kg m−1 s−1 ) is the total horizontal sand flux inte-
supplementary Fig. 2 of Martin and Kok, 2017), and negligi-          grated over all sand grain sizes (see Martin and Kok, 2017).
ble dust deposition from upwind sources, and it is expressed         We then obtained the bulk sandblastingP    efficiency α (m−1 )
as                                                                   by summing over the six αi (m ), α = 6i=1 αi .
                                                                                                      −1

                                                                        We used the size-resolved vertical mass flux calculated
           ∂ci                                                       above to obtain the vertical flux for particulate matter with
Fd,i = −Kd     ,                                              (1)
           ∂z                                                        geometric diameter Dg ≤ 10 µm (PM10,g ) and with aerody-
Kd = ηκu∗ z,                                                  (2)    namic diameter Da ≤ 2.5 µm (PM2.5,a ). Dust in atmospheric
                                                                     circulation models is usually represented in terms of geomet-
where Fd,i is the vertical mass flux (kg m−2 s−1 ) of the ith        ric diameter (Mahowald et al., 2014), and the PM10,g size
size class of the six bins; ci denotes the mass concentration        range is considered most relevant to dust impacts on weather
(kg m−3 ) of the ith size class at height z (m); Kd is the tur-      and climate (Kok et al., 2017). In contrast, aerodynamic di-
bulent diffusivity (m−2 s−1 ) obtained by the mixing length          ameter is more relevant to aerosol impacts on human health,
theory (Stull, 1988); η is the ratio between the turbulent dif-      which corresponds with the PM2.5,a concentration (Burnett
fusivity of a passive tracer and that of momentum, which we          et al., 2014). To obtain the PM10,g flux, we summed the mass
take as unity based on previous studies (Gillette et al., 1972;      flux of the smallest six size bins and part of the seventh size
Stull, 1988); κ is the von Kármán constant, which we take            bin that is within the PM10,g size range (see Table 1, col-
as 0.387 (Andreas et al., 2006); and u∗ is the shear velocity        umn 2), for which we integrated over the sub-bin size dis-
(m s−1 ). Combining Eqs. (1) and (2), and integrating from a         tribution obtained by linear-least-squares regression on the
reference height zr (m), we obtain                                   PSD of the emitted dust of the sixth and seventh size bin. To
                                                                   obtain the PM2.5,a flux, we first converted the geometric di-
                    Fd,i      z                                      ameter bin sizes to aerodynamic diameter bin sizes through
ci (z) = ci (zr ) −       ln     ,                          (3)
                    κu∗ η     zr                                     (Hinds, 1999)
where ci (zr ) is the reference concentration of the ith size                r
                                                                               χ ρ0
class at zr . For calculation purposes, we set zr as the height of   Dg =           Da ,                                         (6)
                                                                                ρP
the “D1” OPC (Fig. 1 and Table S1, column 2, in the Supple-
ment). Applying Eq. (3) to each of the six bin classes yields        where Da and Dg are the aerodynamic and geometric diam-
the size-resolved vertical dust mass flux Fd,i for each bin.         eter, respectively; ρ0 = 1000 kg m−3 is the density of water;
We then obtained the bulk vertical mass flux as the sum of           ρP ≈ (2.5 ± 0.2) × 103 kg m−3 is the typical density of dust
                                  6
                                 P                                   aerosols (Kok et al., 2017); and χ is the dynamic shape fac-
the size-resolved fluxes Fd =       Fd,i . Note that for each bin
                                i=1                                  tor, which is defined as the ratio of the drag force experi-
we only used measurements that showed a negative gradient            enced by the irregular particle to the drag force experienced
(concentration decreases with height) and thus a positive dust       by a spherical particle with diameter Dg (Hinds, 1999). We
flux, as discussed further below.                                    used χ ≈ 1.4 ± 0.1 (Kok et al., 2014a), which yielded Dg ≈

Atmos. Chem. Phys., 19, 2947–2964, 2019                                               www.atmos-chem-phys.net/19/2947/2019/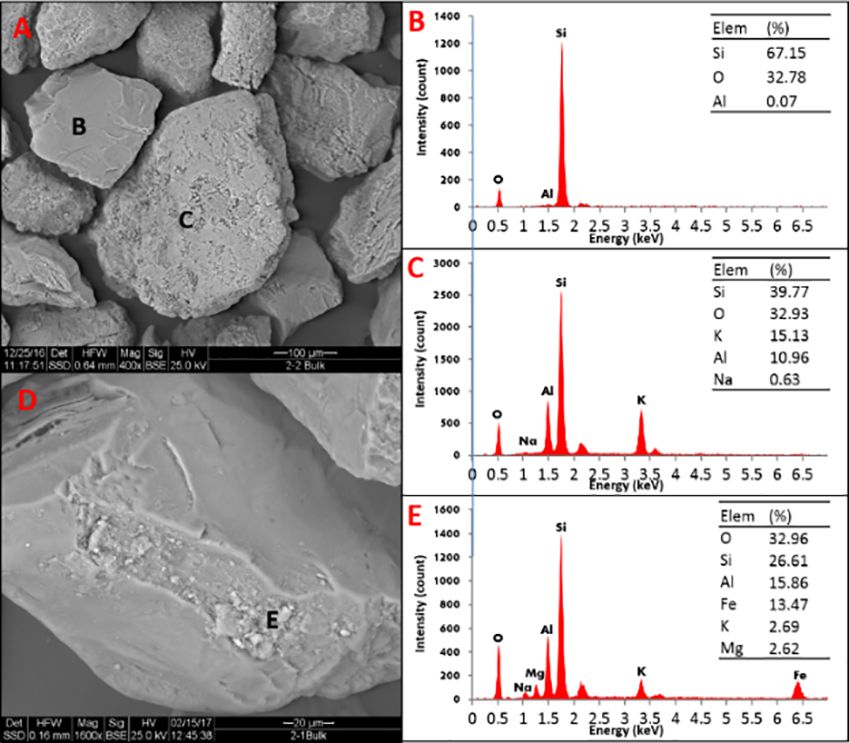
Y. Huang et al.: Fine dust emissions from active sands at coastal Oceano Dunes, California                               2951

(0.75 ± 0.04) Da (values of geometric and aerodynamic bin        14 October 2016 from the upper 2 cm of the surface, with
diameters are listed in Table 1). Second, we summed the          two samples at the tower location and two at 100 m up-
mass flux of the smallest two size bins and part of the third    wind. We analyzed the properties of each sand sample us-
size bin that is within the PM2.5,a size range (see Table 1,     ing a series of physical and chemical techniques. First, we
column 3), for which we integrated over the sub-bin size dis-    analyzed the particle size distribution (PSD) using the laser
tribution obtained by linear-least-squares regression on the     diffraction technique with the ANALYSETTE 22 MicroTec
PSD of the emitted dust of the second and third size bin.        Plus, Fritsch (Katra and Yizhaq, 2017), which measured par-
   We found that aerosol concentration, vertical mass flux,      ticles within 0.08–2000 µm in optical diameter. We calcu-
and the PSD calculated with the procedure above were af-         lated the PSD of soil samples with a Fraunhofer diffraction
fected by both dust emission and sea-salt aerosol deposition.    model with a size resolution of 1 µm using MasControl soft-
Specifically, we found deviations in the measured aerosol        ware (Katra and Yizhaq, 2017). Note that we did not convert
concentration profiles (Fig. S5 in the Supplement) from the      this soil PSD in terms of optical diameter into geometric or
logarithmic profile expected to occur from an active dust        aerodynamic diameter due to a lack of information on parti-
emission source (Stull, 1988; Kind, 1992; Gillies and Berkof-    cle shape, refractive index, scattering angle range, and laser
sky, 2004), a result that we inferred as the influence of        wavelength. Second, we analyzed the mineralogical compo-
sea-salt aerosol. Because we measured dust concentrations        sition of the sand grains using the X-ray powder diffrac-
∼ 650 m from the shoreline, we expect increasing sea-salt        tion (XRPD) method (Klute, 1986). The XRPD method al-
aerosol concentration with height due to the upwind depo-        lows the crystal structure data to retrieve the minerals of
sition of near-surface sea-salt aerosol (Dueker et al., 2011;    a bulk sample. Each analyzed sample of 1 g contains hun-
Liang et al., 2016). We generally observed an increasing         dreds of grains at the sand size of the Oceano site. Specifi-
concentration with height for the lowest two or three OPCs       cally, we used the Panalytical Empyrean powder diffractome-
when saltation was inactive (horizontal saltation flux Q = 0),   ter equipped with the position-sensitive detector X’Celerator
consistent with sea-salt aerosol deposition, but found a de-     (Philips 1050/70). Data were collected in the θ/2θ geometry
crease in concentration with height when saltation was ac-       using Cu Kα radiation (λ = 1.54178 Å) at 40 kV and 30 mA.
tive (Q > 0), consistent with dust emission (Fig. S5 in the      Scans were run over ∼ 15 min intervals in a 2θ range of 4–
Supplement). Furthermore, the measured PSD was coarser           60◦ with a step equal to ∼ 0.033◦ (Sommariva et al., 2014).
when saltation was inactive than when it was active (Fig. S6     The reference intensity ratio (RIR) method was used to deter-
in the Supplement). This observation is consistent with sea-     mine the concentrations of the crystalline components. The
salt aerosol being coarser than dust aerosol (O’Dowd and de      integral intensities of main peaks were taken for computation
Leeuw, 2007) and dominating when dust emission is not oc-        (Gualtieri, 1996, 2000). Third, we performed a qualitative ex-
curring. We thus mitigated the problem of the influence of       amination of the grain surfaces using scanning electron mi-
sea-salt aerosol on our results by using only the lowest two     croscopy (SEM) (Quanta 200, FEI) and the energy dispersive
sensors (D1 and D2 in Fig. 1), which were most affected          X-ray spectroscopy (EDS) chemical analysis technique inte-
by dust emission and least affected by the upwind sea-salt       grated within SEM. The SEM-EDS stimulates each sample
aerosol emission. Indeed, using only the lowest two sensors      using electrons and detects the spectrum of outgoing pho-
caused the aerosol flux to be small and negative (deposition)    tons to retrieve the elemental analysis of the grain surfaces,
when saltation was inactive and large and positive (emission)    which provided us with information on the mineralogy of
when saltation was active (Fig. S7 in the Supplement). Be-       grain coatings. In our case, each sample replica was com-
cause using the lowest two sensors did not eliminate the de-     posed of some dozens of particles, including sand-sized and
position flux of sea-salt aerosol from our results, we in ad-    dust-sized particles. It additionally provided images at ex-
dition subtracted mass flux measured by D1 and D2 when           tremely high magnification (6× to 1 000 000×) that enable a
saltation was inactive from the flux by D1 and D2 when           close analysis of the smallest dust particles (< 2 µm).
saltation was active. We found the sea-salt deposition flux
at Oceano was of the order of 0.1 µg m−2 s−1 (Fig. S8 in
the Supplement), which was roughly an order of magnitude         3   Results
smaller than measurements 50 m away from the shoreline in
coastal Maine, USA (Dueker et al., 2011). Due to a lack of       We find that dust emitted from the sand sheet at Oceano dif-
precise sea-salt deposition data in our measurements, we as-     fers from dust emitted from non-sandy soils in two key ways.
sumed the sea-salt aerosol deposition flux to be invariant to    First, the vertical PM10,g and PM2.5,a dust fluxes at Oceano
shear velocity (Fig. S8a in the Supplement). However, ac-        are both smaller than those fluxes from most non-sandy soils
counting for the possible dependence of sea-salt deposition      at the same shear velocity (Fig. 2). The vertical PM10,g and
flux on shear velocity does not qualitatively affect the PSD     PM2.5,a fluxes at Oceano range from 1 to 100 µg m−2 s−1
of dust at emission (Fig. S9 in the Supplement).                 and 0.1 to 30 µg m−2 s−1 , respectively. They both increase
   In order to characterize the sand grains at the experimen-    nonlinearly with increasing shear velocity in the measured
tal site, we collected four sand samples (each ∼ 220 g) on       range of 0.29–0.43 m s−1 . For similar shear velocities, the

www.atmos-chem-phys.net/19/2947/2019/                                            Atmos. Chem. Phys., 19, 2947–2964, 2019
2952 Y. Huang et al.: Fine dust emissions from active sands at coastal Oceano Dunes, California
PM10,g and PM2.5,a dust fluxes from most non-sandy soils large number of SEM-EDS observations made for these sam-
exceed those at Oceano, differing by a factor of ∼ 1–100 ples.
and ∼ 0.1–10, respectively. The second key difference is that
dust emitted from the Oceano site is substantially finer than
size-resolved dust emitted from non-sandy soils under natu- 4 Discussion
ral saltation (Fig. 3a), and it is also significantly finer than
We reported in situ field measurements of natural dust emis-
dust measured in situ over North Africa (Fig. 3b), which
sion from an undisturbed coastal sand sheet at Oceano Dunes
likely accounts for a majority of the world’s dust emissions
in California (Fig. 1 and Fig. S1 in the Supplement). We
(Prospero et al., 2002; Engelstaedter et al., 2006).
found that dust emission from these active sands differs in
Our measurement of the bulk sandblasting efficiency pro-
several key ways from dust emission from non-sandy soils,
vides further insight into the differences between dust emis-
namely in the magnitude of vertical PM10,g and PM2.5,a dust
sions from the Oceano sand sheet and from non-sandy
fluxes (Fig. 2), the particle size distribution (PSD) of dust at
soils. First, the bulk sandblasting efficiency at Oceano is
emission (Fig. 3), and the magnitude and the shear velocity
around 10−6 m−1 (Fig. 5), which is substantially smaller than
dependence of the sandblasting efficiency (Fig. 5). Further-
the range within 10−5 to 10−2 m−1 typical for non-sandy
more, we found that sand grains at the study site are coarse
soils (Kok et al., 2012). Second, the bulk sandblasting effi-
with a mode larger than 460 µm (Fig. 7), that many sand
ciency increases nonlinearly as a power law in shear velocity
grains contain clay-mineral coatings, and that about half of
(Fig. 5), a result consistent with some previous studies (Shao
the sand grains are feldspars (K-rich feldspar and plagio-
et al., 1993; Marticorena and Bergametti, 1995; Kok et al.,
clase) (Table 2). These results provide insights into several
2012).
fundamental questions.
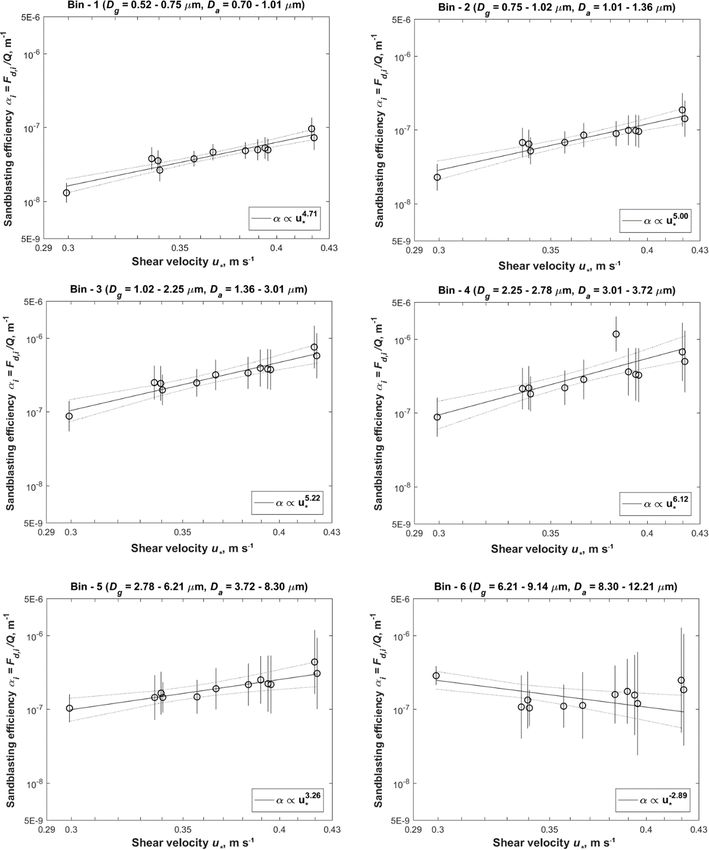
We find that the dependence of the sandblasting efficiency
on shear velocity changes with dust size (Fig. 6), which ex- 1. What physical processes drive dust emission from ac-
plains the shift in the PSD of emitted dust to finer size with tive Oceano sands?
increasing shear velocity (Fig. 4). Specifically, the power law
exponents of the dependence of the sandblasting efficiency 2. How representative are dust emissions from the sand
on shear velocity are large and positive for the smallest five sheet at Oceano of active sands elsewhere?
bins, whereas the exponent substantially drops to a negative
value for bin 6 (Fig. 6). This explains the fining of the PSD of 3. What are the implications of dust emission from Oceano
emitted dust with increasing shear velocity, which is almost for downwind human health, park management, the hy-
entirely due to a decreased contribution of bin 6 (Fig. 4). We drological cycle, and climate?
consider it likely that this decreased contribution from bin 6 After addressing these questions, we end the discussion sec-
(with Dg ranging from 6.21 to 9.14 µm; see Table 1) with in- tion with several limitations of our methodology.
creasing shear velocity is caused by a decrease in sampling
efficiency of coarse particles with wind speed (Von der Wei- 4.1 Insights into processes producing dust from active
den et al., 2009). Therefore, it is possible that the PSD of sands at the Oceano Dunes State Vehicular
emitted dust remains approximately invariant with shear ve- Recreation Area
locity.
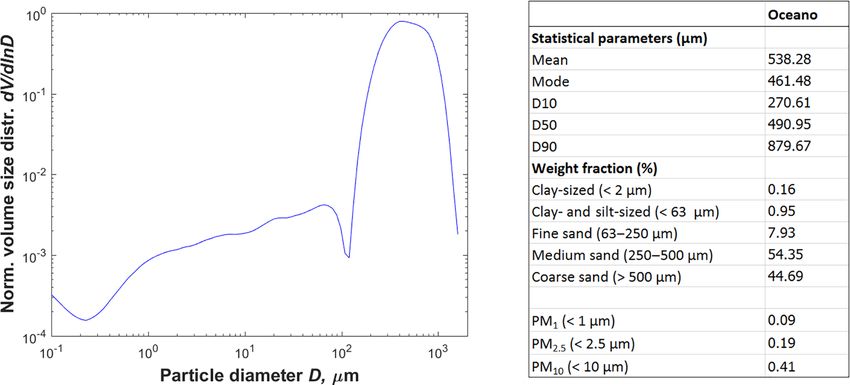
Our analyses of sand grains sampled from the field site Our results indicate that aeolian abrasion of feldspars is one
show that the Oceano sand is characterized by a unimodal possible dust emission process at Oceano. XRPD analysis
size distribution (mode at 461 µm and median at 491 µm) confirms the existence of feldspars (∼ 46 % by mass) (Ta-
with 0.95 % (by mass) of loose clay- and silt-sized fine par- ble 2). Although the content of feldspars is of the same mag-
ticles (∼ 63 µm) between the sand grains and 0.41 % of par- nitude as that of quartz (∼ 51 % by mass) (Table 2), the sur-
ticulate matter smaller than 10 µm (Fig. 7). The sand con- faces of the feldspars commonly appear more abraded than
sists of a mixture of quartz (51 % by mass), feldspars (K- the surfaces of the quartz sand grains (Fig. 8a), suggesting
rich feldspar 23 % and plagioclase 23 %), and clay minerals a higher potential to generate dust through aeolian abrasion
(3 %) analyzed by the XRPD technique (Table 2). We further of feldspars than of quartz grains. We list four supporting
find the presence of mineral coatings on the top of quartz findings from other experimental studies. First, both labora-
sand grains through the SEM-EDS technique (Fig. 8d and tory (Dutta et al., 1993; Jari, 1995) and wind tunnel (Kue-
e). Note that the mass content of clay minerals detected in nen, 1960, 1969) experiments have found that feldspars are
the XRPD analysis can be in the form of loose fine dust in more fragile than quartz grains to aeolian abrasion, possibly
the pore spaces between the sand grains and/or clay-mineral owing to the cleavage structures of feldspars (Kuenen, 1969)
coatings attached to the sand grains. In addition, we find that and the greater propensity of feldspars to weather than quartz
the surface of the feldspars appears more abraded than the (Nesbitt et al., 1997). Second, the feldspar content of dust is
solid surface of the quartz sand grains (compare location “B” higher than that of the parent top soils in dust-producing re-
and location “C” in Fig. 8a), which are representative of a gions, including northern Ghana (Tiessen et al., 1991), China
Atmos. Chem. Phys., 19, 2947–2964, 2019 www.atmos-chem-phys.net/19/2947/2019/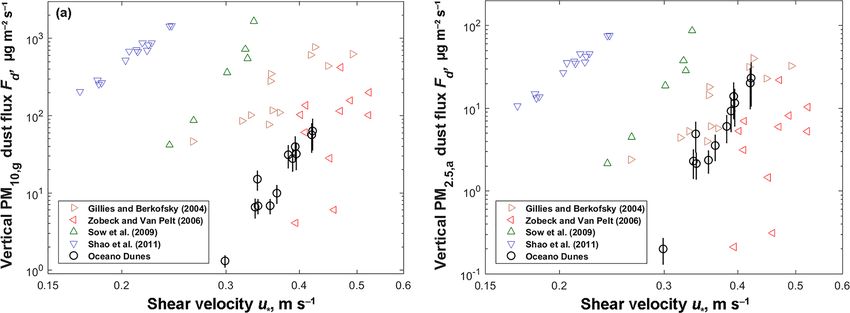
Y. Huang et al.: Fine dust emissions from active sands at coastal Oceano Dunes, California                                            2953

Figure 2. The vertical dust mass flux as a function of shear velocity within (a) the PM10,g geometric diameter range and (b) the PM2.5,a
aerodynamic diameter range. Each of the two plots includes measurements at Oceano (black open circles) and previously published field
studies of natural dust emissions from non-sandy soils (open triangles). These latter measurements were compiled in Kok et al. (2014a),
which corrected these measurements to the PM10,g geometric diameter range following the procedure described in that work. Furthermore,
we corrected these measurements to the PM2.5,a aerodynamic diameter range assuming that their PSDs follow the prediction of the brittle
fragmentation theory generated by aggregate fragmentation (Kok, 2011). Error bars on the Oceano measurements were obtained through
error propagation (details in Supplement).

Table 2. Averaged mineralogy of the Oceano Dunes sand samples in unit of percentage by mass, determined from X-ray powder diffraction
(XRPD) analysis. Note that the values in the table are averages of mineralogy of four 1 g samples with two collected from the tower location
and two from 100 m upwind. Each analyzed sample contains hundreds of grains.

                                                Quartz    Potassium feldspar     Sodium-rich         Clay
                                                          (microcline and        plagioclase         minerals
                                                          orthoclase)            feldspar (albite)   (illite)
                              Oceano Dunes      51        23                     23                  3

(Feng et al., 2008), and the UK (Moreno et al., 2003), imply-              Our results further suggest that the removal of clay-
ing the preferential generation of dust from feldspars. Third,          mineral coatings by saltator impact is another possible con-
laboratory experiments have found that aeolian abrasion of              tributor to dust emissions at Oceano, which is supported by
feldspars can generate a larger fraction of the PM10 and the            the following two findings. First, XRPD analysis found the
PM2.5 size ranges than that generated from abrasion of quartz           content of clay minerals to be around 3 % by mass (Table 2)
(Domingo et al., 2010). Indeed, laboratory experiments on               for Oceano sand samples, although the fraction of this con-
washed and clean quartz grains (for which grain surface min-            tributed by clay-mineral coatings is uncertain because XRPD
erals have been removed) (Whalley et al., 1987; Bullard et              analysis cannot distinguish between clay-mineral coatings
al., 2007) and on freshly crushed quartz grains (Wright et al.,         and loose clay-sized fines trapped in the pore spaces between
1998; Wright, 2001) imply that the dust produced by aeolian             sand grains (Swet et al., 2019). However, the PSD of dust
abrasion of quartz grains has a small portion (less than 1 %            emitted from the Oceano site is generally consistent with the
by mass) within the PM10 size range. Fourth, Pye and Sper-              PSD of emitted dust of laboratory experiments on sand sam-
ling (1983) found that when coastal dune sands are exposed              ples taken from Australian active sand dunes (Fig. S10 in
to salt solutions under desert diurnal temperature and humid-           the Supplement) (Bullard et al., 2004, 2007). Specifically,
ity cycles, feldspars are more susceptible to breakage into             Bullard and co-workers simulated aeolian abrasion within
fine grains than quartz. Because the Oceano measurement                 an air chamber on the Australian sand grains with the con-
site is exposed to high levels of sea-salt aerosols deposition          tent of clay-mineral coatings as ∼ 1 %–2 % by mass. They
(see Sect. 2), this finding further supports our hypothesis that        concluded that the removal of clay-mineral coatings was
aeolian abrasion of feldspars is one possible dust emission             likely the main process for PM10 dust emissions, implying
process at Oceano.                                                      that the removal of clay-mineral coatings is a key emission
                                                                        process at Oceano as well. Second, a companion paper re-

www.atmos-chem-phys.net/19/2947/2019/                                                      Atmos. Chem. Phys., 19, 2947–2964, 2019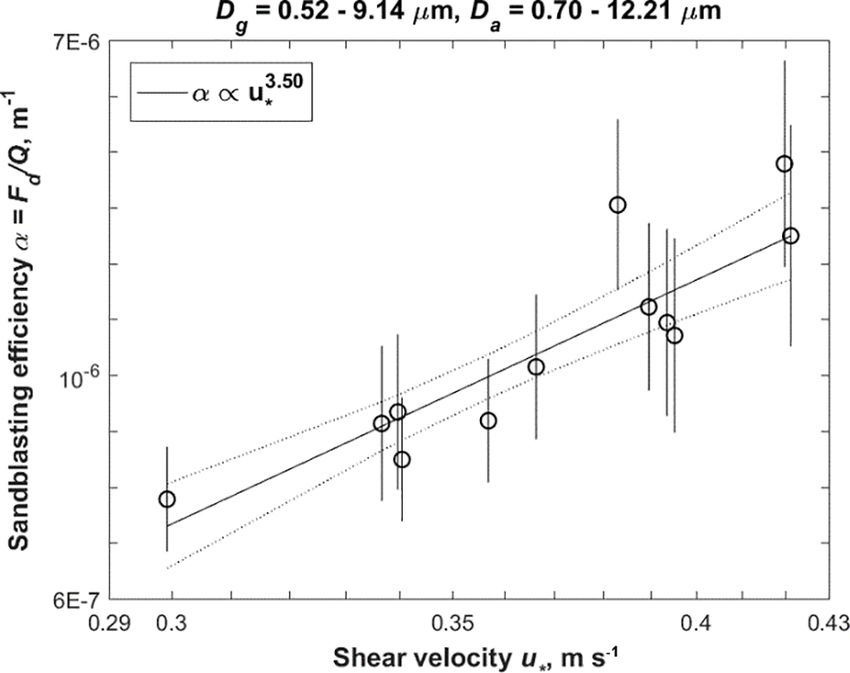
2954                              Y. Huang et al.: Fine dust emissions from active sands at coastal Oceano Dunes, California

Figure 3. Normalized volume particle size distribution (PSD) of dust at emission as a function of the dust aerosol geometric diameter
averaged over all measurements at Oceano (black open circles). Plotted for comparison are measurements compiled by Kok et al. (2017)
of (a) the emitted dust PSDs from non-sandy soils in the US (Gillette et al., 1972, 1974; Gillette, 1974), China (Fratini et al., 2007), North
Africa (Sow et al., 2009; Rosenberg et al., 2014), and Australia (Shao et al., 2011) and (b) in situ aircraft measurements of dust-dominated
PSDs close to the Saharan source regions. Note that these measurements are normalized using the procedure described in Kok (2011) and
Kok et al. (2017), which differs somewhat from the procedure used for the Oceano data (see Sect. 2). Also plotted for comparison is the
brittle fragmentation theory (dashed–dotted blue lines) on the PSD of emitted dust generated by aggregate fragmentation (Kok, 2011). Error
bars on the Oceano measurements were obtained through error propagation (details in Supplement).

                                                                         consistent with our field measurements. After Swet and co-
                                                                         workers washed the sand grains from the two Israeli dune
                                                                         fields to remove most of the loose resident fines, leaving the
                                                                         clay-mineral coatings largely unchanged, they found that the
                                                                         washed sand grains still produced PM10 dust emissions that
                                                                         were comparable to those before the sand was washed. Al-
                                                                         though Swet et al. (2019) did not perform this last experi-
                                                                         ment on Oceano sand, these results support the interpretation
                                                                         that removal of clay-mineral coatings is a key process driving
                                                                         dust emissions from active sands, including at Oceano.
                                                                            Our results imply that sandblasting of resident fines by
                                                                         saltators is a third possible dust emission process at Oceano.
                                                                         The resident fines exist as single particles trapped in between
                                                                         the sand grains, as was observed when we washed sand sam-
                                                                         ples in the lab. Although XRPD analysis cannot distinguish
                                                                         between clay-mineral coatings and clay-sized resident fines
                                                                         in the pore spaces between sand grains (Swet et al., 2019),
Figure 4. Shear velocity dependence of the normalized volume par-
                                                                         the content of these resident fines is less than 3 % by mass
ticle size distribution of dust at emission at Oceano. We divided the
measurements evenly into three shear velocity bins, with averaged
                                                                         (Table 2). Because we observed a net dust emission flux only
values of 0.33, 0.37, and 0.41 m s−1 , respectively. Error bars on the   when saltation was occurring (Figs. S5 and S7 in the Sup-
measurements were obtained through error propagation (details in         plement), it is unlikely that the direct aerodynamic entrain-
Supplement).                                                             ment of resident fines (Klose and Shao, 2012) contributed
                                                                         substantially to dust emissions at Oceano. The occurrence of
                                                                         dust emission by removal of resident fines is supported by
ports results of wind tunnel experiments on sand grains col-             the measurements of Swet et al. (2019), which reported that
lected from our Oceano field site, as well as from two active            unwashed sands produced more dust than washed ones.
desert dune fields in Israel (Swet et al., 2019). They reported             Our results provide two insights into the energetics of dust
that all three sands produced substantial dust emissions, and            emission from Oceano. First, the lower bulk sandblasting ef-
their measured sandblasting efficiency of Oceano sands was               ficiency at Oceano, compared to that of non-sandy soils, sup-

Atmos. Chem. Phys., 19, 2947–2964, 2019                                                     www.atmos-chem-phys.net/19/2947/2019/
Y. Huang et al.: Fine dust emissions from active sands at coastal Oceano Dunes, California 2955
ports the common hypothesis that sandblasting efficiency in-
creases sharply with clay-sized grain content (Marticorena
and Bergametti, 1995; Kok et al., 2014a). Second, we find
that the bulk sandblasting efficiency of Oceano sand in-
creases as a power law with shear velocity (Fig. 5). Because
such enhancement of the sandblasting efficiency occurs de-
spite invariance of mean saltator velocity with shear veloc-
ity (Martin and Kok, 2017), such changes in sandblasting
efficiency must be driven instead by changes in the proba-
bility distribution of the saltator impact energies. The recent
dust emission model of Kok et al. (2014a) predicts a power
law increase in the sandblasting efficiency with shear veloc-
ity for soils for which the typical saltator impact energy is
substantially less than the threshold impact energy needed to
overcome particle bonds. This power law increase occurs be-
cause, for such erosion-resistant soils, only particularly ener-
getic saltator impacts are capable of emitting dust, and the
fraction of saltators impacts that are particularly energetic Figure 5. The bulk sandblasting efficiency α (m−1 ) at Oceano as
increases nonlinearly with wind shear velocity (see Fig. 16 a function of shear velocity. The linear-least-squares fit (black line)
in Kok et al., 2012; Fig. 1 in Kok et al., 2014a). As such, indicates that α increases as a power law in shear velocity with an
our results both tentatively support the Kok et al. (2014a) exponent of 3.50 ± 0.89. Error bars were obtained by propagating
errors from the sensor intercalibration process, the regression used
dust emission model and suggest that dust emission from
in the gradient method, and the subtraction of the sea-salt deposition
Oceano sands are predominantly produced by saltators with
flux (see Supplement). The two dotted black lines denote the 95 %
an impact energy much greater than the mean impact en- confidence range on the fit. The geometric and the aerodynamic di-
ergy (i.e., with impact energy in the high-energy tail of the ameter ranges of the vertical dust mass flux Fd are noted at the top,
saltator-impact-energy distribution). This dependence of dust and Q is the total horizontal sand flux integrated over all sand grain
emission on the very energetic saltator impacts likely occurs sizes (Martin et al., 2018).
because both removal of clay-mineral coatings and aeolian
abrasion of feldspars are energetic processes and thus require
particularly energetic saltator impacts. tent is approximately twice the proportion of feldspar found
in coastal dunes along Monterey Bay to the north (Combel-
4.2 Insights into the representativeness of Oceano dust lick and Osborne, 1977) and more than 3 times as much
emissions for other active sands as in coastal dunes in Baja California to the south (Kasper-
Zubillaga et al., 2007). This mineralogically immature sand
It is unclear how representative our measurements on the ac- suggests rapid erosion of a feldspar-rich source rock, poten-
tive coastal sand sheet at Oceano are of dust emission from tially derived from the Santa Maria River drainage. More
other active sands, including active sand dunes, in particu- mineralogically mature terrestrial dune fields, including most
lar in relation to the sand size distribution, the content of old and continentally based (as opposed to coastal) terrestrial
feldspars, and the extensiveness of clay-mineral coatings. desert sand seas and some older coastal dunes, are quartz-
Our results indicate that sand at our study site, with a mode dominated and feldspar-depleted (McKee, 1983; Pye and
around 461 µm (Fig. 7), is coarser than the sand of most ac- Tsoar, 2009; Swet et al., 2019). The removal of feldspars by
tive sand dunes (Bullard et al., 2004; Pye and Tsoar, 2009; ballistic-impact-derived breakdown into dust during aeolian
Webb et al., 2013; Swet et al., 2019). Because the thresh- recycling over long periods of time contributes to the miner-
old shear velocity required to sustain saltation increases with alogical maturation (into quartz-dominated deposits) of aeo-
the grain particle size (Shao, 2008; Kok et al., 2012), the lian dune sands (Muhs et al., 1997; Muhs, 2004).
value of 0.28 m s−1 we found at Oceano (Martin and Kok, Furthermore, weathering of feldspars to clay miner-
2017, 2018) is likely somewhat higher than that at typical als might produce some of the clay-mineral coatings on
active sand dunes, as also confirmed in the laboratory mea- sand grains (O’Hara-Dhand et al., 2010) at the study site.
surements of Swet et al. (2019). As such, the horizontal salta- Feldspars in the Oceano sand, especially plagioclase, are
tion flux at Oceano could be somewhat lower compared with vulnerable to chemical weathering under the humid and
typical active sand dunes. salt-bearing coastal conditions (James et al., 1981; Pye and
Our results further indicate that Oceano sand differs from Tsoar, 2009) and mechanical breakdown (aeolian abrasion)
the sand of typical active sand dunes in its mineralogy, into dust from saltator impacts in wind events (Muhs et
specifically in the content of feldspars. Oceano sands contain al., 1997). Additionally, Compton (1991) described how the
as much as ∼ 46 % feldspar by mass (Table 2). This con- Santa Maria basin source sediments, both onshore and off-
www.atmos-chem-phys.net/19/2947/2019/ Atmos. Chem. Phys., 19, 2947–2964, 20192956 Y. Huang et al.: Fine dust emissions from active sands at coastal Oceano Dunes, California Figure 6. The sandblasting efficiency αi (m−1 ) of the six size bins at Oceano as a function of shear velocity. The linear-least-squares fit (black line) indicates that αi varies as a power law in shear velocity with an exponent of 4.71 ± 0.97, 5.00 ± 1.37, 5.22 ± 1.63, 6.12 ± 2.11, 3.26±1.90, and −2.89±1.94 for the six respective size bins. Error bars were obtained by propagating errors from the sensor intercalibration process, the regression used in the gradient method, and the subtraction of the sea-salt deposition flux (see Supplement). The two dotted black lines denote the 95 % confidence range of the fit. The geometric and the aerodynamic diameter ranges of the vertical dust mass flux Fd,i are noted at the top of each of the six plots, and Q is the total horizontal sand flux integrated over all sand grain sizes (Martin et al., 2018). Atmos. Chem. Phys., 19, 2947–2964, 2019 www.atmos-chem-phys.net/19/2947/2019/
Y. Huang et al.: Fine dust emissions from active sands at coastal Oceano Dunes, California                                 2957

shore, contained very fine clays derived from the alteration      tions are not directly comparable to our calculated non-riding
of volcanic glass mediated by and enhanced by weather-            area dust emission fluxes. Disentangling the relative contri-
ing of feldspars. As a result, the combination of abundant        butions of natural and OHV-influenced dust emissions will
feldspars in the Oceano sand and clay minerals from an ad-        be essential as the Oceano Dunes SVRA responds to a dust
ditional source could help explain the observed clay-mineral      emission abatement order recently approved by the local air
coatings on Oceano sand and the fine-grained characteristics      pollution control district hearing board (Vaughan, 2018).
of Oceano dust emissions.                                            Dust emitted from Oceano sands possibly contains a large
   Our results also imply that the dust emission processes        proportion of feldspars and thus might modify downwind
at Oceano are not main contributors to dust emissions from        cloud microphysics and hydrology. Oceano sand has ∼ 46 %
North Africa. In situ measurements of the PSDs of atmo-           feldspars by mass (Table 2), which is on the high end for
spheric dust over North Africa are significantly coarser than     dust-source regions (Murray et al., 2012; Atkinson et al.,
the PSD of dust emitted from our Oceano site (Fig. 3b) and        2013). Consequently, the content of feldspars in dust emit-
the PSD of dust generated in laboratory experiments on the        ted from Oceano is likely on the high end as well, especially
removal of clay-mineral coatings (Fig. S10b; Bullard et al.,      considering that aeolian abrasion of feldspars (Muhs et al.,
2004, 2007). As such, although the processes responsible for      1997) could be one of the emission processes. Feldspars, es-
dust emission from the Oceano sand sheet – removal of clay-       pecially K-rich feldspars, are considered the most important
mineral coatings and aeolian abrasion of feldspars – could        ice nuclei for mixed-phase clouds, based on both laboratory
be important for specific North African dust sources, they        (Atkinson et al., 2013) and in situ measurements (Price et
are likely not primary dust emission processes on a regional      al., 2018). Recent observations suggest that cloud glaciation
scale in North Africa.                                            mediated by dust aerosols contributes to more than half of
                                                                  the ice-phase precipitation in the Sierra Nevada mountain
4.3   Implications of dust emissions from the Oceano              range (Creamean et al., 2013), which is a major source of wa-
      Dunes State Vehicular Recreation Area for                   ter for California residents (Dettinger et al., 2004). Because
      downwind human health, park management, the                 Oceano sands are rich in feldspars, we speculate that dust
      hydrological cycle, and climate                             emitted from Oceano could potentially contribute to glaciat-
                                                                  ing downwind clouds, thereby affecting precipitation in the
Dust emitted from our Oceano site is significantly finer than     Sierra Nevada region. Future measurements to determine the
dust emitted from non-sandy soils (Fig. 3a), which can am-        broader occurrence of dust production by feldspar abrasion
plify its impacts on downwind human health, the hydrolog-         for active sands with high feldspar content are thus clearly
ical cycle, and climate. Fine dust has a longer lifetime and      needed.
therefore is usually transported over longer distances than          Our findings that dust emitted from Oceano sands is rela-
coarse dust (Mahowald et al., 2014). Furthermore, fine dust,      tively fine, and that the dust flux is on the low end of that
especially within the PM2.5,a size range, is associated with      emitted from non-sandy soils, indicate the need for sub-
cardiopulmonary diseases, lung cancer, and ischemic heart         stantial further study to understand the role of dust emis-
disease (Burnett et al., 2014). On a per mass basis, dust emit-   sions from active sands in past, current, and future climates.
ted from Oceano, and from other source regions with similar       Partially because fine dust has a longer lifetime and larger
emission processes, can thus be expected to have greater risks    surface area per unit mass than coarse dust (Mahowald et
to downwind human health than dust emitted from non-sandy         al., 2014), it produces a substantial cooling radiative effect
soils.                                                            (Kok et al., 2017). Therefore, it is important to include size-
   Our measurements of dust emission from the Oceano              resolved dust emission in climate studies. However, the pa-
Dunes State Vehicular Recreation Area (SVRA) could help           rameterization of dust emissions from active sands in climate
inform decisions on the management of this California state       models is difficult because of a scarcity of measurements
park. Our measurements were performed in the part of the          of dust emissions from active sands. Although our measure-
park where public off-highway-vehicle (OHV) use is pro-           ments help to fill this gap, it remains unclear how represen-
hibited, and we found that substantial dust emissions occur       tative our measured fine dust emissions from coastal Oceano
in the absence of OHV use (Fig. S1 in the Supplement).            sands are for typical active sands. Therefore, there is a clear
Because OHV use can enhance dust emissions (Goossens              need for future investigations of dust emissions from active
and Buck, 2011; Goossens et al., 2012), reconfiguring mo-         sands for a range of geomorphological and sand properties,
torized access to the park could modify dust emissions and        including grain size distribution, mineralogy (such as extents
associated downwind dust impacts on human health, vegeta-         of clay-mineral coatings and feldspars), chemical and phys-
tion, and water quality (Ouren et al., 2007). Measurements        ical weathering rates, dune type, and palaeoenvironmental
by Gillies et al. (2017) (see their Fig. 10) indicated a posi-    history.
tive relationship between airborne PM10 and wind speed in a          A further complication in representing the role of dust
section of the Oceano Dunes SVRA with vehicular activity;         emissions from active sands in climate models is that sand
however, their measurements of riding area dust concentra-        dunes can transition between stable and active states in past,

www.atmos-chem-phys.net/19/2947/2019/                                              Atmos. Chem. Phys., 19, 2947–2964, 2019
2958 Y. Huang et al.: Fine dust emissions from active sands at coastal Oceano Dunes, California Figure 7. Normalized volume particle size distribution (PSD) of sand samples collected from the Oceano field site. Statistical parameters of the PSD are reported in the table to the right. D10, D50, and D90 refer to cut-off diameters of the 10th, 50th, and 90th percentile of sample grains by mass, respectively. Note that the values are averages of four samples with two collected from the tower location and two from 100 m upwind. Figure 8. (a) Scanning electron microscopy (SEM) image of an Oceano sand sample. (b) Energy dispersive X-ray spectroscopy (EDS) chemical composition (percentage by mass) of a quartz grain in (a) (the location of the analysis is marked by the black letter “B”). (c) EDS chemical composition of a K-rich feldspar in (a) marked by the black letter “C”. (d) Close-up image of a quartz sand grain with mineral coatings. (e) EDS chemical composition of the mineral coatings in (d) marked by the black letter “E”. Atmos. Chem. Phys., 19, 2947–2964, 2019 www.atmos-chem-phys.net/19/2947/2019/
Y. Huang et al.: Fine dust emissions from active sands at coastal Oceano Dunes, California                                    2959

current, and future climates. Many stable dunes have ac-         5   Conclusion
cumulated extensive clay-mineral coatings (Bowler, 1973;
Gardner and Pye, 1981; Muhs et al., 1997), and, if activated,    We presented the first (to our knowledge) in situ field mea-
these dunes could possibly produce substantial fine dust         surements of dust emissions under natural saltation from an
emissions through sandblasting-induced removal of clay-          active sand sheet at the coastal Oceano Dunes in California
mineral coatings (Fig. S10 in the Supplement; Bullard et al.,    (Fig. 1 and Fig. S1 in the Supplement). We found that al-
2007; Swet et al., 2019). The transition from stable to active   though the PM10,g dust emitted from Oceano is on the low
sand dunes can be triggered by increases in wind speed or de-    end of the range in emissions produced by non-sandy soils
creases in vegetation coverage, which in turn can be caused      for similar wind speed (Fig. 2a), it is also substantially finer
by decreased precipitation or by human activities, such as       (Fig. 3a) such that the PM2.5,a flux is comparable in magni-
grazing and land-use change (Ashkenazy et al., 2012). Ar-        tude to dust emitted from non-sandy soils (Fig. 2b). As fine
eas with coexisting active and stable sand dunes, such as        dust has a longer atmospheric lifetime, is associated with ad-
coastal zones, are especially vulnerable to the reactivation     verse impacts on human health, and produces a cooling radia-
of stable sand dunes (Yizhaq et al., 2009) and could thus be-    tive effect, dust emissions from Oceano could impact down-
come potent dust emission sources, especially if the dunes       wind climate and human health.
experienced some weathering in the humid, salt-rich coastal         Our results provide insights into the physical processes
environment (Muhs et al., 1997). Because active sands are        that drive dust emissions from the sand sheet at Oceano
generally not represented as dust emission sources in climate    Dunes. We found that Oceano sand has substantial clay-
models, reactivation of sand dunes might thus enhance future     mineral coatings and feldspars (Table 2), suggesting that dust
dust effects on climate beyond what current models simulate      is emitted through a combination of removal of clay-mineral
(Kok et al., 2018).                                              coatings, release of resident fines, and ballistic breakdown of
                                                                 feldspars by saltation impacts. As feldspars are the most effi-
4.4   Limitations of the methodology                             cient ice nuclei for mixed-phase clouds, we speculate that
                                                                 dust emitted from Oceano could potentially contribute to
Our methodology has important limitations. First, our XRPD       glaciating downwind clouds, thereby affecting precipitation
analysis could not distinguish the concentrations of clay-       in the Sierra Nevada region.
mineral coatings from loose individual fine particles con-          Our measurements provide limited insights into the con-
tained in the pore spaces between sand grains. This uncer-       tribution of active sands to the global dust cycle. We found
tainty limits our interpretation of the relative contributions   that the PSD of dust emitted from Oceano is much finer than
of removal of clay-mineral coatings and saltation-driven re-     that observed in situ over North Africa (Fig. 3b). Therefore,
lease of loose fines to our measured dust fluxes. Second, we     although the processes responsible for dust emission at our
did not collect aeolian dust samples simultaneously with the     Oceano site – removal of clay-mineral coatings and aeolian
field measurements. Instead, we collected soil samples on        abrasion of feldspars – could be important for specific North
14 October 2016, more than a year after the field measure-       African dust sources, they are likely not primary dust emis-
ments in the summer of 2015, such that it is possible that       sion processes on a regional scale in North Africa. However,
these samples are not representative of the sand surfaces at     because it is unclear how representative the dust emission
the time of our field campaign. However, sand-surface prop-      processes at our Oceano site are for emission processes oc-
erties over a large area are unlikely to change substantially    curring at typical active sands, the contributions of active
within a timescale of 1 year (Hillel, 1998). Third, we ap-       sands to dust emission from North Africa and other glob-
proximated dust as spherical particles when correcting the       ally important source regions remain uncertain. Further work
OPC bin sizes, although dust is highly aspherical (Okada et      on dust emissions from active sands with various properties
al., 2001; Kandler et al., 2007). Because OPC measurements       (sand size distribution, mineralogy, chemical and physical
use side-scattered light to determine dust size, which remains   weathering rates, dune type, and palaeoenvironmental his-
poorly understood (Nousiainen and Kandler, 2015), we fol-        tory) is thus needed to evaluate the contribution of active
lowed past work (Sow et al., 2009; Rosenberg et al., 2014;       sands to the global dust cycle.
Ryder et al., 2018) in approximating dust as spheres. Fourth,
we did not quantify the effect on the measured PSD due to
the dependence of the sampling efficiency on particle size       Data availability. Data used for this paper are publicly accessible
and wind speed (Von der Weiden et al., 2009), which might        and can be found on the Zenodo data depository at https://zenodo.
                                                                 org/record/2573973 (last access: 27 February 2019).
be important especially for the largest particle bin (bin 6),
as suggested by the decrease in sandblasting efficiency with
shear velocity for this bin, which contrasts with the increase
with shear velocity for the smaller particle bins. Therefore,
it is possible that the PSD of emitted dust (Fig. 4) remains
invariant with shear velocity.

www.atmos-chem-phys.net/19/2947/2019/                                              Atmos. Chem. Phys., 19, 2947–2964, 2019
You can also read


