The potential role of methanesulfonic acid (MSA) in aerosol formation and growth and the associated radiative forcings - Atmos. Chem. Phys
←
→
Page content transcription
If your browser does not render page correctly, please read the page content below
Atmos. Chem. Phys., 19, 3137–3160, 2019
https://doi.org/10.5194/acp-19-3137-2019
© Author(s) 2019. This work is distributed under
the Creative Commons Attribution 4.0 License.

The potential role of methanesulfonic acid (MSA) in aerosol
formation and growth and the associated radiative forcings
Anna L. Hodshire1 , Pedro Campuzano-Jost2,3 , John K. Kodros1 , Betty Croft4 , Benjamin A. Nault2,3 ,
Jason C. Schroder2,3 , Jose L. Jimenez2,3 , and Jeffrey R. Pierce1
1 Department of Atmospheric Science, Colorado State University, Fort Collins, CO 80523, USA
2 Department of Chemistry, University of Colorado, Boulder, CO, USA
3 Cooperative Institute for Research in Environmental Sciences, University of Colorado, Boulder, CO, USA
4 Dalhousie University, Department of Physics and Atmospheric Science, Halifax, NS, B3H 4R2, Canada

Correspondence: Anna L. Hodshire (anna.hodshire@colostate.edu)

Received: 26 September 2018 – Discussion started: 7 November 2018
Revised: 13 February 2019 – Accepted: 18 February 2019 – Published: 12 March 2019

Abstract. Atmospheric marine aerosol particles impact             ally nonvolatile or semivolatile species or too volatile to
Earth’s albedo and climate. These particles can be primary        condense. We also present two limiting cases for MSA’s
or secondary and come from a variety of sources, includ-          volatility, assuming that MSA is always ideally nonvolatile
ing sea salt, dissolved organic matter, volatile organic com-     (irreversible condensation) or that MSA is always ideally
pounds, and sulfur-containing compounds. Dimethylsulfide          semivolatile (quasi-equilibrium condensation but still irre-
(DMS) marine emissions contribute greatly to the global bio-      versible condensation). We further present simulations in
genic sulfur budget, and its oxidation products can contribute    which MSA participates in binary and ternary nucleation
to aerosol mass, specifically as sulfuric acid and methane-       with the same efficacy as sulfuric acid whenever MSA is
sulfonic acid (MSA). Further, sulfuric acid is a known nu-        treated as ideally nonvolatile. When using the volatility pa-
cleating compound, and MSA may be able to participate             rameterization described above (both with and without nu-
in nucleation when bases are available. As DMS emissions,         cleation), including MSA in the model changes the global
and thus MSA and sulfuric acid from DMS oxidation, may            annual averages at 900 hPa of submicron aerosol mass by
have changed since pre-industrial times and may change in         1.2 %, N3 (number concentration of particles greater than
a warming climate, it is important to characterize and con-       3 nm in diameter) by − 3.9 % (non-nucleating) or 112.5 %
strain the climate impacts of both species. Currently, global     (nucleating), N80 by 0.8 % (non-nucleating) or 2.1 % (nu-
models that simulate aerosol size distributions include contri-   cleating), the cloud-albedo aerosol indirect effect (AIE) by
butions of sulfate and sulfuric acid from DMS oxidation, but      −8.6 mW m−2 (non-nucleating) or −26 mW m−2 (nucleat-
to our knowledge, global models typically neglect the impact      ing), and the direct radiative effect (DRE) by −15 mW m−2
of MSA on size distributions.                                     (non-nucleating) or −14 mW m−2 (nucleating). The sulfate
   In this study, we use the GEOS-Chem-TOMAS (GC-                 and sulfuric acid from DMS oxidation produces 4–6 times
TOMAS) global aerosol microphysics model to determine             more submicron mass than MSA does, leading to an ∼ 10
the impact on aerosol size distributions and subsequent           times stronger cooling effect in the DRE. But the changes
aerosol radiative effects from including MSA in the size-         in N80 are comparable between the contributions from MSA
resolved portion of the model. The effective equilibrium va-      and from DMS-derived sulfate/sulfuric acid, leading to com-
por pressure of MSA is currently uncertain, and we use the        parable changes in the cloud-albedo AIE.
Extended Aerosol Inorganics Model (E-AIM) to build a pa-             Model–measurement comparisons with the Heintzenberg
rameterization for GC-TOMAS of MSA’s effective volatil-           et al. (2000) dataset over the Southern Ocean indicate that
ity as a function of temperature, relative humidity, and avail-   the default model has a missing source or sources of ultra-
able gas-phase bases, allowing MSA to condense as an ide-         fine particles: the cases in which MSA participates in nucle-

Published by Copernicus Publications on behalf of the European Geosciences Union.
3138                          A. L. Hodshire et al.: The potential role of methanesulfonic acid (MSA) in aerosol formation

ation (thus increasing ultrafine number) most closely match         Frossard et al., 2014; Wang et al., 2017) that could domi-
the Heintzenberg distributions, but we cannot conclude nu-          nate submicron aerosol mass (O’Dowd et al., 2004; Facchini
cleation from MSA is the correct reason for improvement.            et al., 2008). Sulfur-containing organic compounds in the
Model–measurement comparisons with particle-phase MSA               form of dimethylsulfide (DMS; CH3 SCH3 ) and organosul-
observed with a customized Aerodyne high-resolution time-           fates (Bates et al., 1992; Quinn et al., 2015) are important
of-flight aerosol mass spectrometer (AMS) from the ATom             precursors and contributors to marine aerosol. DMS accounts
campaign show that cases with the MSA volatility parame-            for approximately one-fifth of the global sulfur budget (Fid-
terizations (both with and without nucleation) tend to fit the      des et al., 2017), with DMS flux estimates ranging from 9
measurements the best (as this is the first use of MSA mea-         to 35 Tg yr−1 of sulfur (Belviso et al., 2004; Elliott, 2009;
surements from ATom, we provide a detailed description of           Woodhouse et al., 2010; Tesdal et al., 2016), although global
these measurements and their calibration). However, no one          DMS fluxes remain uncertain (Tesdal et al., 2016; Royer
model sensitivity case shows the best model–measurement             et al., 2015). DMS and its oxidation products have been
agreement for both Heintzenberg and the ATom campaigns.             the focus of many studies determining the gas-phase chem-
As there are uncertainties in both MSA’s behavior (nucle-           istry (e.g., Barnes et al., 2006, and references therein), gas-
ation and condensation) and the DMS emissions inventory,            phase kinetics (e.g., Wilson and Hirst, 1996, and references
further studies on both fronts are needed to better constrain       therein), and possible impact on the aerosol size distribution
MSA’s past, current, and future impacts upon the global             and radiative budget (e.g., Korhonen et al., 2008; Woodhouse
aerosol size distribution and radiative forcing.                    et al., 2013). Much of this research has stemmed from efforts
                                                                    to test the hypothesis that DMS emissions may regulate cli-
                                                                    mate through a temperature–emissions feedback (the CLAW
                                                                    hypothesis; Charlson et al., 1987).
1   Introduction                                                       The main products of DMS from oxidation by the hy-
                                                                    droxyl radical are sulfur dioxide (SO2 ) and methanesulfonic
Atmospheric marine particles contribute significantly to the        acid (CH3 S(O)2 OH, MSA) (Andreae et al., 1985). SO2 can
global aerosol budget and impact the planetary albedo and           further oxidize to create sulfuric acid (H2 SO4 ). The rela-
climate (Quinn et al., 2015; Reddington et al., 2017). The          tive yields of SO2 and MSA from DMS oxidation are still
number concentration, size, and chemical composition of             uncertain, with reported branching ratios from oxidation of
these marine particles determine their ability to affect cli-       DMS by OH addition of SO2 : MSA varying across 75 : 25,
mate, by either absorbing and scattering incoming solar radi-       65 : 4, 27 : 6, and 38 : 11 (Yin et al., 1990; Chin et al., 1996;
ation (the direct radiative effect – DRE; Charlson et al., 1992;    Sørensen et al., 1996; Arsene et al., 2001). The effective
Erlick et al., 2001) or indirectly, by modifying cloud proper-      equilibrium vapor pressure of sulfuric acid in the presence
ties (the cloud-albedo aerosol indirect effect – AIE; de Leeuw      of water in the troposphere is negligible compared to sulfuric
et al., 2011). For the DRE, the magnitude and relative divi-        acid concentrations under all atmospherically relevant con-
sion between absorbing and scattering will depend on both           ditions (Marti et al., 1997), allowing sulfuric acid to readily
the particle size and composition (Bond et al., 2006, 2013);        condense onto particles of all sizes and participate in particle
peak efficiencies for scattering and absorbing solar radiation      nucleation (e.g., Kulmala et al., 2000). Gas-phase concentra-
are typically reached with particles between 100 and 1 µm in        tions of MSA have been observed to be 10 %–100 % of sul-
diameter (Seinfeld and Pandis, 2006). The cloud-albedo AIE          furic acid concentrations in coastal marine boundary layers
refers to aerosols’ ability to alter the reflectivity (albedo) of   (Eisele and Tanner, 1993; Berresheim et al., 2002; Maudlin
clouds by changing properties such as the cloud droplet num-        III et al., 2003), and MSA can contribute to the growth of
ber concentration (CDNC) (Twomey, 1974). Typically, parti-          pre-existing marine particles, at times contributing over half
cles act as cloud condensation nuclei (CCN) if they are larger      as much bulk aerosol mass as non-sea-salt sulfate to the to-
than 40–100 nm; the ability of a particle to act as a CCN           tal aerosol burden (e.g., Preunkert et al., 2008; Legrand et
is also dependent upon particle hygroscopicity (Petters and         al., 2017). To our knowledge, the effective equilibrium va-
Kreidenweis, 2007). The number of particles in these size           por pressure of MSA, which should depend on temperature,
ranges depends on primary emissions, as well as nucleation,         relative humidity, and availability of bases, has not previ-
condensation, and coagulation (Pierce and Adams, 2009a).            ously been well quantified for the range of potential atmo-
To improve model estimates of the DRE and cloud-albedo              spheric conditions. Also to our knowledge, MSA has not yet
AIE, models must account for nucleation and condensational          been observed in the field to directly contribute to aerosol
growth of marine particles.                                         nucleation, although Dall’Osto et al. (2018) observed new
   Biologically productive oceans emit volatile organic com-        particle formation events over Greenland that suggest that
pounds (VOCs), primary biological particles, primary or-            MSA could be involved in a portion of the events. Bork
ganic particles, and halocarbons (Quinn et al., 2015). Sources      et al. (2014) determined through the Atmospheric Cluster
of marine particles often indicate organic species present          Dynamics Code kinetic model (McGrath et al., 2012; Ole-
(e.g., Heintzenberg et al., 2001; O’Dowd et al., 2007;              nius et al., 2013) that the presence of MSA could increase

Atmos. Chem. Phys., 19, 3137–3160, 2019                                              www.atmos-chem-phys.net/19/3137/2019/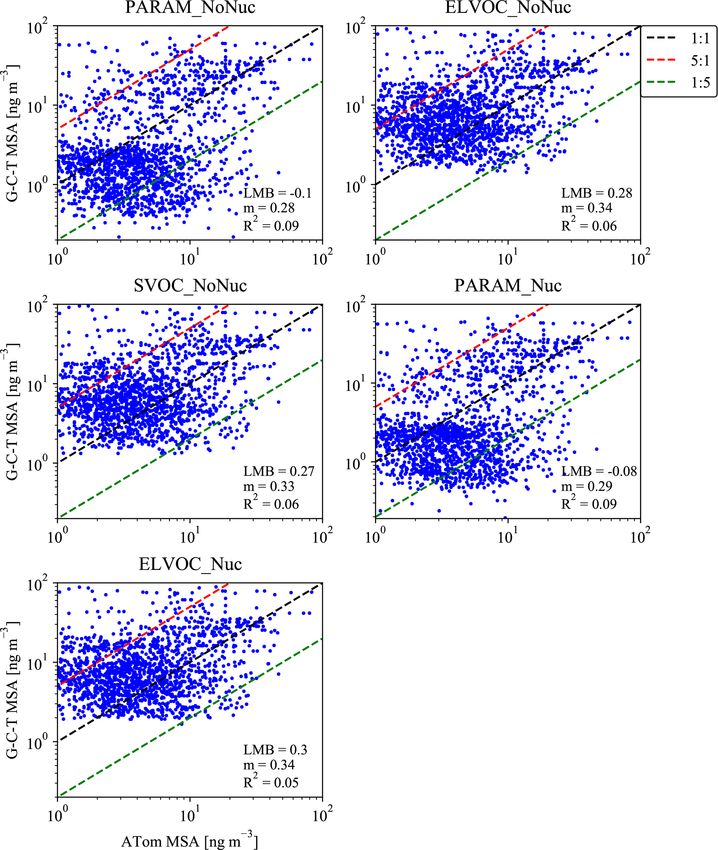
A. L. Hodshire et al.: The potential role of methanesulfonic acid (MSA) in aerosol formation                                 3139

the molecular cluster formation rates by as much as 1 or-                “quasi-equilibrium” growth by Zhang et al. (2012); we
der of magnitude for a MSA–H2 SO4 –DMA (DMA: dimethy-                    will refer to this type of condensation as “SVOC-like”
lamine) system under atmospherically relevant MSA concen-                condensation in this work.
trations. This enhancement is predicted to be typically less
than 300 % at 258 K and less than 15 % at 298 K for the case          An important characteristic for growth in these regimes
of [DMA] = 109 molec. cm−3 (Bork et al., 2014). Chen et            is that under ELVOC-like condensation, particles in the ki-
al. (2015) observed an MSA–H2 O–TMA (TMA: trimethy-                netic regime (Dp < ∼ 50 nm) all grow in diameter at the same
lamine) system to nucleate in the laboratory, but at an ef-        rate (e.g., nm h−1 ) regardless of diameter, whereas in the
ficiency lower than that of the H2 SO4 –H2 O system. Chen          continuum regime (Dp > ∼ 1 µm), particle growth rates are
and Finlayson-Pitts (2017) further observed nucleation of          proportional to 1/Dp . Conversely, SVOC-like condensation
MSA/H2 O systems with TMA, DMA, MA (MA: methy-                     growth rates scale with Dp for all particle sizes, favoring
lamine), and ammonia. To our knowledge, global models that         the largest particles. Thus, if MSA participates in ELVOC-
simulate aerosol number concentrations (e.g., D’Andrea et          like condensation, ultrafine particles are able to grow more
al., 2013; Kodros et al., 2018; Ma and Yu, 2015; Regayre et        quickly to climatically relevant sizes (e.g., CCN) as com-
al., 2018; Xausa et al., 2018) only track the effect of sulfuric   pared to SVOC-like condensation. In reality, MSA’s contri-
acid and aqueous sulfate from DMS/SO2 oxidation on the             bution towards growth likely lies between these two limiting
aerosol size distribution and not MSA. Thus, the potential         cases: as MSA is an acid, its volatility will depend on not
contribution towards nucleation and/or size-resolved particle      only temperature, but also relative humidity and gas-phase
growth by MSA and the resulting radiative impacts has not          bases (e.g., Barsanti et al., 2009; Yli-Juuti et al., 2013; Hod-
yet been quantified.                                               shire et al., 2016).
   The effective volatility (equilibrium vapor pressure above         In this study, we use the GEOS-Chem-TOMAS global
the particle-phase mixture) of MSA will modulate its impact        chemical-transport model to estimate the contribution of
on the aerosol size distribution. Condensational growth of va-     MSA to the aerosol size distribution and resulting radia-
pors to the particle phase is controlled by both the volatil-      tive effects. We examine (1) MSA condensation assump-
ity of the condensing species and the concentration of the         tions, testing the limiting cases of growth (ELVOC-like ver-
species in the gas phase. Riipinen et al. (2011) presented two     sus SVOC-like) as well as a parameterization of volatility
limiting cases of growth for gas-phase condensable material.       dependent on temperature, water vapor, and gas-phase bases
                                                                   built from a phase-equilibrium model and (2) how the con-
 1. Compounds with low enough saturation vapor concen-             tribution of MSA changes depending on whether or not it is
    trations (C ∗ ; Donahue et al., 2006) may be considered        allowed to participate in nucleation. We further use global
    essentially nonvolatile to condense irreversibly through       measurements of aerosol size distributions as compiled by
    kinetic, gas-phase-diffusion-limited condensation (Ri-         Heintzenberg et al. (2000) and MSA mass as observed on
    ipinen et al., 2011; Zhang et al., 2012). This type of         the ATom mission to compare the various model assump-
    growth is referred to as “kinetic condensation” by Ri-         tions. Our goals are to determine the sensitivity of the aerosol
    ipinen et al. (2011) and can be thought of as effec-           size distribution and radiative impacts implied by the var-
    tively nonvolatile condensation. The effective volatility      ious assumptions, and to see whether the assumptions can
    required to achieve effectively nonvolatile condensation       be constrained by observations. This study is a first look
    typically must be less than C ∗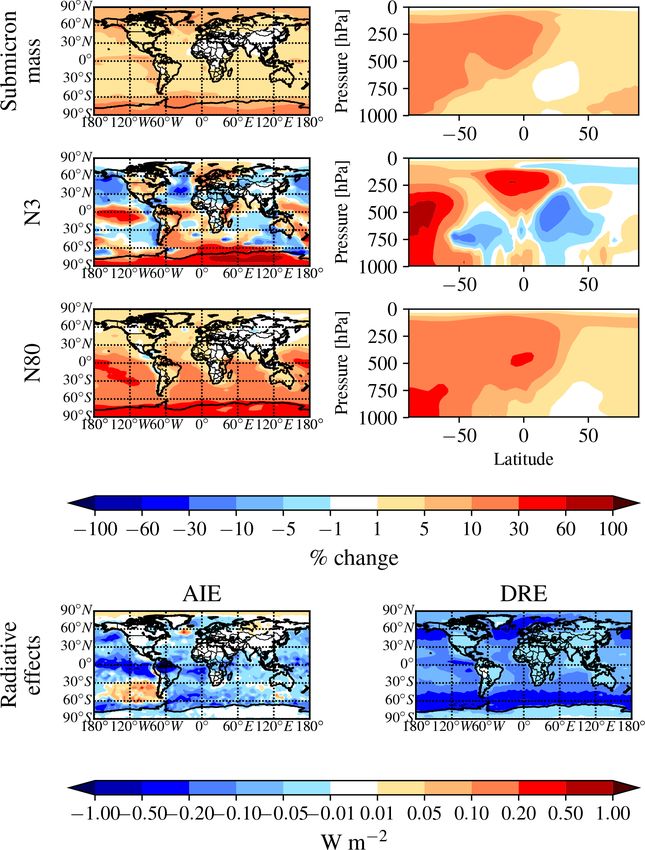
3140                         A. L. Hodshire et al.: The potential role of methanesulfonic acid (MSA) in aerosol formation

Kodros et al., 2016, 2017) to test the sensitivity of the         spatially, but overall, similar magnitudes of changes were ob-
aerosol size distribution to the addition of a marine sec-        served. The Supplement Sect. S2 provides more analysis of
ondary organic aerosol (SOA) species, represented in this         the two different emissions inventories.
work by methanesulfonic acid (MSA), of varying effective             In the standard GEOS-Chem DMS mechanism, DMS re-
volatility and nucleation capability. The version of GEOS-        acts with OH through the OH addition pathway to form mo-
Chem-TOMAS (GC-TOMAS) used here has 47 vertical lev-              lar yields of 0.75 SO2 and 0.25 MSA (Chatfield and Crutzen,
els, a horizontal resolution of 4◦ × 5◦ (∼ 400 km at mid-         1990; Chin et al., 1996). As discussed in the introduction,
latitudes), and GEOS-FP reanalysis (http://gmao.gsfc.nasa.        laboratory studies have reported variable yields of SO2 and
gov, last access: 5 March 2019) for meteorological inputs.        MSA from DMS oxidation by OH addition. We do not test
GC-TOMAS uses 15 size sections spanning dry diameters             the sensitivity of our simulations to other pathways, and this
from approximately 3 to 10 µm and explicitly tracks to-           is a source of uncertainty. DMS also reacts with the nitrate
tal particle number as well as sulfate, sea salt, dust, hy-       radical (NO3 ) to form a molar yield of 1 SO2 . SO2 can then
drophilic OA, hydrophobic OA, internally mixed BC, exter-         (1) react further in the model with OH to form gas-phase
nally mixed BC, and water mass (Lee and Adams, 2012).             sulfuric acid, (2) undergo aqueous oxidation with H2 O2 or
Biomass burning emissions are simulated using the Fire            O3 to form condensed sulfate, or (3) be lost through dry
INventory from NCAR version 1.0 (FINNv1) (Wiedin-                 and wet deposition processes (Pierce et al., 2013). Pierce
myer et al., 2011). Dust emissions follow the parameter-          et al. (2013) found that in GC-TOMAS (v8.02.02), 26 % of
ization of the DEAD scheme (Zender et al., 2003); sea-            global SO2 formed sulfate through aqueous chemistry and
salt aerosol emissions follow the parameterization of Jaeglé      13 % formed sulfuric acid through gas-phase reaction with
et al. (2011). Anthropogenic emissions except for ammo-           OH (the rest was lost through dry and wet deposition). The
nia, black carbon, and organic aerosol are from the Emis-         sulfate formed through aqueous chemistry is added to CCN-
sions Database for Global Atmospheric Research (EDGAR;            sized particles when activated in clouds, whereas the sulfu-
Janssens-Maenhout et al., 2010). In Europe, Canada, the           ric acid formed from OH reactions participates in nucleation
US, and Asia, anthropogenic emissions are overwritten             and irreversible condensation to particles of all sizes. Prior
by the European Monitoring and Evaluation Programme               to this work, the DMS/SO2 -oxidized sulfuric acid and sul-
(Centre on Emissions Inventories and Projections, 2013),          fate were included in the size-resolved portion of the GC-
the Criteria Air Contaminant Inventory (http://www.ec.gc.         TOMAS model, but MSA was not. In this study, we include
ca/air/default.asp?162lang=En&n=7C43740B-1, last access:          MSA in the size-resolved microphysics of the model. The
5 March 2019), the National Emission Inventory from the           contribution of MSA from DMS towards the sulfate budget
U.S. EPA (https://www.epa.gov/air-emissions-inventories,          and the size distribution as a function of particle size will then
last access: 5 March 2019), and the MIX (Li et al., 2017) in-     depend on both MSA’s volatility and ability to participate in
ventories, respectively. Black and organic carbon emissions       nucleation, as discussed below. A discussion of alternative
from fossil-fuel and biofuel combustion processes are from        oxidation pathways of DMS and the potential importance
Bond et al. (2007). Grid-box gas-phase concentrations of          of aqueous-phase DMS chemistry (currently not included in
NH3 are used in determining the volatility regime of MSA in       GEOS-Chem) is provided in Sect. 2.6.
the MSA parameterization (Sect. 2.2): global anthropogenic,          Nucleation is simulated via a ternary nucleation scheme
biofuel, and natural ammonia sources are from the Global          involving water, sulfuric acid, and ammonia (Napari et al.,
Emissions InitiAtive (GEIA) (Bouwman et al., 1997). An-           2002), scaled with a global tuning factor of 10−5 (Jung et
thropogenic ammonia emissions are overwritten over Eu-            al., 2010; Westervelt et al., 2013). In ammonia-limited re-
rope, Canada, the US, and Asia using the same regional in-        gions (less than 1 pptv), a binary nucleation scheme involv-
ventories discussed above for these regions. Ammonia emis-        ing water and sulfuric acid (Vehkamäki et al., 2002) is instead
sions from biomass burning are from FINNv1 (above). All           used. When MSA is assumed to participate in nucleation, it
simulations are run for 2014, with 1 month of model spinup        is treated as an extra source of sulfuric acid for the ternary
that is not included in the analysis. All results are presented   and binary nucleation schemes within the model. Growth and
as annual or monthly averages.                                    loss of nucleated particles between 1 and 3 nm are simulated
   We use the default (at the time of this model version)         using the parameterization of Kerminen et al. (2004) (Lee et
GEOS-Chem DMS emissions inventory (Kettle et al., 1999;           al., 2013), with growth in this size range controlled by the
Kettle and Andreae, 2000) for this study. We acknowledge          pseudo-steady-state sulfuric acid (Pierce and Adams, 2009b)
that the updated DMS inventory of Lana et al. (2011) in-          and MSA when it participates in nucleation.
cludes more up-to-date measurements than the default DMS             SOA in GC-TOMAS is traditionally formed from ter-
inventory for GEOS-Chem v10.01. Their work found that the         restrial biogenic sources, with the biogenic source repre-
default climatology overpredicted DMS emissions in some           sented by 10 % of the monoterpene emissions, totalling
latitudes/seasons but underpredicted DMS emissions in other       19 Tg(SOA) yr−1 ; we further include 100 Tg(SOA) yr−1 spa-
latitudes/seasons. We found, however, that using the Lana         tially correlated with CO to represent anthropogenic SOA
emission inventory led to minor differences in MSA impacts        and anthropogenically controlled biogenic SOA (Spracklen

Atmos. Chem. Phys., 19, 3137–3160, 2019                                             www.atmos-chem-phys.net/19/3137/2019/
A. L. Hodshire et al.: The potential role of methanesulfonic acid (MSA) in aerosol formation                                       3141

et al., 2011; D’Andrea et al., 2013). The default GC-TOMAS
setting is for SOA to form through effective nonvolatile
condensation (ELVOC-like condensation) onto pre-existing
particles at the time of emission of the parent compound.
However, it is possible to instead have SOA form in GC-
TOMAS through quasi-equilibrium condensation (SVOC-
like condensation, but still irreversible, e.g., not allowing for
re-evaporation, in the model) by distributing the SOA across
aerosol sizes proportional to the aerosol mass distribution. In
this work, we assume ELVOC-like SOA condensation as it
performed best relative to size-distribution measurements in
D’Andrea et al. (2013).

2.2   MSA volatility assumptions, calculations, and
      parameterization

As the effective volatility of MSA is uncertain, we use the
Extended Aerosol Inorganics Model (E-AIM; http://www.
aim.env.uea.ac.uk/aim/aim.php, last access: 5 March 2019,
Clegg et al., 1992; Clegg and Seinfeld, 2006a, b; Wexler and
Clegg, 2002) to build a parameterization for GC-TOMAS of
MSA’s potential volatility as a function of temperature, rel-
ative humidity, and available gas-phase bases. E-AIM cal-
culates the MSA equilibrium vapor pressure above the par-
ticle mixture (Ceq in units of µg m−3 ), and thus we get an
MSA volatility parameterization in terms of Ceq (Fig. 1).
We also consider two ideal assumptions of MSA volatility:
(1) MSA condenses as an ELVOC-like species, condens-
ing irreversibly to aerosol of all sizes, with net condensa-
tion of MSA proportional to the Fuchs-corrected aerosol sur-
                                                                    Figure 1. E-AIM prediction of MSA equilibrium vapor pressure
face area. Conversely, (2) MSA condenses as an SVOC-like            above the particle mixture (Ceq ) under conditions with (a) no free
species, where the net condensation of MSA is proportional          ammonia and (b) high free ammonia (3 times as many moles of
to the aerosol mass distribution.                                   ammonia as MSA). (a) The dashed line at 90 % RH indicates the
   As MSA is a strong acid (pKa = −1.96; Haynes, 2017),             cut-off for representing MSA as a VOC-like (left of the line) or
we must consider the amount of atmospheric gas-phase base           an SVOC-like (right of the line) species. (b) The dashed line is de-
present; ammonia is used in E-AIM as the representative             scribed by Eq. (1) in the text. Above the dashed line, MSA is treated
base. Although Chen and Finlayson-Pitts (2017) found in             as an SVOC-like species; below the dashed line, MSA is treated as
laboratory experiments that MSA had different rates of new          an ELVOC-like species.
particle formation with amines than ammonia, GC-TOMAS
currently does not include any amine species, and thus we do
                                                                    tions between volatilities as a function of both temperature
not attempt to account for these variations. Figures S1 and
                                                                    and RH. We parameterize a transition between ELVOC-like
S2 in the Supplement provide global annual and seasonally
                                                                    behavior and SVOC-like behavior for excess-base conditions
averaged NH3 concentrations from GEOS-Chem-TOMAS.
                                                                    along the Ceq = 10−2 µg m−3 line using the dashed line in
The effective volatility of MSA also depends on the ambi-
                                                                    Fig. 1b, given by
ent temperature (Donahue et al., 2006) and relative humid-
ity (RH) (Chen et al., 2018). We run E-AIM for between              Ttrans (RH) = a − b · RH + c · RH2 − d · RH3 + e · RH4 , (1)
10 % and 100 % RH and between 240 and 310 K. Figure 1
shows the resulting volatility as a function of RH and tem-         where RH is the relative humidity, T is the temperature, Ttrans
perature for conditions with no free ammonia and excess am-         is the transition temperature, and a, b, c, d, and e are fit co-
monia (3 times as many moles of free ammonia than moles             efficients, whose values are listed in Table 1. If T > Ttrans ,
of MSA). At low-base conditions (Fig. 1a), MSA acts es-             then MSA is treated as an ideally SVOC-like species that
sentially as a VOC (will all stay in the vapor phase) be-           undergoes quasi-equilibrium condensation in GC-TOMAS.
low 90 % RH and condenses as an ideally SVOC-like species           If T < Ttrans , then MSA is low to extremely low in volatil-
above 90 % RH for the entire input temperature range. Con-          ity and will be treated as an ideally ELVOC-like species
versely, for excess-base conditions, we see that MSA transi-        that undergoes gas-phase-diffusion-limited condensation in

www.atmos-chem-phys.net/19/3137/2019/                                                 Atmos. Chem. Phys., 19, 3137–3160, 2019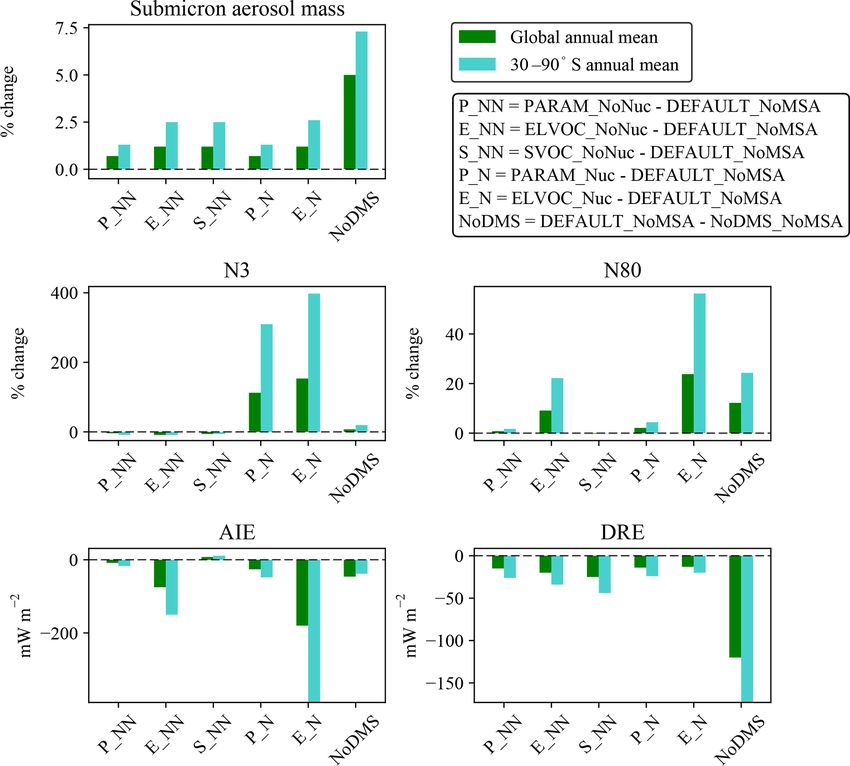
3142                           A. L. Hodshire et al.: The potential role of methanesulfonic acid (MSA) in aerosol formation

Table 1. Fit coefficients for the MSA volatility parameterization   ing upon the temperature, RH, and amount of ammonia in
equation.                                                           the gas phase. ELVOC_NoNuc treats MSA condensation
                                                                    as ELVOC-like condensation. SVOC_NoNuc treats MSA
                    Variable    Value                               condensation as SVOC-like condensation (but irreversible,
                    a           2.52 × 10²
                                                                    Sect. 2.2). PARAM_Nuc and ELVOC_Nuc are identical to
                    b           6.19 × 10⁻¹                         PARAM_NoNuc and ELVOC_NoNuc except that MSA is
                    c           3.49 × 10⁻²                         allowed to participate in nucleation with the properties of
                    d           5.6 × 10⁻⁴                          sulfuric acid, providing an upper bound on the role of MSA
                    e           3.32 × 10⁻⁶                         in nucleation. For PARAM_Nuc, MSA only participates in
                                                                    nucleation when MSA is in the ELVOC-like regime; for
                                                                    ELVOC_Nuc, MSA is always able to participate in nucle-
                                                                    ation. Finally, to determine the contribution of sulfate and
GC-TOMAS. We do not include a volatile region under                 sulfuric acid from DMS/SO2 oxidation alone to the default
excess-base conditions: the high-temperature, low-RH re-            size distribution, we run a case with DMS emissions turned
gions that this would be applicable to are globally limited and     off (NoDMS_NoMSA).
likely only occur over desert regions, where MSA formation             In the Supplement, we test the sensitivity of the model
is likely negligible. Although E-AIM predicts that MSA’s            to the DMS concentration with two additional DMS inven-
volatility will vary smoothly across the volatility space as        tories: the first is the DMS emissions inventory of Lana
a function of temperature and RH, for simplicity, we only           et al. (2011) and the second is the default DMS emis-
assume three condensational regimes: SVOC-like condensa-            sions inventory increased globally by a factor of 2. As
tion, ELVOC-like condensation, and VOC-like (no conden-             the sulfate and sulfuric acid from DMS/SO2 oxidation
sation).                                                            is included in the default case simulation, we run new
   When using this parameterization in GC-TOMAS, we use             default simulations with the new DMS inventories (DE-
a gas-phase ammonia mixing ratio of 10 pptv as a cutoff be-         FAULT_NoMSA_Lana and DEFAULT_NoMSA_2xDMS).
tween the no-ammonia and excess-ammonia cases, as this              We use the PARAM_NoNuc case settings to determine
roughly marks the transition from acidic to neutral aerosol         the change in MSA’s impact on the size distribution under
(Croft et al., 2016, Supplement Fig. S4). The gas-phase MSA         the new DMS emissions inventories (PARAM_NoNuc_Lana
production rate is explicitly tracked in the model, but not the     and PARAM_NoNuc_2xDMS). However, the results for the
MSA gas-phase concentrations. At the time of production,            contribution of MSA to the size distribution do not quali-
the model will then determine whether to treat MSA con-             tatively change between the default DMS emissions inven-
densation as an effectively volatile species (no MSA con-           tory and the Lana DMS emission inventory. The contribution
densing), an SVOC-like species (with all of the MSA pro-            of MSA towards the submicron aerosol mass and thus the
duced condensing to the mass distribution), or an ELVOC-            aerosol DRE in the 2xDMS case is roughly double that of
like species (with all of the MSA produced condensing to the        the base DMS case (DEFAULT_NoMSA), but N3 and N80
Fuchs surface area and participating in the nucleation cal-         do not significantly change for our tested metrics. Hence, we
culation in some simulations), based on the current T , RH,         will not include these model results in the main portion of
and available ammonia. For both SVOC-like and ELVOC-                the paper. See the Supplement, Sect. S2, Tables S1–S2, and
like condensation, the condensation is irreversible; we do not      Figs. S3–S5 for a brief analysis of the different inventories.
let MSA partition back to the gas phase once it is condensed
as gas-phase MSA is not tracked in the model. Even this sim-        2.4   Analysis of simulated radiative effects
ple parameterization is a significant increase in the physi-
cal representation of MSA volatility over assuming a fixed          We calculate aerosol DRE and cloud-albedo AIE following
volatility.                                                         Kodros et al. (2016). The all-sky DRE is calculated offline
                                                                    using the monthly mean aerosol mass and number distribu-
2.3    Descriptions of simulations                                  tions from the GC-TOMAS output. The refractive indices are
                                                                    from GADS (Global Aerosol Dataset; Koepke et al., 1997).
The different GEOS-Chem-TOMAS (GC-TOMAS) simu-                      Aerosol optical depth (AOD), single-scattering albedo, and
lations in this study are summarized in Table 2. The de-            the asymmetry parameter are calculated from Mie code
fault (DEFAULT_NoMSA) simulation represents a default               (Bohren and Huffman, 1983). Optical properties and the
GEOS-Chem-TOMAS simulation with only sulfate and sul-               monthly mean albedo and cloud fractions from GEOS5 are
furic acid from DMS/SO2 oxidation included in TOMAS;                used as inputs to the offline version of the Rapid Radiative
DEFAULT_NoMSA will be the comparison simulation for                 Transfer Model for Global Climate Models (RRTMG: Ia-
all other cases. PARAM_NoNuc uses the volatility pa-                cono et al., 2008) that has been implemented for the stan-
rameterization from E-AIM (Sect. 2.2), treating MSA as              dard (non-TOMAS) version of GEOS-Chem (Heald et al.,
a non-nucleating ELVOC, an SVOC, or a VOC, depend-                  2014). We assume an internal mixture, spherical particles,

Atmos. Chem. Phys., 19, 3137–3160, 2019                                              www.atmos-chem-phys.net/19/3137/2019/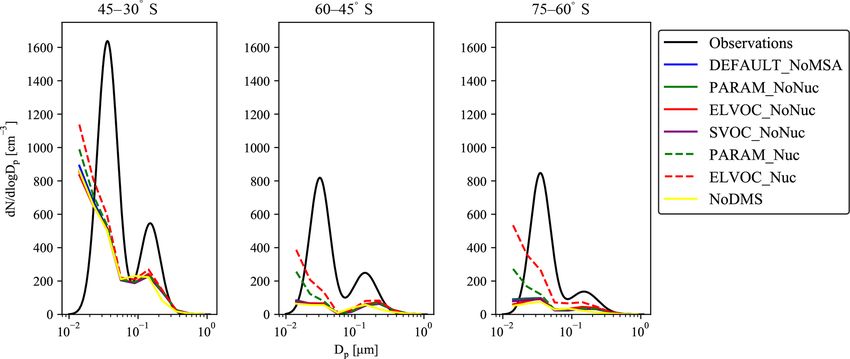
A. L. Hodshire et al.: The potential role of methanesulfonic acid (MSA) in aerosol formation                                  3143

Table 2. Description of simulations.

                      Simulation                              Description
                      DEFAULT_NoMSA                           Default model simulation: MSA does not contribute
                                                              to the particle size distribution in GEOS-Chem-
                                                              TOMAS (GC-TOMAS). The default GC-TOMAS
                                                              v10.01 DMS emissions are used, and SO2 , sulfate,
                                                              and sulfuric acid from DMS influences the particle
                                                              size distribution.
                      PARAM_NoNuc                             Parameterization for MSA from E-AIM simula-
                      (NoNuc: does not nucleate particles)    tions: volatility is based on NH3 , T , and RH.
                                                              MSA can act as non-volatile and non-nucleating,
                                                              semivolatile, or volatile (no condensation).
                      ELVOC_NoNuc                             MSA is assumed to be non-volatile and condenses
                                                              proportionally to the surface area distribution.
                      SVOC_NoNuc                              MSA is assumed to be semivolatile and condenses
                                                              proportional to the mass distribution.
                      ELVOC_Nuc                               Like ELVOC_NoNuc, but MSA acts like sulfuric
                                                              acid in nucleation.
                      NoDMS_NoMSA                             All DMS emissions are turned off in the model;
                                                              all other parameters are the same as the DE-
                                                              FAULT_NoMSA case.
                      DEFAULT_NoMSA_Lana                      Default case using the Lana et al. (2011) DMS
                                                              emissions inventory.
                      DEFAULT_NoMSA_2xDMS                     Default case with global DMS emissions increased
                                                              by a factor of 2.
                      PARAM_NoNuc_Lana                        Use the settings of PARAM_NoNuc with the Lana
                                                              et al. (2010) DMS emissions inventory.
                      PARAM_NoNuc_2xDMS                       Increase DMS emissions by a factor of 2, using the
                                                              settings of PARAM_NoNuc

non-absorptive OA (brown carbon is not considered in this           Scott et al. (2014), and Kodros et al. (2016):
work), and a core-shell morphology. We note that the mixing                                            1/3
state may vary both regionally and temporally, and that using                        CDNCbase case
                                                                    rperturbed =                             × 10 µm.           (2)
only one mixing state globally for the full year is a limitation                   CDNCsensitivity case
of our analysis of the DRE.                                         RRTMG is again used to determine the changes in the top-
   The cloud-albedo AIE is calculated as follows: first,            of-the-atmosphere radiative flux from the changes in effec-
the CDNC is found using the activation parameterization             tive cloud drop radii, with monthly mean meteorological data
of Abdul-Razzak and Ghan (2002) for the monthly mean                needed as inputs again informed by GEOS5. For more details
aerosol mass and number distribution from the GC-TOMAS              on the methods used for the DRE and cloud-albedo AIE cal-
output. A constant updraft velocity of 0.5 m s−1 is assumed.        culations, refer to Kodros et al. (2016) and references therein.
We again assume the aerosol species are internally mixed
within each TOMAS size bin to determine κ, the hygroscop-           2.5     Measurement comparisons
icity parameter, as a volume-weighted average of the individ-
ual aerosol species (Petters and Kreidenweis, 2007). For the        Heintzenberg et al. (2000) compiled 30 years (between
cloud-albedo AIE, we use an effective cloud drop radius of          ∼ 1970 and 1999) of physical marine aerosol data from both
10 µm as a control and then perturb this value with the ratio       sampling sites and field campaigns to create annual global
of the CDNC of each sensitivity case to the default case to the     size distribution parameters, fitting the size distributions to
one-third power, following the methods of Rap et al. (2013),        bimodal lognormal distributions for latitudinal bands spaced
                                                                    15◦ apart. We compare their fitted size distributions for 30–
                                                                    45, 45–60, and 60–75◦ S to the annual zonal-mean size dis-

www.atmos-chem-phys.net/19/3137/2019/                                                 Atmos. Chem. Phys., 19, 3137–3160, 2019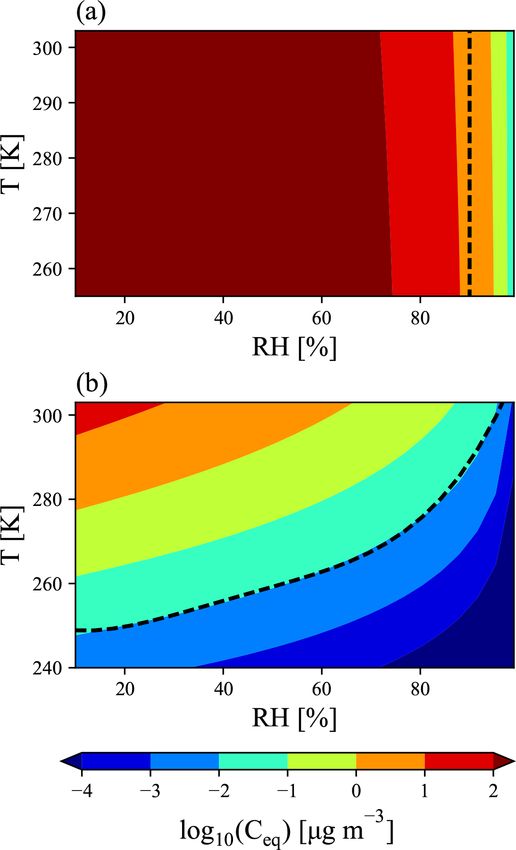
3144                         A. L. Hodshire et al.: The potential role of methanesulfonic acid (MSA) in aerosol formation

tributions for the DEFAULT_NoMSA case and each sen-                is comparable to that of sulfate; hence, the overall uncertainty
sitivity case from the model. (There are no data available         in the quantification is estimated to be ±35 % (2 standard de-
from Heintzenberg et al., 2000, for 75–90◦ S.) We note that        viations; Bahreini et al., 2009).
changes in the aerosol size distributions between the mea-            We compare our sensitivity simulations to the ATom-1 and
surement years and our simulated year (2014) are possible,         ATom-2 data as follows: we subtract the DEFAULT_NoMSA
even for these remote latitudes, and may result in appar-          sulfate mass (that accounts for sulfate and sulfuric acid from
ent simulation errors and/or apparent model-to-measurement         DMS/SO2 oxidation but not MSA) for the months of Au-
agreement biases.                                                  gust (ATom-1) and February (ATom-2) from the sulfate mass
   The first and second Atmospheric Tomography Missions            for the months of August and February for each sensitivity
(ATom-1 and ATom-2) (https://espo.nasa.gov/missions/               case that includes MSA for each grid box. The resultant dif-
atom/content/ATom, last access: 5 March 2019) took place           ferences in sulfate mass represent the model-predicted con-
from 28 July to 22 August 2016 and from 26 January to              tributions of MSA to the total sulfur budget for each case.
22 February 2017, respectively. Carrying a comprehen-              This is an imperfect approach, as the additional aerosol mass
sive gas and particle chemistry payload, the NASA DC-8             from the contribution of MSA will change the size distribu-
aircraft systematically sampled the remote atmosphere,             tion, therefore changing rates of wet and dry deposition, and
profiling continuously between 0.2 and 12 km. The data             is a limitation of this study. We then compare the measured
for both missions are publicly available (Wofsy et al.,            and predicted MSA mass by first averaging every ATom data
2018). As a part of the instrumentation on board, a highly         point that falls within a given GC-TOMAS grid box. We
customized Aerodyne high-resolution time-of-flight aerosol         then compare each averaged data point to that model grid
mass spectrometer (AMS in the following; DeCarlo et al.,           box. The ATom data used in our analysis lie within 150–
2006; Canagaratna et al., 2007) continuously measured the          180◦ W (the Pacific Ocean basin) and 10–40◦ W (the Atlantic
composition of submicron (PM1 ), non-refractory aerosol            Ocean basin), and thus we use zonal averages of these longi-
at 1 Hz time resolution. The principles of operation and           tude bands for both the ATom data and the GC-TOMAS out-
instrument/aircraft-operation specifics have been described        put. We note that comparing monthly mean simulated values
in detail elsewhere (Dunlea et al., 2009; Kimmel et al.,           from 2014 to airborne measurements from a single point in
2011; Schroder et al., 2018; Nault et al., 2018), and only the     time in 2016 and 2017 contributes to the apparent simulation
aspects specific to MSA quantification are discussed here.         errors. We also note that we use the full size range (3–10 µm)
   The instrument flew in the same configuration for all four      of sulfate from the model output, whereas the ATom data are
ATom missions. MSA data from the third and fourth ATom             submicron. However, the model-predicted percent difference
missions, ATom-3 and ATom-4, were not used in this study,          in MSA mass between the full range and the submicron mass
but the calibration details discussed in Sect. S5 apply to these   is well under 1 % (not shown).
missions, as well. Overall sensitivity (as determined daily           To evaluate model performance, we calculate the log-mean
from the ionization efficiency of nitrate, IENO3 ), relative       bias (LMB), the slope of the log–log regression (m), and the
ionization efficiencies, and particle transmission (all deter-     coefficient of determination (R 2 ) between each cosampled
mined periodically in the field) were stable over all four de-     GC-TOMAS grid box and averaged measurement point that
ployments. Particle-phase MSA concentrations for all ATom          falls within that GC-TOMAS grid box. The LMB is calcu-
flights are reported based on the intensity of the highly spe-     lated through
cific marker ion CH3 SO+  2 (Phinney et al., 2006; Zorn et al.,              PN
2008). The quantification of MSA PM1 concentrations from                        i log10 (Si ) − log10 (Oi )
                                                                   LMB =                                      ,                 (3)
the signal intensity of the CH3 SO+ 2 fragment is described in
                                                                                           N
detail in the Supplement, Sect. S5. Positive matrix factoriza-     where Si and Oi are the simulated and observed MSA
tion (Paatero, 1994; Ulbrich et al., 2009) of the ATom-1 or-       masses, respectively, for each data point i, and N is the num-
ganic aerosol (OA) and sulfate data confirmed the specificity      ber of data points. A LMB of 1 means that on average, the
of the marker ion for MSA and the consistency of the field         model overestimates the measurements by a factor of 101
mass spectra with those acquired in the MSA calibrations.          (10); a LMB of −1 means that on average, the model un-
Importantly, it also confirmed that the AMS response to MSA        derestimates the measurements by a factor of 10−1 (0.1); a
is independent of the aerosol acidity, which varied signifi-       LMB of 0 indicates no bias between the model and mea-
cantly over the range of conditions found in ATom. Further         surements (100 = 1.00). LMB, m, and R 2 are summarized
details are provided in Sect. S5.                                  in Fig. 8 (discussed in Sect. 3.4). Since MSA is observed
   For the data presented here, the AMS raw data were pro-         only in the particle phase in the ATom measurements, we do
cessed at 1 min resolution. Under those conditions, the de-        not include the NoDMS_NoMSA (no DMS emissions in the
tection limit of MSA was in the range 1.5–3 ng s m−3 (0.3–         model) sensitivity case in our analysis of the ATom data. We
0.6 pptv), and will decrease with the square root of the num-      present the aggregated results of the two campaigns, as well
ber of averaged 1 min data points. The uncertainty in the          as results for each campaign and ocean basin. The ATom-
MSA quantification as detailed in the Supplement, Sect. S5,        1 mission provided more data points than the ATom-2 mis-

Atmos. Chem. Phys., 19, 3137–3160, 2019                                             www.atmos-chem-phys.net/19/3137/2019/
A. L. Hodshire et al.: The potential role of methanesulfonic acid (MSA) in aerosol formation 3145
sions (1258 versus 1000), and thus the aggregate results are of MSA to ammonia for a future study. It is important to
slightly skewed towards the ATom-1 results. note that other bases such as amines could also have an im-
portant effect on MSA’s effective volatility (e.g., Chen and
2.6 Study caveats Finlayson-Pitts, 2017). However, the standard GEOS-Chem
currently does not account for gas-phase bases beyond am-
This study is intended to examine the sensitivity of the monia, and this sensitivity will also be left for a future study.
aerosol size distribution and radiative impacts implied by We do not test the sensitivity of our simulations to the bi-
the various sensitivity treatments of MSA (Table 2). How- nary and ternary nucleation schemes used in this study, in-
ever, our treatments of DMS and MSA still fall short of cluding potential sensitivity to the global tuning factor of
what is currently known about organic condensational be- 10−5 that was developed for continental regions (Jung et al.,
havior. Assuming idealized semivolatile condensation with 2010; Westervelt et al., 2013). This source of uncertainty
no re-evaporation due to conditional changes (e.g., change should be tested in future studies, as well.
in temperatures, RH) may overestimate the amount of MSA
able to condense on particles, but it may also underestimate
particle-phase MSA if conditions for condensation switch 3 Results and discussion
from unfavorable to favorable after MSA chemical produc-
tion. Further, relying on E-AIM simulations to construct our Figure 2 shows the global annual mean percent change (at
volatility parameterization could have hidden biases due to 900 hPa and zonally) for submicron mass by adding MSA
an incomplete understanding of the system. We are also ne- for the PARAM_NoNuc, ELVOC_NoNuc, SVOC_NoNuc,
glecting known as well as gas-phase and aqueous-phase ox- PARAM_Nuc, and ELVOC_Nuc simulations. Figure 3
idation pathways of DMS that are currently not included in shows the global annual mean percent change in N3 and
GEOS-Chem. The standard GEOS-Chem model does not in- N80 due to addition of MSA at 900 hPa and zonally for all
clude DMS oxidation through the OH or halogen addition model levels for each of these cases, and Fig. 4 shows the
pathways to dimethylsulfoxide (DMSO). DMSO chemistry corresponding global annual cloud-albedo AIE and DRE of
reduces the yield of sulfate formation from DMS/SO2 oxi- MSA. Figure 5 shows the global annual mean percent contri-
dation (Breider et al., 2014) by increasing the yields of both bution from DMS/SO2 oxidation (at 900 hPa and zonally)
gas-phase and aqueous-phase MSA as well as aqueous-phase alone (not including MSA) to submicron mass, N3, N80,
dimethyl sulfone (DMSO2 ), another stable oxidation product AID, and DRE. Figure 6 and Table S3 summarize the re-
(Hoffmann et al., 2016). To reduce the number of parameters sults of Figs. 2, 3, 4, and 5. All of the numerical statistics
for this study, we do not include the DMSO pathway. We ac- presented in Sect. 3.1–3.4 are for the annual mean, either
knowledge that neglecting this pathway will slightly bias our globally or between 30 and 90◦ S. Each case with MSA is an-
estimates of the contributions to the aerosol size distribution alyzed for the change relative to DEFAULT_NoMSA to de-
of sulfate and MSA mass high and low, respectively. Further, termine the impact that MSA has on the size distribution and
aqueous-phase production of MSA would condense on CCN- resulting radiative effects (positive values indicate that the
sized particles, similar to aqueous-phase sulfate (Sect. 2.1), inclusion of MSA increases a given metric). For reference,
shifting the size distribution to larger sizes. Heterogeneous Fig. S6 provides the absolute number concentration for N3
oxidation may limit the lifetime of MSA in the particle phase and N80 at 900 hPa and zonally for all model levels for the
(Mungall et al., 2017; Kwong et al., 2018), although the re- DEFAULT_NoMSA simulation. We will refer back to these
active uptake coefficients from these studies are somewhat figures in the following sections.
dissimilar, indicating a need for further study of the system.
Regardless, neglecting heterogeneous chemistry could over- 3.1 Volatility-dependent impact of MSA if MSA does
estimate the estimate of the contribution of MSA to aerosol not participate in nucleation
mass. Finally, if MSA does participate in nucleation, it is un-
likely that it will behave exactly like sulfuric acid, as it is The top rows of Figs. 2 and 3 show the global an-
treated here. All of the limitations described above are im- nual mean percent change at 900 hPa and zonally from
portant and require further testing in detailed chemical mod- adding MSA using the volatility parameterization without
els and chemical-transport models in order to determine their nucleation (PARAM_NoNuc–DEFAULT_NoMSA) for sub-
effects. micron aerosol mass (Fig. 2) and N3 and N80 (Fig. 3). By
Another limitation of this study is our reliance upon the adding MSA with these assumptions, we predict at 900 hPa
current ammonia inventory in GEOS-Chem as well as our an increase in submicron mass of 0.7 % globally and 1.3 %
cutoff value of 10 ppt of ammonia between the no ammo- between 30 and 90◦ S; a decrease in N3 of −3.9 % globally
nia and excess ammonia regimes (Sect. 2.2). Uncertainties and −8.5 % between 30 and 90◦ S; and an increase in N80
in the ammonia inventories over the oceans could change of 0.8 % globally and 1.7 % between 30 and 90◦ S (Fig. 6
our results, as could a different cutoff value. As this study and Table S3). These MSA impacts are limited by ammo-
is focused on MSA sensitivities, we will leave sensitivities nia availability. Figures S1 and S2 show that many oceanic
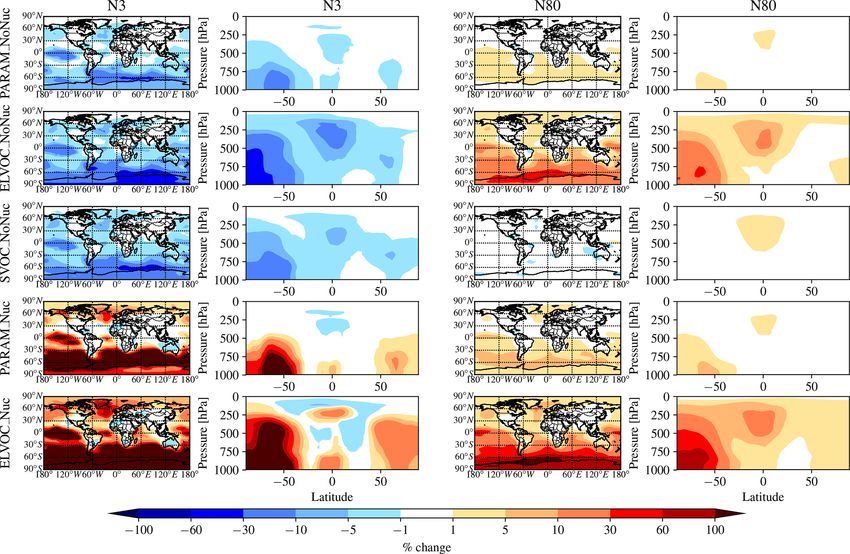
www.atmos-chem-phys.net/19/3137/2019/ Atmos. Chem. Phys., 19, 3137–3160, 20193146 A. L. Hodshire et al.: The potential role of methanesulfonic acid (MSA) in aerosol formation Figure 2. Global annual mean percent change in submicron aerosol mass due to the addition of MSA at 900 hPa (first column) and global zonal annual mean percent change (second column) between DEFAULT_NoMSA and PARAM_NoNuc (first row), ELVOC_NoNuc (second row), SVOC_Nuc (third row), PARAM_Nuc (fourth row), and ELVOC_Nuc (fifth row) (warm colors indicate an increase in submicron mass as compared to DEFAULT_NoMSA). regions are predicted to have annual and seasonal ammonia over the southern-oceans boundary layer (high-RH condi- mixing ratios of less than 10 ppt. Below 10 pptv of ammonia, tions). Only in the Southern Hemisphere (SH) winter months MSA condensation as SVOC-like or VOC-like (no conden- does ammonia exceed 10 ppt over appreciable regions in the sation) (Fig. 1a) and MSA condensation will only be SVOC- southern oceans (Fig. S2); during this time, MSA conden- like if RH > 90 %; under these conditions for the majority sation is ELVOC-like due to cold temperatures (Fig. 1b). of the year, MSA will be a VOC-like species over Antarc- As shown in D’Andrea et al. (2013), ideal-SVOC mate- tica (low-RH conditions) and often an SVOC-like species rial largely condenses primarily to accumulation-mode parti- Atmos. Chem. Phys., 19, 3137–3160, 2019 www.atmos-chem-phys.net/19/3137/2019/
A. L. Hodshire et al.: The potential role of methanesulfonic acid (MSA) in aerosol formation                                3147

Figure 3. Global annual mean percent change in N3 and N80 at 900 hPa (first and third columns) and global zonal annual mean per-
cent change (second and fourth columns) between DEFAULT_NoMSA and PARAM_NoNuc (first row), ELVOC_NoNuc (second row),
SVOC_Nuc (third row), PARAM_Nuc (fourth row), and ELVOC_Nuc (fifth row) (warm colors indicate an increase in N3/N80 as compared
to DEFAULT_NoMSA). First and second columns: N3 (the number concentration of particles with diameters larger than 3 nm). Third and
fourth columns: N80.

cles, which in turn suppresses N3 through increased coagu-            The idealized volatility cases, ELVOC_NoNuc (Figs. 2
lation and reduced nucleation and has little impact on N80.        and 3, second row) and SVOC_NoNuc (Figs. 2 and 3, third
In the midlatitudes, the annual and seasonal ammonia con-          row), help to highlight and further explain MSA’s volatility-
centrations often exceed 10 ppt, and thus MSA condensa-            dependent contribution towards growth. In both of these
tion will be either ELVOC-like under low-temperature and/or        cases, 100 % of the formed MSA goes to the particle phase,
high-RH conditions or SVOC-like under high-temperature             unlike with the MSA volatility parameterization, where MSA
and/or low-RH conditions. D’Andrea et al. (2013) showed            may not condense in the absence of a base at lower RHs.
that adding ELVOC material can increase N80 by increas-            Hence, the global annual MSA mass is nearly double in these
ing growth of ultrafine particles, but also can suppress N3        cases compared to when using the parameterization (Table 2;
through the same coagulation/nucleation feedbacks. This            Fig. 2). The addition of MSA in the ELVOC_NoNuc case
combination of ammonia-rich and ammonia-poor regions led           allows for an increase in condensable material that con-
to MSA giving an overall weak increase in N80 with a large         denses to the Fuchs-corrected surface area through ELVOC-
suppression of N3 in some regions. We note that these results      like condensation, which increases the growth rate of all
are somewhat sensitive to the simulated ammonia concentra-         particle sizes. Conversely, MSA in SVOC_NoNuc allows
tions and may be sensitive to the ammonia cutoff of 10 ppt         for an increase in SVOC-like material that will condense
in the MSA-volatility parameterization. As there are already       preferentially to larger particles through SVOC-like con-
uncertainties in many other dimensions, we do not attempt          densation (but still irreversible condensation). In both the
to quantify the sensitivity of MSA towards ammonia in this         ELVOC_NoNuc and SVOC_NoNuc cases, N3 concentra-
work.                                                              tions are reduced due to increased coagulational losses and
                                                                   decreased nucleation rates because of the added MSA mass

www.atmos-chem-phys.net/19/3137/2019/                                               Atmos. Chem. Phys., 19, 3137–3160, 2019
3148 A. L. Hodshire et al.: The potential role of methanesulfonic acid (MSA) in aerosol formation Figure 4. Global annual mean change in W m−2 for the aerosol indirect effect (cloud-albedo AIE, denoted as “AIE”; first column) and the direct radiative effect (DRE; second column) between DEFAULT_NoMSA and PARAM_NoNuc (first row), ELVOC_NoNuc (second row), SVOC_Nuc (third row), PARAM_Nuc (fourth row), and ELVOC_Nuc (fifth row) (warm colors indicate an increase in the AIE/DRE as compared to DEFAULT_NoMSA). (D’Andrea et al., 2013). When MSA condensation is treated pacted by the addition of MSA. The slight boost in N80 for as ELVOC-like, the smaller particles grow more quickly SVOC_NoNuc in the tropical upper troposphere (UT) is due into the larger sizes, so N80 increases by 9.1 % globally to the very low accumulation-mode concentration in this re- and by 22.2 % between 30 and 90◦ S at 900 hPa (Fig. 6 gion: the SVOC material condenses to ultrafine particles in and Table S3). When MSA condensation is instead treated this region. as SVOC-like, the largest particles uptake MSA preferen- The changes in DRE and cloud-albedo AIE resulting from tially to smaller particles, and the N80 are not greatly im- the addition of MSA for these three no-MSA-nucleation Atmos. Chem. Phys., 19, 3137–3160, 2019 www.atmos-chem-phys.net/19/3137/2019/
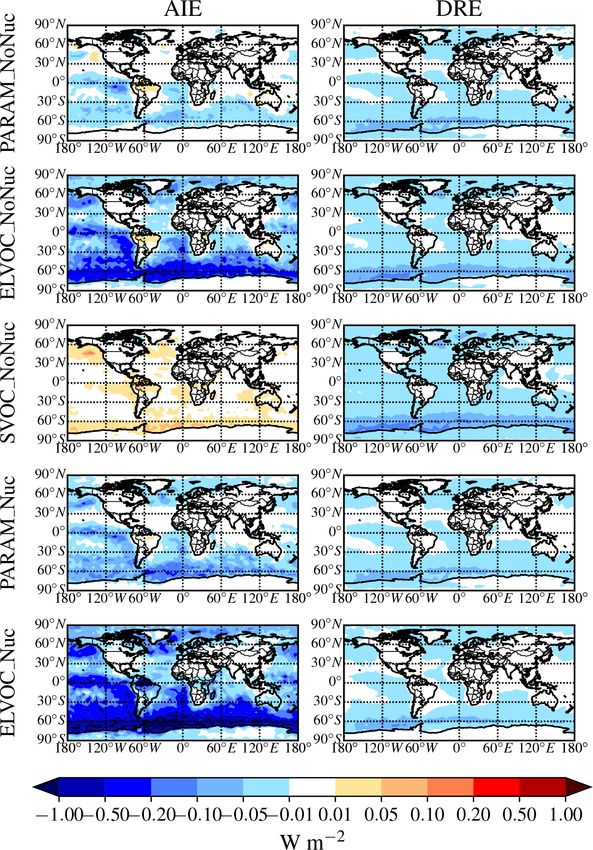
A. L. Hodshire et al.: The potential role of methanesulfonic acid (MSA) in aerosol formation                                 3149

cases (Fig. 4, top three rows) depend roughly on the changes    tial contribution of MSA towards nucleation (at least for the
in N80 (the activation diameter for determining CDNC will       nucleation schemes tested here). Figures 2, 3, and 4 (fourth
depend on local particle hygroscopicity and concentrations).    rows) show the global annual mean percent changes between
The DRE generally scales linearly with aerosol mass (Fig. 2,    DEFAULT_NoMSA and PARAM_Nuc. MSA will have the
top three rows). As MSA is assumed to have the same prop-       same effective volatility as discussed for PARAM_NoNuc
erties as sulfate, which is assumed to be purely scatter-       (Sect. 3.1), but will now participate in nucleation under
ing, any increases in MSA mass result in a negative radia-      ELVOC-like regimes. For PARAM_Nuc, we can clearly see
tive effect. However, the DRE also depends on aerosol size;     that when the ammonia concentrations reach above 10 ppt
the scattering efficiency peaks between ∼ 300 and 900 nm,       in the SH winter months over the Southern Ocean (Fig. S4),
depending upon the aerosol composition and shape (Se-           MSA acts as an ELVOC-like species and contributes strongly
infeld and Pandis, 2016, their Fig. 15.8). The change in        to nucleation in these sulfuric-acid-poor regions. The addi-
DRE when MSA is included using the volatility parame-           tion of MSA in ELVOC_Nuc has the largest impact on N3,
terization (PARAM_NoNuc) is less negative than that of          N80, and the cloud-albedo AIE of any of our cases, with an
ELVOC_NoNuc and SVOC_NoNuc at −15 mW m−2 glob-                  increase in N3 of 153.4 % globally (397.7 % between 30 and
ally (−26 mW m−2 between 30 and 90◦ S), because the pa-         90◦ S), an increase in N80 of 23.8 % globally (56.3 % be-
rameterization yielded a smaller mass increase than the ideal   tween 30 and 90◦ S), and a decrease for the cloud-albedo
volatility simulations. ELVOC_NoNuc and SVOC_NoNuc              AIE of −0.18 W m−2 globally (−0.39 W m−2 between 30
have almost identical changes in submicron aerosol mass         and 90◦ S). MSA in PARAM_Nuc also has a large increase
(Fig. 6; Table S3), but the DRE is −25 mW m−2 globally          in N3 (112.5 % globally and 309.9 % between 30 and 90◦ S
(−44 mW m−2 between 30 and 90◦ S) for SVOC_NoNuc                at 900 hPa), but only increases N80 by 2.1 % globally (4.4 %
and −0.02 W m−2 globally (−34 mW m−2 between 30 and             between 30 and 90◦ S), again indicating that MSA often un-
90◦ S) for ELVOC_NoNuc (Fig. 6; Table S3). MSA will pref-       dergoes SVOC-like or ELVOC-like condensation within the
erentially condense to larger aerosol when its condensation     volatility parameterization.
is SVOC-like, and so even though ELVOC_NoNuc shows a               The increase in N80 from MSA in PARAM_Nuc is about
larger increase in N80, SVOC_NoNuc increases the fraction       double that of the increase from MSA in PARAM_NoNuc,
of particulate mass in the peak scattering efficiency regime.   and the change in cloud-albedo AIE is similarly slightly dou-
   The cloud-albedo AIE instead scales the aerosol num-         ble for PARAM_Nuc. The global annual changes in sub-
ber concentration of particles large enough to act as CCN:      micron mass and the DRE are quite similar between the
PARAM_NoNuc’s cloud-albedo AIE (−8.6 mW m−2 glob-               two PARAM cases. However, N80 increases more over the
ally, −17 mW m−2 between 30 and 90◦ S) reflects the small       Northern Hemisphere (NH) high-latitude ocean regions for
increase in N80 (0.8 % globally and 1.7 % between 30 and        PARAM_Nuc than for PARAM_NoNuc, and as a result,
90◦ S at 900 hPa) (Fig. 6; Table S3). The larger increase in    the northern oceans experience a stronger regional negative
N80 for ELVOC_NoNuc results in the larger cooling ten-          cloud-albedo AIE when MSA is allowed to participate in nu-
dency in the cloud-albedo AIE, at −0.075 W m−2 globally         cleation. As noted in Sect. 3.1, there are uncertainties from
(−150 mW m−2 between 30 and 90◦ S), and the slight de-          the ammonia concentrations and cutoff point of 10 ppt for
crease in N80 for SVOC_NoNuc results in the slight warm-        PARAM_Nuc, but we will not attempt to quantify them here.
ing tendency in cloud-albedo AIE at 7.5 mW m−2 globally            These results indicate that if MSA does participate in nu-
(11 mW m−2 between 30 and 90◦ S) (Fig. 6; Table S3).            cleation, the largest climate-relevant change is anticipated to
   These annual results show in Fig. 6 and Table S3 that if     be an increased cooling tendency for the cloud-albedo AIE
MSA does not take part in nucleation, the submicron aerosol     as compared to if MSA does not participate in nucleation.
mass will increase, causing a cooling tendency in the DRE,      The change in DRE will be similar though, as MSA mass is
and N3 will decrease regardless of the volatility assumed.      not predicted to significantly change between non-nucleating
However, the changes in N80 are sensitive to the volatility     and nucleating cases. This study provides an upper bound on
assumption and will only increase if MSA condensation is        the contribution of MSA to nucleation: if MSA is less effi-
ELVOC-like at least over some spatial and temporal scales,      cient at nucleating than sulfuric acid, it is present in relatively
thereby causing a further cooling tendency in the cloud-        sulfuric-acid poor regions and would still be able to increase
albedo AIE.                                                     N3 concentrations (although possible by less than predicted
                                                                here). Microphysical feedbacks (increased condensation and
3.2   Volatility-dependent impact of MSA if MSA does            coagulation sinks from increased N80) will then limit the ef-
      participate in nucleation                                 fect that small changes in N3 can have on N80 and radiative
                                                                effects.
To test the potential influence on aerosol size distributions
if MSA contributes to nucleation, we allow MSA to partici-
pate in binary and ternary nucleation with the same efficacy
as sulfuric acid. This provides an upper bound in the poten-

www.atmos-chem-phys.net/19/3137/2019/                                             Atmos. Chem. Phys., 19, 3137–3160, 2019
You can also read