Performance of MAR (v3.11) in simulating the drifting-snow climate and surface mass balance of Adélie Land, East Antarctica
←
→
Page content transcription
If your browser does not render page correctly, please read the page content below
Geosci. Model Dev., 14, 3487–3510, 2021
https://doi.org/10.5194/gmd-14-3487-2021
© Author(s) 2021. This work is distributed under
the Creative Commons Attribution 4.0 License.

Performance of MAR (v3.11) in simulating the drifting-snow climate
and surface mass balance of Adélie Land, East Antarctica
Charles Amory1,2 , Christoph Kittel1 , Louis Le Toumelin2,3 , Cécile Agosta4 , Alison Delhasse1 , Vincent Favier2 , and
Xavier Fettweis1
1 Department  of Geography, UR SPHERES, University of Liège, Liège, Belgium
2 Univ. Grenoble Alpes, CNRS, Institut des Géosciences de l’Environnement, Grenoble, France
3 Univ. Grenoble Alpes, Université de Toulouse, Météo-France, CNRS, CNRM,

Centre d’Études de la Neige, Grenoble, France
4 Laboratoire des Sciences du Climat et de l’Environnement, LSCE-IPSL, CEA-CNRS-UVSQ,

Université Paris-Saclay, Gif-sur-Yvette, France

Correspondence: Charles Amory (charles.amory@univ-grenoble-alpes.fr)

Received: 3 November 2020 – Discussion started: 16 December 2020
Revised: 31 March 2021 – Accepted: 23 April 2021 – Published: 9 June 2021

Abstract. Drifting snow, or the wind-driven transport of          1   Introduction
snow particles originating from clouds and the surface be-
low and above 2 m above ground and their concurrent subli-        A significant portion of the surface area of Antarctica is
mation, is a poorly documented process on the Antarctic ice       affected by wind-driven ablation or accumulation. The net
sheet, which is inherently lacking in most climate models.        snow accumulation at the ice sheet surface, i.e. the surface
Since drifting snow mostly results from erosion of surface        mass balance (SMB), is the resultant of mass gains (precip-
particles, a comprehensive evaluation of this process in cli-     itation and riming), mass losses (water runoff and surface
mate models requires a concurrent assessment of simulated         sublimation), and wind-driven snow transport which can ei-
drifting-snow transport and the surface mass balance (SMB).       ther result in mass gain (deposition) or loss (erosion). The
In this paper a new version of the drifting-snow scheme cur-      snow mass sublimated during transport by the wind is lost by
rently embedded in the regional climate model MAR (v3.11)         the ice sheet surface to the atmosphere when particles origi-
is extensively described. Several important modifications rel-    nate from the surface. Although wind-driven snow sublima-
ative to previous version have been implemented and include       tion has most often been described as an independent term
notably a parameterization for drifting-snow compaction of        in the SMB equation (e.g. van de Berg et al., 2006; Lenaerts
the uppermost snowpack layer, differentiated snow density         et al., 2019), its contribution to surface mass loss is inherently
at deposition between precipitation and drifting snow, and a      included in the spatially integrated erosion–deposition bal-
rewrite of the threshold friction velocity above which snow       ance. Drifting and blowing snow are usually conventionally
erosion initiates. Model results at high resolution (10 km)       distinguished as the wind-driven transport of snow particles
over Adélie Land, East Antarctica, for the period 2004–2018       respectively below and above a height of 2 m above ground.
are presented and evaluated against available near-surface        In this study both processes are combined into the single de-
meteorological observations at half-hourly resolution and an-     nomination of drifting snow for convenience, and erosion,
nual SMB estimates. The evaluation demonstrates that MAR          deposition, horizontal and vertical transport of wind-driven
resolves the local drifting-snow frequency and transport up to    cloud (i.e. that have not yet reach the surface) and eroded
the scale of the drifting-snow event and captures the resulting   (raised from the surface) snow particles and their concurrent
observed climate and SMB variability, suggesting that this        sublimation are all referred to as drifting-snow processes.
model version can be used for continent-wide applications.           The net erosion–deposition balance in areas subject to
                                                                  drifting snow is mainly governed by the interactions between
                                                                  the complex ice surface topography, near-surface flow and

Published by Copernicus Publications on behalf of the European Geosciences Union.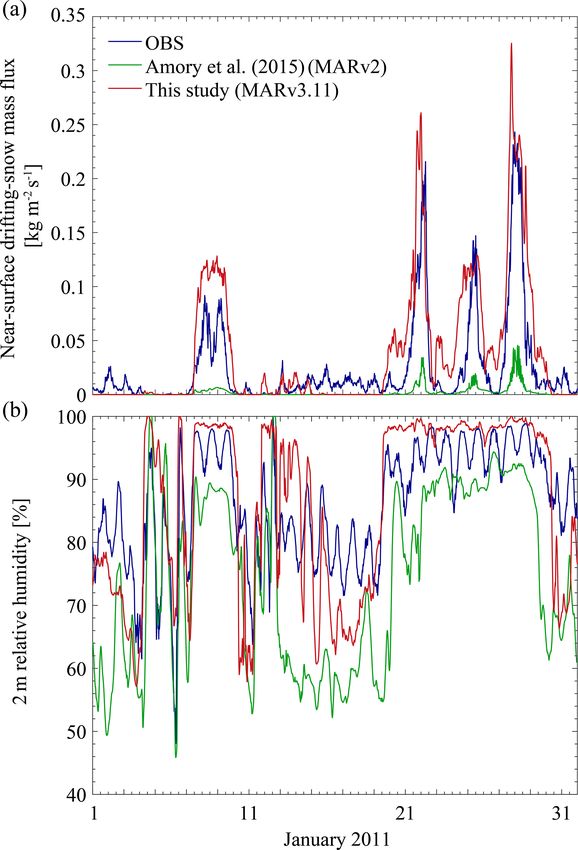
3488                                      C. Amory et al.: Performance of MAR in simulating drifting snow in Adélie Land

surface snowpack state. Katabatic winds flowing over the            to the development of parameterization schemes for large-
surface of the Antarctic ice sheet accelerate down steep sur-       scale applications and currently hinders quantitative eval-
face slopes, causing erosion when the wind shear stress is          uations of contrasting, continent-wide model estimates of
high enough to dislodge particles from the surface. Wind            drifting-snow mass and sublimation fluxes in Antarctica (see
redistribution of snow occurs more generally on every spa-          Lenaerts and van den Broeke, 2012; Palm et al., 2017; van
tial scale at which topographic features generate acceleration      Wessem et al., 2018; Agosta et al., 2019). Numerical chal-
or deceleration of the near-surface flow, enhancing or reduc-       lenges associated with modelling drifting snow at the re-
ing local SMB gradients up to sub-kilometre scales (Agosta          gional scale also arise from the numerous interactions of
et al., 2012; Dattler et al., 2019; Kausch et al., 2020) and oc-    drifting-snow particles with the atmosphere and the snow
casionally forming extensive areas of near-zero to negative         surface organized in a complex system of positive and nega-
SMB in windy and dry interior regions of the ice sheet (Bin-        tive feedback mechanisms. The difficulty involved in captur-
tanja, 1999; Scambos et al., 2012). From a modelling per-           ing the resulting strong non-linearity of drifting-snow pro-
spective, this means that drifting-snow processes vary as a         cesses depends on the representation and number of feed-
function of the horizontal resolution (Lenaerts et al., 2012b).     backs accounted for (Gallée et al., 2013) and is mirrored
This is of particular importance for resolving the spatial          through a high sensitivity of model results to parameter
variability in SMB at the ice sheet margins where drifting-         choices and significant discrepancies between simulated and
snow processes can be major components of the local SMB             observed snow mass fluxes (Lenaerts et al., 2014; Amory
(King et al., 2004; Gallée et al., 2005; Frezzotti et al., 2007;    et al., 2015; van Wessem et al., 2018).
Lenaerts and van den Broeke, 2012), resulting in the trans-            The polar-oriented regional climate model MAR includes
port and sublimation of large volumes of snow and/or their          a drifting-snow scheme initially developed to improve the
export off the continent boundaries (Scarchilli et al., 2010;       representation of the Antarctic SMB (Gallée et al., 2001).
Palm et al., 2017).                                                 However, the drifting-snow scheme has only been used so far
   As drifting snow triggers interactions between the atmo-         to study separately wind-driven ablation (Gallée, 1998; Gal-
sphere and the ice sheet surface, a comprehensive evaluation        lée et al., 2001, 2005) and individual drifting-snow events
of drifting-snow processes using snow-transport models re-          (Gallée et al., 2013; Amory et al., 2015) in coastal East
quires consistency between model results and observations           Antarctica. Unpublished preliminary experiments with for-
for both mass transport and net accumulation rates simulta-         mer physical parameterizations of drifting snow in MAR did
neously. The much larger availability of SMB observations           not lead to a continent-wide agreement between model sim-
compared to drifting-snow measurements in Antarctica and            ulations and both drifting-snow and SMB observations. As a
the wider applications of modelled SMB products have led            result, drifting snow has been kept disabled in recent decade-
model development and evaluation exercises to focus primar-         long investigations of the SMB of the Greenland (e.g. Fet-
ily on the representation of the SMB, with a secondary or           tweis et al., 2017, 2020) and Antarctic (e.g. Kittel et al.,
most often non-existent consideration for drifting-snow pro-        2018, 2021; Agosta et al., 2019) ice sheets with MAR, de-
cesses (Lenaerts et al., 2019; Mottram et al., 2020). SMB           spite the potentially missing aspects related to the important
and drifting-snow transport, however, are not independent           feedback mechanisms induced by drifting snow.
variables. Arbitrary adjustments of model parameters favour-           In this paper a modified version of the original drifting-
ing one can be made at the expense of the other (e.g. van           snow scheme implemented in MAR is assessed through a
Wessem et al., 2018). Similarly, neglecting or underestimat-        concurrent evaluation of the drifting-snow climate and SMB
ing drifting-snow processes induces a smoothing of the mod-         reproduced by the model against a multi-year database of
elled SMB gradients across areas of complex topography              drifting-snow mass fluxes and SMB estimates. The evalua-
(Agosta et al., 2019) and can ultimately lead to overestima-        tion focuses on the marginal slopes of Adélie Land, a kata-
tion of the snow mass input in regionally integrated SMB cal-       batic wind region of East Antarctica which experiences drift-
culations (Frezzotti et al., 2004; Das et al., 2013). It is worth   ing snow frequently (Amory, 2020a) and where the SMB ex-
mentioning that the need to explicitly describe drifting-snow       hibits a high spatial variability related to drifting-snow pro-
processes also increases with the general tendency towards          cesses (Agosta et al., 2012). The coupled atmospheric and
higher horizontal resolution of the atmospheric models used         snowpack components of MAR are presented in Sect. 2. The
to study the Antarctic SMB.                                         drifting-snow scheme is described in Sect. 3 together with the
   Measurements of drifting-snow mass fluxes are particu-           new developments and main changes relative to the original
larly interesting for evaluating snow-transport models since        version. Section 4 provides information on the study area, the
they constitute the integrated result of all the feedback and       available data and the evaluation strategy. The modelled near-
dynamical mechanisms (i.e. precipitation, local erosion, hor-       surface climate, drifting-snow frequency, mass transport and
izontal advection from upwind areas and sublimation) that           SMB are evaluated in Sect. 5. The sensitivity to the model
contribute to the presence, amount and residence time of            version and input parameters of the drifting-snow scheme are
snow particles in the air. The general scarcity in drifting-        discussed in Sect. 6 before concluding the paper.
snow measurements in polar regions is however a constraint

Geosci. Model Dev., 14, 3487–3510, 2021                                             https://doi.org/10.5194/gmd-14-3487-2021
C. Amory et al.: Performance of MAR in simulating drifting snow in Adélie Land                                              3489

2     Model descriptions                                          matically manages the stratification of the snowpack due to
                                                                  precipitation, erosion–deposition of snow, mechanical com-
2.1    Atmospheric model                                          paction, and thermal and melting/refreezing metamorphism,
                                                                  enabling a dynamical evolution of the physical character-
MAR is a hydrostatic atmospheric model originally devel-          istics (temperature, density, water content, grain shape and
oped to simulate the climate over high-latitude regions. The      size) of the different layers over time. If precipitation or de-
atmospheric dynamics in MAR are described in Gallée and           position occurs when the snowpack already comprises the
Schayes (1994). Cloud microphysical processes and result-         maximum number of layers, the formation of a new layer at
ing precipitation are simulated by solving conservation equa-     the surface is achieved through aggregation of internal sub-
tions for specific humidity, cloud droplets and ice crys-         surface layers. More generally, aggregation of adjacent layers
tals, raindrops, and snow particles (Gallée, 1995; Gallée         is permitted according to the similarity of their physical prop-
et al., 2001). The radiative transfer through the atmosphere      erties. Thick layers can also be split to refine the discretiza-
is adapted from Morcrette (2002), and cloud radiative prop-       tion of the snowpack when the number of layers is lower than
erties are computed from the concentration of cloud droplets      10. Maximum layer thicknesses of the four uppermost lay-
and cloud ice crystals. Turbulence is resolved in the surface     ers of the snowpack are also prescribed (0.02, 0.05, 0.1 and
layer following the Monin–Obukhov similarity theory and           0.3 m) to ensure a fine discretization adapted to the descrip-
above the surface layer using a local closure scheme adapted      tion of sub-surface processes such as heat exchange with the
to the stable boundary layer (Gallée et al., 2015).               surface and diffusion within the snowpack. Mass and heat are
   In this study MAR version 3.11 in its Antarctic setup          conserved along the snowpack stratification procedure. The
(Agosta et al., 2019) is used with the updates described in       snowpack was uniformly initialized with snow grain shape
Kittel et al. (2021), simply referred to as MAR hereafter. The    parameters of fresh snow (see Sect. 3.3 for definition) and a
simulations are performed on a grid of 80 × 80 cells at 10 km     density of 500 kg m−3 assuming a null liquid water content.
horizontal resolution to reduce computational cost and facil-     The initial surface snowpack temperature is set to the reanal-
itate development and sensitivity experiments. The time step      ysis near-surface air temperature and then discretized along
is set to 60 s, for a computational cost of 72 CPU hours per      a predefined layer thickness profile as a function of distance
year of simulation in the chosen configuration. The topog-        to the surface to determine the temperature of internal snow-
raphy is obtained through aggregation of the 1 km Bedmap2         pack layers. The model was then run from 1994 so that the
surface elevation dataset (Fretwell et al., 2013). The model is   snowpack had reached equilibrium with the climate preced-
driven at its lateral boundaries (pressure, wind speed, temper-   ing the period of interest (2004–2018) after a spin-up time of
ature, specific humidity), at the top of the troposphere (tem-    10 years.
perature, wind speed) and at the ocean surface (sea ice con-
centration, sea surface temperature) by 6-hourly ERA5 re-
analysis fields (Hersbach et al., 2020). The atmosphere is de-    3     Drifting-snow scheme
scribed on a stretched grid with 24 vertical terrain-following
levels, of which 8 and 5 are respectively located in the lowest   This section describes the drifting-snow physics currently
100 and 20 m of the atmosphere with a lowest level at 2 m.        implemented in MAR. Details on the computation of the
The model is relaxed towards the forcing solutions of wind        threshold friction velocity for snow erosion, snow-transport
speed and temperature from the top of the troposphere (i.e.       modes, interactions of drifting snow with the atmosphere and
above 10 km) to the uppermost atmospheric level following         the surface, and then snow erosion and surface roughness
van de Berg and Medley (2016).                                    are successively provided in the following subsections. A
                                                                  schematic diagram (Fig. 1) provides a general overview of
2.2    Snowpack model                                             the drifting-snow scheme.

The atmospheric part of MAR is coupled with the one-              3.1    Threshold friction velocity for initiation of snow
dimensional multi-layer surface model SISVAT (Soil Ice                   erosion
Snow Vegetation Atmosphere Transfer), which handles en-
ergy and mass transfer between the surface and the at-            Erosion of snow is usually considered to initiate when the
mospheric boundary layer (De Ridder and Gallée, 1998).            shear stress exerted by the flow at the surface (determined
SISVAT includes a representation of snow (Gallée and              by the friction velocity u∗ in m s−1 ) exceeds the threshold
Duynkerke, 1997; Gallée et al., 2001) and ice (Lefebre et al.,    value for aerodynamic entrainment, i.e. the threshold friction
2003) layers and comprises subroutines for snow metamor-          velocity u∗t (in m s−1 ) determined by the resistive gravita-
phism, surface albedo, meltwater percolation, retention and       tional and cohesive forces. Resistive forces depend on tem-
refreezing. In the present study, 30 snow/ice layers are used     perature (Schmidt, 1980) and metamorphism history (Gallée
to describe the snowpack with a fixed total resolved snow-        et al., 2001) of the snow surface and involve various snow
pack of 20 m in thickness. An aggregation scheme auto-            particle characteristics such as inter-particle cohesion, den-

https://doi.org/10.5194/gmd-14-3487-2021                                            Geosci. Model Dev., 14, 3487–3510, 2021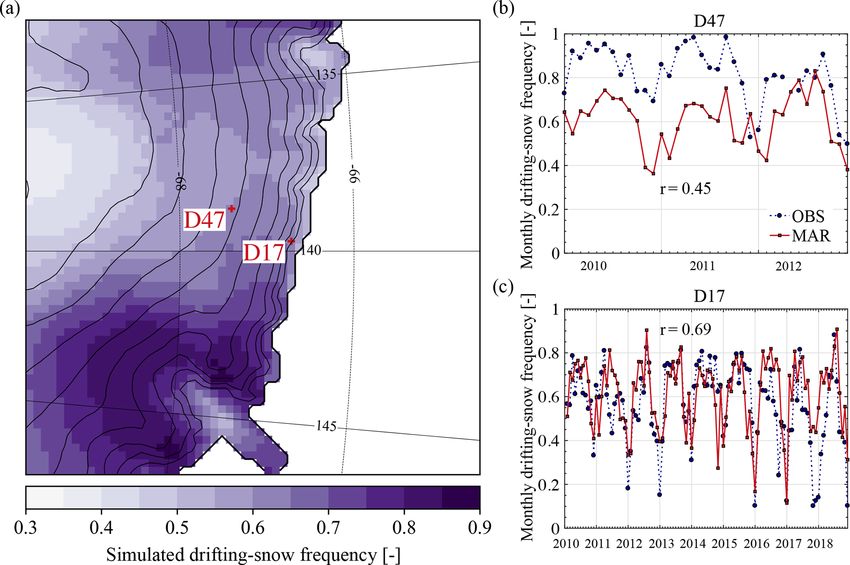
3490                                       C. Amory et al.: Performance of MAR in simulating drifting snow in Adélie Land

Figure 1. Schematic illustration of the drifting-snow scheme in MAR. Model variables are marked in bold black. The blue arrows denote
mass and energy exchanges and drifting-snow processes are indicated in blue. The different computation steps listed in Sect. 3.5 are reported
in red.

sity, grain shape and size. It follows that an accurate prognos-         ratio of rounded to angular shapes in the snow layer. In previ-
tic of u∗t requires a detailed representation of these charac-           ous studies involving drifting-snow applications with MAR,
teristics, which are particularly undocumented in Antarctica             iER was defined as a function of surface snow characteristics
and for which measurements are generally very limited in the             (d, s and grain size). To reduce the number of sensitivity pa-
literature. As an alternative, density has often been proposed           rameters, as in Lenaerts et al. (2012a), u∗t is assumed to be
as a governing factor in parameterizations of u∗t (e.g. Liston           independent of particle size, and constant snow grain shape
et al., 2007; Lenaerts et al., 2012a). The same approach is              parameters are assigned (d = s = 0.5), implying an erodibil-
followed here; erosion in the model occurs when u∗ > u∗t ,               ity index of 0.625 and a minimum u∗t value of 0.3 m s−1 for
where u∗t is imposed by the uppermost snow layer density:                ρs of 300 kg m−3 . Additional criteria for snow erosion re-
                                                                       quire that ρs does not exceed ρmax = 450 kg m−3 and that no
                  ρi    ρi                                               wet layer has formed at the top of the snowpack. The sensi-
u∗t = u∗t0 exp       −       ,                               (1)
                 ρ0 ρs                                                   tivity to the formulation of u∗t is quantified and discussed in
                                                                         Sect. 6.2.
in which ρs is the surface snow density (kg m−3 ), ρi is the
density of ice (920 kg m−3 ) and ρ0 is the density of fresh
snow (set to 300 kg m−3 ). The expression for u∗t0 is retained           3.2   Snow-transport modes
from Gallée et al. (2001):
                                                                         Particle motions in drifting snow are generally described
       log(2.868) − log(1 + iER ) 0.5                                    through the two main transport modes consisting in salta-
u∗t0 =                           CD ,                           (2)
                0.085                                                    tion and turbulent suspension. Once the resistive forces have
iER = 0.75d − 0.5s + 0.5,                                       (3)      been overcome by the atmospheric drag force, erosion initi-
                                                                         ates through the saltation process, in which particles become
       u2∗
CD =       ,                                                    (4)      mobile and periodically bounce on the surface within heights
       U2                                                                of the order of 10 cm. Turbulent suspension of snow occurs
where iER is an erodibility index describing the potential for           when snow particles obtain sufficient upward momentum to
snow erosion, d (dendricity) and s (sphericity) are the snow             be entrained in the atmosphere by turbulent eddies from the
grain shape parameters, CD is the drag coefficient for mo-               top of the saltation layer without contact with the surface.
mentum, U is the wind speed at the lowest prognostic level                  The drifting-snow scheme of MAR uses a set of semi-
of the model (m s−1 ), and u∗ is classically obtained through            empirical formulations to predict the contribution of erosion
integration of stability correction functions for momentum               to the airborne snow mass. In the model the particle ratio
over the atmospheric boundary layer. Dendricity represents               in the saltation layer qsalt (kg kg−1 ; mass of saltating snow
the remaining initial geometry of fresh snow particles and               particles per unit mass of atmosphere) is parameterized as a
varies from 0 to 1 with high values of d describing fresh snow           function of the excess of shear stress responsible for removal
layers. Sphericity varies equally from 0 to 1 and defines the            of snow particles from the surface following the expression

Geosci. Model Dev., 14, 3487–3510, 2021                                                    https://doi.org/10.5194/gmd-14-3487-2021
C. Amory et al.: Performance of MAR in simulating drifting snow in Adélie Land                                                3491

of Pomeroy (1989):                                                 overestimation of the settling velocity of drifting-snow par-
         esalt  2                                                ticles (Gallée et al., 2005). Following Bintanja (2000a), ζ is
qsalt =         u∗ − u2∗t ,                                 (5)    set to 3.
        ghsalt
with esalt = 1/(3.25u∗ ) the saltation efficiency expressed as     3.3   Interactions with the atmosphere
a dimensionless coefficient inversely proportional to the fric-
tion velocity, g = 9.81 the gravitational acceleration (m s−2 )    Eroded snow is transmitted to the atmosphere by the surface
and hsalt = 0.08436u1.27    the thickness of the saltation layer   scheme and added to the pre-existing airborne snow mass
                       ∗
(m) as proposed by Pomeroy and Male (1992). Note that              without distinguishing the source of particles. Thermody-
saltation is not explicitly resolved by the model, and qsalt ,     namic interactions of airborne snow particles with the atmo-
considered constant throughout the saltation layer, only           sphere are handled by the cloud microphysical scheme. The
serves as a lower boundary condition for the suspension            increase in air density due to the presence of snow particles
layer.                                                             is taken into account by modifying the formulation of vir-
   The formulation of qsalt is given for stationary conditions.    tual potential temperature (Gallée et al., 2001). Sublimation
Although the non-linear relationship between the flow and          of snow particles occurs along their residence into the atmo-
snow mass flux can induce fluctuations in particle concen-         sphere and is parameterized as a function of the snow particle
tration in non-stationary-conditions (Aksamit and Pomeroy,         ratio and undersaturation of air (Lin et al., 1983). In partic-
2018), numerical simulations suggest that steady-state salta-      ular, the model assumes an exponential size distribution of
tion is achieved within an interval of a few seconds (Nemoto       suspended (cloud and eroded) snow particles (Gallée, 1995):
and Nishimura, 2004; Huang et al., 2016), which is well be-        ns = n0 exp (−λs Ds ) ,                                      (7)
low the model time step of 60 s. With wind speeds at the
surface typically reaching 10 m s−1 during drifting-snow oc-       with ns the number of snow particles of diameter Ds
currences (Fig. S3 in the Supplement), this corresponds to         (10−3 m) per unit volume, n0 an empirical constant that cor-
characteristic lengths of a few tens of metres, i.e. 3 orders      responds to the intercept parameter of the size distribution
of magnitude lower than the horizontal resolution of 10 km         (m−4 ) and λs the (dimensionless) dispersion parameter:
used in this study, indicating that a formulation of a station-                 1
                                                                          π ρp n0 4
ary particle ratio remains appropriate in this context.            λs =              ,                                      (8)
   Snow transport in turbulent suspension is computed by                   ρa qs
the three-dimensional turbulence and advection schemes of          where ρp is the snow particle density (set to 100 kg m−3 ) and
MAR, enabling a discretization of snow transport profiles          ρa is the air density (kg m−3 ). Snow particles are considered
along the vertical grid of the model. The suspension layer         as graupel-like snow of hexagonal type, and the spectrally av-
receives contributions from both cloud and eroded particles        eraged snow particle diameter Ds is prescribed as a constant
advected from overlying and upwind grid cells (top and lat-        following Locatelli and Hobbs (1974). The latent heat con-
eral influx). Snow particles are suspended in the first model      sumption and humidity release caused by atmospheric subli-
level through diffusion from the saltation layer (bottom in-       mation are directly accounted for in the energy and mass bud-
flux). The mass actually removed from the surface then cor-        get of each atmospheric layer in which sublimation occurs.
responds to the upward mass exchange between the saltation         This ensures that the model captures (i) the negative feed-
and the suspension layers and is expressed by the surface tur-     back of sublimation through the increase in relative humidity
bulent flux of snow particles u∗ qs∗ (m s−1 kg kg−1 ) assuming     of the air, (ii) advective transport of humidity, and (iii) the
that it follows a bulk flux formulation:                           sublimation-induced cooling increasing air density and in-
u∗ qs∗ = CD U ζ (qs − qsalt ) ,                             (6)    hibiting upward turbulent motions (Bintanja, 2001). Weak-
                                                                   ening of drifting snow in response to decreasing u∗ as tur-
where qs∗ is the turbulent scale for snow particles  (kg kg−1 ),   bulence declines is reflected through the dependency of the
ζ is the ratio of eddy diffusivities for suspended particles       surface snow turbulent flux u∗ qs∗ on the difference u2∗ − u2∗t .
and momentum, and qs is the snow particle ratio (kg kg−1 )            Not distinguishing the origin of particles despite differ-
taken at the lowest model level. Because of fragmentation          ences in shape and size between cloud and eroded snow par-
upon repeated collision between each other and with the            ticles (Nishimura and Nemoto, 2005) can affect the estima-
snow surface, drifting-snow particles have smaller radius and      tion of sublimation according to the predominance of one
thus have smaller settling velocities than snow particles that     type of particles over the other in the actual airborne snow
have not yet experienced contact with the surface (Bintanja,       mass. Overestimation of atmospheric sublimation rates by
2000a). As MAR currently does not distinguish snow parti-          the model within drifting-snow layers actually mainly con-
cles originating from the surface from those directly formed       sisting of eroded particles can thus be expected, which would
by its cloud microphysics, the factor ζ was introduced in the      be however partially counterbalanced by the enhanced nega-
original formulation of Gallée et al. (2001) to enhance the up-    tive feedback of sublimation and all the less pronounced as
ward turbulent particle transport and compensate for a likely      the relative contribution of cloud particles prevails.

https://doi.org/10.5194/gmd-14-3487-2021                                             Geosci. Model Dev., 14, 3487–3510, 2021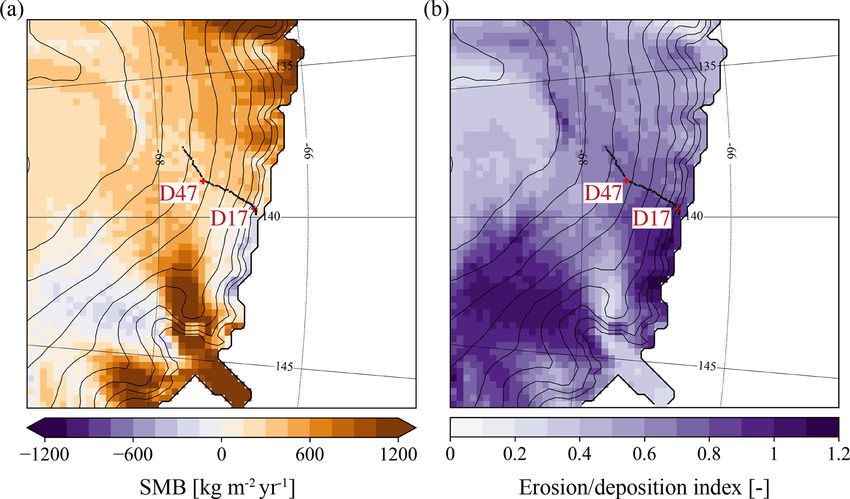
3492                                     C. Amory et al.: Performance of MAR in simulating drifting snow in Adélie Land

   Airborne snow particles interact with the radiative transfer    and to be fully rounded (d = 0 and s = 1), although numer-
through the atmosphere and affect the surface energy budget        ical simulations suggest the coexistence of various particle
by modulating downwelling irradiance, similarly to optically       shapes during fully developed drifting snow (Huang et al.,
thin, low-level clouds (Yamanouchi and Kawaguchi, 1984;            2011). Drifting snow is deposited with a density ρDR as-
Mahesh et al., 2003; Le Toumelin et al., 2020). The represen-      sumed to be that of the current surface layer, with the restric-
tation of the radiative contribution of drifting-snow clouds is    tion that ρDR does not exceed ρmax to account for maximum
achieved in the model by including the snow particle ratio         surface snow density values observed in Antarctica (Agosta
qs in the computation of cloud optical depth and emissivity        et al., 2019) and enable the deposition of snow over more
(Gallée and Gorodetskaya, 2010).                                   compacted snow and/or ice surfaces. The surface density ρs
                                                                   is updated according to a relative contribution of both types
3.4    Interactions with the surface                               of particles

Alteration of surface characteristics through erosion–             ρs = ρ0 (1 − fDR ) + ρDR fDR ,                              (9)
deposition of snow influences in turn the occurrence of drift-                qs,zlim
                                                                   fDR = 1 −          ,                                       (10)
ing snow through various feedback mechanisms. Snow de-                          qs
posited at the surface during drifting snow is subject to the
combined actions of wind and saltation, which break original       where fDR is the drifting-snow fraction varying between 0
crystal shapes and favour the formation of smaller, rounded        and 1, and qs,zlim is the snow particle ratio at the atmospheric
snow grains (Sato et al., 2008), leading to enhanced sinter-       level closest to zlim (m), where the contribution of eroded
ing, more efficient mechanical packing and increased den-          particles to the mass ratio is assumed to be negligible com-
sity (Vionnet et al., 2013; Sommer et al., 2018). Drifting-        pared to the contribution of snowfall. A value of 100 m above
snow compaction, together with the exposure of denser snow         surface has been adopted for zlim in accordance with the aver-
or ice layers through erosion and/or sublimation, naturally        age depth of drifting-snow layers over Antarctica as retrieved
contributes to reduce the likelihood of additional drifting        from remote sensing techniques (Mahesh et al., 2003; Gos-
snow. The erosion–deposition process also influences the           sart et al., 2017; Palm et al., 2018). Snowfall conditions im-
surface energy budget by modifying the surface albedo,             ply qs,zlim ∼ qs and low values of fDR , and snow is deposited
which largely determines the energy available for melting.         at the surface with a predominant contribution of ρ0 . Con-
Surface melting reduces or even inhibits the potential for ero-    versely, drift conditions imply qs,zlim  qs and high values
sion in summer by increasing water content, density and co-        of fDR , and ρs tends towards ρDR .
hesion (Li and Pomeroy, 1997). Capturing these effects is             The post-depositional increase in snow density through
thus of particular significance to account for temporal vari-      wind hardening is accounted for in the model by increasing
ations in drifting-snow frequency over peripheral regions of       the density of the uppermost snowpack layer in each grid cell
the Antarctic ice sheet (Lenaerts and van den Broeke, 2012).       exposed to drifting snow. The temporal evolution of surface
   A different feature of the current drifting-snow scheme of      density along the range of values for which snow remains
MAR contrasting with earlier versions is that, instead of be-      erodible is parameterized according to a linear densification
ing simultaneously distributed over several upper snow lay-        rate from the fresh snow value ρ0 (assumed to be representa-
ers, the influence of erosion and deposition at each model         tive of snow that has been barely altered by post-depositional
time step (60 s) is restricted to the uppermost snow layer only,   processes) to the prohibitive density value for snow erosion
under the consideration that only the surface snowpack layer       ρmax , i.e.
can exchange momentum and mass with the atmosphere. For            dρs   ρmax − ρ0
deposition, this reduces the computational cost by preventing          =           ,                                          (11)
                                                                    dt     τDR
rearrangements of several snow layers per time step. For ero-
sion, this avoids numerical instabilities related to the likely    in which the characteristic timescale for drifting-snow com-
removal of several snow layers deeper in the snowpack while        paction τDR is set to 24 h. This value corresponds to the av-
the computation of the surface temperature and energy bal-         erage duration of drifting-snow events reported in Amory
ance is based on the surface layer only. Snow layers with dif-     (2020a) and is used here as the typical duration for exhaus-
ferent characteristics may thus be deposited or exposed suc-       tion of erodible snow to be reached. The linear behaviour of
cessively at the top of the snowpack during a drifting-snow        the densification rate follows the linear increase in surface
event, thus influencing the simulated surface albedo.              snow density retrieved from measurements performed dur-
   The current version uses fixed values for the characteris-      ing a drifting-snow event in Adélie Land (Fig. S2). Further
tics of deposited snow but implicitly accounts for differences     details on this experiment are provided in the Supplement
between cloud and eroded particles. The characteristics of         (Sect. S1). By fixing ρ0 and parameterizing u∗t as an in-
fresh snow (ρ0 , d = 1 and s = 0) differ from those of eroded      creasing function of ρs (Eq. 1), Eq. (11) does not necessarily
particles which are assumed to have completely lost their ini-     enable a correspondence with actual snow surface densities
tial shape through collision and sublimation during transport      but rather merely ensures a realistic time evolution of surface

Geosci. Model Dev., 14, 3487–3510, 2021                                            https://doi.org/10.5194/gmd-14-3487-2021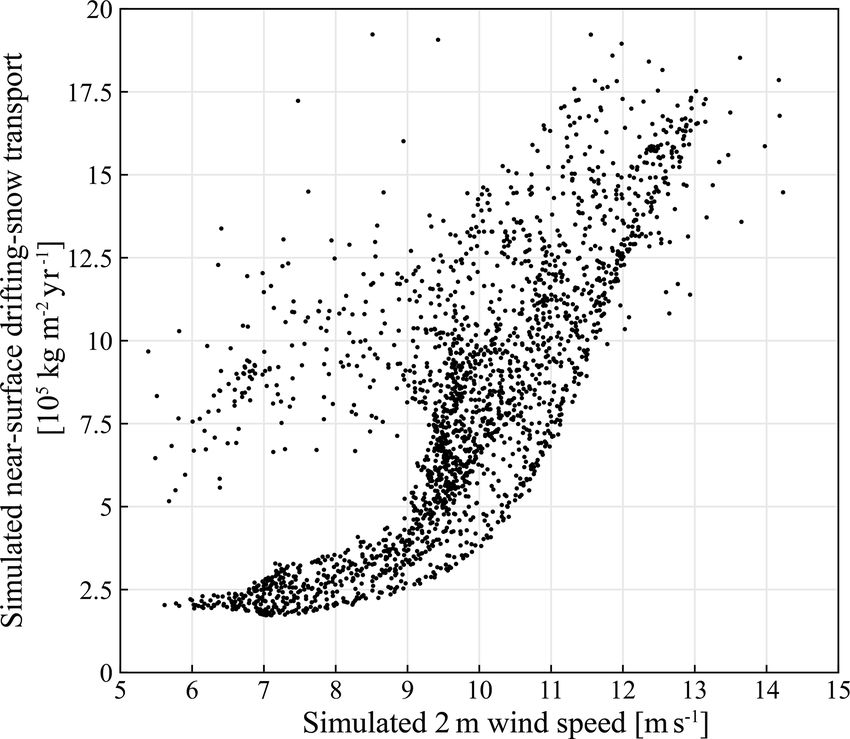
C. Amory et al.: Performance of MAR in simulating drifting snow in Adélie Land                                             3493

snow density. It also prevents large (positive) values of the    of the air temperature only (Amory et al., 2017). This param-
difference u∗ − u∗t to endure through time and thus acts as a    eterization was developed so that z0 fits the observed sea-
negative feedback for snow erosion.                              sonal variations between high (> 10−3 m) summer and lower
                                                                 winter values in coastal Adélie Land, for air temperatures
3.5   Erosion                                                    above −20 ◦ C. For lower temperatures, a constant z0 value
                                                                 of 2 × 10⁻⁴ m is set in agreement with observations on the
For each continental grid cell MAR calculates the actual         Antarctic Plateau (Vignon et al., 2017).
snow mass eroded from the snowpack (ER, kg m−2 ) dur-                Roughness features alter the spatial distribution of wind
ing the current time step according to the following chain       shear near the surface through pressure fluctuation gradients
of events (Fig. 1).                                              in their immediate vicinity (i.e. the form drag). This drag par-
 1. The snow particle ratio qs in the first model level, which   titioning results in a loss of momentum from the near-surface
    includes the contributions of snowfall, atmospheric sub-     flow by turbulent friction, which in turn reduces the energy
    limation and advection of snow as computed by the            budget available for erosion in the form of negative feedback.
    cloud microphysical and turbulence schemes, is trans-        Previous versions of the drifting-snow scheme in MAR in-
    mitted to the surface scheme.                                cluded a parameterization of drag partitioning developed for
                                                                 non-erodible roughness elements encountered in desert-like
 2. A potential maximum erosion ERmax (kg m−2 ) is esti-         environments (Marticorena and Bergametti, 1995). While
    mated from the surface turbulent flux of snow particles      snow roughness features have been shown to effectively exert
    u∗ qs∗ computed from step 7 at the previous time step:       significant form drag inhibiting snow erosion, this mainly oc-
    ERmax = ρa u∗ qs∗ dt.                                        curs for near-surface flows and roughness features of cross-
 3. Actual erosion ER (≥ 0) is calculated from removal of        wise orientations and can essentially vanish through a rapid
    snow from the surface snowpack layer until ERmax is          streamlining process of the microrelief under erosive condi-
    reached or the layer has been entirely eroded.               tions (Andreas and Claffey, 1995; Amory et al., 2016). Sen-
                                                                 sitivity experiments revealed that the drag partition scheme
 4. Snow at the surface densifies following Eq. (11).            was responsible for a strong inhibiting effect on snow ero-
                                                                 sion beyond the observed magnitude of the negative feedback
 5. The drift fraction is obtained from Eq. (10). Snow is
                                                                 mechanism, possibly as it does not account for the dynamical
    deposited at the surface and surface density is adjusted
                                                                 and erodible nature of snow microrelief (Amory et al., 2015).
    according to Eq. (9).
                                                                 Consequently, it has been disabled in the current model ver-
 6. The threshold friction velocity u∗t and the saltation par-   sion.
    ticle ratio qsalt are deduced from Eqs. (1) and (5).
 7. The surface turbulent flux of snow particles u∗ qs∗ is       4   Field area, observation data and evaluation methods
    computed from Eq. (6).
 8. The contribution of erosion is added to qs , which is        The near-surface climate in coastal Adélie Land is dominated
    then transmitted to the turbulence, cloud microphysical,     by strong katabatic flows which drain cold air from the conti-
    and radiative schemes to compute advection and inter-        nental interior toward the steep coastal escarpment, enabling
    actions of airborne snow with the atmosphere.                the regular incidence of well-developed drifting-snow events
                                                                 throughout the year (Amory, 2020a). High erosion rates and
3.6   Surface roughness                                          export of drifting snow combine to melt and sublimation to
                                                                 produce local net ablation at the surface and resulting per-
Drifting snow is responsible for the development of sur-         sistent blue-ice areas near the coast on the steepest part of
face microrelief, whose spatial arrangement combined with        the ice margin (Genthon et al., 2007; Favier et al., 2011).
the orientation of the wind determines the roughness length      In a fairly narrow transition, net accumulation is observed a
for momentum z0 . Because of wind-driven reshaping of the        few kilometres inland despite significant drifting snow (Bar-
snow topography and the diversity in surface types, z0 varies    ral et al., 2014; Amory et al., 2017), with annual SMB values
by several orders of magnitude with time and space across        displaying a high, kilometre-scale variability as a result of
the Antarctic continent (Amory et al., 2017). The sensitiv-      wind redistribution (Agosta et al., 2012).
ity of MAR to the parameterization of surface roughness has         The performance of MAR in reproducing the drifting-
been discussed in Amory et al. (2015), who demonstrated          snow climate of Adélie Land is evaluated against 2 m wind
that a dynamic representation of z0 is required to improve the   speed and direction, air temperature, and air relative hu-
modelling of wind speed and drifting-snow fluxes in Adélie       midity observations collected at two locations 100 km apart,
Land. Due to inconsistencies between observed and mod-           D47 and D17 (Fig. 1, Table 1). Data at half-hourly inter-
elled temporal variations in z0 values, the former parameter-    vals are available from automatic weather stations installed
ization of z0 was changed and is now computed as a function      at both sites and operated by the Institut des Géosciences de

https://doi.org/10.5194/gmd-14-3487-2021                                           Geosci. Model Dev., 14, 3487–3510, 2021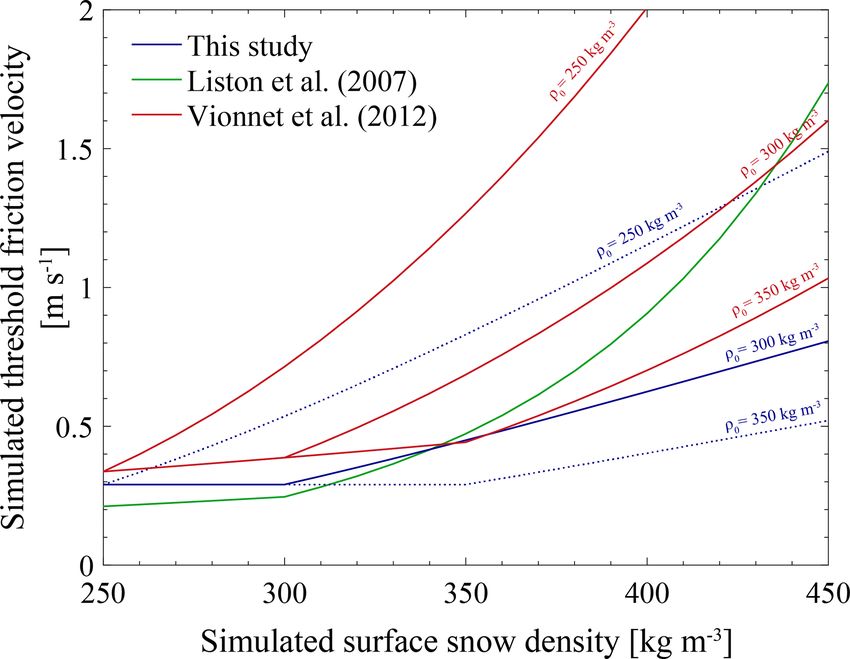
3494 C. Amory et al.: Performance of MAR in simulating drifting snow in Adélie Land
Table 1. Main characteristics of the two measurement locations used for the evaluation of MAR.
Station Location Elevation Elevation Observation period
(m) bias (m)
D47 67.4◦ S, 138.7◦ 1560 −8 January 2010–December 2012
D17 66.7◦ S, 139.9◦ 450 −66 February 2010–December 2018∗
∗ Station still operative.
l’Environnement (IGE) over the periods 2010–2012 for D47 be expressed as
and 2010–2018 for D17 (Amory et al., 2020). All datasets
are reported as quality-controlled. At each station relative hu- µMAR = U ρa qs . (12)
midity is originally given with respect to water and has been
converted to be expressed with respect to ice in subfreezing With a lowest level at 2 m height, MAR does not capture
conditions following Goff and Gratch (1945) formulae and the strong exponential decrease in snow mass flux with
using the 2 m temperature record in the conversion. Climate height existing close to the surface (e.g. Mann et al., 2000;
variables extracted from the lowest model level (2 m) and the Nishimura and Nemoto, 2005). As the snow particle ratio qs
nearest grid cell to the observation location are used for com- has the same value throughout the model level, comparison
parison. between model and observations is performed by combin-
Half-hourly meteorological data also include drifting- ing, when available, snow mass flux estimates at both mea-
snow mass fluxes measured almost continuously over surement levels into an average, near-surface, drifting-snow
their respective observation periods using acoustic second- mass flux µOBS (kg m−2 s−1 ) calculated through
generation FlowCapt™ sensors (hereafter referred to as µ1 h1 + µ2 h2
2G-FlowCapt™). The instrument consists of a 1 m long µOBS = , (13)
h1 + h2
tube containing electroacoustic transducers that convert the
acoustic vibration caused by the drifting-snow particles col- where µi is the observed snow mass flux integrated over the
liding with the tube into a snow mass flux integrated over exposed length hi of the corresponding 2G-FlowCapt™ sen-
the exposed length of the tube. At D47, two 2G-FlowCapt™ sor (Amory et al., 2015).
sensors were installed and superimposed vertically to sam- Modelled SMB is compared with observations obtained
ple the first 2 m above ground and detect the onset of drift- from annual measurements of 91 snow stakes distributed
ing snow. Site D17 was initially equipped with only one 2G- every ∼ 1.5 km along a 150 km long transect (see Agosta
FlowCapt™ set up close to the surface and completed with a et al., 2012 for description) that extends from the coast up
second instrument in December 2012 to match the configu- to 1800 m a.s.l. and crosses the locations of D17 and D47.
ration of D47. As snow particles directly originating from The SMB dataset includes observations collected over the pe-
clouds cannot be discriminated from saltating and/or sus- riod 2004–2018 and covers the strong SMB gradient existing
pended snow particles relocated from the ground, measured between the coast and relatively drier and colder conditions
snow mass fluxes account for all forms of drifting snow along inland. All annual observed values contained in each model
the sampling height. The IGE database then enables the eval- grid cell (10 × 10 km2 ) are averaged to produce a mean ob-
uation of simulated drifting snow and the relative climate served SMB value per grid cell.
against time-averaged measurements of bulk flow and mass
flux conditions, consistently with the steady-state drifting-
snow physics implemented in MAR. An extensive descrip- 5 Model evaluation
tion of the drifting-snow and meteorological equipment at
D47 and D17 can be found in Amory (2020a). 5.1 Near-surface climate
Thorough evaluation of drifting snow requires consistency
Accurate near-surface flows are required for a realistic repre-
between observed and modelled drifting-snow mass fluxes.
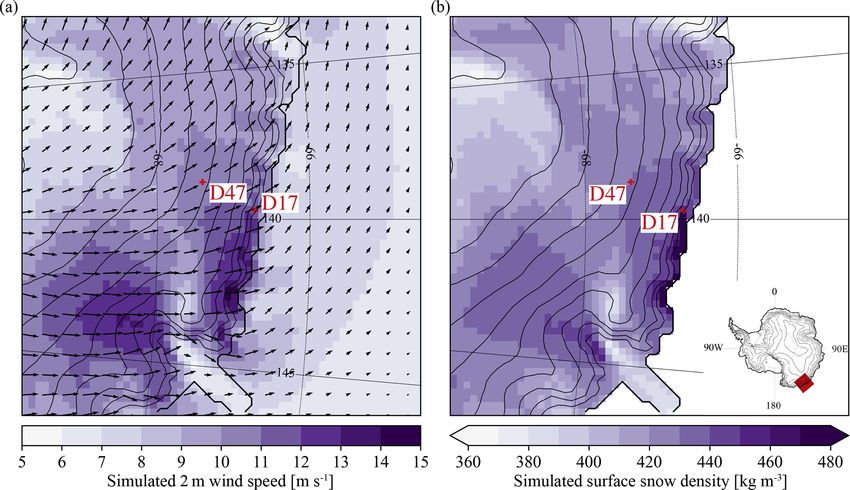
sentation of drifting-snow processes. The modelled annual
Near-surface snow mass fluxes simulated by MAR can be
mean (2004–2018) 2 m wind field (Fig. 2a) shows domi-
inferred from qs at the lowest vertical model level (2 m),
nant southeasterly katabatic flows all over the integration do-
which, similarly to the 2G-FlowCapt™, does not distinguish
main. Modelled annual mean wind directions at D47 (149◦ )
the origin of particles. By approximating the mean speed of
and D17 (162◦ ) agree within less than 10◦ with observations
suspended particles with the mean wind speed U at the low-
(Amory, 2020a). Local flow acceleration causes the highest
est model level, an average, horizontal (vertically integrated),
annual mean near-surface wind speeds to be simulated in
near-surface drifting-snow mass flux µMAR (kg m−2 s−1 ) can
confluent topography and over 150 km along the coast east
of the D17 location. The occurrence of maximum wind jets
Geosci. Model Dev., 14, 3487–3510, 2021 https://doi.org/10.5194/gmd-14-3487-2021
C. Amory et al.: Performance of MAR in simulating drifting snow in Adélie Land 3495
along this coastal section of Adélie Land is a well-known by large eddies from higher atmospheric levels, leading to
feature of the study area supported by modelling efforts and potentially erroneous prediction of near-surface wind gusts.
observations (e.g. Parish and Wendler, 1991; Wendler et al., The saturation vapour pressure of air is a strongly depen-
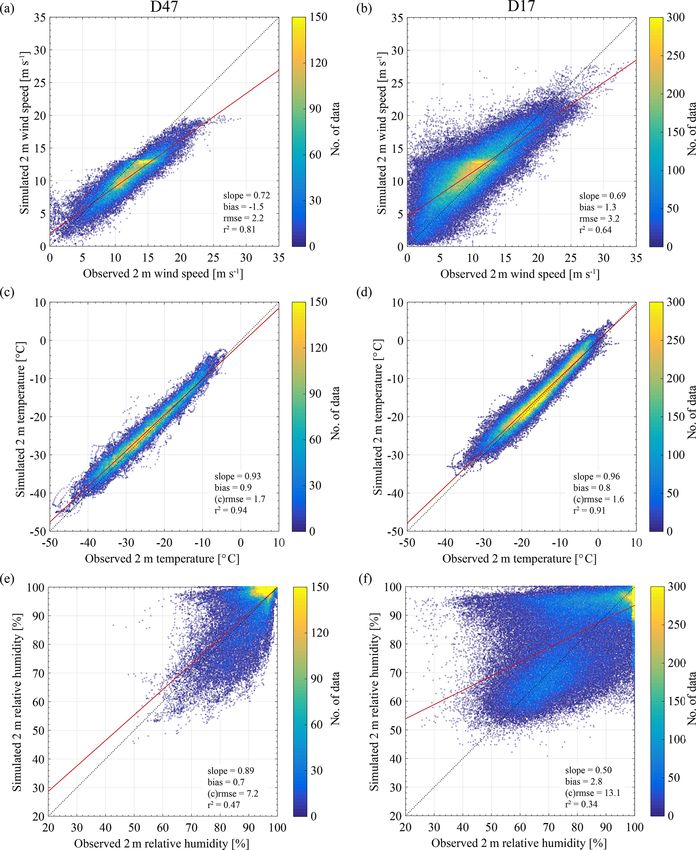
1993). dent function of temperature, and the relative humidity de-
Snow at the surface densifies with drifting snow (Eq. 11), termines the potential for atmospheric sublimation. Adequate
causing the spatial distribution of ρs to be linked with the performance in modelling these fields is of prime importance
variability in near-surface wind speed (Fig. 1b). The lowest for the representation of drifting-snow sublimation. Near-
annual mean density values amount to 360 kg m−3 in areas surface air temperature (Fig. 3c, d) is well represented at both
of low wind speed where melting is absent and increase in stations (positive bias < 1 ◦ C and centred RMSE < 2 ◦ C). As
areas of flow acceleration where drifting-snow compaction is drifting-snow sublimation is a determining contributor to the
the most active. The highest ρs values around 480 kg m−3 are atmospheric humidity budget in the area (Amory and Kittel,
produced at the coast where both drifting-snow compaction 2019; Le Toumelin et al., 2020), reasonable relative humid-
and (summer) melting occur. ity statistics (Fig. 3e, f) despite a remaining significant dis-
Consistent evaluation of model results for drifting-snow persion along the whole range of values suggest a realistic
applications requires a fine temporal resolution since drift- reproduction of this process in the lowest model levels.
ing snow responds to high-frequency fluctuations in wind The vertical resolution could limit the general ability of the
speed. At half-hourly resolution, MAR generally underesti- model to represent the atmospheric boundary layer near the
mates 2 m wind speeds at D47, particularly above 10 m s−1 , coast. Refining the vertical discretization by doubling at the
with a mean bias of −1.5 m s−1 and a root-mean squared same time the total number of levels and the number of levels
error (RMSE) of 2.2 m s−1 (Fig. 3a). Strong winds are bet- in the lowest 100 m however does not significantly improve
ter captured at D17 at the expense of weak wind conditions model performance when evaluated against near-surface ob-
and model exactitude, resulting in a positive mean bias of servations (See Sect. S2).
+1.3 m s−1 and a RMSE of 3.2 m s−1 (Fig. 3b). Note that
these statistics, despite data quality control, might still be af- 5.2 Drifting-snow occurrences
fected by some measurements likely subject to instrument
malfunction (icing), especially at D17 due to the proximity Since drifting snow preferentially occurs during strong wind
of the ocean, when observed half-hourly wind speeds near events, general biases in the model representation of wind
zero are reported concurrently with considerably higher sim- speed influence the representation of drifting-snow fre-
ulated values. Actual overestimation of low wind speed val- quency (Fig. 5). Monthly frequency values are computed as
ues would however not be expected to be detrimental since the fraction of half-hourly drifting-snow occurrences with a
observations show that drifting snow is usually triggered by simulated or observed near-surface drifting-snow mass flux
wind speeds above 5 m s−1 at both locations, a feature well greater than 10−3 kg m−2 s−1 (Amory et al., 2017). Fig-
reproduced by the model (Fig. S3). Data dispersion then re- ure 5b and c illustrate that the model reproduces the ob-
duces with increasing wind speeds. served spatio-temporal variability in monthly drifting-snow
The general underestimation in near-surface wind speed at frequency, with a correlation coefficient r of 0.49 and 0.65
D47 could be caused by the temperature-dependent parame- respectively at D47 and D17. The underestimation of strong
terization of z0 , locally still yielding too high values, while winds at D47 leads to underestimation of drifting-snow fre-
at D17 Fig. 4 illustrates that modelled z0 values are closer to quency (observed and modelled averages of 0.81 and 0.61),
observations. Another explanation potentially involved in the which is then better represented by the model at D17 (ob-
underestimation of wind speed maxima is the model misrep- served and modelled averages of 0.61 and 0.57). Nearly con-
resentation of large eddies in case of strong winds. The local sistent underestimation of drifting-snow frequency at D47
turbulence scheme of MAR is adapted for stable atmospheric could also be caused by a misrepresentation of surface snow
boundary layers in which small eddies develop and quickly properties and their temporal evolution. For instance, sur-
dissipate. Due to the strong turbulent mixing induced by high face compaction could be locally too strong in the model
wind speeds, the atmospheric boundary layer is mostly stati- (see Sect. 6.2), which would shorten the duration of events
cally neutral in coastal Adélie Land (Amory et al., 2017), and and inhibit further drifting snow until snow replenishment
frequent development of drifting-snow layers of several hun- by snowfall, while better model agreement with the ob-
dreds of metres in thickness in this area (Palm et al., 2018) served frequency at D17 suggests a value of τDR likely better
suggests the presence of large eddies of the height of the suited for this location. Note that modelled drifting snow is
boundary layer. Local turbulence schemes commonly strug- not the most frequent where the strongest wind speeds are
gle to reproduce the well-mixed character of neutral atmo- found (Fig. 5a). Highest frequency values are simulated east
spheric boundary layers (Hillebrandt and Kupka, 2009) more of D17 and D47 over topographic crests upstream of the
representative of coastal windy Antarctic regions and typi- Mertz Glacier (67.5◦ S, 144.8◦ E) where orographic lifting
cally fail to represent downward entrainment of momentum produces enhanced precipitation rates which then contribute
to favour the occurrence of drifting snow by (i) increasing the
https://doi.org/10.5194/gmd-14-3487-2021 Geosci. Model Dev., 14, 3487–3510, 2021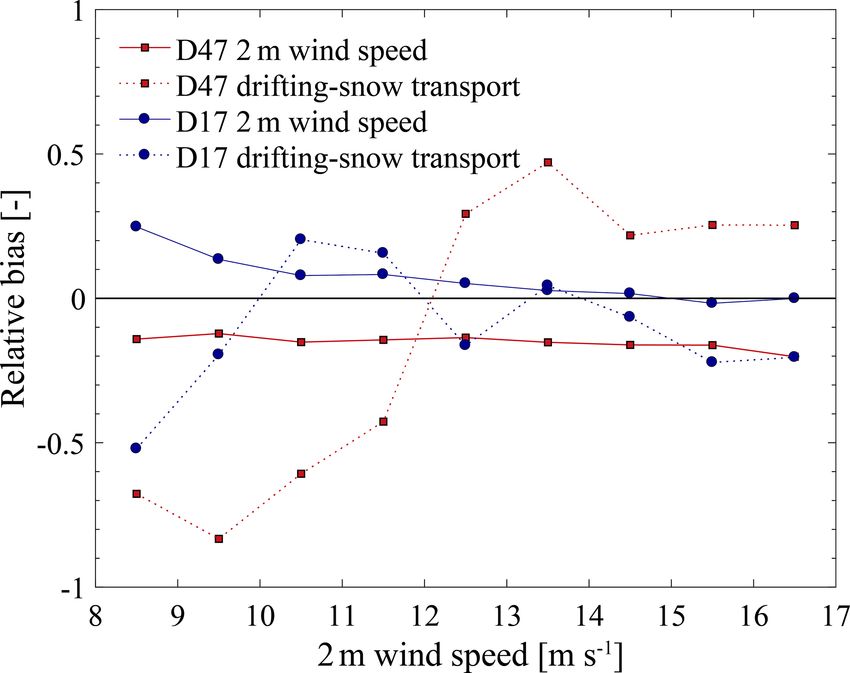
3496                                        C. Amory et al.: Performance of MAR in simulating drifting snow in Adélie Land

Figure 2. (a) Simulated annual mean (2004–2018) 2 m wind speed (colours) and direction (arrows) and (b) surface snow density (uppermost
snowpack layer) on the model integration domain after removal of the relaxation zone (10 grid cells). The thin black curves show the ice sheet
topography at 250 m contour intervals. The position of the model domain on the Antarctic ice sheet is indicated in the inset. The locations of
measurement sites D47 and D17 are marked with red crosses.

airborne snow mass independently from erosion and (ii) de-               Table 2. Statistical evaluation of the ability of MAR to simulate
creasing ρs and lowering the erosion threshold.                          half-hourly drifting-snow occurrences at D47 (2010–2012) and D17
   Figure 5 only compares monthly frequency values. Typi-                (2010–2018). See Sect. 5.2 for the definition of POD, FAR and RI.
cal durations of drifting-snow events in Adélie Land, how-
ever, range from several hours to a few days at most (Amory,                                Station   POD      FAR       RI
2020a). To evaluate the model results at higher temporal res-                               D47        64.5    13.4     9.1
olution closer to characteristic timescales of drifting snow,                               D17        80.9    25.4    45.5
half-hourly data are used to compute the probability of de-
tection (POD) and false alarm ratio (FAR):
              a                       c                                     Positive RI values are obtained at both locations (Table 2),
POD = 100        ;      FAR = 100        ,                     (14)
             a+b                     c+a                                 meaning the model ability to predict drifting-snow occur-
                                                                         rences at the monthly scale (Fig. 5b, c) arises from a rea-
where a is the number of half-hourly drifting-snow occur-                sonable reproduction of their actual timing and duration at
rences correctly simulated, b the number of occurrences                  the half-hourly resolution. MAR shows better results (higher
missed by the model and c the number of occurrences sim-                 POD and RI) at D17 than at D47 but also simulates more
ulated but not observed. The Rousseau index (RI), a mea-                 unobserved occurrences (higher FAR) that compensate for
sure of model predictability originally defined to assess rain-          missed occurrences in the calculation of monthly frequency
fall forecasts (Rousseau, 1980) and already used to evalu-               values.
ate modelled drifting-snow occurrence in an alpine context
(Vionnet et al., 2013), is also calculated. RI also takes into           5.3    Drifting-snow transport
account the number of occurrences for which the absence of
drifting snow is correctly simulated, d, such that                       Qualitative evaluation of MAR against monthly cumula-
                           2                                             tive near-surface drifting-snow mass fluxes at D47 and D17
             ad − (b+c)                                                  (Fig. 6b, c) reveals that the model captures the general tem-
RI = 100      b+c
                   2 b+c  ,                                  (15)
           a+ 2     d+ 2                                                 poral evolution of drifting-snow transport at both locations
                                                                         (r = 0.64 and 0.89). As a result of interactions between mod-
where RI varies between −100 and 100. A negative value                   elled near-surface flow conditions and surface snow proper-
means that the model is less successful than an estimation               ties, drifting snow is subject to a high variability in space and
entirely based on climatology, 0 indicates no skill and 100 is           time. This variability is simulated by the model with alter-
obtained for a perfect simulation.                                       nating underestimation and overestimation of drifting-snow

Geosci. Model Dev., 14, 3487–3510, 2021                                                    https://doi.org/10.5194/gmd-14-3487-2021
C. Amory et al.: Performance of MAR in simulating drifting snow in Adélie Land 3497 Figure 3. Density scatter plots of observed vs. simulated half-hourly (a, b) wind speed, (c, d) air temperature and (e, f) air relative humidity with respect to ice at 2 m height for stations (a, c, e) D47 and (b, d, f) D17. The coloured lines show the 1 : 1 line (dashed black) and the best linear fit (red). transport depending on the time period and location. Fig- of 10−3 kg m−2 s−1 for a minimum duration of 4 h. Discrep- ure 7 compares observed and simulated snow transport dur- ancy between model and observations is larger for (shorter) ing each observed drifting-snow event. As in Amory (2020a), events of lower magnitude (< 103 kg m−2 s−1 ) and reduces a drifting-snow event is defined as a period over which the for longer, more important events that contribute predomi- observed snow mass flux is above the detection threshold nantly to the local drifting-snow transport (Amory, 2020a). https://doi.org/10.5194/gmd-14-3487-2021 Geosci. Model Dev., 14, 3487–3510, 2021
3498                                       C. Amory et al.: Performance of MAR in simulating drifting snow in Adélie Land

                                                                        Analysing the relationship between modelled wind speed
                                                                     and drifting-snow transport demonstrates that the model per-
                                                                     formance varies according to the flow conditions leading to
                                                                     drifting snow. Median relative biases in mean 2 m wind speed
                                                                     and cumulative near-surface transport during drifting-snow
                                                                     events are shown at both measurement sites for observed 2 m
                                                                     wind speed bins of 1 m s−1 in Fig. 8 for the most represented
                                                                     wind speed categories (8 to 17 m s−1 ). Since wind speed and
                                                                     drifting-snow transport are monotonically related, biases in
                                                                     event-averaged wind speed can explain biases in cumulative
                                                                     drifting-snow transport when both are of the same sign. Fig-
                                                                     ure 8 shows fluctuations in the sign of the bias in drifting-
                                                           .
                                                                     snow transport when biases in mean wind speed remain of
                                                                     constant sign. This suggests that model errors in terms of
Figure 4. Observed (blue circles) and simulated (red squares)        drifting-snow transport can also be attributed to the erosion,
monthly median values of roughness length for momentum at D17        microphysical and/or turbulence schemes. Nevertheless, note
during year 2013. Observed values are taken from Amory et al.        that uncertainties in the observations can also affect the eval-
(2017)                                                               uation. In particular, while 2G-FlowCapt™ sensors can de-
                                                                     tect the occurrence of snow transport with a high level of
Table 3. Observed and simulated total drifting-snow transport        confidence (Trouvilliez et al., 2015), their ability to estimate
(106 kg m−2 ) from 0 to 2 m above surface at D47 and D17. A          drifting-snow mass fluxes remains to be assessed in Antarctic
distinction is made between total snow transport computed from
                                                                     conditions (Amory, 2020a).
observed (OBS) and simulated (MARobs ) near-surface drifting-
                                                                        The mass transported in drifting snow has been shown to
snow mass fluxes cumulated over each drifting-snow event iden-
tified in the database and over each simulated drifting-snow event   correlate with wind speed in a power-law fashion (e.g. Budd,
(MARsim ).                                                           1966; Radok, 1977; Mann et al., 2000; Amory, 2020a). Fig-
                                                                     ure 9, in which the modelled annual mean of horizontal near-
             Station   OBS     MARobs      MARsim                    surface drifting-snow transport is studied as a function of 2 m
                                                                     wind speed for all continental grid cells, shows that this rela-
             D47        1.51        1.84        1.88                 tionship is well reproduced by the model. This enables us to
             D17        5.25        4.92         5.4
                                                                     assess the plausibility of the model results in the absence of
                                                                     observations in other locations of the integration domain and
                                                                     explains the spatial distribution of drifting-snow transport,
   Table 3 compares the total snow transport during ob-              with maximum values generally simulated in areas of high-
served drifting-snow events (OBS) to that estimated by the           est 2 m wind speeds (Fig. 6a). The dispersion around a given
model during these observed events (MARobs ) and during              wind speed value (Fig. 9) results from variations in the ero-
every simulated events (MARsim ). Referring only to ob-              sion threshold (Mann et al., 2000; Amory, 2020a). Departure
served events, MAR respectively overestimates (+21.6 %)              from the power-law relation at low wind speeds is caused by
and underestimates (−6.1 %) drifting-snow transport at D47           a predominant contribution of snowfall to the airborne snow
and D17. Together with the consistent underestimation of             mass (Amory et al., 2015) and corresponds to areas of near-
drifting-snow frequency at D47 (Fig. 5b), this means that            surface flow deceleration, such as over the Mertz Glacier ice
the model simulates the main events but underestimates               tongue or in topographic depressions.
the occurrence of events of lower magnitude and associ-
ated transport at this location (Fig. 7a). However, overesti-
mation of drifting-snow transport by the model during ob-            5.4   Surface mass balance
served events overcompensates for the missed events, with
a slight contribution of false alarms to the simulated to-           In the current version of MAR, cloud, eroded and deposited
tal drifting-snow transport (MARsim ∼ MARobs > OBS). At              snow particles are all included in the snow particle ratio qs .
D17, while the simulated drifting-snow frequency (Fig. 5c)           Precipitation, erosion and deposition can occur simultane-
and total drifting-snow transport during observed events             ously and repeatedly within the same grid cell. Simulated
are in closer agreement with the observations, simulated             snowfall (SF) and erosion (ER) amounts then respectively ac-
but unobserved drifting snow is more significant (Table 3)           count for the cumulative snow mass that is transferred to and
and results in overestimation of total drifting-snow transport       removed from the surface. Each of the two components thus
(MARsim > MARobs ∼ OBS).                                             cannot be used individually to determine the integrative con-
                                                                     tribution of snowfall, erosion and deposition separately when
                                                                     the drifting-snow scheme is switched on. From that perspec-

Geosci. Model Dev., 14, 3487–3510, 2021                                              https://doi.org/10.5194/gmd-14-3487-2021
You can also read