Article - American Meteorological Society
←
→
Page content transcription
If your browser does not render page correctly, please read the page content below
Article
Towards an End-to-End Analysis and Prediction System for
Weather, Climate, and Marine Applications in the Red Sea
Ibrahim Hoteit, Yasser Abualnaja, Shehzad Afzal, Boujemaa Ait-El-Fquih, Triantaphyllos Akylas, Charls Antony,
Clint Dawson, Khaled Asfahani, Robert J. Brewin, Luigi Cavaleri, Ivana Cerovecki, Bruce Cornuelle,
Srinivas Desamsetti, Raju Attada, Hari Dasari, Jose Sanchez-Garrido, Lily Genevier, Mohamad El Gharamti,
John A. Gittings, Elamurugu Gokul, Ganesh Gopalakrishnan, Daquan Guo, Bilel Hadri, Markus Hadwiger,
Mohammed Abed Hammoud, Myrl Hendershott, Mohamad Hittawe, Ashok Karumuri, Omar Knio,
Armin Köhl, Samuel Kortas, George Krokos, Ravi Kunchala, Leila Issa, Issam Lakkis, Sabique Langodan,
Pierre Lermusiaux, Thang Luong, Jingyi Ma, Olivier Le Maitre, Matthew Mazloff, Samah El Mohtar,
Vassilis P. Papadopoulos, Trevor Platt, Larry Pratt, Naila Raboudi, Marie-Fanny Racault, Dionysios E. Raitsos,
Shanas Razak, Sivareddy Sanikommu, Shubha Sathyendranath, Sarantis Sofianos, Aneesh Subramanian,
Rui Sun, Edriss Titi, Habib Toye, George Triantafyllou, Kostas Tsiaras, Panagiotis Vasou, Yesubabu Viswanadhapalli,
Yixin Wang, Fengchao Yao, Peng Zhan, and George Zodiatis

                                ABSTRACT: The Red Sea, home to the second-longest coral reef system in the world, is a vital
                                resource for the Kingdom of Saudi Arabia. The Red Sea provides 90% of the Kingdom’s potable
                                water by desalinization, supporting tourism, shipping, aquaculture, and fishing industries, which
                                together contribute about 10%–20% of the country’s GDP. All these activities, and those elsewhere
                                in the Red Sea region, critically depend on oceanic and atmospheric conditions. At a time of mega-
                                development projects along the Red Sea coast, and global warming, authorities are working on
                                optimizing the harnessing of environmental resources, including renewable energy and rainwater
                                harvesting. All these require high-resolution weather and climate information. Toward this end, we
                                have undertaken a multipronged research and development activity in which we are developing
                                an integrated data-driven regional coupled modeling system. The telescopically nested compo-
                                nents include 5-km- to 600-m-resolution atmospheric models to address weather and climate
                                challenges, 4-km- to 50-m-resolution ocean models with regional and coastal configurations to
                                simulate and predict the general and mesoscale circulation, 4-km- to 100-m-resolution ecosystem
                                models to simulate the biogeochemistry, and 1-km- to 50-m-resolution wave models. In addition, a
                                complementary probabilistic transport modeling system predicts dispersion of contaminant plumes,
                                oil spill, and marine ecosystem connectivity. Advanced ensemble data assimilation capabilities
                                have also been implemented for accurate forecasting. Resulting achievements include significant
                                advancement in our understanding of the regional circulation and its connection to the global
                                climate, development, and validation of long-term Red Sea regional atmospheric–oceanic–wave
                                reanalyses and forecasting capacities. These products are being extensively used by academia,
                                government, and industry in various weather and marine studies and operations, environmental
                                policies, renewable energy applications, impact assessment, flood forecasting, and more.

https://doi.org/10.1175/BAMS-D-19-0005.1
Corresponding author: Ibrahim Hoteit, ibrahim.hoteit@kaust.edu.sa
In final form 28 August 2020
©2021 American Meteorological Society
For information regarding reuse of this content and general copyright information, consult the AMS Copyright Policy.

                AMERICAN METEOROLOGICAL SOCIETY
                                                                                                                   Unauthenticated     021     E99
                                                                                                                        J A N UA RY| 2Downloaded 10/23/21 10:29 PM UTC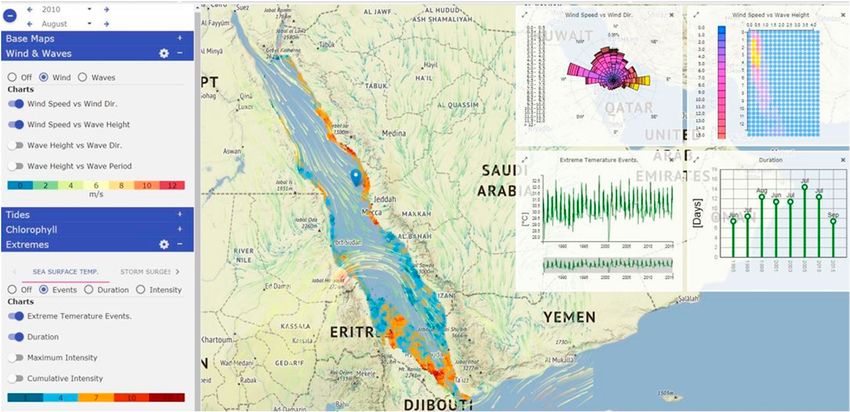
AFFILIATIONS: Hoteit, Abualnaja, Afzal, Ait-El-Fquih, Antony, Attada, Dasari, Genevier, Gittings, Gokul,
Guo, Hadri, Hadwiger, Hammoud, Hittawe, Knio, Kortas, Krokos, Langodan, Luong, Ma, El Mohtar,
Raboudi, Razak, Sanikommu, Toye, Vasou, Wang, Yao, and Zhan—King Abdullah University of Science
and Technology, Thuwal, Saudi Arabia; Akylas and Lermusiaux—Massachusetts Institute of Technology,
Cambridge, Massachusetts; Dawson—The University of Texas at Austin, Austin, Texas; Asfahani—Saudi
Aramco, Damam, Saudi Arabia; Brewin—University of Exeter, Cornwall, United Kingdom; Cavaleri—
Institute of Marine Sciences, Venice, Italy; Cerovecki, Cornuelle, Gopalakrishnan, Hendershott, Mazloff,
and Sun—Scripps Institution of Oceanography, La Jolla, California; Desamsetti—National Center for
Medium Range Weather Forecasting, Noida, India; Sanchez-Garrido—University of Malaga, Malaga,
Spain; El Gharamti—National Center of Atmospheric Research, Boulder, Colorado; Karumuri—University
of Hyderabad, Hyderabad, India; Köhl—University of Hamburg, Hamburg, Germany; Kunchala—Indian
Institute of Technology, Delhi, India; Issa—Lebanese American University, Beirut, Lebanon; Lakkis—
American University of Beirut, Beirut, Lebanon; Le Maitre—Ecole Polytechnique, Palaiseau, France;
Papadopoulos, Triantafyllou, and Tsiaras—Hellenic Centre for Marine Research, Anavissos, Greece;
Platt,* Racault, and Sathyendranath—Plymouth Marine Laboratory, Plymouth, United Kingdom;
Pratt—Woods Hole Oceanographic Institution, Woods Hole, Massachusetts; Raitsos and Sofianos—
National and Kapodistrian University of Athens, Athens, Greece; Subramanian—University of Colorado
Boulder, Boulder, Colorado; Titi—University of Cambridge, Cambridge, United Kingdom, and Texas
A&M University, College Station, Texas; Viswanadhapalli—National Atmospheric Research Laboratories,
Gadanki, India; Zodiatis—Coastal and Marine Research Laboratory, Crete, Greece
* Deceased.

T
       he Red Sea is a semi-enclosed, elongated marginal sea, lying between Africa and Asia,
       connected to the Indian Ocean through the Strait of Bab-al-Mandeb (BaM; see Table A1 in
       the appendix for a full list of acronyms and abbreviations used in the paper) in the south
and to the Mediterranean Sea through the Suez Canal in the north (Fig. 1). As a vital resource
for fisheries, agriculture, tourism, and freshwater through desalination and as a major shipping
route, the Red Sea is of paramount political and economic importance for both the region
and the world. Influenced by distinct geological, atmospheric, and hydrographic conditions,
the Red Sea is a unique LME characterized by the second-longest and third-largest coral reef
system in the world, thriving under one of the warmest and most saline conditions of the world
oceans (Edwards and Head 1987). All major oceanographic processes occur in the Red Sea, but
at much smaller spatiotemporal scales compared to the global ocean, making it an ideal test
basin for studies of climate impact on regional ocean circulations as it is expected to exhibit a
faster response to global
climate variations
(Belkin 2009; Carvalho
et al. 2018). Despite its
political, economic, and
scientific importance,
the Red Sea remains a
vastly underexplored
region.
   The Red Sea is a geo-
logically young ocean
with an average width
of 280 km, length of
2,000 km, and maxi-            Fig. 1. Topography of the Red Sea region. The important sites along the Saudi
mum depths exceeding           coastline are indicated on the map.

AMERICAN METEOROLOGICAL SOCIETY
                                                                              Unauthenticated     021    E100
                                                                                   J A N UA RY| 2Downloaded 10/23/21 10:29 PM UTC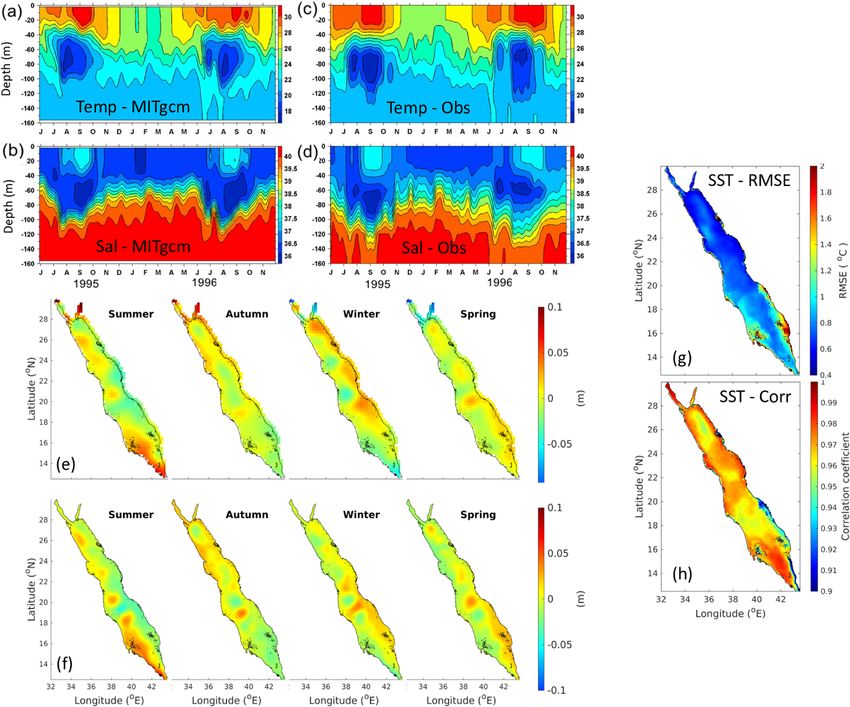
2,500 m along its axial trench. Extending from 12.5° to 30°N in the northwest–southeast
direction, it has a constricted connection with the Gulf of Aden, with a maximum depth of
only 137 m at the Hanish Sill. The bathymetry varies from extensive shallow shelves with
depths 800 m in the north.
   The atmospheric conditions over the Red Sea are mainly influenced by the arid surrounding
terrestrial environment, the seasonal Indian monsoon system, and the orographic effects of
the coastal mountains, with the resultant atmospheric forcing exhibiting marked variabil-
ity on various time scales (Viswanadhapalli et al. 2017). As a result of the arid climate, the
annual mean net freshwater loss due to excess of evaporation over precipitation is estimated
at ~2 m yr−1, and the heat flux has a relatively small annual mean heat loss of 11 W m−2, but a
large annual cycle with a range of ~200 W m−2. Channeled by the coastal mountains, the sur-
face winds tend to follow the direction of the axis of the Red Sea. In summer (June–September)
they generally blow from northwest throughout the whole basin, whereas in winter they
reverse from southeast to northwest in the southern Red Sea, creating a convergence zone
around 18°N (Langodan et al. 2014, 2017a). On smaller spatial scales, intense across-basin
winds flowing between the coastal mountain gaps are also observed, the most prominent
of which is the Tokar jet at around 18°N of the African coast. This jet is known to generate
surface eddies in the Red Sea (Zhai and Bower 2013; Zhan et al. 2018) and to gather moisture
from the surface of the Red Sea that can contribute to precipitation over Saudi Arabia and the
African Highlands region (Davis et al. 2015; Dasari et al. 2017). North of 20°N, the mountain-
gap winds usually originate from the Arabian subcontinent and blow westward.
   In response to the atmospheric forcing and limited exchanges with the Indian Ocean
(Pratt et al. 2000), the Red Sea acts as a concentration basin, producing one of the world’s salti-
est water masses through a complex two-layer overturning system (Fig. 2). In annual mean,
an overturning cell occupies the upper layer around the sill depth in the south and deepens
to about 300 m in the north. It is composed of a northward surface inflow from the Gulf of
Aden and an intermediate southward flow (Sofianos and Johns 2007). This layer is directly
subject to the annual cycle of surface heat
flux and freshwater loss, resulting in marked
seasonal surface temperature variations
and a northward increase in surface salin-
ity (Sofianos and Johns 2015). The Red Sea
intermediate water is formed in the north
during winter and is exported into the Gulf
of Aden through BaM, driving a two-layer
water exchange (Sofianos and Johns 2007;           Fig. 2. Schematic representation of the main thermohaline
Zhai et al. 2015). During summer, the              cells in the Red Sea circulation (Carvalho et al. 2018). Blue
above overturning circulation and water            colors represent fresher water while red colors saline and
exchange in the strait reverse, following          denser water masses. Mesoscale features (cyclonic and
the onset of the Indian summer monsoon             anticyclonic eddies) are represented by spirals. RSOW,
                                                   RSDW, and GAIW stand the for Red Sea Outflow Water,
(Yao et al. 2014a,b). An intermediate water
                                                   Red Sea Deep Water, and Gulf of Aden Intrusion Water,
intrusion at depths 50–100 m is induced            respectively.
from the Gulf of Aden, the mean surface
currents change to flow southward, and the
water exchange in BaM becomes a three-layer structure with the deep outflow significantly
suppressed (Patzert 1974; Smeed 1997). The lower layer of the overturning system, extending
to the basin bottom, is occupied by a nearly homogeneous warm (~21.5°C) and highly saline
(~40.5 psu) water mass, referred to as the RSDW. A deep circulation with a southward bottom
flow and an intermediate northward return flow centered around a depth of 500 m is suggested
by geochemical tracers and dissolved oxygen gradients (Cember 1988; Eshel et al. 1994).

AMERICAN METEOROLOGICAL SOCIETY
                                                                          Unauthenticated     021    E101
                                                                               J A N UA RY| 2Downloaded 10/23/21 10:29 PM UTC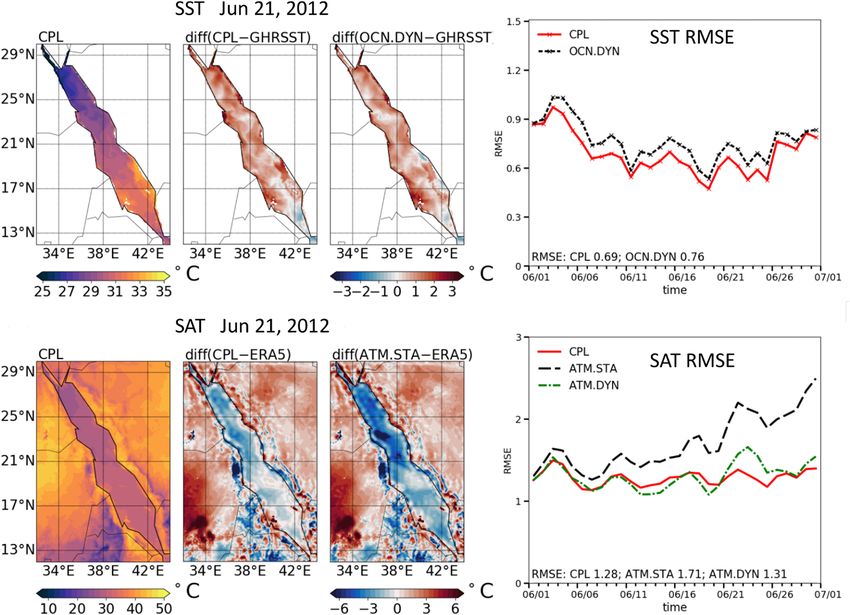
Despite being characterized as an oligotrophic LME, the Red Sea is a region of remark-
able biodiversity and endemism and hosts one of the world’s largest coral reef ecosystems
(Carvalho et al. 2018). The Red Sea ecosystem is strongly influenced by environmental condi-
tions, which modulate it on different levels (Triantafyllou et al. 2014). The Red Sea has been
subject to warming trends (Raitsos et al. 2011; Chaidez et al. 2017; Krokos et al. 2019), causing
coral reef bleaching events (Cantin et al. 2010; Osman et al. 2018; Genevier et al. 2019) and
significantly impacting its productivity (Raitsos et al. 2015; Gittings et al. 2018). The Red Sea
ecosystem, with its relatively simply shaped and semi-enclosed basin, high biodiversity, and
rich dynamics, provides the scientific community with an accessible and ideal natural labo-
ratory to study the physical–biological interactions on multiple spatial and temporal scales.
   Until recently, the Red Sea region remained largely underdeveloped. The last decade
has, however, witnessed an unprecedented increase in population and an acceleration in
residential, commercial and industrial developments along the coast. NEOM, short for the
Latin–Arabic term Neo-Mustaqbal, signifying “new future,” is a $500 billion mega-project
that aims at building a fully automated city operating as an independent economic zone in the
northwestern part of Saudi Arabia. The RSP is another mega-development along the central
Saudi coast and intends to transform the Red Sea coast into a world-class tourist destination,
whose blueprint is primarily based on a coastal lagoon with 90+ pristine islands.
   Maintaining a sustainable, healthy marine environment is a core objective of these develop-
ments and the Saudi authorities. In this context, understanding and forecasting the regional
weather through climate variations is essential for a wide variety of high-impact societal needs,
including environmental protection and coastal management, mitigating weather extremes
and pollution/contamination, exploration and drilling, accidents response, desalination and
plant cooling operations, shipping, harbor management and national security operations,
management of fisheries and marine aquaculture, water resources, and renewable energy.
Given the unique structure of the Red Sea basin and surrounding deserts, and the ocean and
atmospheric connections to the global circulation, the need for integrated state-of-the-art
modeling and supporting datasets is acute.
   Founded in 2009 and located on the shores of the Red Sea, KAUST acts as a hub of frontline
research in the biological, physical, and geological aspects of the Red Sea region. For this
purpose, KAUST dedicated significant resources for studying the Red Sea and understanding
its resources, with the goal of preserving its fragile ecosystem while at the same time support-
ing the local authorities to exploit its unique resources. In parallel to the ongoing hydrographic
and ecological observational efforts, and through sustained and strong collaborations with
many international organizations, the Red Sea Modeling and Prediction group at KAUST has
led the development of a comprehensive and integrated modeling and prediction system to
study, monitor, and predict the atmospheric and oceanic phenomena of the region. The system
is being built by integrating models of atmospheric and oceanic circulations, surface wave,
air pollution, dust, and marine biogeochemistry, and developing advanced data analytics
and visualization capabilities, achieving remarkable progress in the short span of a decade.
The modeling system also relies on in situ and remotely sensed observations (detailed in
Table 1) for the purpose of validation and data assimilation and provides insights into the
systematic relations between the interactions of different components and the management
of various applications.
   An important achievement from this effort is the first high-resolution atmospheric reanalysis
for the region from 1980 to the present, generated using our assimilative atmospheric modeling
system, which is turning out to be critical not only for the Red Sea climate research, but also
contributing to Indian monsoon studies. This regional reanalysis is being used to force the
various ocean and transport models tuned to the Red Sea environment. Notably, these capa-
bilities are currently being extensively used to support various industrial and governmental

AMERICAN METEOROLOGICAL SOCIETY
                                                                         Unauthenticated     021    E102
                                                                              J A N UA RY| 2Downloaded 10/23/21 10:29 PM UTC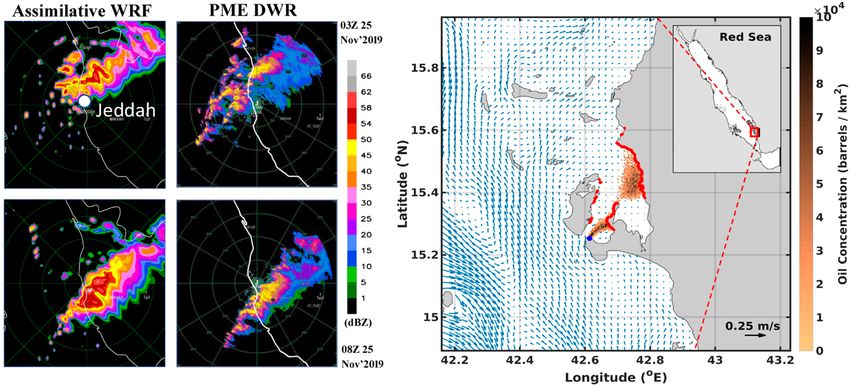
Table 1. A variety of in situ and satellite observations and reanalysis datasets are being used to
study the regional ocean and atmospheric variabilities and changes, to validate our models, for
prescribing model boundary conditions, and for initialization and assimilation. We have also
developed regionally tuned remote sensing algorithms, based on local observations, to generate
improved chlorophyll datasets for the Red Sea region (Brewin et al. 2019). Details of the datasets
and their use are listed here.
Datasets and observations                                   Type                      Usage

                                                Atmospheric datasets
ERA-Interim, NCEP FNL, real-time global SST, CCMP, CRU      Reanalyses                Initialization and boundaries
AMSU, QuikSCAT, ASCAT, GPSRO                                Satellite
TRMM, CMORPH, APHRODITE                                     Rainfall reanalysis       Model validation
Rain gauge precipitation, AWS–PME, KSA                      Local                     Assimilation and validation
Saudi Aramco, KSA                                           Met-ocean
RADAR, PME, KSA
KAUST–WHOI buoy
Synoptic and upper—University of Wyoming
GlobWave altimeter wave data                                Significant wave height   Wave model validation

                                                  Oceanic datasets
ECCO2, WOA, GLORYS2                                         Reanalyses                Initialization and boundaries
AVHRR, RADS                                                 Satellite                 Assimilation and validation
RSP, NEOM, Saudi Aramco Tidal Gauges, KAUST-WHOI buoy       In situ observations      Model validation
OSTIA, AVISO                                                Satellite
OTIS                                                        Simulation                Tidal forcing
ESA: Ocean Color Climate Change Initiative (OC-CCI) and     Satellite                 Ocean color/ecological
Sentinel-3 OLCI                                                                       indicators

developments. This review paper elaborates on our state-of-the-art modeling and forecasting
technologies, their applications, achievements in science, and contributions to industry. It
first provides a detailed description of our integrated data-driven Red Sea Modeling system,
version 1 (iReds-M1). It then catalogues some of our salient science findings and industrial
applications using iReds-M1 simulations. It finally lays down our vision for the future devel-
opment of the system and research directions.

The Integrated Red Sea Model (iReds-M1)
iReds-M1 is a comprehensive system comprising a set of state-of-the-art modeling compo-
nents for simulating the atmosphere, ocean, waves, transports, and biogeochemistry (as
schematized in Fig. 3). In its present form, the WRF Model is used to force various ocean and
transport models. The regional ocean and wave models, based on the MITgcm and WWIII, were
further recently fully coupled with WRF (Sun et al. 2019). These regional models are further
used to force transport models and to nest very high-resolution coastal ocean models. The
system is implemented on the Shaheen-II Cray XC40 supercomputer at KAUST, a 36-cabinet
Cray composed of 6,174 dual-socket compute nodes based on 16 core Intel Xeon E5-2698v3
processors running at 2.3 GHz, capable of delivering a theoretical peak of 7.2 PFLOP s−1
(Hadri et al. 2015). A description of the components follows.

The atmospheric models. WRF is a state-of-the-art mesoscale model offering numerous
advanced physics options for simulating atmospheric processes at various scales, provid-
ing a robust and flexible platform for assimilation (Skamarock et al. 2019). In various
baseline studies, WRF successfully reproduced the mean regional climate of the AP and its

AMERICAN METEOROLOGICAL SOCIETY
                                                                                      Unauthenticated     021    E103
                                                                                           J A N UA RY| 2Downloaded 10/23/21 10:29 PM UTC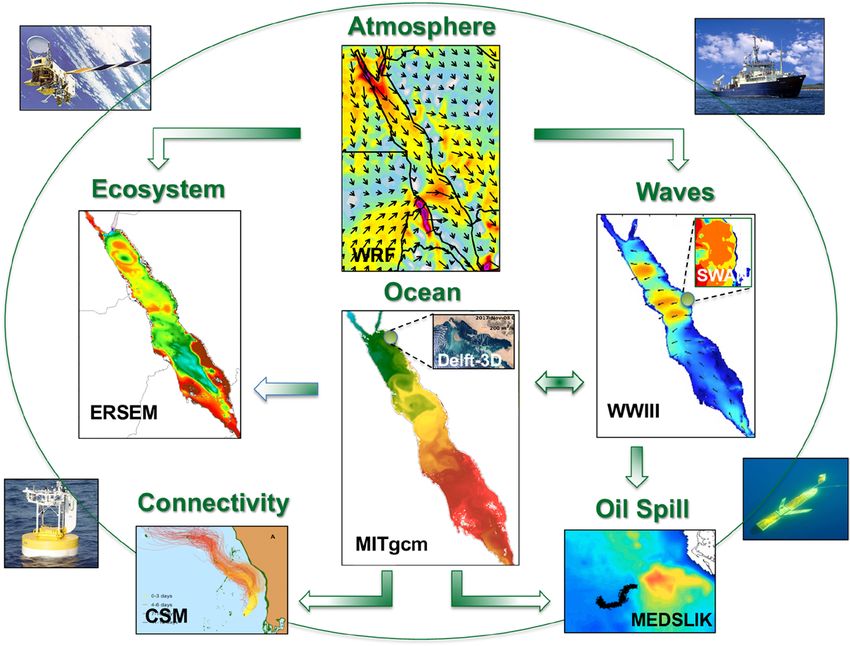
Fig. 3. Schematic illustration of the data-driven Red Sea modeling and prediction system (iReds-M1).
Two-way arrows signify two-way coupling, and one-way arrows represent forcing of uncoupled
components. The atmosphere panel shows mean wind speeds during the month of July from
5-km WRF Red Sea reanalysis. The ocean panel shows a sea surface temperature snapshot in
September with the upper-corner subpanel displaying the volume transport in the upper layer
of a high-resolution coastal nesting exercise in the NEOM region. The ecosystem panel shows the
simulated near-surface Chl-a during the winter-mixing period (January–March). The waves panel
shows a significant wave heights and mean wave directions snapshot in January with the upper-
corner subpanel displaying the distribution of maximum significant wave heights estimated from a
high-resolution nested coastal model long run covering the KAEC region. The connectivity and oil
spill panels show simulations of oil and virtual larvae trajectories released in the central Red Sea.

interannual variability (Viswanadhapalli et al. 2017). It also accurately delineated the struc-
ture and climatology of the monsoon low-level jet and monsoon inversion over the Arabian
Sea (Viswanadhapalli et al. 2020). We further used long-term WRF simulations to carry
out detailed assessments of renewable energy resources in the AP (Langodan et al. 2016a;
Dasari et al. 2019) and for analyzing extreme events (e.g., Viswanadhapalli et al. 2016).
   We have implemented WRF in assimilation mode at 5-km resolution using the ECMWF
global reanalysis as initial and boundary conditions to generate the first high-resolution
regional reanalysis for the region from 1980 to the present (Viswanadhapalli et al. 2017;
Langodan et al. 2017a,b). Available satellite and conventional observations in the AP were
assimilated (Fig. 4). The reanalysis fields are being used to study, for instance, the regional
meteorology–ocean (met-ocean) conditions (e.g., Viswanadhapalli et al. 2017, 2020), to
provide vital information about the background state of the regional environment (e.g.,
Dasari et al. 2020), and to force our regional ocean models (e.g., Langodan et al. 2014, 2016a;
Zhan et al. 2019; Krokos et al. 2021, manuscript submitted to J. Geophys. Res. Oceans).
   To simulate air parcel trajectories as well as transport, dispersion, chemical transformation,
and deposition, we use HYSPLIT (Draxler and Hess 1997). HYSPLIT, forced with specially

AMERICAN METEOROLOGICAL SOCIETY
                                                                           Unauthenticated     021    E104
                                                                                J A N UA RY| 2Downloaded 10/23/21 10:29 PM UTC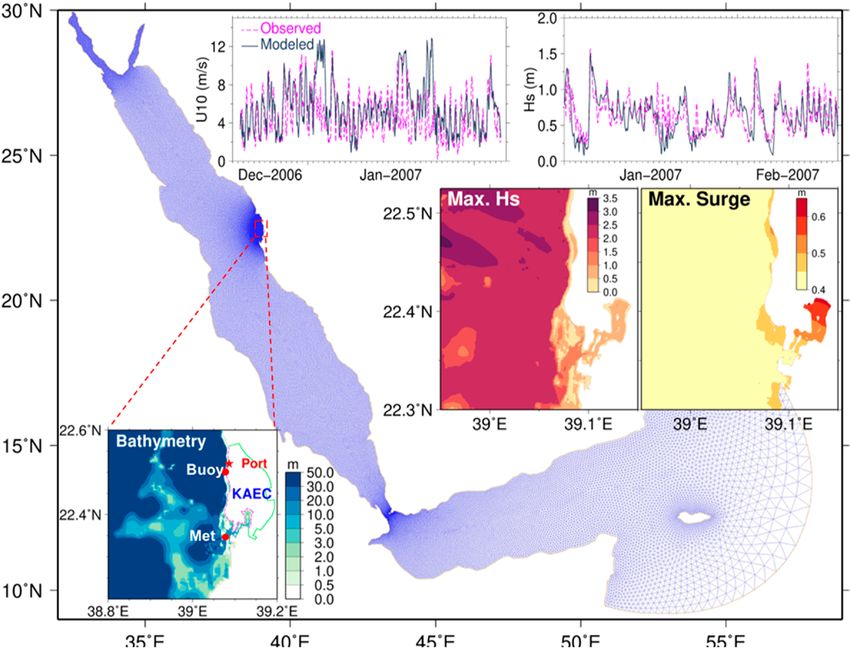
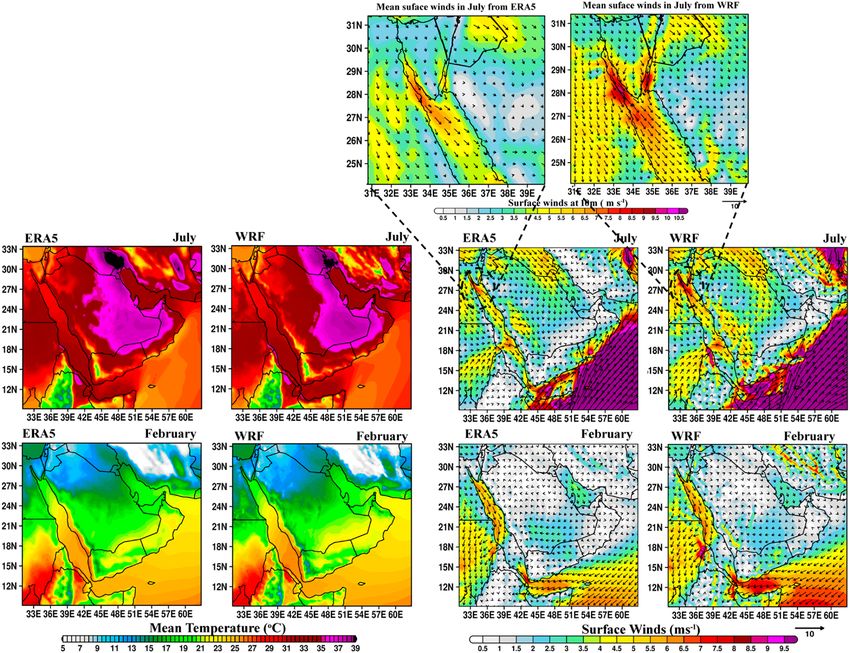
Fig. 4. The spatial distribution of (middle) summer (July) and (bottom) winter (February) months climatology of air tem-
perature at 2-m height, and winds at 10-m height from the 5-km Red Sea reanalysis compared against ERA5. The Red Sea
reanalysis reproduces well the main regional winds features in summer and winter, in good agreement with ERA5. (top)
Zoomed-in views over the northern Red Sea region to emphasize the wind features captured by the high-resolution Red
Sea reanalysis winds.

           generated WRF forcing at 600-m resolution, was recently used to investigate the distributions
           of air pollutant concentrations at sites along the Red Sea coast, including the NEOM and RSP
           regions (Dasari et al. 2020).

           The ocean models. The regional Red Sea circulation is simulated using a 1-km resolution
           MITgcm (Marshall et al. 1997a,b). The model domain covers the entire Red Sea including the
           two gulfs (Suez and Aqaba) at the north end, with an open boundary in the Gulf of Aden.
           The model topography is generated based on the General Bathymetric Chart of the Ocean
           (IOC et al. 2003), updated with available regional data. The eastern open boundary condi-
           tions are extracted daily from the global ocean reanalysis GLORYS2. To resolve the different
           frequencies of water elevation variations (Churchill et al. 2018), the normal velocity at the
           boundary is adjusted to match the volume flux of GLORYS2. The model is forced with hourly
           high-resolution WRF downscaled fields, including surface wind, air temperature, specific
           humidity, precipitation, and downward shortwave and longwave radiation. The Red Sea MITgcm
           outputs were validated against different datasets and in various settings and applications

           AMERICAN METEOROLOGICAL SOCIETY
                                                                                   Unauthenticated     021    E105
                                                                                        J A N UA RY| 2Downloaded 10/23/21 10:29 PM UTC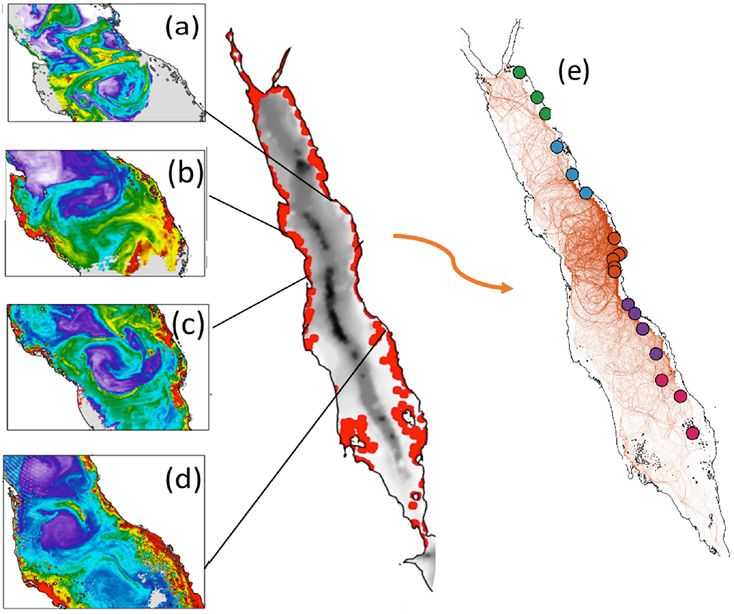
(Fig. 5). These include studying the general and overturning circulation (Yao et al. 2014a,b),
            mixed layer variations (Krokos et al. 2020, manuscript submitted to J. Geophys. Res. Oceans),
            deep-water formation events (Yao and Hoteit 2018), eddy characteristics (Zhan et al. 2016,
            2019), and internal/baroclinic tides (Guo et al. 2018). In addition, the adjoint model of MITgcm
            is being used to conduct sensitivity studies of quantities of interest with respect to the model
            states and atmospheric forcings (Zhan et al. 2018).
               WWIII (Tolman 2008) is used to simulate the waves conditions in the Red Sea at 1-km
            resolution. The model is configured with 33 frequencies, starting from 0.05 Hz and 36 equally
            spaced directions and the most recent (ST4) physics formulation (Ardhuin et al. 2010). The
            extensively validated model outputs (Langodan et al. 2014) were analyzed to assess the impact
            of atmospheric data assimilation on wave predictions (Langodan et al. 2016b), to investigate

Fig. 5. (a)–(d) Hovmöller diagrams (time vs water depth) of (a),(c) temperature (°C) and (b),(d) salinity (psu) at the Hanish
Sill, from June 1995 to November 1996, after filtering with a 20‐day low‐pass filter. (a),(b) 400-m-resolution southern Red
Sea MITgcm simulations taken from Xie et al. (2019) and (c),(d) in situ observations. (e),(f) Seasonal climatology of sea
level anomaly derived from (e) satellite altimetry data (AVISO) and (f) 1-km MITgcm for the period 2001–15, in summer
(June–August), autumn (September–November), winter (December–February), and spring (March–May). (g) RMSE and (h)
correlation coefficient between satellite derived SST (OSTIA) and 1-km daily MITgcm SST, time averaged over the model
simulation period of 2001–15. MITgcm successfully reproduces the main features of the general circulation of the Red Sea.

            AMERICAN METEOROLOGICAL SOCIETY
                                                                                       Unauthenticated     021    E106
                                                                                            J A N UA RY| 2Downloaded 10/23/21 10:29 PM UTC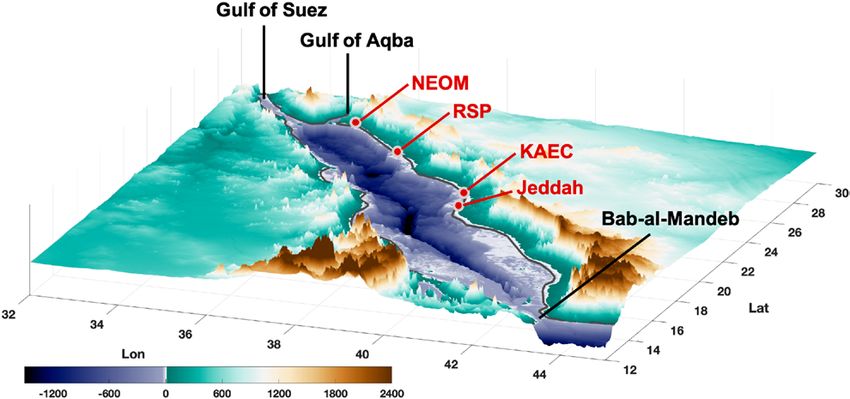
the physical aspects of the unique seasonally opposing wind-wave systems in the central
Red Sea (Langodan et al. 2015), to quantify wave energy potentials (Langodan et al. 2016a),
and to study the wind-wave climate and its trends (Langodan et al. 2017a,b, 2018, 2020a).
    Transport phenomena are simulated using CMS, a multiscale probabilistic model of particle
dispersal (Paris et al. 2013). CMS, driven by the MITgcm flow fields, has been successfully
implemented to study concentrate discharges (Zhan et al. 2015), biological connectivity among
different coral reef complexes at coastal (Nanninga et al. 2015), basin (Raitsos et al. 2017),
and cross-basin scales (Wang et al. 2019). Oil spill transport and weathering processes are
simulated with the well-established MEDSLIK oil spill, trajectory, and pollutant transport
prediction model (De Dominicis et al. 2013a,b; http://www.oceanography.ucy.ac.cy/medslik/) as
Lagrangian particles transported by ocean currents, wind, and waves, and a stochastic dis-
placement that parameterizes turbulent diffusion (Zodiatis et al. 2019).
    The marine biogeochemical cycle is simulated using ERSEM (Baretta et al. 1995). ERSEM
is a generic comprehensive model that has been successfully implemented across a wide
range of coastal and open-ocean ecosystems (e.g., Petihakis et al. 2002; Collingridge 2012).
It is based on a “functional” group approach, using size as the major biotic group charac-
teristic. The pelagic model food web consists of four phytoplankton groups, bacteria, and
three zooplankton groups, and is coupled with the associated benthic model that includes
the settling of organic detritus into the benthos and diffusional nutrient fluxes out of the
sediment. The pelagic variables include particulate and dissolved organic matter, along with
dissolved inorganic nutrients, allowing the coupling of biologically driven carbon dynamics
with the chemical dynamics. ERSEM forced with the outputs of our MITgcm and WRF model
outputs has been successfully implemented by Triantafyllou et al. (2014) to describe the main
seasonal features of the Red Sea ecosystem.
    To simulate complex coastal processes, we implemented ocean models specifically de-
signed for coastal and engineering applications at very high resolutions on the order of 10 m.
These include (i) the Delft3D model (Deltares 2016) to simulate coastal circulation, includ-
ing flow induced by tides and wind, and sediment transport, (ii) the shallow-water ADCIRC
model (Luettich and Westerink 2004) to simulate water level variations and surges on an
unstructured grid that enables resolution of near-shoreline detail, and (iii) the SWAN model
(Booij et al. 1999) that is coupled with both Delft3D and ADCIRC and designed for simulating
short crested waves in coastal environments. These models are forced with high-resolution
downscaled WRF fields and are nested within the regional MITgcm and WWIII models.

Coupled ocean–atmosphere modeling. Ocean temperatures over the Red Sea region play
an important role in modulating the region’s weather and climate (Gimeno et al. 2010;
Sun et al. 2019). Furthermore, while most of the AP experiences hot and dry summers, the
conditions in coastal regions east of the Red Sea are relatively cooler and humid owing to
transported moisture from the Red Sea. SKRIPS is a new regional coupled ocean–atmosphere
WRF + MITgcm + WWIII system that was developed as part of iReds-M1 to study air–sea
feedbacks in the Red Sea region and to build long-term regional forecasting capabilities
(Sun et al. 2019). Coupling between these components is based on ESMF (Hill et al. 2004) and
the interfaces are implemented according to the NUOPC consortium. This regional coupled
model allows for oceanic mixed layer heat and momentum to interact with the atmospheric
boundary layer dynamics at the mesoscale and higher resolution. This should reproduce
feedbacks that cannot be well resolved by coarse-resolution global coupled models and are
absent in regional uncoupled models. SKRIPS was used to investigate the heatwaves in the
Red Sea region on seasonal scales, demonstrating that the evolving ocean temperatures con-
siderably improve the prediction of the amplitude of these heatwaves (Fig. 6), particularly in
the coastal region (Sun et al. 2019).

AMERICAN METEOROLOGICAL SOCIETY
                                                                      Unauthenticated     021    E107
                                                                           J A N UA RY| 2Downloaded 10/23/21 10:29 PM UTC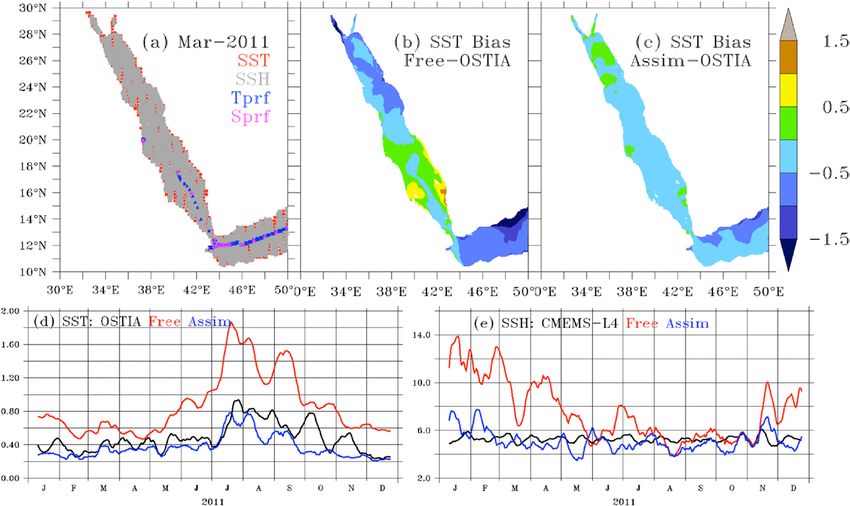
Fig. 6. Validation results for (top) SST and (bottom) surface air temperature (SAT), as simulated by the coupled SKRIPS
model (Sun et al. 2019). CPL, OCN.DYN, ATM.STA, and ATM.DYN denote the coupled WRF–MITgcm run, MITgcm-only
driven by ERA5, WRF-only run driven by persistent HYCOM SST, and WRF-only run driven by time-varying HYCOM SST,
respectively. SST is compared against GHRSST and SAT is compared against ERA5. The simulation initial time is 0000 UTC
1 Jun 2012 for all runs. Coupled and uncoupled runs well simulate SST and SAT in the Red Sea region with smaller RMSEs
from the coupled simulation compared to the validation data.

           Data assimilation. Assimilation is a process by which a model is constrained toward
           available observations to obtain improved forecasts/hindcasts (Edwards et al. 2015;
           Hoteit et al. 2018). Our atmospheric and ocean general circulation models are equipped
           with state-of-the-art assimilation packages: DART (Hoteit et al. 2013), which comprises
           advanced ensemble schemes (Anderson et al. 2009) and the adjoint-based ECCO-4DVAR
           system (Stammer et al. 2002; Hoteit et al. 2006) for MITgcm, and the extensive assimilation
           package of WRF (Barker et al. 2012), which also includes DART. We are currently employing
           a cyclic 3DVAR for assimilation with WRF (Viswanadhapalli et al. 2017) and an ensemble
           adjustment Kalman filter (EAKF) for MITgcm (Toye et al. 2017, 2018). We have recently
           further developed the DART–MITgcm system to operate with hybrid ensembles composed of
           flow-dependent and seasonally varying static members (Toye et al. 2020) and demonstrated
           significant improvements when driving the MITgcm with ensembles of forcing and physics
           (Sivareddy et al. 2020). We are currently working on tuning DART for WRF and on testing
           newly introduced ensemble assimilation schemes (Hoteit et al. 2015; Raboudi et al. 2018).
           The system is being further equipped with new efficient techniques for simulating transport

           AMERICAN METEOROLOGICAL SOCIETY
                                                                                   Unauthenticated     021    E108
                                                                                        J A N UA RY| 2Downloaded 10/23/21 10:29 PM UTC
phenomena (El-Mohtar et al. 2018) and control of unmanned vehicles (Wang et al. 2016;
Albarakati et al. 2019) under the uncertainties described by the ensembles.
We assimilate a variety of observations from different networks, including satellite (e.g.,
altimeter SSH and AVHRR SST in the ocean, and QuikSCAT and Advanced Scatterometer
winds in the atmosphere) and land-based remote sensing (e.g., weather radars), station-
based (e.g., oceanic temperature and salinity observations from moored buoys and ships,
meteorological observations from synoptic stations and METAR) and freely drifting (e.g., Argo
observations in the ocean and upper-air soundings of rawinsonde and pilot balloon) in
situ observations. Figure 7 demonstrates the important improvement achieved after ocean
assimilation, with significant reduction in the SST and SSH biases in the Red Sea and Gulf of
Aden compared to the model free run. On average, assimilation reduced the forecast RMSEs
by 0.5°C for SST and 3 cm for SSH. The assimilated ocean solution is closer to both SST and
SSH observations than the corresponding interpolated level-4 products. An operational sys-
tem for the Red Sea is currently being developed based on a hybrid ensemble assimilation
scheme as part of a project with Saudi Aramco.
Visualization and data analytics. Advanced visualization is an integral component of our
system to support data analysis tasks for scientists and nonexpert users. We have developed
a visual analytics application, called RedSeaAtlas (Afzal et al. 2019a), considering the tasks
and computational and operational requirements of the variety of simulation models and
Fig. 7. Impact of assimilation in the ensemble DART–MITgcm assimilation system. (a) The spatial
distribution of SST, SSH, and in situ temperature and salinity observations that were assimilated
in the DART–MITgcm ocean ensemble system during an arbitrary month (March 2011). The cover-
age of the regularly spaced SST observations (red dots) is mostly masked by that of along-track
SSH (gray dots) observations, which cover most of the Red Sea basin over a 1-month period. The
SST bias for (b) free- and (c) assimilative-model runs estimated over the period 1 Mar–31 Dec 2011
with respect to OSTIA, a 5-km-resolution daily available interpolated level-4 gridded product
generated by blending satellite and in situ observations of SST. Also shown are the time series
of forecast RMSEs averaged over the model domain for (d) SST (°C) and (e) SSH (cm). Black, red,
and blue curves correspond to RMSEs of OSTIA for SST and CMEMS-L4 for SSH (available daily at
25-km resolution), and free- and assimilative-model runs, respectively.
AMERICAN METEOROLOGICAL SOCIETY
Unauthenticated 021 E109
J A N UA RY| 2Downloaded 10/23/21 10:29 PM UTCobservational datasets of the Red Sea region. The application provides a suite of visualiza-
tion tools that can facilitate diverse research tasks through interactive visual exploration
and analysis of spatiotemporal multivariate data (Fig. 8). These include interactive feature
selection, spatial and temporal filtering, overview and details on demand, and capability to
analyze data from disparate data sources (Afzal et al. 2019b).
We have also developed an interactive visual analysis framework, called Ovis
(Höllt et al. 2013, 2014), for interactive exploration and analysis of ensemble data. The core
components of this framework are constructed based upon an efficient GPU-based computa-
tion and visualization pipeline. We presented two case studies to showcase the effectiveness
of this framework: the first investigated the placement planning and operation of offshore
structures related to oil and gas industry, and the second demonstrated the effectiveness of
this system to plan pathways of autonomous sea vehicles (gliders) through interactive explo-
ration and analysis of ensemble data (Höllt et al. 2013, 2015).
iReds salient contributions to science and industry
Study of the Red Sea region circulation, climate, and ecosystem.
Atmospheric variability. Motivated by the background knowledge from the analysis of global
fields, and to meet the need for high-resolution datasets to resolve mesoscale characteris-
tics, we developed a regional reanalysis at 5-km resolution for a 39-yr (1980–2018) period
(wind details captured by this regional reanalysis are illustrated in Fig. 4). The reanalysis
fields accurately reproduced the known regional climatic features such as the Red Sea
Trough, Red Sea Convergence Zone, Arabian anticyclone, and seasonal circulation patterns
(Viswanadhapalli et al. 2017). It has been further extensively used to drive iReds ocean models
and for subsequent regional applications, and to support the mega-projects being developed
along the Red Sea coast. Several studies were also conducted using convective-permitting
WRF configurations to investigate the predictability of extreme rainfall over the Mecca region,
discussed more in detail below.
Fig. 8. The RedSeaAtlas system showing overall wind patterns and statistics (at the dropped pin location, here north of
Jeddah in the central Red Sea) of extreme temperature events in the Red Sea. Users can select any region to show more
detailed information and associated attributes through different charts (Afzal et al. 2019b).
AMERICAN METEOROLOGICAL SOCIETY
Unauthenticated 021 E110
J A N UA RY| 2Downloaded 10/23/21 10:29 PM UTCBased on global reanalyses, our study of the regional surface air temperature suggested
that it is strongly modulated by the circulation patterns (Attada et al. 2018a,b), and demon-
strated an impact of the Indian summer monsoon through westward-propagating Rossby
waves (Attada et al. 2018c). Dasari et al. (2018) and Dasari et al. (2021, manuscript submitted
to J. Climate) showed that the baroclinic instability induced by the intensification and south-
ward shift of the subtropical westerly jet over the AP facilitates an increase in the passage
of synoptic transients and winter rainfall. Kunchala et al. (2018, 2019) showed a significant
increasing trend in the recent decade in the summer AOD over AP, related to an intensifica-
tion of the Tokar jet.
Ocean general circulation. The Red Sea MITgcm has provided an unprecedented description
of the 3D basin circulation and its seasonal and interannual variability. The local buoyancy
forcing and Indian monsoon seasonally reverse the basin overturning circulation, and ulti-
mately modulate the water exchanges with the Gulf of Aden through BaM (Yao et al. 2014a,b).
Analysis of the interannual variability of the exchanges based on long-term MITgcm
simulations forced with the in-house high-resolution regional Red Sea reanalysis further
demonstrated a strong dependence on the intensity and duration of the Indian monsoon
(Raitsos et al. 2015; Dreano et al. 2016; Xie et al. 2019). Such simulations also revealed the
episodic nature of deep-water renewal related to specific atmospheric events and provided
updated estimates of the deep-water renewal time Yao and Hoteit (2018). A 1-km model simu-
lation together was recently analyzed to provide a detailed description of the seasonal and
spatial variability of the Red Sea mixed layers (Krokos et al. 2020, manuscript submitted to J.
Geophys. Res. Oceans). The study revealed the dominant role of the air–sea heat fluxes on the
mixed layers seasonal variability and the north–south gradient while the effects of extreme
evaporation mainly manifest on interannual time scales.
MITgcm–ERSEM–CMS simulations, combined with various remote sensing datasets, have
provided new insights into the manner in which physical drivers such as buoyancy fluxes and
ocean mixing, and biogeochemical processes drive the ecosystem in the Red Sea. Despite a
limited supply of nutrients, their subsurface intrusion from the Gulf of Aden and the winter
deep convection drive elevated values of primary productivity in the south during summer
(Raitsos et al. 2013; Dreano et al. 2016) and in the north during winter (Gittings et al. 2018).
Moreover, marine larvae/planulae disperse nearly passively with the circulation, forming a
homogeneous genetic connectivity across geographically separated reef sites within most of
the basin (Fig. 9; Raitsos et al. 2017), except for the southern Red Sea, which was suggested
to be physically connected with the Indian Ocean (Wang et al. 2019).
Mesoscale circulation. The upper-layer Red Sea circulation is characterized by complex
and highly varying mesoscale activity, consisting of energetic semipermanent and transient
eddies, with stronger activity during winter (Zhan et al. 2014). Spatially, the central and
northern regions show annual eddy kinetic energy (EKE) peaks during both seasons, with
effects on the water column reaching down to 300 m and intensified toward the surface.
The MITgcm outputs suggested that the northward gradient of heat loss tilts the isopycnals,
which gradually deepen toward the north, thereby enabling baroclinic instabilities and hence
the eddy generation (Zhan et al. 2016). The EKE dominates the mean-flow kinetic energy
(Zhan et al. 2016), with the fate of observed eddies being largely governed by atmospheric
forcing and local ocean conditions (Zhan et al. 2018). Driven by considerable heat fluxes, in-
tensified eddy activity promotes convection processes, especially during winter in the north
(Papadopoulos et al. 2013, 2015). The northward transport of warmer and fresher water by
eddies reduces the intrinsic meridional gradient and flattens the isopycnals, which in turn
limits the eddy generation and was interpreted as a typical negative feedback mechanism
AMERICAN METEOROLOGICAL SOCIETY
Unauthenticated 021 E111
J A N UA RY| 2Downloaded 10/23/21 10:29 PM UTC(Zhan et al. 2019). Based on WRF–MITgcm–
CMS simulations, the Red Sea mesoscale
circulation was found to play an important
role in transporting biogeochemical tracers
within the basin (Fig. 9) and in supporting
the marine ecosystem (Zhan et al. 2014;
Dreano et al. 2016; Raitsos et al. 2017;
Guo et al. 2021, manuscript submitted to J.
Geophys. Res. Oceans).
Tides. The main tidal signal in the Red Sea
propagates from the Arabian Sea through
BaM. Observations and simulations suggest
a high variability of tidal elevation with lati-
tude, with the northern and southern basins
exhibiting relatively large amplitudes com-
pared to the central basin (Guo et al. 2016). Fig. 9. Remotely sensed ocean color observations portray-
Barotropic tides generate internal tides ing surface flow (eddies and currents) between coral reefs
in the Red Sea. (a)–(d) Chlorophyll (mg m –3) patterns at dif-
and solitary waves, mainly on the steep
ferent time periods (1 Jun 2010, 21 Jun 2009, 4 Mar 2006,
sides of the deep trough in the southern and 13 Apr 2001, respectively) illustrating the impact of the
part of the Red Sea (da Silva et al. 2012; basinwide mesoscale variability on the basin productivity.
Guo et al. 2016). Our simulations using a The central map depicts seafloor elevation and the position
200-m nonhydrostatic MITgcm and CMS of coral reefs (red circles) in the Red Sea (coral reef positions
showed that the breaking of internal waves were acquired from Global Distribution of Coral Reefs 2010;
https://data.unep-wcmc.org/datasets/1). (e) Simulated particle
induces vertical mixing, which could in-
dispersion trajectories forming pathways of connectivity
crease the supply of nutrients to the euphotic in the Red Sea. Particles were released from the locations
zone and enhance biological productivity, of the coral reefs along the east coast of the central Red
by disrupting the pycnocline and inducing Sea. The different colors denote each of the five different
turbulence (Guo et al. 2020, manuscript Red Sea provinces (Raitsos et al. 2013). The panel suggests
submitted to J. Geophys. Res. Oceans). basinwide connectivity with the central Red Sea driven by
mesoscale activity, except for the southern Red Sea, which
connects more with the Gulf of Aden (Raitsos et al. 2017;
Waves. Based on long-term WWIII simula- Wang et al. 2019).
tions forced with the in-house WRF down-
scaled Red Sea reanalysis, the wave vari-
ability in the Red Sea was naturally associated with the dominant regional wind regimes
(Langodan et al. 2014). Although wind intensity in the basin is usually moderate, a prolonged
duration and the existence of a long fetch may give rise to waves that reach up to 3.5 m. The
irregular shape of the Red Sea coast creates shadowed areas, especially in the south where
southward-moving waves reduce to swell and propagate unidirectionally. During summer,
consistent northwesterly winds generate mean wave heights of 1–1.5 m in the north, frequently
exceeding 2 m (Langodan et al. 2014, 2018). The southward wave system persists throughout
the year, while the northward system associated with the monsoon winds exhibits a well-
defined seasonality between October and April (Langodan et al. 2018). The coexistence of
northward and southward waves in winter creates a convergence zone in the central Red Sea
(Langodan et al. 2015). Various transversal jets, such as the Tokar jet on the Sudan coast and
others that originate in the AP generate locally dominant wave regimes (Langodan et al. 2017b).
These exhibit strong seasonality and are usually dominated by other systems.
Ecological indicators. The recent development of multisensor satellite missions, such as the
Ocean Color Climate Change Initiative (OC-CCI; Sathyendranath et al. 2019), has increased
AMERICAN METEOROLOGICAL SOCIETY
Unauthenticated 021 E112
J A N UA RY| 2Downloaded 10/23/21 10:29 PM UTCthe coverage of surface Chl-a measurements in the Red Sea by enhancing the retrieval of
satellite data under adverse atmospheric conditions. Using available in-water measurements
of Chl-a, Brewin et al. (2013, 2019) and Racault et al. (2015) have shown that both standard
ocean-color algorithms and the OC-CCI algorithm perform well in the Red Sea, but further
improvements have been achieved by developing a regional algorithm specifically tuned to
the basin (Brewin et al. 2015).
The analysis of the derived long-term Chl-a dataset together with the MITgcm, WRF,
CMS, and ERSEM simulations has enabled an unprecedented understanding of the general
functioning of the Red Sea ecosystem and its productivity. The open waters of the Red Sea
Chl-a exhibit a distinct seasonality with maximum concentrations seen during wintertime,
which was attributed to vertical mixing in the north and wind-induced horizontal intru-
sion of nutrient-rich water in the south, and minimum concentrations during summer
(Raitsos et al. 2013). However, large sporadic blooms have been reported during summer in
the coastal southern Red Sea driven by the GAIW (Racault et al. 2015; Dreano et al. 2016).
The concentration and the duration of the phytoplankton growing season in the Red Sea are
modulated by the strength of the winter monsoon over the Arabian Sea, which affects the
horizontal advection of fertile waters from the Indian Ocean (Raitsos et al. 2015). Warmer
conditions over the region were also associated with substantially weaker winter phyto-
plankton blooms, which initiate later and are shorter in their overall duration (~4 weeks)
(Gittings et al. 2018, 2019). Satellite-derived estimates of phytoplankton size structure
are in good agreement with the in situ measurements, and also capture the spatial vari-
ability related to regional mesoscale dynamics (Gittings et al. 2019b). iReds outputs were
also used along with in situ and satellite observations to investigate the basin ecological
responses to the combined effects of biogeochemical and physical environmental stressors
(Ellis et al. 2019).
High-resolution nested modeling in support of new mega-developments along the Red
Sea coast.
Met-ocean modeling in NEOM. NEOM spreads over an area of 26,500 km2 along the northern
Red Sea coast of Saudi Arabia, bordering Jordan and Egypt. To support environmental impact
assessment efforts and to generate essential met-ocean data required for initial planning,
high-resolution atmospheric and oceanic models were implemented and nested within the re-
gional Red Sea models. A 3-yr 600-m-resolution WRF simulation was performed to investigate
the orographic influence on the coastal atmospheric conditions and to drive high-resolution
coastal ocean models. Air quality was also investigated using HYSPLIT driven by the WRF
fields to study dispersion of pollutants and their diurnal variations in relation to the land–sea
breezes and boundary layer heights (Dasari et al. 2020).
The large-scale ocean circulation of the NEOM region simulated by the regional MITgcm
suggests numerous eddy features, with the topography being the critical factor driving their
interactions. A coupled Delft3D + SWAN model configuration with horizontal resolution of
50 m and 10 vertical sigma levels was nested within MITgcm to resolve the coastal circula-
tions and was forced with tides and 600-m WRF fields. Seasonal simulations highlighted
different coastal circulation features, including a prominent localized eddy-like structure in
the center of the NEOM lagoon where the inner water connects with the open ocean through
a narrow channel, and a persistent northwest–southeast current along the broad offshore
edge of the coral reefs. The “residence time” estimates based on trajectories of simulated
passive particles suggests a faster ventilation rate in winter. The SWAN model nested within
the regional WWIII suggested a dominance of locally generated waves in the southeast
direction, with a maximum significant wave height of ~0.8 m, associated with consistent
strong northwesterlies.
AMERICAN METEOROLOGICAL SOCIETY
Unauthenticated 021 E113
J A N UA RY| 2Downloaded 10/23/21 10:29 PM UTCExtreme waves and water levels for KAEC. KAEC is a new city under development along
the western Saudi coast, comprising the largest port on the Red Sea, residential districts,
and an industrial valley. The area is surrounded by coral reefs and includes a shallow
lagoon on its southern side. We supported the development of the sea wall for coastal
protection by providing estimates of extreme wave heights and water levels for the KAEC
shoreline. For this, we used a coupled ADCIRC + SWAN model configured on a triangular
grid with an open boundary in the Arabian Sea. The model’s unstructured-grid resolution
varied from a maximum vertex spacing of approximately 60 km near the boundary down
to 60 m near the KAEC coastline. The bathymetry was generated from 0.5-m-resolution
lidar surveys of the KAEC coast. Simulations were carried out for a 30-yr period, forced
with the our WRF downscaled atmospheric reanalysis. Extreme value analyses were
applied to estimate different return levels of wave heights and water levels. The model
effectively simulated the dampening of the offshore waves propagating toward the shore-
line by the coral reefs (Fig. 10). The KAEC coastline being characterized by a weak tidal
regime, extreme sea levels are dominated by meteorological activity, mostly observed
during winter. The 100-yr return levels of wave heights and water level were estimated
at 70 and 65 cm, respectively, only marginally (~5 cm) different from the 30-yr maxima
(Langodan et al. 2020b; Antony et al. 2021).
Fig. 10. Coupled ADCIRC + SWAN model domain used for estimating extreme wave heights and
water levels along the KAEC coastline. The unstructured grid resolution varies from 60 km near
the boundary in the Arabian Sea to 60 m near the KAEC coastline. The bathymetry of the KAEC
and maximum of significant wave heights and water levels from 30-yr simulations are also shown
in the inset images. The model–data comparisons at the locations indicated in the bathymetry
plot (“Met” for winds and “Buoy” for waves) suggest a good agreement between the model
simulations and the measurements.
AMERICAN METEOROLOGICAL SOCIETY
Unauthenticated 021 E114
J A N UA RY| 2Downloaded 10/23/21 10:29 PM UTCRegional forecasting applications
Extreme rainfall forecasting. The KSA is characterized by a hot and arid desert climate.
Occasionally, extreme precipitation events over the Jeddah region have led to flooding that
caused extensive loss of human life and damage to infrastructure (e.g., de Vries et al. 2013).
The large-scale features are important factors in producing regional extreme precipitation,
which may exceed 3 times the average annual rainfall. These heavy rainfall events are associ-
ated with the northward extension of the Red Sea trough and intensification of the Arabian
anticyclone, which provide warm moist air to the region, creating favorable conditions for the
development of a short-lived quasi-stationary mesoscale convective systems (Dasari et al. 2018).
Using a convective-permitting WRF configuration, Viswanadhapalli et al. (2016) assessed the
predictability of two extreme rainfall events formed over Jeddah while assimilating various
combinations of conventional and satellite observations (Fig. 11a). A similar WRF configu-
ration was implemented by Dasari et al. (2017) to study the Mecca 2016 extreme rainfall
event. More recently, Luong et al. (2020) investigated the impact of urbanization using WRF
by incorporating an urban canopy model and urban land cover for several extreme weather
events over Jeddah showing that urbanization enhanced rainfall by ~25%.
Oil spill forecasting. iReds is regularly used to support oil spill prediction efforts. As an
example, we have supported the Saudi authorities in the southern Red Sea by simulating a
realistic oil spill scenario from an abandoned oil tanker filled with oil and anchored at Ras
Isa port north of Hudaydah off the coast of Yemen. The ship, which has not been operational
since March 2015, is corroding and there are serious concerns that the gas building up in
the storage tanks could lead to an explosion that might trigger an oil spill (Meredith 2019).
The tanker carries an estimated volume of 1 million barrels of crude oil, 4 times the amount
of oil released in the 1989 Exxon Valdez oil spill. MEDSLIK was used to model the transport
and fate of oil for winter and summer scenarios. Forecast winds, waves and ocean currents
generated by iReds during the first 2 weeks of February and August 2019 have been used as
Fig. 11. (a) Evolution of reflectivity as predicted by WRF with assimilation of conventional and satellite radiance data against
PME DWR data during Jeddah extreme rainfall event at 0300 and 0800 UTC 25 Nov 2009 (Viswanadhapalli et al. 2016).
(b) Concentration of oil (in barrels km2) after 14 days of spill from the tanker location marked by the blue dot. Red dots
indicate beached spill locations. The investigated region is indicated by the red box in the inset Red Sea basin panel.
AMERICAN METEOROLOGICAL SOCIETY
Unauthenticated 021 E115
J A N UA RY| 2Downloaded 10/23/21 10:29 PM UTCinputs. The oil was continuously released at the tanker location (15°15΄11�N, 42°36΄52�E) over
the 2-week simulation period. Figure 11b shows the concentration of oil (in barrels km−2) at
the end of the simulation period. Following the pattern of the predicted ocean circulation, the
oil was transported northeast, where about 60% of its volume washed up onshore. Twenty
percent of the remaining oil formed a surface slick of about 55 km2 in size and the other 20%
evaporated.
Future directions
iReds has so far contributed new insights into the regional atmospheric and oceanic circula-
tions, their variability, and trends in the Red Sea basin. Outputs from its various long-term
simulations established, in particular, a unique basinwide eddy activity and its driving forces, a
prominent seasonally varying overturning circulation modulated by the Indian monsoon, and
the occasional fast ventilation of its deep waters through deep water formation events forced
by cold weather anomalies in its northern end. The system was further critically important in
supporting the ongoing mega-projects along the Red Sea shores, providing unique informa-
tion about the regional environment to optimize the design and the operations of these new
developments. It further developed for the first time regionally tuned forecasting capabilities
that were successfully tested during urgent environmental situations.
We are envisioning, and have already started working along several directions, to imple-
ment new capabilities and continue enhancing iReds performances in the future, while further
deepening our understanding of the regional circulation and variability. Our ultimate goal is
to develop an integrated data-driven modeling and forecasting system that incorporates all
available oceanic and atmospheric observations in the Red Sea region and makes predictions
and actionable information available to scientists, government and industry, and nonexpert
recipients. In this regard, the first Red Sea operational system is expected to be released
online during 2021 to provide weekly forecasts of the basinwide atmospheric (WRF)–oceanic
(MITgcm)–wave (WWIII) conditions at 4-, 2-, and 1-km resolutions, respectively. It will be
subsequently equipped with state-of-the-art interactive visualization and data analytics to
provide decision makers with real-time access to relevant information. Future work will then
focus on (i) equipping iReds with new capabilities for forecasting aerosols (dust and pollution)
and the marine biogeochemistry and (ii) extending the forecasting time range of the system to
subseasonal-to-seasonal and annual scales through a combination of coupled modeling and
data assimilation, and spatial range to the urban and coastal scales through downscaling.
iReds developments. Beyond the importance of predicting dust and atmospheric pollution,
aerosols play a crucial role in the radiation budget and the development of clouds and precipita-
tion. They are also an important source of nutrients for the Red Sea ecosystem. So far, aerosol
variations have only been climatologically accounted for in iReds. WRF is equipped with
state-of-the-art modules to simulate and study aerosols (WRF-Chem), and we have recently
implemented it over the AP. We are currently working on developing high-resolution aerosol
emission inventories (natural, anthropogenic, and biogenic) on daily scales by tuning satel-
lite remote sensing retrieval algorithms with available in situ measurements. These will be
incorporated/assimilated into WRF-Chem to simulate and predict dust storms and outbreaks
of industrial and urban haze pollution.
As part of the newly established Center of Excellence for NEOM research at KAUST, our
modeling system will be further expanded to investigate oceanic and atmospheric circulations
at the urban scales. Work is already underway with external collaborators at Imperial College
(United Kingdom) and Deltares Institute (Netherlands) to build the required computational
fluid dynamics (CFD) algorithms in order to downscale our models’ outputs and capabilities
at these scales. In this regard, we have further recently introduced and successfully tested a
AMERICAN METEOROLOGICAL SOCIETY
Unauthenticated 021 E116
J A N UA RY| 2Downloaded 10/23/21 10:29 PM UTCYou can also read


