Arabitol, mannitol, and glucose as tracers of primary biogenic organic aerosol: the influence of environmental factors on ambient air ...
←
→
Page content transcription
If your browser does not render page correctly, please read the page content below
Atmos. Chem. Phys., 19, 11013–11030, 2019
https://doi.org/10.5194/acp-19-11013-2019
© Author(s) 2019. This work is distributed under
the Creative Commons Attribution 4.0 License.

Arabitol, mannitol, and glucose as tracers of primary biogenic
organic aerosol: the influence of environmental factors on ambient
air concentrations and spatial distribution over France
Abdoulaye Samaké1 , Jean-Luc Jaffrezo1 , Olivier Favez2,3 , Samuël Weber1 , Véronique Jacob1 , Trishalee Canete1 ,
Alexandre Albinet2,3 , Aurélie Charron1,4 , Véronique Riffault5 , Esperanza Perdrix5 , Antoine Waked1 ,
Benjamin Golly1 , Dalia Salameh1,a , Florie Chevrier1,6,13 , Diogo Miguel Oliveira2,5 , Jean-Luc Besombes6 ,
Jean M. F. Martins1 , Nicolas Bonnaire7 , Sébastien Conil8 , Géraldine Guillaud9 , Boualem Mesbah10 , Benoit Rocq11 ,
Pierre-Yves Robic12 , Agnès Hulin13 , Sébastien Le Meur14 , Maxence Descheemaecker15 , Eve Chretien16 ,
Nicolas Marchand17 , and Gaëlle Uzu1
1 University Grenoble Alpes, CNRS, IRD, INP-G, IGE (UMR 5001), 38000 Grenoble, France
2 INERIS,  Parc Technologique Alata, BP 2, 60550 Verneuil-en-Halatte, France
3 Laboratoire Central de Surveillance de la Qualité de l’Air (LCSQA), 60550 Verneuil-en-Halatte, France
4 IFSTTAR, 69675 Bron, France
5 SAGE – Département Sciences de l’Atmosphère et Génie de l’Environnement, IMT Lille Douai, University Lille,

59000 Lille, France
6 University Savoie Mont-Blanc, LCME, 73000 Chambéry, France
7 LSCE, UMR CNRS-CEA-UVSQ, 91191 Gif-sur Yvette, France
8 ANDRA DRD/GES Observatoire Pérenne de l’Environnement, 55290 Bure, France
9 Atmo Auvergne-Rhône-Alpes, 38400 Grenoble, France
10 Air PACA, 13294 Marseille France
11 Atmo Hauts de France, 59000 Lille, France
12 Atmo Occitanie, 31330 Toulouse, France
13 Atmo Nouvelle Aquitaine, 33000 Bordeaux, France
14 Atmo Normandie, 76000 Rouen, France
15 Lig’Air, 45590 Saint-Cyr-en-Val, France
16 Atmo Grand Est, 16034 Strasbourg, France
17 University Aix Marseille, LCE (UMR7376), 13331 Marseille, France
a now at: Airport pollution control authority (ACNUSA), 75007 Paris, France

Correspondence: Abdoulaye Samaké (abdoulaye.samake2@univ-grenoble-alpes.fr)
and Jean-Luc Jaffrezo (Jean-luc.Jaffrezo@univ-grenoble-alpes.fr)

Received: 7 May 2019 – Discussion started: 20 May 2019
Revised: 16 July 2019 – Accepted: 29 July 2019 – Published: 29 August 2019

Abstract. The primary sugar compounds (SCs, defined as          for 16 increasing space scale sites (local to nationwide),
glucose, arabitol, and mannitol) are widely recognized as       over at least 1 complete year. These sites are distributed in
suitable molecular markers to characterize and apportion pri-   several French geographic areas of different environmental
mary biogenic organic aerosol emission sources. This work       conditions. Our analyses, mainly based on the examination
improves our understanding of the spatial behavior and dis-     of the short-term evolutions of SC concentrations, clearly
tribution of these chemical species and evidences their ma-     show distance-dependent correlations. SC concentration evo-
jor effective environmental drivers. We conducted a large       lutions are highly synchronous at an urban city scale and
study focusing on the daily (24 h) PM10 SC concentrations       remain well correlated throughout the same geographic re-

Published by Copernicus Publications on behalf of the European Geosciences Union.
11014                    A. Samaké et al.: Arabitol, mannitol, and glucose as tracers of primary biogenic organic aerosol

gions, even if the sites are situated in different cities. How-   son and Streets, 2009; Sesartic and Dallafior, 2011; Tanarhte
ever, sampling sites located in two distinct geographic areas     et al., 2019).
are poorly correlated. Such a pattern indicates that the pro-        Recently, source-specific tracer methodologies have been
cesses responsible for the evolution of the atmospheric SC        introduced to estimate their contribution to aerosol loadings
concentrations present a spatial homogeneity over typical ar-     (Di Filippo et al., 2013; Gosselin et al., 2016; Li et al.,
eas of at least tens of kilometers. Local phenomena, such as      2018; Medeiros et al., 2006b; Verma et al., 2018; Wang et
the resuspension of topsoil and associated microbiota, do no      al., 2018). Indeed, atmospheric organic aerosols (OAs) con-
account for the major emissions processes of SC in urban          tain specific chemical species that can be used as reliable
areas not directly influenced by agricultural activities. The     biomarkers in tracing the sources and abundance of PBOA
concentrations of SC and cellulose display remarkably syn-        (Bauer et al., 2008; Gosselin et al., 2016; Holden et al., 2011;
chronous temporal evolution cycles at an urban site in Greno-     Jia et al., 2010; Li et al., 2018; Medeiros et al., 2006b; Wang
ble, indicating a common source ascribed to vegetation. Ad-       et al., 2018). For instance, among sugar alcohols, arabitol
ditionally, higher concentrations of SC at another site located   and mannitol (two common storage soluble carbohydrates in
in a crop field region occur during each harvest periods, in-     fungi) have been recognized as tracers for airborne fungi, and
dicating resuspension processes of plant materials (crop de-      their concentrations are widely used to estimate PBOA con-
tritus, leaf debris) and associated microbiota for agricultural   tributions to OA mass (Amato et al., 2017; Bauer et al., 2008;
and nearby urbanized areas. Finally, ambient air temperature,     Buiarelli et al., 2013; Golly et al., 2018; Medeiros et al.,
relative humidity, and vegetation density constitute the main     2006b; Samaké et al., 2019; Srivastava et al., 2018; Verma
effective drivers of SC atmospheric concentrations.               et al., 2018; Weber et al., 2018, 2019). Similarly, glucose has
                                                                  also been used as a tracer for plant materials (such as pollen,
                                                                  leaves, and their fragments) or soil emissions within various
                                                                  studies around the world (Chen et al., 2013; Medeiros et al.,
                                                                  2006b; Pietrogrande et al., 2014; Rathnayake et al., 2017;
1   Introduction                                                  Rogge et al., 2007; Wan et al., 2019; Xiao et al., 2018; Zhu
                                                                  et al., 2015).
Primary biogenic organic aerosols (PBOAs), which notably             In this context, atmospheric concentrations of specific
comprise bacterial and fungal cells or spores, viruses, or mi-    sugar alcohols and/or primary monosaccharides (including
crobial fragments such as endotoxins and mycotoxins as well       glucose) have been previously quantified at sites in several
as pollens and plant debris, are ubiquitous particles released    continental, agricultural, coastal, or polar regions (Barbaro
from the biosphere to the atmosphere (Amato et al., 2017;         et al., 2015; Chen et al., 2013; Glasius et al., 2018; Li et al.,
Fang et al., 2018; Martin et al., 2010; Perrino and Marcovec-     2018; Pietrogrande et al., 2014; Verma et al., 2018; Wan et
chio, 2016; Wéry et al., 2017). PBOA can contribute signif-       al., 2019; Yan et al., 2019; Yttri et al., 2007). However, large
icantly to the total coarse aerosol mass (Amato et al., 2017;     datasets investigating their (multi)annual cycles and seasonal
Bozzetti et al., 2016; Coz et al., 2010; Fröhlich-Nowoisky        and simultaneous short-term variations at multiple spatial-
et al., 2016; Jaenicke, 2005; Manninen et al., 2014; Morris       scale resolutions (i.e., from local to continental) are still lack-
et al., 2011; Samaké et al., 2019; Vlachou et al., 2018; Yue      ing (Liang et al., 2013; Nirmalkar et al., 2018; Pietrogrande
et al., 2017). Besides their expected negative human health       et al., 2014; Yan et al., 2019). Such records are essential to
effects (Fröhlich-Nowoisky et al., 2009, 2016; Humbal et          better understand the spatial behavior of primary sugar com-
al., 2018; Lecours et al., 2017; Zamfir et al., 2019), they       pound (SC) concentrations (i.e., glucose, arabitol, and man-
substantially influence the carbon and water cycles at the        nitol) and PBOA emission processes and to isolate their po-
global scale, notably acting as cloud and ice nuclei (Ariya       tential key drivers (e.g., vegetation type and density, topog-
et al., 2009; Elbert et al., 2007; Fröhlich-Nowoisky et al.,      raphy, weather conditions), which are still unclear (Bozzetti
2016; Hill et al., 2017; Humbal et al., 2018; Morris et al.,      et al., 2016). This information would be essential for further
2014; Rajput et al., 2018). While recent studies have revealed    implementation into chemical transport models (Heald and
highly relevant information on the abundance and size parti-      Spracklen, 2009; Myriokefalitakis et al., 2017; Tanarhte et
tioning of PBOA (Fröhlich-Nowoisky et al., 2017; Huffman          al., 2019).
and Santarpia, 2017), their emission sources and contribution        It is commonly acknowledged that SCs (particularly ara-
to total airborne particles are still poorly documented, partly   bitol and mannitol) originate from primary biogenically de-
due to the analytical limitations to distinguish PBOA from        rived sources such as bacterial, fungal spores, and plant ma-
other types of carbonaceous particulate matter (Bozzetti et       terials (Di Filippo et al., 2013; Golly et al., 2018; Gosselin
al., 2016; China et al., 2018; Di Filippo et al., 2013; Per-      et al., 2016; Holden et al., 2011; Kang et al., 2018; Medeiros
rino and Marcovecchio, 2016; Yan et al., 2019). Notably,          et al., 2006b; Wan et al., 2019; Yan et al., 2019; Yttri et al.,
the global emissions of fungal spores emitted into the at-        2007; Zhu et al., 2018a). Some studies have characterized the
mosphere are still poorly constrained and range from 8 to         composition of SC in topsoil samples (for fractions larger
186 Tg yr−1 (Després et al., 2012; Elbert et al., 2007; Jacob-    than PM10 ) from both natural (i.e., uncultivated) and agri-

Atmos. Chem. Phys., 19, 11013–11030, 2019                                          www.atmos-chem-phys.net/19/11013/2019/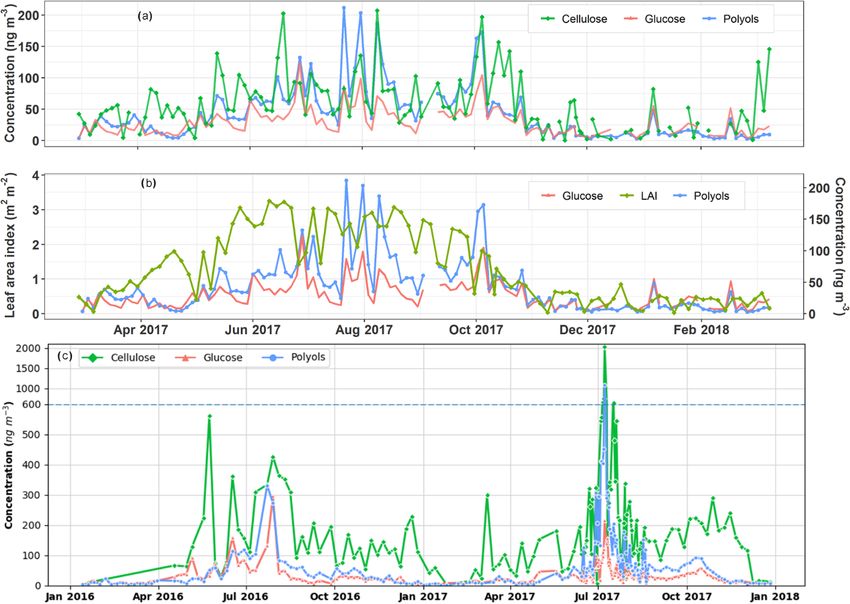
A. Samaké et al.: Arabitol, mannitol, and glucose as tracers of primary biogenic organic aerosol 11015
cultural regions (Medeiros et al., 2006a; Rogge et al., 2007; nual short-term time series of particulate SC concentrations
Simoneit et al., 2004; Wan and Yu, 2007). The authors sug- over pairs of sites across multiple space ranges, including lo-
gested that the particulate arabitol, mannitol, and glucose are cal, regional, and nationwide sites, and (ii) the investigation
introduced into the atmosphere mainly through resuspended of links between concentrations and series key parameters
soils or dust particles and associated biota derived from nat- such as meteorological and phenological ones. Simultaneous
ural soil erosion, unpaved road dust or agricultural practices. annual short-term concentration measurements of SC and
Conversely, Jia and Fraser (2011) reported higher concen- cellulose were performed to better understand their sources
trations of SC relative to PBOA in size-segregated aerosol correlations.
samples collected at a suburban site (Higley, USA) compared
to the local size-fractionated soils (equivalent to atmospheric
PM2.5 and PM10 ). This suggested that direct emissions from 2 Material and methods
biota (microbiota, vascular plant materials) could also be a
2.1 Sampling sites
significant atmospheric input process for SC at this suburban
site. Daily PM10 concentrations reported in the present work were
A large database on SC concentrations was obtained over obtained from different research and monitoring programs
France in the last decade. It already allowed the investiga- conducted over the last 6 years in France. Within the frame-
tion of the size distribution and seasonal variabilities of SC work of the present study, we carefully selected sites shar-
concentrations in aerosols at 28 French sites, notably show- ing at least 1 complete year of concurrent monitoring with
ing that SCs are ubiquitous primary aerosols, accounting for another one, to be representative of the annual variation cy-
a significant proportion of PM10 organic matter (OM) mass cles. The final dataset includes data from 16 sites, which are
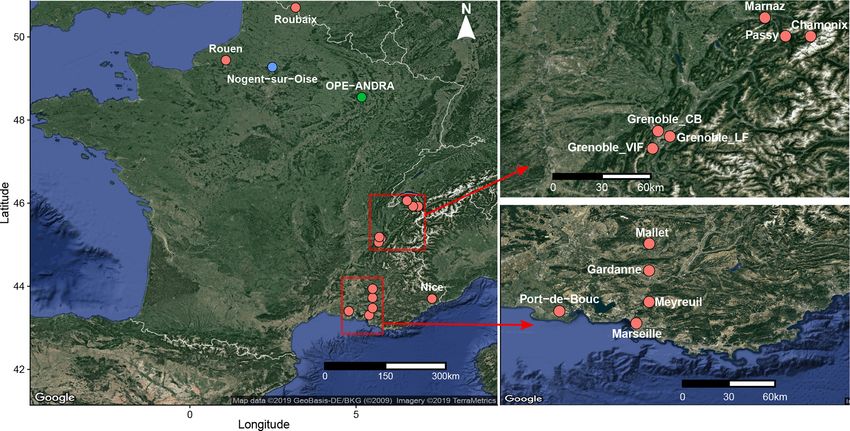
(Samaké et al., 2019). Results confirmed that their ambient distributed in different regions of France (Fig. 1) and cover
concentrations display a well-marked seasonality, with max- several main types of environmental conditions in terms of
imum concentrations from late spring to early autumn, fol- site topography, local vegetation, and climate. The charac-
lowed by an abrupt decrease in late autumns and a minimum teristics and data available at each sampling site are listed in
concentration during wintertime in France. This study also Table S1 of the Supplement, together with the information on
showed that the mean PBOA chemical profile is largely dom- the annual average concentrations of aerosol chemical com-
inated by organic compounds, with only a minor contribution position (Table S2). Detailed information on the sampling
of dust particle fraction. The latter result indicated that am- conditions can be found in Samaké et al. (2019), such as the
bient polyols could most likely be associated with direct bio- campaign periods, number of collected PM samples, sam-
logical particle emissions (active spore discharge, microbiota pling flow rates, sample storage and handling, etc. Note that,
released from phylloplane or phyllosphere, etc.) rather than the previous database (Samaké et al., 2019) has been updated
with the microorganism-containing soil resuspension. These here with arabitol and mannitol in PM10 collected at the sub-
observations call for more investigations of the predominant urban site of Nogent-sur-Oise for a series covering the years
SC (and PBOA) emission sources. 2013 to 2017.
Cellulose, a linear polymer composed of D-glucopyranose
units linked by β-1,4 bonds, is the most frequent polysac- 2.2 Chemical analyses
charide occurring in terrestrial environments (Ramoni and
Seiboth, 2016). Plant materials contain cellulose, which has Daily (24 h) PM10 samples were collected onto prebaked
been reported as a suitable proxy to evaluate the vegetative quartz fiber filters (Tissuquartz PALL QAT-UP 2500 150 mm
debris contribution to OM mass (Bozzetti et al., 2016; Dael- diameter) every third or sixth day but not concurrently at all
lenbach et al., 2017; Glasius et al., 2018; Hiranuma et al., sites. They were then analyzed for various chemical species
2019; Puxbaum and Tenze-Kunit, 2003; Sánchez-Ochoa et using subsampled fractions of the collection filters and a
al., 2007; Yttri et al., 2011b). The ambient PM10 cellulose large array of analytical methods. Details of all the chem-
has been shown to be abundant in the European semirural ical analysis procedures are reported elsewhere (Golly et
or background environments (accounting for 2 % to 10 % al., 2018; Samaké et al., 2019; Waked et al., 2014; Weber
of OM mass) (Glasius et al., 2018; Sánchez-Ochoa et al., et al., 2018). Briefly, primary sugar compounds were ex-
2007) and Nordic rural environments in Norway (contribut- tracted from filter aliquots (punches typically about 10 cm2 )
ing to 12 % to 18 % of total carbon mass) (Yttri et al., 2011b). into ultrapure water. The extracts are then filtered using
Thus, simultaneous concentration measurements of cellulose a 0.22 µm Acrodisc filter. Depending on the site, analyses
and SC can provide essential information into their emission were conducted either by the IGE (Institut des Géosciences
source dynamics. de l’Environnement) or by the LSCE (Laboratoire des Sci-
As the continuation of our previous work (Samaké et al., ences du Climat et de l’Environnement) (Samaké et al.,
2019), the present paper aims to delineate the processes that 2019). At the IGE, extraction was performed during 20 min
drive the atmospheric concentrations of SC and then PBOA. in a vortex shaker, and analyses were achieved using high-
This is achieved through (i) the analysis of simultaneous an- performance liquid chromatography with pulsed amperomet-
www.atmos-chem-phys.net/19/11013/2019/ Atmos. Chem. Phys., 19, 11013–11030, 2019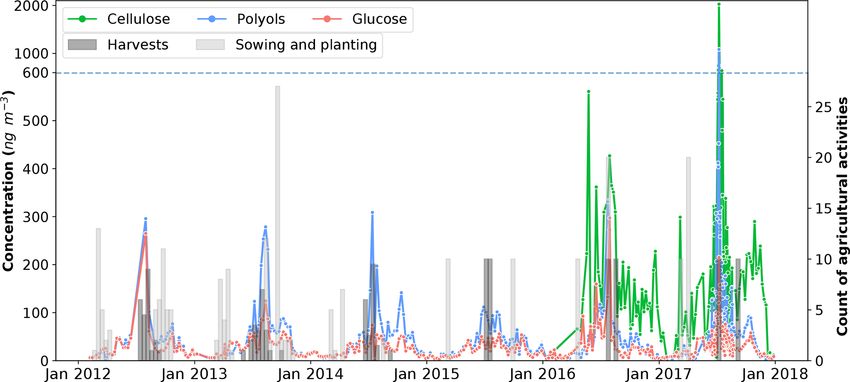
11016                     A. Samaké et al.: Arabitol, mannitol, and glucose as tracers of primary biogenic organic aerosol

Figure 1. Geographical location of the selected sampling sites. The red and blue dots indicate urban and suburban sites, respectively, while
the green one corresponds to a rural site, surrounded by field crop areas.

ric detection (HPLC-PAD). A first set of equipment was used             the alkaline peroxide pretreatment step used to remove lignin
until March 2016, consisting of a Dionex DX500 equipped                 in the original protocol results in a loss of sample material,
with a three-column Metrosep (Carb 1-Guard + A Supp 15–                 it has been avoided in this study. Therefore, only the “free
150 + Carb 1–150); the analytical program was isocratic                 cellulose” is reported in our samples. Note that Sánchez-
with 70 mM sodium hydroxide (NaOH) as an eluent for                     Ochoa et al. (2007) consider that this free cellulose could
11 min, followed by a gradient cleaning step with a 120 mM              represent only about 70 % of the total cellulose in air sam-
NaOH as an eluent for 9 min. This procedure allows the anal-            ples and that the total cellulose could represent only about
ysis of arabitol, mannitol, and glucose (Waked et al., 2014).           50 % of the “plant debris” content of atmospheric PM. Very
A second set of equipment was used after March 2016, with               few other results are available on this topic (Bozzetti et al.,
a Thermo-Fisher ICS 5000+ HPLC equipped with a 4 mm                     2016; Glasius et al., 2018; Vlachou et al., 2018; Yttri et al.,
diameter Metrosep Carb 2 × 150 mm column and a 50 mm                    2011b). The protocol has been improved to increase sensi-
pre-column. The analytical run was isocratic with 15 % of               tivity and accuracy by reducing the contribution of glucose
an eluent of sodium hydroxide (200 mM) and sodium acetate               in the blanks and by using an HPLC-PAD as the analytical
(4 mM) and 85 % water, at 1 mL min−1 . At the LSCE, ex-                 method for the determination of glucose concentrations. Tri-
traction was performed for 45 min by sonication and analy-              choderma reesei cellulase (> 700 U g−1 , Sigma Aldrich) and
ses were achieved using an ion chromatography instrument                Aspergillus niger glucosidase (> 750 U g−1 , Sigma Aldrich)
(IC, DX600, Dionex) with pulsed amperometric detection                  were used as saccharification enzymes. The protocol is de-
(ICS3000, Thermo-Fisher). In addition, a CarboPAC MA1                   tailed in Sect. S2 in the Supplement.
column was used (4 × 250 mm, Dionex) along with an iso-                    Field blank filters (about 10 % of samples) were han-
cratic analytical run with 480 mM sodium hydroxide eluent.              dled as real samples for quality assurance. The present data
This analytical technique allows us to quantify arabitol, man-          have been corrected from field blanks. The reproducibility of
nitol, and glucose (Srivastava et al., 2018). Examples of stan-         the analysis of primary sugar compounds (polyols, glucose)
dard solution and sample raw HPLC-PAD chromatograms                     and cellulose, estimated from the analysis of sample ex-
are presented in Fig. S1.                                               tracts from 10 punches of the same filters, were in the range
   For cellulose quantification, we used an optimized proto-            of 10 %–15 %. The quantification limits of primary sugar
col based on that described by Kunit and Puxbaum (1996)                 compounds and cellulose ranged from 0.63 to 0.89 ng m−3 .
and Puxbaum and Tenze-Kunit (2003), in which the cellu-                 About 2800 samples are considered in this work for the poly-
lose contained in the lignocellulosic material is enzymati-             ols and glucose series, while 290 samples (from the sites of
cally hydrolyzed into glucose units before analysis. Since              Grenoble_LF and OPE-ANDRA) are considered for the cel-

Atmos. Chem. Phys., 19, 11013–11030, 2019                                                www.atmos-chem-phys.net/19/11013/2019/
A. Samaké et al.: Arabitol, mannitol, and glucose as tracers of primary biogenic organic aerosol 11017
lulose series. Hereafter, the term “polyols” is used to refer follows: starting on identical days for each pairs of sites, the
uniquely to the sum of arabitol and mannitol concentrations. arrangement of the original daily data into consecutive 3 d
intervals (or 6 d intervals in the case of OPE-ANDRA) and
2.3 Meteorological data and leaf area index (LAI) the calculation of the average concentration values for the
measurements middle day were performed. The resultant data were used for
correlation analysis between site pairs (Table S3).
Ambient weather data were not available at all monitoring Multiple linear regression (MLR) was used to assess the
sites (see Table S1). In this study, data including daily rela- strength of the relationships between atmospheric concentra-
tive humidity (%), nighttime temperature (◦ C), average and tions of particulate SC and local environmental factors in-
maximum temperatures (◦ C), wind speed (m s−1 ), solar radi- cluding the daily mean relative humidity, nighttime temper-
ation (W m−2 ), and rainfall level (mm) for the sites of Mar- ature, average and maximum temperature, wind speed, solar
naz and OPE-ANDRA (Fig. 1), representing different cli- radiation, rain levels, and LAI. Because the LAI is a 4 d com-
matic regions and environmental conditions, were obtained posite, daily values of the other variables were rescaled to
from the French meteorological data sharing service system consecutive 4 d averaged values. The linear regression (linear
(Météo-France) and ANDRA (French national radioprotec- model or lm) package in R was employed for multiple regres-
tive agency, in charge of the OPE-ANDRA site). sion analyses. The concentration data were log-transformed
The LAI, which is defined as the projected area of leaves to obtain regression residual distributions as close as possible
over a unit of land, is an important measure of the local veg- to the normal Gaussian one (Fig. S2). Stepwise forward se-
etation density variation (Heald and Spracklen, 2009; Yan lection was used to select the predictors that explain well the
et al., 2016a, b). For this study, we used the MODIS Col- temporal variation in SC concentrations at the site of Marnaz.
lection 6 LAI product because it is considered to have the It should be noted that due to the limited availability of
highest quality among all the MODIS LAI products (Yan external parameters, the environmental factors driving SC at-
et al., 2016a, b). The MCD15A3H product uses both Terra mospheric levels have been extensively investigated for only
and Aqua reflectance observations as inputs to estimate daily two monitoring sites with contrasted characteristics: the ur-
LAI at 500 m spatial resolution, and a 4 d composite is cal- ban background site of Marnaz located in an Alpine valley,
culated to reduce the noise from abiotic factors. Using a and the rural OPE-ANDRA site surrounded by field crop ar-
2 × 2 km grid box around the monitoring site, the local vege- eas spreading over several tens of kilometers.
tation density variation was retrieved from LP DAAC (https:
//lpdaac.usgs.gov/, last access: 15 March 2019) for the sites
of Marnaz, OPE-ANDRA, and Grenoble_LF. 3 Results and discussion
2.4 Data analyses 3.1 Example of spatial coherence of the concentrations
at different scales
All the statistical analyses were carried out using the open-
source R software (R studio interface, version 3.4.1). Several Our previous work (Samaké et al., 2019) showed that partic-
statistical analyses were performed on the concentrations to ulate polyols and glucose are ubiquitous primary compounds
identify the spatial patterns of emission sources and the po- with nonrandom spatial and seasonal variation patterns over
tential parameters of influence as explained below. France. Here, an inter-site comparison of their short-term
The normalized cross-correlation (NCC) test was chosen concentration evolutions has been carried out at different
to examine the potential similarities among the monitoring space scales (from local to national) for the pairs that can be
sites for particulate SC concentrations, in terms of short-term investigated in our database. Figure 2 presents some of these
temporal trends (e.g., synchronized periods of increase or de- comparisons for three spatial scales (15, 120, and 205 km).
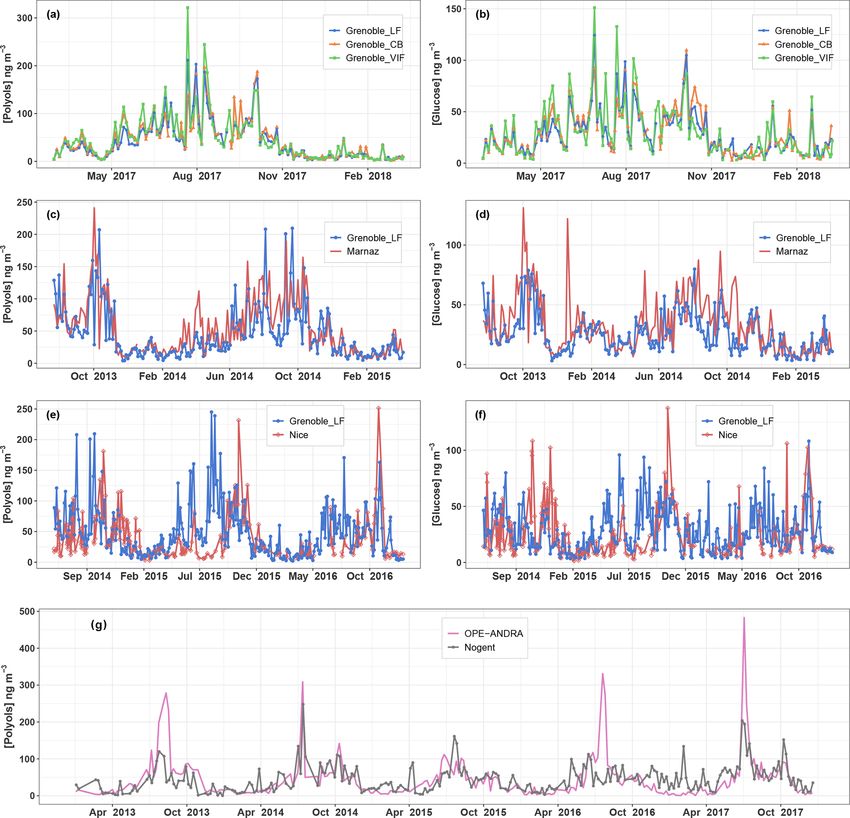
crease, simultaneous fluctuations during specific episodes). The daily average concentrations of polyols (defined as
The main advantage of NCC over the traditional correla- the sum of arabitol and mannitol) and glucose display highly
tion tests is that it is less sensitive to linear changes in the synchronous evolutional trends (i.e., homogeneity in the con-
amplitudes of the two time series compared. Therefore, to centrations, the timing of concentration peaks, simultane-
reduce the possibility of spurious “anti-correlation” due to ity of the daily specific episodes of increase or decrease
highly variable concentration ranges, data were amplitude- in concentrations) over three neighboring monitoring sites
normalized prior to correlation analysis. A thorough discus- located 15 km apart in the Grenoble area (Fig. 2a and b).
sion of the normalized cross-correlation method can be found Interestingly, remarkable synchronous patterns both for the
elsewhere (Bardal and Sætran, 2016; Dai and Zhou, 2017; short term (near-daily) and longer term (seasonal) still oc-
Eisner et al., 2009; Kaso, 2018; Lainer et al., 2016; Le Pi- cur for sites located 120 km apart, as exemplified for two
chon et al., 2019). To achieve pair-wise correlation analysis sites in Alpine environments (Grenoble and Marnaz) (Fig. 2c
between the sampling sites collected during the same peri- and d). However, as shown in Fig. 2e and f, the evolutions of
ods, the original raw daily measurements were processed as concentrations become quite dissimilar and asynchronous in
www.atmos-chem-phys.net/19/11013/2019/ Atmos. Chem. Phys., 19, 11013–11030, 2019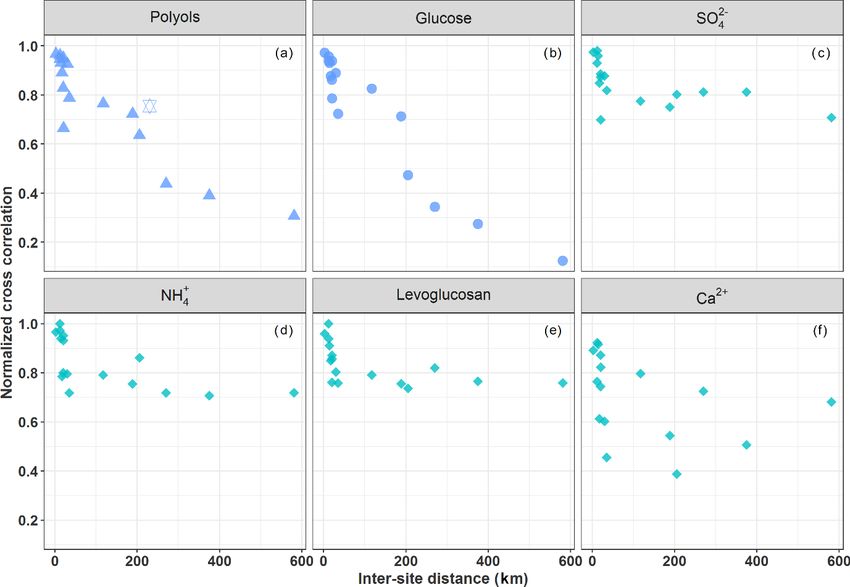
11018                      A. Samaké et al.: Arabitol, mannitol, and glucose as tracers of primary biogenic organic aerosol

Figure 2. Concentrations (in ng m−3 ) of (a, c, e) ambient particulate polyols (defined as the sum of arabitol and mannitol) and (b, d, f) glucose
over different monitoring sites in France. Since PM10 were collected every 3 d at Nogent-sur-Oise and 6 d at OPE-ANDRA, the original
datasets are averaged over consecutive 6 d intervals (g).

terms of seasonal and daily fluctuations for more distant sites            concentration peaks generally more pronounced at the rural
(Grenoble and Nice, 205 km apart) that are located in differ-              site of OPE-ANDRA.
ent climatic regions (Alpine for Grenoble, Mediterranean for                  The following sections are dedicated to the investigation
Nice). This contrasts with results from the rural background               of the processes that can lead to these similarities and differ-
site of OPE-ANDRA and the suburban site of Nogent-sur-                     ences according to these spatial scales.
Oise, both located in a large field crop region of extensive
agriculture and about 230 km apart from each other (Fig. 2g).
Indeed, they present very similar variations in daily concen-
trations for multiyear series, despite their distance apart, with

Atmos. Chem. Phys., 19, 11013–11030, 2019                                                    www.atmos-chem-phys.net/19/11013/2019/
A. Samaké et al.: Arabitol, mannitol, and glucose as tracers of primary biogenic organic aerosol 11019
Figure 3. Normalized cross-correlation values for the daily evolution of particulate polyols (a), glucose (b), sulfate (c), ammonium (d),
levoglucosan (e), and calcium (f) concentrations over pairs of sites located at multiple increasing space scales across France. The hexagram
corresponds to the correlation between the sites of OPE-ANDRA and Nogent-sur-Oise, both sites being surrounded by crop field areas.
3.2 Inter-site correlations and spatial-scale variability p < 0.01) at all pairs of sites considered in the present work.
The concentrations of levoglucosan and those of SC clearly
display very different annual atmospheric evolution cycles:
Figure 3a and b provide an overview of the cross-correlation i.e., higher concentrations of levoglucosan in France are ob-
coefficients for the daily evolution of concentrations (for served in the coldest season (winter) due to the increased
polyols and glucose (SC)) between pairs of sites located at biomass burning, while those of SC are observed in warm
multiple increasing space scales across France (Table S3). seasons and coinciding with negligible ambient concentra-
Time series of concentrations for both SCs show a clear tions of levoglucosan (Fig. S3). Moreover, ambient concen-
distance-dependent correlation. The strength of the correla- trations of calcium (Fig. 3f), associated with local fugitive
tions is highly significant for distances up to 150–190 km dust sources or/and long-range aerosol transport (Ram et al.,
(R > 0.72, p < 0.01) and gradually decreases with increas- 2010; Wan et al., 2019) display random correlation patterns.
ing inter-site distances. One exception is the pair OPE- These results are in agreement with Zhu et al. (2018b), who
ANDRA and Nogent-sur-Oise (high correlation for a dis- also reported nonsignificant correlations between SC and sul-
tance above 230 km), both sites being located in highly im- fate in PM2.5 aerosols measured at Shanghai, China. The dis-
pacted agricultural areas. This overall pattern suggests that tinct spatial behaviors between sulfate (or Ca2+ ) and SC in
the processes responsible for the atmospheric concentrations the present work further suggest a dominant regional influ-
of SC present a spatial homogeneity over typical areas of at ence for atmospheric SC, as opposed to processes associated
least several tens of kilometers. with either local sources for calcium or long-range transport
Unlike SC, ambient air concentrations of sulfate (Fig. 3c) for sulfate.
and ammonium (Fig. 3d), associated with long-range aerosol Mannitol and arabitol are well-known materials of fun-
transport (Abdalmogith and Harrison, 2005; Amato et al., gal spores, serving as osmoregulatory solutes (Medeiros et
2016; Coulibaly et al., 2015; Pindado and Perez, 2011; al., 2006b; Simoneit et al., 2004; Verma et al., 2018; Xiao
Waked et al., 2014), and levoglucosan (Fig. 3e), associ- et al., 2018; Zhang et al., 2015). Based on parallel mea-
ated with biomass burning (Weber et al., 2019; Xiao et al., surements of spore counts and PM10 polyol concentrations
2018), display stronger positive correlations (R > 0.72–0.98,
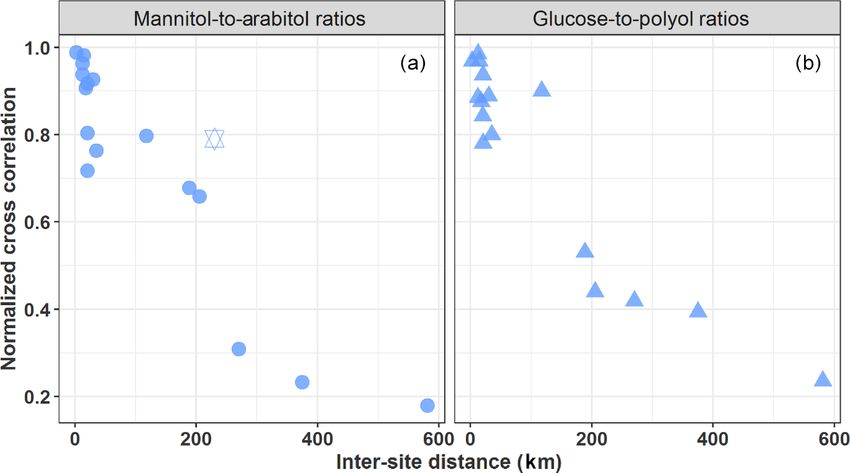
www.atmos-chem-phys.net/19/11013/2019/ Atmos. Chem. Phys., 19, 11013–11030, 201911020 A. Samaké et al.: Arabitol, mannitol, and glucose as tracers of primary biogenic organic aerosol Figure 4. Normalized cross-correlation values for daily evolution of particulate mannitol-to-arabitol (a) and glucose-to-polyols (b) ratios over pairs of sites located at multiple increasing space scales across France. The hexagram corresponds to the correlation between the sites of OPE-ANDRA and Nogent-sur-Oise, both sites being surrounded by crop field areas. at three sites within the area of Vienna (Austria), Bauer et Similarly, the annual average glucose-to-polyols ratio at al. (2008) found an average arabitol and mannitol content all sites is about 0.79 ± 0.77. No literature data are currently per fungal spores of, respectively, 1.2 pg per spore (range available for comparison. Further work is needed to relate 0.8–1.8 pg per spore) and 1.7 pg per spore (range 1.2–2.4 pg these variations with microorganism communities and plant per spore). Mannitol and arabitol have also often been iden- growing stages. tified in the green algae and lower plants (Buiarelli et al., However, as evidenced in Fig. 4, both mannitol-to- 2013; Di Filippo et al., 2013; Gosselin et al., 2016; Vélëz arabitol and glucose-to-polyols ratios show a clear distance- et al., 2007; Xu et al., 2018; Zhang et al., 2010). Gosselin dependent correlation, with higher correlations (R = 0.64 et al. (2016) observed a relatively low (R 2 = 0.31) to high to 0.98, p < 0.01) observed for pairs of sites within 150– (R 2 = 0.84) coefficient of determination between mannitol 190 km distance. This spatial consistency highlights once and arabitol for total suspended particles (TSPs) collected again that the dominant emission processes should be ef- at a pine-forested area during dry and rainy periods, respec- fective regionally, rather than being specific local input pro- tively. High correlation in rainy periods possibly suggested cesses, and that atmospheric dynamics of the concentration that both chemical species in the TSP fraction in this pine- levels (i.e., driven by the interplay of emission and removal forested area could have been derived mainly from the same processes) are determined by quite similar environmental sources, i.e., actively wet-discharged ascospores and basid- factors (e.g., meteorological conditions, vegetation, land use) iospores, while the relatively poor correlation in dry peri- at such a regional scale. This implies that local events and ods could likely have been due to more complex sources phenomena, such as the mechanical resuspension of topsoil (dry discharged spores, plants, algae, etc.). Being important and associated biota (like bacteria, fungi, plant materials), chemical species for the metabolism of the microorganisms might not be their major atmospheric input processes, partic- (Shcherbakova, 2007), it may well be that the concentration ularly in urban background areas typically characterized by ratio of mannitol to arabitol could deliver some information less bare soil and with a variable nature of the unpaved top- on the spatial or temporal evolution of their emission pro- soil at the regional scale (Karimi et al., 2018). Furthermore, cesses (Gosselin et al., 2016). The annual average mannitol- Karimi et al. (2018) also recently reported heterogeneous to-arabitol ratio at all sites is about 1.15 ± 0.59, with ratios topsoil microbial structure within patches of 43 to 260 km for the warm period (June–September) being 1 to 2 times across different regions of France. It follows that the hy- higher than those in the cold period (December–May) (Ta- potheses of emissions related to the mechanical resuspension ble S1). These ratios are within the range of those previously of topsoil particles and associated biota or microbiota emit- reported for PM10 aerosols collected at various urban and ru- ted actively from surface soil into the air generally assumed ral background sites in Europe (Bauer et al., 2008; Yttri et al., in most pioneering reports (Medeiros et al., 2006b; Rogge et 2011b). Similarly, Burshtein et al. (2011) also reported com- al., 2007; Simoneit et al., 2004; Wan and Yu, 2007) are most parable ratios for PM10 aerosols collected during autumn and probably not valid. winter from a Mediterranean region in Israel. Atmos. Chem. Phys., 19, 11013–11030, 2019 www.atmos-chem-phys.net/19/11013/2019/
A. Samaké et al.: Arabitol, mannitol, and glucose as tracers of primary biogenic organic aerosol                                      11021

Figure 5. Temporal covariation cycles of the daily particulate polyol and glucose concentrations along with vegetation indicators at the urban
background site of Grenoble (a, b) and the rural agricultural background site of OPE-ANDRA (c). Note that PM10 aerosols are intensively
collected at OPE-ANDRA every day (24 h) from 12 June to 22 August 2017 and that the concentration scale changes above 600 ng m−3
in (c) due to an extreme concentration peak in July 2017. The horizontal dashed line denotes this change in y axis scale.

   Alternatively, the vegetation leaves have also been sug-              ture and composition have previously been shown to play
gested as sources of atmospheric SCs (Bozzetti et al., 2016;             essential roles on airborne microbial variabilities in nearby
Golly et al., 2018; Jia et al., 2010; Myriokefalitakis et al.,           areas (Bowers et al., 2011; Laforest-Lapointe et al., 2017;
2017; Pashynska et al., 2002; Sullivan et al., 2011; Verma               Lymperopoulou et al., 2016; Mhuireach et al., 2016).
et al., 2018; Wan et al., 2019). In fact, vascular plant leaf
surfaces is an important habitat for endophytic and epiphytic            3.3    Influence of the vegetation on polyol and glucose
microbial communities (Kembel and Mueller, 2014; Lindow                         concentrations
and Brandl, 2003; Lymperopoulou et al., 2016; Mhuireach et
al., 2016; Whipps et al., 2008). Our results are more in agree-          The relationships between SC PM10 concentrations and veg-
ment with a dominant atmosphere entrance process closely                 etation (plant materials) can be examined at the site of Greno-
linked to vegetation, which is more homogeneous than top-                ble Les Frênes (Grenoble_LF) by comparing the annual evo-
soil at the climatic regional scale. Consistent with this, Sulli-        lutions of SC and the free atmospheric cellulose concentra-
van et al. (2011) also observed evident distinct regional pat-           tions, together with LAI ones.
terns for daily PM2.5 polyol and glucose concentrations at 10               The daily ambient concentration levels of SC and cellu-
urban and rural sites located in the upper Midwest (USA).                lose range, respectively, from 5.0 to 301.9 ng m−3 (with an
The authors attributed such a spatial pattern to the differ-             average of 41.2±39.9 ng m−3 ) and 0.7 to 207.2 ng m−3 (with
ences in vegetation types and microbial diversity over dis-              an average of 52.9 ± 44.2 ng m−3 ), which corresponds to, re-
tinct geographical regions. Accordingly, the vegetation struc-           spectively, to 0.1 % to 6.6 % and 0.01 % to 5.3 % of total OM
                                                                         mass in PM10 . These values are comparable to those previ-

www.atmos-chem-phys.net/19/11013/2019/                                                   Atmos. Chem. Phys., 19, 11013–11030, 2019
11022 A. Samaké et al.: Arabitol, mannitol, and glucose as tracers of primary biogenic organic aerosol ously reported for various sites in Europe (Daellenbach et al., is discussed in Sect. 3.4. Consistent with our observations, 2017; Sánchez-Ochoa et al., 2007; Vlachou et al., 2018; Yttri previous studies conducted at various urban background sites et al., 2011b). Thus, a major part of PBOA could possibly be in Europe have suggested that particulate polyols are asso- ascribed to cellulose and SC-derived sources. ciated to mature plant leaves and microorganisms (bacte- As evidenced in Fig. 5a, ambient free cellulose con- rial and fungal spores), while glucose, which is a monomer centrations vary seasonally, with maximum seasonal aver- of cellulose, would most likely be linked to the developing age values observed in summer (81.4 ± 47.6 ng m−3 ) and leaves (Bozzetti et al., 2016; Burshtein et al., 2011; Pashyn- autumn (64.2 ± 49.2 ng m−3 ), followed by spring (52.6 ± ska et al., 2002; Yttri et al., 2007; Zhu et al., 2015). 37.8 ng m−3 ) and lower levels in winter (23.0±19.9 ng m−3 ). This is the same global pattern for polyols, which are 3.4 Influence of meteorological parameters on ambient also more abundant in summer (82.4 ± 47.4 ng m−3 ) and concentrations of polyols and glucose autumn (48.7 ± 41.6 ng m−3 ), followed by spring (24.9 ± 16.3 ng m−3 ) and winter (10.2 ± 9.6 ng m−3 ) in the Greno- We used here a multiple linear regression analysis (MLR) ble area. On a daily scale, the episodic increases or decreases approach to gain further insight into the environmental fac- in polyols in PM10 are very often well synchronized with that tors influencing the annual and short time variation cycles in cellulose (Fig. 5a). Moreover, the maximum atmospheric of atmospheric SC concentrations. This tentative MLR anal- concentrations of polyols also mainly occur when the vege- ysis is focused on the urban background site of Marnaz tation density (LAI) is at its highest in late summer (Fig. 5b). only since meteorological and other data are readily avail- Similar global behaviors are also observed for atmospheric able for this site and are not influenced too much by some particulate glucose and LAI (Fig. 5a and b). To further as- large city effects. Several variables were tested, which are al- sess the relationships between SC PM10 concentrations and ready mentioned in the literature as drivers of SC concen- vegetation in a rural area, a 2-year measurement of cellulose trations. It includes the ambient relative humidity, rainfall concentrations at the highly impacted agricultural rural site level, wind speed, solar radiation, nighttime temperature, av- of OPE-ANDRA has been conducted. The average concen- erage (or maximum) temperature, and LAI. Nighttime tem- tration of cellulose at OPE-ANDRA (197.9 ± 217.8 ng m−3 ) perature was selected since the time series in Marnaz and is 3.5 times higher than that measured in the urban area of Grenoble indicate that the major drop in concentrations in Grenoble. In terms of temporal dynamics, the evolution cy- late fall (Fig. 2c) is related to the first night of the season cles (i.e., peaks and decreases) of both polyols and glucose with nighttime temperature below 5 ◦ C. The use of the night are also very often well synchronized with that of cellulose temperature is also consistent with the bimodal distribution at OPE-ANDRA (Fig. 5c). of polyols during nighttime and daytime found in previous Altogether, these findings highlight that SC in PM10 and studies (Claeys et al., 2004; Graham et al., 2003; Yan et al., cellulose in both urban background and rural agricultural 2019; Yttri et al., 2011a). areas most probably share a common source related to the Overall, the environmental factors including the mean vegetation. This is additional evidence in support of the hy- nighttime temperature, relative humidity, wind speed, and the pothesis suggested in previous studies (Bozzetti et al., 2016; leaf area index explain up to 82 % (adjusted R 2 = 0.82; see Burshtein et al., 2011; Daellenbach et al., 2017; Pashynska Table 1) of the annual temporal variation cycles of SC con- et al., 2002; Verma et al., 2018; Vlachou et al., 2018; Wan centrations. The mean nighttime temperature and LAI con- and Yu, 2007; Yttri et al., 2007). It is also in line with stud- tribute, respectively, 54 % and 37 % of the observed annual ies indicating that the PBOA source profile identified using variabilities of SC concentrations. The atmospheric humid- offline aerosol mass spectrometry (offline-AMS) correlates ity is also a driver for these chemical species (3 % of the very well with coarse cellulose concentrations (Bozzetti et explained variation). These results are consistent with previ- al., 2016; Vlachou et al., 2018). A noticeable contribution of ous studies showing that concentrations of mannitol (in both cellulose to PBOA mass (26 %) at the rural background site PM10 and PM2.5 size fractions) linearly correlate best with of Payerne (Switzerland), during summer 2012 and winter the LAI, atmospheric water vapor, and temperature (Heald 2013, was reported by Bozzetti et al. (2016). and Spracklen, 2009; Hummel et al., 2015; Myriokefalitakis As also evidenced in Fig. 5, the cellulose concentration et al., 2017). All of these drivers have been previously shown peaks are not systematically correlated to those of polyols. to induce the initial release and influence the long-term air- The development stage of the plants (developing or mature borne microbial (i.e., bacteria, fungi) concentrations (China leaves, flowering plants) in addition to the metabolic ac- et al., 2016; Elbert et al., 2007; Grinn-Gofroń et al., 2019; tivities of endophytic and epiphytic biota (growth, sporula- Jones and Harrison, 2004; Rathnayake et al., 2017; Zhang et tion), all closely related to meteorological conditions (Bo- al., 2015). denhausen et al., 2014; Bringel and Couée, 2015; Lindow Besides, the wind speed (range of 0.2 to 5.6 m s−1 ) seems and Brandl, 2003; Pirttilä and Frank, 2011; Reddy et al., an additional effective driver affecting the contribution of 2017), could explain such observations. The influence of lo- the local vegetation to SC concentrations in the atmosphere. cal meteorological conditions for an urban Alpine valley site Although enough air movement is required to passively re- Atmos. Chem. Phys., 19, 11013–11030, 2019 www.atmos-chem-phys.net/19/11013/2019/
A. Samaké et al.: Arabitol, mannitol, and glucose as tracers of primary biogenic organic aerosol 11023
Table 1. Multiple linear regression for ambient polyol and glucose concentrations and their effective environmental factors at the Marnaz site.
Contributions of predictor are normalized to sum 1. The “Relaimpo package under R” was used to compute bootstrap confidence intervals
for the importance of effective predictors (n = 1000) (Grömping, 2006).
Dependent variable Variability explained by
log(polyols + glucose) effective predictors
Nighttime temperature (◦ C) 0.112∗∗∗ (0.090, 0.133) 0.538 (0.453, 0.604)
Relative humidity (%) 0.017∗∗∗ (0.005, 0.030) 0.030 (0.018, 0.067)
Leaf area index 0.386∗∗ (0.034, 0.737) 0.372 (0.286, 0.444)
Wind speed (m s−1 ) 0.226 (−0.203, 0.655) 0.021 (0.015, 0.058)
Leaf area index × wind speeda −0.596∗∗∗ (−1.001, −0.191) 0.039 (0.014, 0.085)
Constant 2.023∗∗∗ (0.787, 3.260)
Observations 87
R2 0.837
Adjusted R 2 0.824
Residual std. error 0.297 (df = 81)
F statistic 66.677∗∗∗ (df = 5; 81)
Note: ∗∗ p < 0.01; ∗∗∗ p < 0.001; a interaction between predictors.
lease microorganisms along with plant debris into the atmo- daily agricultural practices within this reference sector are
sphere, strong air motions induce higher dispersion. These recorded and made available by ANDRA. The parcels within
observations are in good agreement with those previously re- the agricultural area are submitted to a 3-year crop-rotation
ported (Jones and Harrison, 2004; Liang et al., 2013; Zhang system. The major crops are wheat, barley, rape, pea, and
et al., 2010, 2015; Zhu et al., 2018b). For instance Liang et sunflower. Additionally, OPE-ANDRA is also characterized
al. (2013) have found a negative correlation between wind by a homogeneous type of soil, with a predominance of su-
speed and polyol concentrations, and the highest atmospheric perficial clay limestone.
fungal spores concentrations were observed for a wind speed Figure 6 shows the daily evolution of polyol concentra-
range of 0.6 to 1.0 m s−1 . tions in the PM10 fraction at OPE-ANDRA from 2012 to
One of the limitations of this study is that 4 d averaged 2018, together with the agricultural activities recorded daily
observations do not allow us to evaluate the driver contri- and averaged over 12 d.
butions that might explain some short-term events for which Although the concentrations of polyols fluctuate from
the influence of meteorological parameters such as rainfall or one year to another, they display clear annual variation
solar radiation could also be significant (Grinn-Gofroń et al., cycles, with higher values in the warm periods (June–
2019; Heald and Spracklen, 2009; Jones and Harrison, 2004). November) and lower concentration values in the cold pe-
However, such simple parameterizations could be a first step riods (October–May). Interestingly, the annual concentra-
in considering SC concentrations in chemical-transport mod- tions of polyols in 2015 (4.2–111.7 ng m−3 ; annual average:
els (CTMs), and further work is required in this direction in 37.0 ± 29.1 ng m−3 ) are significantly lower than those ob-
order to generate a robust parameterization of the emissions. served for the other years (0.6–1084.6 ng m−3 ; annual av-
erage: 62.9 ± 96.8 ng m−3 ). Similar inter-annual evolution
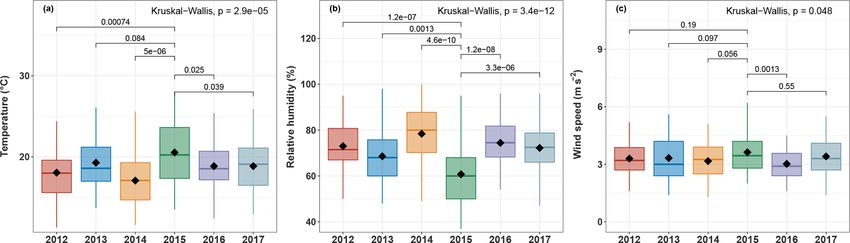
3.5 Specific case of a highly impacted agricultural area trends, but with variable intensities, are also observed for
glucose concentrations (Fig. 6). The year 2015 was found
This section focuses on evidencing the environmental drivers to be particularly hot and dry at OPE-ANDRA (Fig. 7),
of PM10 SC concentrations specific to agricultural areas. To whereas the locally averaged wind conditions are quite sta-
achieve this objective, the site of OPE-ANDRA was selected ble over the years within the period of study, suggesting that
because it is extensively impacted by agricultural activities, the wind conditions are not the main driver of the observed
without being too prone to influences by other sources. OPE- inter-annual variability. These results highlight that ambient
ANDRA is a specific rural background observatory located air temperature and humidity are key meteorological drivers
about 230 km east of Paris at an altitude of 392 m. It is char- of the annual variation cycles of polyol and glucose concen-
acterized by a low population density (< 22 inhabitants km−2 trations. Hot and dry ambient air conditions may decrease
within an area of 900 km2 ), with no surrounding major trans- the metabolic activity of the microorganisms (e.g., microbial
port road or industrial activities. The air monitoring site it- growth and sporulation) (Fang et al., 2018; Liang et al., 2013;
self lies in a “reference sector” of 240 km2 , in the middle of Meisner et al., 2018).
a field crop area (tens of kilometers in all directions). The
www.atmos-chem-phys.net/19/11013/2019/ Atmos. Chem. Phys., 19, 11013–11030, 201911024 A. Samaké et al.: Arabitol, mannitol, and glucose as tracers of primary biogenic organic aerosol
Figure 6. Daily evolution cycles of polyol and glucose concentrations in aerosols collected from the OPE-ANDRA monitoring site, from
2012 to 2018. Cellulose concentrations were measured from January 2016 to January 2018. Colored bars correspond to the sum of the
various agricultural practices performed (data for 69 parcels are averaged over 12 d for better clarity). Records of agricultural activities after
October 2014 were available for only two parcels within the immediate vicinity of the PM10 sampler. Records are multiplied by 10 for this
period.
Figure 7. Boxplots of (a) maximum ambient temperature, (b) relative humidity, and (c) wind speed at OPE-ANDRA from 2012 to 2017.
Analyses are performed for warmer periods (June–November). Only statistically different meteorological factors are presented. The black
marker inside each boxplot indicates the average value, while the top, middle, and bottom of the box represent the 75th, median, and 25th
percentiles, respectively. The whiskers at the top and bottom of the box extend from the 95th to the 5th percentiles. Statistical differences
between average values were assessed with the Kruskall–Wallis method (p < 0.05).
Finally, maximum ambient concentration levels for both 4 Conclusions
SC and cellulose are observed in excellent temporal agree-
ment with the harvest periods (late summer) at the OPE- The short-term temporal (daily) and spatial (local to nation-
ANDRA site (Fig. 6). Harvesting activities have been pre- wide) evolutions of particulate polyol (defined here as the
viously reported as the major sources for particulate poly- sum of arabitol and mannitol) and glucose concentrations are
ols and glucose to the atmosphere in agricultural and nearby rarely discussed in the current literature. The present work
urbanized areas (Golly et al., 2018; Rogge et al., 2007; Si- aimed at investigating the spatial behavior of these chemicals
moneit et al., 2004). Hence, the resuspension of plant mate- and evidencing their major effective environmental drivers.
rials (crop detritus, leaves debris) and associated microbiota The major results mainly showed the following.
(e.g., bacteria, fungi) originating from cultivated lands is the The short-term evolution of ambient polyol and glucose
most likely major input process of PM10 polyols and glucose concentrations is highly synchronous across an urban city
at field crop sites. scale and remains very well correlated throughout the same
geographic areas of France, even if the monitoring sites are
situated in different cities about 150–190 km apart. However,
Atmos. Chem. Phys., 19, 11013–11030, 2019 www.atmos-chem-phys.net/19/11013/2019/A. Samaké et al.: Arabitol, mannitol, and glucose as tracers of primary biogenic organic aerosol 11025
sampling sites located in two distinct geographic areas are different initial programs for the collection and chemical analysis
poorly correlated. This indicates that emission sources of of the samples. VJ developed the analytical techniques for polyol
these chemicals are uniformly distributed, and their accumu- and cellulose measurements. TC performed the cellulose measure-
lation and removal processes are driven by quite similar en- ments. Sample analyses at LSCE were performed by NB. AC gave
vironmental parameters at the regional scale. Therefore, lo- advice on the statistical aspects of the data processing. AS and JLJ
processed the data and wrote up the paper. SW participated in the
cal phenomena, such as the atmospheric resuspension of top-
visualization of the results. SC supervises the OPE station and col-
soil particles and associated microbiota and microbial direct lected the agricultural activities records. All authors from AASQA
emissions (e.g., sporulation), cannot be the main emission (author affiliation nos. 9 to 16) are representatives of each network
processes of particulate polyols and glucose in urban areas that conducted the sample collection and the general supervision
not directly influenced by agricultural activities. of the sampling sites. All authors reviewed and commented on the
The atmospheric concentrations of polyols (or glucose) paper.
and cellulose display remarkably synchronous temporal evo-
lution cycles at the background urban site of Grenoble, indi-
cating a common source related to plant debris. Competing interests. The authors declare that they have no conflict
Higher ambient concentrations of polyols and glucose at of interest.
the rural site of OPE-ANDRA occur during each harvest pe-
riod, pointing out resuspension processes of plant materials
(crop detritus, leaves debris) and associated microbiota for Acknowledgements. We would like to express special acknowl-
agricultural and nearby urbanized areas. This is associated edgement of Pierre Taberlet (LECA, Grenoble, France) for fruitful
with higher PM10 cellulose concentration levels, as high as discussions about the importance of endophytic and epiphytic biota
for aerobiology. The PhDs of Abdoulaye Samaké and Samuël We-
0.4 to 2.0 µg m−3 on a daily basis (accounting up to 7.5 % to
ber are funded by the Government of Mali and ENS Paris, respec-
32.4 % of the OM mass).
tively. We gratefully acknowledge the LEFE-CHAT and EC2CO
Multiple linear regression analysis of the yearly series programs of the CNRS for financial support of the CAREMBIOS
from the site of Marnaz gave insightful information on which multidisciplinary project and the LEFE-CHAT program for the
parameter controls the ambient concentrations of polyols and MECEA project for the development of the atmospheric cellu-
glucose. Ambient air nighttime temperature, relative humid- lose measurements. Samples were collected and analyzed within
ity, and vegetation density are the most important drivers, the framework of many different programs funded by ADEME,
whilst wind speed conditions tend to affect the contribution Primequal, the French Ministry of Environment, the CARA pro-
of local vegetation. gram led by the French Reference Laboratory for Air Qual-
Altogether, these results improve our understanding of the ity Monitoring (LCSQA), ANDRA, and actions funded by many
spatial behavior tracers of PM10 PBOA emission sources in AASQAs and IMT Lille Douai (especially Labex CaPPA ANR-11-
LABX-0005-01 and CPER CLIMIBIO projects). Analytical aspects
France and in general, which is imperative for further imple-
were supported at IGE by the Air-O-Sol platform within Labex
mentation of this important mass fraction of OM into chem-
OSUG@2020 (ANR10 LABX56). We acknowledge the work of
ical transport models. Further investigations of the airborne many engineers in the lab at IGE for the analyses (Aude Wack, Cé-
microbial fingerprint (bacteria and fungi) are ongoing, which line Charlet, Fany Donaz, Fany Masson, Sylvie Ngo, Vincent Lu-
may deepen our understanding of the PBOA source profile. caire, Claire Vérin, and Anthony Vella). Finally, the authors would
like to kindly thank the dedicated efforts of many other people at the
sampling sites and in the laboratories for collecting and analyzing
Data availability. All relevant data for this paper are archived at the the samples.
IGE (Institut des Géosciences de l’Environnement), and are avail-
able upon request from the corresponding author (Jean-Luc Jaf-
frezo). Financial support. This research has been supported by the Centre
National de la Recherche Scientifique (LEFE-CHAT and EC2CO
programs: CAREMBIOS multidisciplinary project).
Supplement. The supplement related to this article is available on-
line at: https://doi.org/10.5194/acp-19-11013-2019-supplement.
Review statement. This paper was edited by Alex Huffman and re-
viewed by three anonymous referees.
Author contributions. JLJ was the (co-)supervisor for the PhDs for
AS, FC, and SW and for the post-docs of DS, BG, and AW. He
directed all the personnel who performed the analysis at IGE. He
is the coordinator for the CNRS LEFE-EC2CO CAREMBIOS pro-
gram that is funding the work of AS. GU and JMFM were the co- References
supervisor for the PhDs of AS and SW. EP, OF, and VR supervised
the PhD of DMO, who investigated the sites in northern France. Abdalmogith, S. S. and Harrison, R. M.: The use of trajectory clus-
OF, JLJ, JLB, AA, and NM were the coordinators or partners of the ter analysis to examine the long-range transport of secondary
www.atmos-chem-phys.net/19/11013/2019/ Atmos. Chem. Phys., 19, 11013–11030, 2019You can also read


