Characterization of a chemical modulation reactor (CMR) for the measurement of atmospheric concentrations of hydroxyl radicals with a ...
←
→
Page content transcription
If your browser does not render page correctly, please read the page content below
Atmos. Meas. Tech., 14, 1851–1877, 2021
https://doi.org/10.5194/amt-14-1851-2021
© Author(s) 2021. This work is distributed under
the Creative Commons Attribution 4.0 License.

Characterization of a chemical modulation reactor (CMR) for the
measurement of atmospheric concentrations of hydroxyl radicals
with a laser-induced fluorescence instrument
Changmin Cho, Andreas Hofzumahaus, Hendrik Fuchs, Hans-Peter Dorn, Marvin Glowania, Frank Holland,
Franz Rohrer, Vaishali Vardhan, Astrid Kiendler-Scharr, Andreas Wahner, and Anna Novelli
Troposphere (IEK-8), Institute of Energy and Climate Research, Forschungszentrum Jülich, 52425 Jülich, Germany

Correspondence: Andreas Hofzumahaus (a.hofzumahaus@fz-juelich.de) and Anna Novelli (a.novelli@fz-juelich.de)

Received: 4 September 2020 – Discussion started: 14 September 2020
Revised: 4 January 2021 – Accepted: 6 January 2021 – Published: 5 March 2021

Abstract. Precise and accurate hydroxyl radical (OH) mea-         (rural environment). Known interferences from O3 + H2 O
surements are essential to investigate mechanisms for oxi-        and the nitrate radical (NO3 ) were quantified with the CMR
dation and transformation of trace gases and processes lead-      in synthetic air in the chamber and found to be 3.0 × 10⁵ and
ing to the formation of secondary pollutants like ozone (O3 )     0.6 × 105 cm−3 , respectively, for typical ambient-air condi-
in the troposphere. Laser-induced fluorescence (LIF) is a         tions (O3 = 50 ppbv, H2 O = 1 % and NO3 = 10 pptv). The in-
widely used technique for the measurement of ambient OH           terferences measured in ambient air during the JULIAC cam-
radicals and was used for the majority of field campaigns         paign in the summer season showed a median diurnal varia-
and chamber experiments. Recently, most LIF instruments in        tion with a median maximum value of 0.9×106 cm−3 during
use for atmospheric measurements of OH radicals introduced        daytime and a median minimum value of 0.4 × 106 cm−3 at
chemical modulation to separate the ambient OH radical con-       night. The highest interference of 2 × 106 cm−3 occurred in
centration from possible interferences by chemically remov-       a heat wave from 22 to 29 August, when the air temperature
ing ambient OH radicals before they enter the detection cell      and ozone increased to 40 ◦ C and 100 ppbv, respectively. All
(Mao et al., 2012; Novelli et al., 2014a). In this study, we      observed interferences could be fully explained by the known
describe the application and characterization of a chemical       O3 + H2 O interference, which is routinely corrected in FZJ-
modulation reactor (CMR) applied to the Forschungszentrum         LIF measurements when no chemical modulation is applied.
Jülich LIF (FZJ-LIF) instrument in use at the atmospheric         No evidence for an unexplained interference was found dur-
simulation chamber SAPHIR (Simulation of Atmospheric              ing the JULIAC campaign.
PHotochemistry In a large Reaction Chamber). Besides ded-            A chemical model of the CMR was developed and ap-
icated experiments in synthetic air, the new technique was        plied to estimate the possible perturbation of the OH trans-
extensively tested during the year-round Jülich Atmospheric       mission and scavenging efficiency by reactive atmospheric
Chemistry Project (JULIAC) campaign, in which ambient             trace gases. These can remove OH by gas phase reactions in
air was continuously flowed into the SAPHIR chamber. It           the CMR or produce OH by non-photolytic reactions, most
allowed for performing OH measurement comparisons with            importantly by the reaction of ambient HO2 with NO. The in-
differential optical absorption spectroscopy (DOAS) and in-       terfering processes become relevant at high atmospheric OH
vestigation of interferences in a large variety of chemical and   reactivities. For the conditions of the JULIAC campaign with
meteorological conditions. Good agreement was obtained in         OH reactivities below 20 s−1 , the influence on the determi-
the LIF–DOAS intercomparison within instrumental accu-            nation of ambient OH concentrations was small (on average:
racies (18 % for LIF and 6.5 % for DOAS) which confirms           2 %). However, in environments with high OH reactivities,
that the new chemical modulation system of the FZJ-LIF in-        such as in a rain forest or megacity, the expected perturbation
strument is suitable for measurement of interference-free OH      in the currently used chemical modulation reactor could be
concentrations under the conditions of the JULIAC campaign        large (more than a factor of 2). Such perturbations need to be

Published by Copernicus Publications on behalf of the European Geosciences Union.
1852                           C. Cho et al.: Characterization of the FZJ-LIF-CMR for the measurement of OH radicals

carefully investigated and corrected for the proper evaluation       Theoretical (Peeters et al., 2009; da Silva et al., 2010;
of OH concentrations when applying chemical scavenging.          Peeters and Müller, 2010; Peeters et al., 2014; Wang et
This implies that chemical modulation, which was developed       al., 2018; Møller et al., 2019) and experimental studies
to eliminate interferences in ambient OH measurements, it-       (Crounse et al., 2011; Berndt, 2012; Crounse et al., 2012;
self can be subject to interferences that depend on ambient      Wolfe et al., 2012; Fuchs et al., 2013, 2014; Teng et al., 2017;
atmospheric conditions.                                          Fuchs et al., 2018; Berndt et al., 2019; Novelli et al., 2020)
                                                                 have hypothesized and found significant regeneration of
                                                                 OH radicals from unimolecular reactions of organic per-
                                                                 oxy radicals (RO2 , with R being an organic group) origi-
1       Introduction
                                                                 nating from the oxidation of biogenic VOCs such as iso-
The hydroxyl radical (OH) plays an important role in tropo-      prene, methacrolein and methyl vinyl ketone (MVK). Al-
spheric photochemistry as the main daytime oxidant of trace      though the inclusion of these new reaction paths in atmo-
gases (e.g. volatile organic compounds, VOCs; nitrogen ox-       spheric chemical models increases the predicted concentra-
ides, NOx = NO+NO2 ; and carbon monoxide, CO), remov-            tion of OH considerably for some conditions, for example
ing primary pollutants while contributing to ozone (O3 ) and     by a factor of 3 over tropical forests (Novelli et al., 2020),
particle formation (Levy, 1971; Carslaw et al., 2010; Li et      it is often not enough to explain the high OH concentrations
al., 2019). In the lower troposphere, OH is mainly produced      observed in field experiments in areas characterized by high
by two types of atmospheric reactions: first, by solar photol-   isoprene emissions (Stone et al., 2011; Lu et al., 2012; Stone
ysis of trace gases (most importantly ozone and nitrous acid,    et al., 2012; Fuchs et al., 2013; Lu et al., 2013; Wolfe et
HONO),                                                           al., 2014; Feiner et al., 2016; Lew et al., 2020).
                                                                     An explanation for the remaining discrepancies between
O3 + hν (< 340 nm) → O(1 D) + O2                         (R1)    measured and modelled OH radical concentrations in high-
    1                                                            isoprene and low-NO environments could be interferences in
O( D) + H2 O → 2OH                                       (R2)
                                                                 OH radical measurements. In most of the field campaigns de-
HONO + hν(< 400 nm) → OH + NO,                           (R3)    scribed above, the OH radical was measured by gas expan-
                                                                 sion of ambient air into a low-pressure volume, where the
and second, by reaction of NO with hydroperoxy radicals
                                                                 radicals are detected by laser-induced fluorescence (LIF) at
(HO2 ),
                                                                 308 nm, except for the study by Wolfe et al. (2014), where
HO2 + NO → OH + NO2 ,                                    (R4)    the OH radical was measured by a chemical ionization mass
                                                                 spectrometer (CIMS). Laser wavelength modulation is usu-
which are produced by photolysis of formaldehyde (HCHO)          ally applied to distinguish the OH fluorescence from laser-
and as intermediates in the OH-initiated degradation of CO       excited background signals. Previous studies have investi-
and VOCs or the ozonolysis of alkenes. A large number of         gated and reported possible interferences in the detection of
measurements of OH radical concentrations in ambient air         ambient OH by LIF, which originate from the formation of
have been conducted in various environments so far (Stone        OH inside the instrument. Such internal OH can be formed
et al., 2012; Feiner et al., 2016; Tan et al., 2017; Mallik      by laser photolysis of ozone in the presence of water (Re-
et al., 2018; Tan et al., 2018; Whalley et al., 2018; Ma et      actions R1 and R2) (Holland et al., 2003; Ren et al., 2004)
al., 2019; Lew et al., 2020). Some of these field studies in-    and acetone (Ren et al., 2004; Fuchs et al., 2016), ozonoly-
cluded the detection of peroxy radicals, trace gases and mea-    sis of alkenes (Ren et al., 2004; Novelli et al., 2014b; Fuchs
surements of the OH reactivity (kOH ), the inverse of OH         et al., 2016; Rickly and Stevens, 2018), and unknown re-
lifetime, which helped with investigation of the atmospheric     actions of nitrate radicals (NO3 ) (Fuchs et al., 2016). Most
OH radical budget. Good agreement between measured OH            of these interfering species are thought not to play a role at
radicals and calculations using chemical box modelling that      ambient concentrations with one exception. Ozone photol-
represent the current understanding of tropospheric chem-        ysis in humid air may be relevant but can be corrected for
istry is often found at high NO concentrations (> 1 parts per    based on laboratory characterization experiments (Holland
billion, ppbv), which favour non-photolytic OH production        et al., 2003).
by Reaction (R4). In pristine environments (NO < 1 ppbv),            In accordance with a recommendation from the Inter-
where OH reactivity is dominated by biogenic VOCs, in par-       national HOx Workshop 2015 (Hofzumahaus and Heard,
ticular isoprene, a large discrepancy, up to a factor of 10,     2016), the majority of LIF instruments now apply chemical
was found with the measured OH radical concentrations be-        modulation in order to correct possible interferences. Chem-
ing higher than calculated. This discrepancy suggested that      ical modulation in instruments measuring OH, which is also
an unknown atmospheric OH formation process is missing           commonly used by CIMS, which can measure OH by addi-
from the chemical mechanisms (Tan et al., 2001; Lelieveld        tion of SO2 in the form of HSO−     4 by ionization with NO3
                                                                                                                               −

et al., 2008; Hofzumahaus et al., 2009; Kubistin et al., 2010;   (Eisele and Tanner, 1991; Tanner et al., 1997; Berresheim et
Whalley et al., 2011; Rohrer et al., 2014).                      al., 2000; Mauldin et al., 2010), involves periodic scaveng-

Atmos. Meas. Tech., 14, 1851–1877, 2021                                           https://doi.org/10.5194/amt-14-1851-2021
C. Cho et al.: Characterization of the FZJ-LIF-CMR for the measurement of OH radicals                                    1853

ing of the ambient OH by addition of a reactant (propane or      surement artefacts. However, as will be discussed in this pa-
hexafluoropropene) before the air enters the detection cell.     per, the accurate evaluation of chemical modulation measure-
Any remaining OH fluorescence signal can then be attributed      ments can be challenging and may have systematic errors in
to OH produced inside the detection cell (Mao et al., 2012;      the measured OH concentration because chemical reactions
Novelli et al., 2014a; Tan et al., 2017; Rickly and Stevens,     of atmospheric trace gases can disturb the efficiency of chem-
2018; Tan et al., 2018, 2019; Woodward-Massey et al., 2020)      ical modulation.
(Table 1). The difference between the signal without and with       In this study, the chemical modulation reactor (CMR) used
the scavenger provides interference-free ambient OH signals      in the LIF instrument of Forschungszentrum Jülich (FZJ)
which are then used to calculate OH radical concentrations       is introduced, described and characterized. The characteri-
by means of a calibration.                                       zation includes laboratory tests and chamber experiments.
   Several LIF instruments applying chemical modulation          Furthermore, a theoretical model is developed that provides
(MPIC, PSU and IU in Table 1) have shown relatively large        estimates of the possible influence of ambient atmospheric
OH interferences which seem to depend on the chemical            conditions on the chemical modulation efficiency and can
conditions of the sampled air as well as on specific instru-     possibly be used for the correction of such influences. Mea-
ment characteristics (e.g. inlet size and shape or whether the   surements of OH radicals using the CMR LIF technique are
detection cell is single-path or multiple-path) and/or from      compared to measurements by differential optical absorp-
the combination of both. After subtraction of the interfer-      tion spectroscopy (DOAS) in synthetic and ambient air in-
ence, a significantly improved agreement was found between       side the atmospheric simulation chamber SAPHIR (Simu-
measured OH concentrations and chemical box model pre-           lation of Atmospheric PHotochemistry In a large Reaction
dictions (Mao et al., 2012; Feiner et al., 2016; Mallik et       Chamber). Most experiments were part of the Jülich Atmo-
al., 2018; Lew et al., 2020). In forest environments, mea-       spheric Chemistry Project (JULIAC), in which ambient air
sured interferences contributed 40 %–80 % to the total signal    from 50 m height was continuously drawn through the cham-
in daytime and 50 %–100 % in nighttime (Mao et al., 2012;        ber for 1 month in each season of the year. This allowed for
Hens et al., 2014; Novelli et al., 2014a; Feiner et al., 2016;   the investigation of possible interference signals for a large
Lew et al., 2020). Smaller contributions of 20 %–40 % to         range of chemical and meteorological conditions in a rural
the total signal were found in daytime coastal (Mallik et        environment.
al., 2018), rural (Novelli et al., 2014a) and urban (Brune et
al., 2016; Griffith et al., 2016) environments, but nighttime
observation were similar to those found in forested environ-
ments. Some studies suggest that the interferences may be        2     Methods
partly caused by the dissociation of stabilized Criegee inter-
mediates (SCIs) that are produced by ozonolysis of alkenes       2.1    Forschungszentrum Jülich LIF OH instrument
(Novelli et al., 2014b, 2017; Rickly and Stevens, 2018).                with chemical modulation reactor (FZJ-LIF-CMR)
However, other LIF instruments using chemical modula-
tion (PKU and Leeds in Table 1) showed insignificant un-         The LIF instrument for the measurement of OH, HO2 and
explained interferences after the well-quantified photolytic     RO2 radicals in use at Forschungszentrum Jülich has been
ozone interference had been subtracted (Tan et al., 2017,        extensively described in several previous studies (Holland
2018, 2019; Woodward-Massey et al., 2020). Although these        et al., 2003; Fuchs et al., 2008, 2012a). Briefly, the mea-
studies were not performed in forested environments with         surement of OH radicals is achieved by sampling ambient
large BVOC (biogenic volatile organic compound) emis-            air through a 0.4 mm pinhole nozzle into a low-pressure
sions as some of the studies where a large interference was      (4 hPa) detection cell. The OH radical is resonantly excited
observed, during the summer campaign in Wangdu (Tan              by a single-path ultraviolet (UV) laser pulse (308 nm) on
et al., 2017) and Beijing (Woodward-Massey et al., 2020),        a single rovibronic transition (Q1 (3)) of the A2 6 + − X2 5
high isoprene concentrations (up to 3 and 7.9 ppbv, respec-      (0, 0) electronic system using a narrow-bandwidth tunable
tively) did not seem to perturb the level of the interference.   dye laser. The resulting OH fluorescence is detected by a
These field campaign results are consistent with the results     micro-channel plate photomultiplier (MCP) connected to a
of laboratory and/or chamber studies (Fuchs et al., 2016;        gated photon counting system. To distinguish the OH fluores-
Woodward-Massey et al., 2020) which found insignificant in-      cence from non-resonant laser-excited background, the exci-
terference from the ozonolysis of BVOCs under atmospheric        tation wavelength is modulated on and off the peak of the OH
conditions. An open question remains as to which chemical        absorption line (Hofzumahaus et al., 1996). The laser system
species and processes produce unexplained OH interferences       is operated at a high repetition rate of 8.5 kHz, and the MCP
in some of the LIF instruments and how technical design and      signals are integrated over 25 and 10 s in the on- and off-
operating conditions of the instruments influence the mag-       resonance mode, respectively. A complete cycle takes 45 s.
nitude of the unexplained interferences. Chemical modula-        The measured OH concentration resulting from the wave-
tion seems to be an appropriate way to minimize such mea-        length modulation is hereafter called OHWAVE following the

https://doi.org/10.5194/amt-14-1851-2021                                          Atmos. Meas. Tech., 14, 1851–1877, 2021
1854                                       C. Cho et al.: Characterization of the FZJ-LIF-CMR for the measurement of OH radicals

Table 1. Characteristics of chemical modulation reactors for different OH LIF instruments.

  Parameters                                     FZJ a             PKU b                 MPIC c               PSU d                IU e                    UL f
  Volume flow (slpm)                             21                21                    150–280              7                    3–9                     32
  Residence time (ms)g                           18                22/18h                Not specified        100                  Not specified           20
  Reaction time (ms)i                            11                19/11h                2.5–4                25/10j               50                      20
  Scavenger                                      C3 H8             C3 H8                 C3 H8                C3 F 6               C3 F6                   C3 H8
  Scavenger concentration (ppmv)k                19                3–500                 100                  150–500              400–1200                110 or 1100
  Scavenger reactivityk, l (s−1 )                540               70–13 500             2700                 7700–26 000          20 000–60 000           3000 or 30 000
  OH scavenging (%)m                             96n               80–97n                80–95o               94o                  > 90                    > 99n
  OH transmission (%)p                           64n               70n                   73q                  ∼ 100j               ∼ 100                   > 95o, q
  Reference                                      This study        Tan et al.            Novelli et           Mao et               Rickly and              Woodward-Massey
                                                                   (2017, 2018)          al. (2014a)          al. (2012)           Stevens (2018)          et al. (2020)
a Forschungszentrum Jülich, Germany. b Peking University, Beijing, China. c Max Planck Institute for Chemistry, Mainz, Germany. d Pennsylvania State University, PA, USA.
e Indiana University, IN, USA. f University of Leeds, UK. g Total transit time. h The shorter time applies to the CMR version as used in Tan et al. (2018). i Transit time from the
injectors to the inlet. j The shorter time was used by Feiner et al. (2016). k Assuming homogeneous mixing in the CMR flow. l The scavenging reactivity was calculated assuming
homogeneous mixing. The used rate coefficients for the C3 H8 and C3 F6 + OH radical are 1.1 × 10⁻¹² and 2.08 × 10⁻¹² cm3 s−1 at 298 K, respectively (Dubey et al., 1996;
Atkinson et al., 2006). m Corresponds to (1 − α) × 100 %. n Measured in synthetic air. o Measured in ambient air with OH produced photolytically by Hg lamp radiation.
p Corresponds to β                 q
                     N2 × 100 %. Measured in ambient air with natural OH at daytime.

nomenclature introduced by Mao et al. (2012).                                                  tetrafluoroethylene) Teflon tube with 10 mm internal diam-
                                                                                               eter that is mounted in an aluminium body. Two stainless-
                   SWAVE    1                                                                  steel injectors (1/8 in. o.d. tubes with 50 µm i.d.) are lo-
[OH]WAVE =               =     × (Son − Soff )                                     (1)
                    COH    COH                                                                 cated 50 mm above the nozzle pinhole pointing to the cen-
Here, SWAVE is the OH radical fluorescence signal normal-                                      tre of the CMR tube. For typical measurement conditions,
ized to the UV laser power. It is obtained from the differ-                                    20.6 slpm (1 slpm = 1 L min−1 at 1 atm and 20 ◦ C) of ambi-
ence between Son and Soff , the on- and off-resonance signals,                                 ent air is sampled. A constant flow of 500 sccm (1 sccm =
respectively. COH represents the OH radical detection sensi-                                   1 cm3 min−1 at 1 atm and 20 ◦ C) of nitrogen (N2 , purity >
tivity, which is obtained during the calibration of the instru-                                99.9990 %) or a mixture of nitrogen and the OH scavenger
ment. The instrument is calibrated for OH radicals by illumi-                                  (Air Liquide, propane, purity > 99.95 %; 5.0 ± 0.1 % mix-
nating humidified synthetic air (Linde, N2 and O2 purity >                                     ture in nitrogen, purity > 99.999 %) regulated by mass flow
99.99990 %) by a mercury lamp thereby producing a known                                        controllers is injected into the main stream. When propane
amount of OH radicals (approximately 5.0 × 109 cm−3 at                                         is added, the resulting propane mixing ratio downstream
0.8 % water vapour mixing ratio) by photolysis of water                                        of the injectors is typically 19 ppmv. The concentration of
vapour at 185 nm. The intensity of the light is determined                                     propane was selected to scavenge OH radicals efficiently
by actinometry, and it is measured by a calibrated photo-                                      (90 %–95 %) in the CMR but to avoid scavenging OH rad-
diode. The 1σ accuracy of the calibration is 10 % (Holland                                     icals in the detection cell of the instrument (see Sect. 3.2).
et al., 2003). The detailed design of the radical source and                                   Propane is used as an OH scavenger because it does not pho-
the calibration procedure are described in previous studies                                    tolyse at the wavelength of the laser and does not react with
(Holland et al., 2003; Fuchs et al., 2011).                                                    other oxidants (e.g. O3 ) which could produce OH radicals in
   Hydroxyl radicals originating not from ambient air but                                      the CMR. When switching from the mixture of a scavenger
formed within the detection cell will also be detected if they                                 and nitrogen to pure nitrogen, the injection lines are flushed
are excited by the laser in the detection volume. To quantify                                  for 15 s at a higher flow rate of 700 sccm to remove any resid-
the interference signal from internally generated OH radicals,                                 ual scavenger molecules from the lines. The measurement
a chemical modulation reactor (CMR) has been developed                                         time with addition of propane is 135 s, followed by another
and mounted in front of the OH detection cell of both the                                      period of 135 s without propane injection. A complete cycle
LIF system permanently mounted at the SAPHIR chamber                                           therefore takes 270 s. The flow rate behind the injectors is
(in this study) and the LIF system used in field campaigns                                     21.1 slpm. It is controlled by a flow controller (Bronkhorst,
(Tan et al., 2017, 2018, 2019). The CMR outline is shown                                       low 1 − p) connected to a membrane pump which removes
in Fig. 1, and instrumental characteristics are listed in Ta-                                  20 slpm of excess air while the OH measurement cell sam-
ble 1. The reactor consists of a 79 mm long PTFE (poly-                                        ples 1.1 slpm.

Atmos. Meas. Tech., 14, 1851–1877, 2021                                                                                https://doi.org/10.5194/amt-14-1851-2021
C. Cho et al.: Characterization of the FZJ-LIF-CMR for the measurement of OH radicals                                            1855

                                                                        The conversion of SOH into an interference-free ambient OH
                                                                        concentration, called [OH]CHEM , requires calibration.

                                                                                        1
                                                                        [OH]CHEM =            SOH                                  (6)
                                                                                      COH βN2

                                                                        In addition to the detection sensitivity COH of the OH de-
                                                                        tection cell without the CMR, the OH transmission of the
                                                                        CMR in the N2 mode (βN2 ) needs to be known. In the present
                                                                        system, the transmission is reduced due to wall loss reac-
                                                                        tions and has a typical value of 64 %. The quantities COH
                                                                        and βN2 have to be calibrated either separately or together
                                                                        (COH × βN2 ) by calibrating the OH cell with the CMR in
                                                                        place (see Sect. 3).
                                                                           The interference OH signal Si can be converted into an
                                                                        equivalent ambient OH concentration in analogy to Eq. (6).
Figure 1. Schematic drawing of the chemical modulation reactor                      1
(CMR) in front of the OH LIF detection cell. Ambient air is drawn       [OH]i =           Si                                       (7)
                                                                                  COH βN2
through a PFA (perfluoroalkoxy alkane) flow tube (79 mm length;
10 mm inner diameter). A flow of 1.1 slpm is expanded through an        It should be noted that the application of the CMR relies on
0.4 mm inlet nozzle into a low-pressure cell for OH detection, and
                                                                        the assumption that interfering chemical species, which pro-
20 slpm of excess air are removed by a pump. A nitrogen flow of
                                                                        duce OH inside the instrument, are not affected by switch-
0.5 slpm containing 19 ppmv propane as an OH scavenger is added
via two 1/8 in. (o.d.) injector tubes (50 µm i.d.) 50 mm above the      ing between N2 and scavenger injection in the CMR. Fur-
nozzle. The distance between the injector tips is less than 1 mm. All   thermore, it is assumed that internal OH is not scavenged by
flows (nitrogen flow, excess flow and nozzle flow) are held constant    propane inside the OH detection cell. The latter assumption
during operation.                                                       was confirmed for this instrument (see Sect. 3).

                                                                        2.2   Additional instrumentation
   Without added scavenger (N2 mode of operation), the OH
signal obtained from an on- and off-resonance measurement               A large suite of additional instruments was available for ex-
cycle is                                                                perimental studies in the SAPHIR chamber. Measurements
                                                                        of interest are listed in Table 2 with 1σ accuracies and pre-
 N2
SOH = SOH + Si .                                                 (2)    cisions. The calibration-free differential optical absorption
                                                                        spectroscopy (DOAS) instrument (White cell, absorption
It contains the signal SOH from ambient OH radicals which               path length: 2.2 km) provided an absolute reference for OH
pass the CMR and reach the inlet nozzle of the detection cell           radical measurements with a 1σ accuracy of 6.5 % (Haus-
and potentially an interference signal Si from OH radicals              mann et al., 1997; Schlosser et al., 2007, 2009). The pres-
that are produced inside the cell (internal OH). When the               sure and temperature dependence of the OH absorption cross
scavenger is added (sc mode of operation), a large percentage           section has been discussed in detail in the study by Dorn et
(typically 96 %) of atmospheric OH radicals are removed by              al. (1995). Within the natural variance of the atmospheric
reaction with propane. The OH signal in the scavenger mode              pressure and a temperature interval of ±20 K around room
is                                                                      temperature, the OH cross section changes less than 2 %.
 sc
                                                                        The LIF instrument for OH concentration measurement in-
SOH = αSOH + Si .                                                (3)    cludes two more measurement cells for the detection of HO2
                                                                        and RO2 radicals. In the second LIF cell (HOx cell), HO2 is
It consists of the OH signal from the residual ambient OH,
                                                                        indirectly measured by chemical conversion to OH by NO
which is reduced by a factor α due to scavenging, and Si .
                                                                        (Linde, mixture of 1 % NO in nitrogen (purity > 99.999 %))
The residual factor α has to be determined experimentally
                                                                        (Fuchs et al., 2011). During the JULIAC experiments, NO
(see Sect. 3), in order to calculate SOH and Si from a set of
                                                                        (2.5 × 1013 cm−3 ) was used for minimizing a possible inter-
measurements in the scavenging and nitrogen modes.
                                                                        ference from specific RO2 radicals as suggested in Fuchs et
        N2    sc                                                        al. (2011). OH reactivity (kOH ) was measured by a laser-
       SOH − SOH
SOH =                                                            (4)    photolysis laser-induced fluorescence instrument (LP-LIF)
         1−α                                                            (Lou et al., 2010; Fuchs et al., 2017b). Photolysis frequencies
      sc − α
     SOH
Si =         1−α                                                 (5)    were calculated from spectral actinic flux densities measured
        N2                                                              by a spectroradiometer (Bohn et al., 2005; Bohn and Zilken,
       SOH

https://doi.org/10.5194/amt-14-1851-2021                                                 Atmos. Meas. Tech., 14, 1851–1877, 2021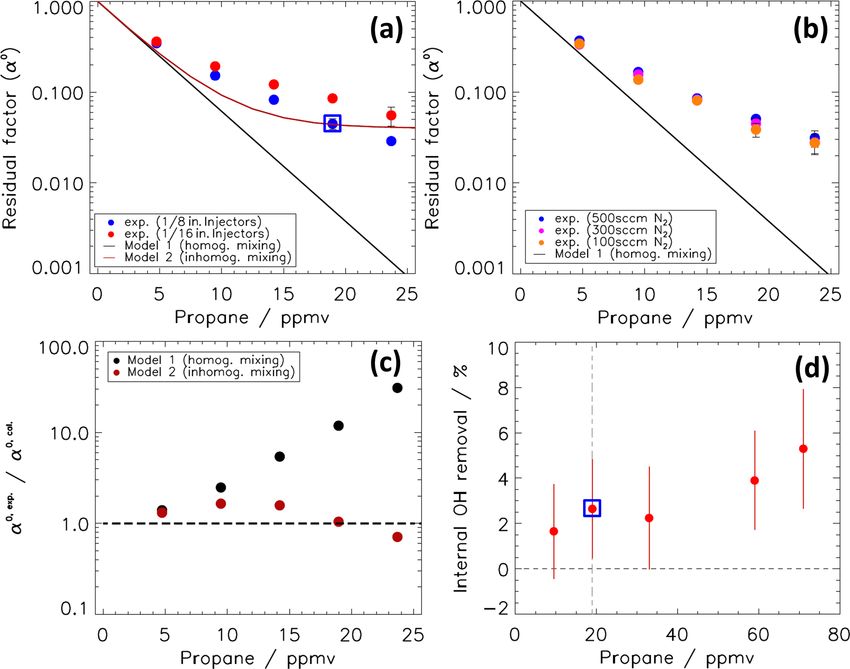
1856 C. Cho et al.: Characterization of the FZJ-LIF-CMR for the measurement of OH radicals
2005). In addition, NO3 radical concentrations were moni- the degradation of VOCs, NOx , and formation and ageing of
tored by a custom-built cavity ring-down spectroscopy (FZJ- particles. Ambient air was sampled at 50 m height through
CRDS) instrument; nitrous acid (HONO) was monitored by a SilcoNert® coated inlet line (104 mm i.d.) at a flow rate
a long-path absorption photometer (LOPAP) (Kleffmann et of 660 m3 h−1 . Around 250 m3 h−1 of this airflow was di-
al., 2006; Li et al., 2014); the water vapour mixing ratio rected towards the SAPHIR chamber. This new inlet system
was monitored by a cavity ring-down spectroscopy instru- for SAPHIR enables all instruments to measure the same air
ment (CRDS, Picarro); nitric oxide (NO) and nitrogen diox- composition without the perturbation of steady-state condi-
ide (NO2 ) were monitored by a chemiluminescence (CL) in- tions by local emitters. The inlet line was gently heated (+1
strument with a photolytic converter (ECO PHYSICS); and to 2 ◦ C above ambient temperature) to avoid water vapour
O3 was monitored by UV absorption instruments (Ansyco condensation in the line. A cyclone was positioned upstream
41M and Thermo Scientific 49i) that agree within 5 %. of the SAPHIR chamber to remove particles with a diameter
larger than 10 µm. The residence time of the ambient air in
2.3 Atmospheric simulation chamber SAPHIR the chamber was about 1 h, giving enough time for radicals
and short-lived trace gases to reach a new steady state and
Comprehensive tests of the FZJ-LIF-CMR instrument with smoothing atmospheric variability. Daytime-averaged mete-
synthetic (Sect. 3) and ambient air (Sect. 4) were performed orological conditions and trace gas concentrations during
in the atmosphere simulation chamber SAPHIR on the cam- each JULIAC intensive phase are summarized in Table 3, and
pus of Forschungszentrum Jülich, Germany, as the instru- nighttime-averaged data are shown in Table S2 in the Sup-
ment is permanently mounted in the SAPHIR chamber. A de- plement. Daytime is defined by the condition that the HO2
tailed description of the chamber has been presented in previ- photolysis frequency is greater than 0.5 × 10⁻⁴ s−1 . In Ta-
ous publications (Bohn and Zilken, 2005; Rohrer et al., 2005; ble 3 and S2, the total OH reactivity of non-methane VOCs
Fuchs et al., 2010b). Briefly, the chamber has a cylindri- (kVOC ) is calculated by subtracting the contribution of CO,
cal shape (length: 18 m, diameter: 5 m and volume: 270 m3 ) CH4 , O3 , NO and NO2 from the measured OH reactivity.
and is made of a double Teflon (FEP; fluorinated ethylene The tables show that a large range of chemical and meteoro-
propylene) film, which has a light transmission greater than logical conditions were encountered during the four different
0.8 over the complete solar spectral range (Bohn and Zilken, JULIAC campaigns, allowing for the investigation of possi-
2005). A slight overpressure is maintained inside the cham- ble interferences in the OH radical measurement for different
ber, and clean nitrogen is used to flush the volume between scenarios (e.g. summer and winter, high and low NO and O3 ,
the inner and outer FEP films to prevent contamination from and high and low humidity) in a rural environment.
outside the chamber. Two fans are mounted inside the cham-
ber to ensure a homogeneous mixing of trace gases.
The SAPHIR chamber is an ideal tool to test and char- 3 Characterization and test of the CMR for clean-air
acterize instruments for the measurement of atmospheric conditions
trace gases, as was shown for the measurements of OH
(Schlosser et al., 2007, 2009; Fuchs et al., 2012a), HO2 This section describes the characterization and test of the
(Fuchs et al., 2010b), HO2 (Fuchs et al., 2010a), NO3 (Dorn CMR for conditions where the measured air is very clean.
et al., 2013), N2 O5 (Fuchs et al., 2012b) and OH reactivity This condition was simulated by performing experiments in
(Fuchs et al., 2017a). In this study, the chamber was used for synthetic air.
experiments with synthetic air (Linde, purity: > 99.99990 %)
to test the CMR for known interferences from ozone and wa- 3.1 CMR transmission
ter and NO3 radicals (Sect. 3) and with ambient air (Sect. 4).
The loss of OH radicals in the CMR and the scavenging effi-
2.4 JULIAC campaign ciency were determined in laboratory experiments using the
photolytic radical source which is also used for absolute cal-
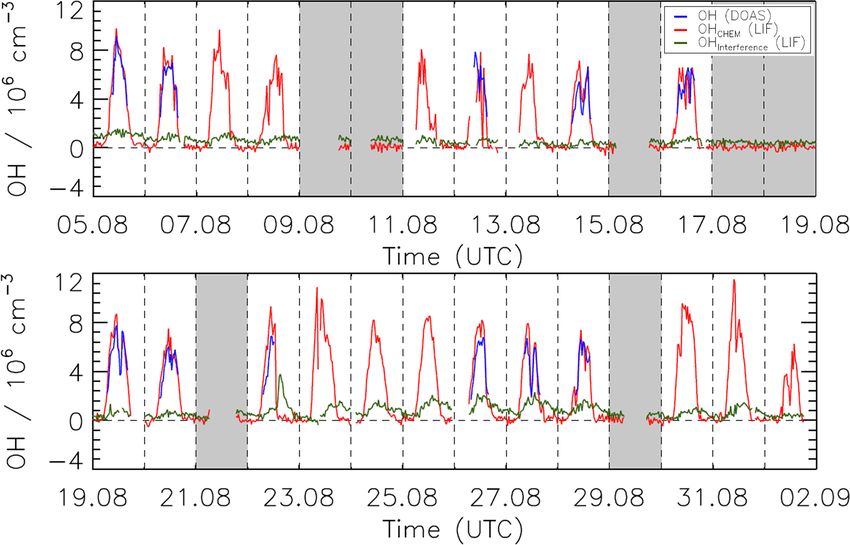
The CMR system was further used for OH measurements in ibration of the instrument. As is usual, OH radicals are pro-
SAPHIR within the Jülich Atmospheric Chemistry Project duced by 185 nm photolysis of water vapour in a flow of
(JULIAC) in 2019, during which ambient air was continu- synthetic air at 1 atm and room temperature, where the con-
ously flowed through the chamber. The campus is surrounded centration of formed OH is determined from the humidity,
by a mixed deciduous forest and is located close to the small volume flow and the intensity of the 185 nm radiation. The
town of Jülich. Therefore, ambient air is expected to be in- latter is observed by a phototube which can be traced back to
fluenced by both anthropogenic and biogenic emissions. The a measurement of ozone which is produced in the same gas
JULIAC campaign consisted of four intensive phases, each flow by 185 nm photolysis of oxygen (for details see Fuchs et
carried out within one season (Table 3). It was designed to al., 2011). The radical source was operated with a total flow
examine the seasonal and diurnal cycle of atmospheric ox- of 24 slpm, which overflowed the inlet of the CMR tube. The
idants in a mixed environment and the role of oxidants in length of the laminar flow tube (18.7 mm i.d. with a frit at
Atmos. Meas. Tech., 14, 1851–1877, 2021 https://doi.org/10.5194/amt-14-1851-2021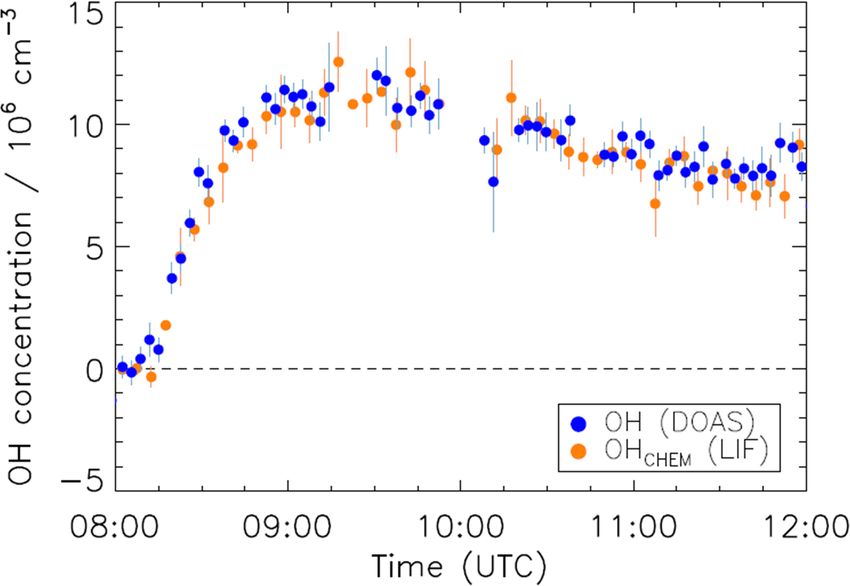
C. Cho et al.: Characterization of the FZJ-LIF-CMR for the measurement of OH radicals 1857
Table 2. Specification of instruments used at SAPHIR in this study.
Species Measurement Time Limit of detection Accuracy
technique resolution(s) (1σ ) (1σ )
OH LIF-CMR 270 0.7 × 106 cm−3 18 %
OH DOAS 134 0.8 × 106 cm−3 6.5 %
HO2 LIF 47 0.8 × 107 cm−3 18 %
OH reactivity (kOH ) LP-LIF 180 0.3 s−1 18 %
Photolysis frequencies Spectroradiometry 60 a 10 %
O3 UV photometry 40 1 ppbv 5%
NOx (NO + NO2 ) Chemiluminescence 180 NO: 4 pptv, NO2 : 2 pptv 5%
HONO LOPAP 180 5 pptv 10 %
NO3 CRDS 1 3 pptv 30 %
H2 O CRDS 60 0.1 %b 5%
a Several orders of magnitude lower than the maximum value at noon. b Volume mixing ratio.
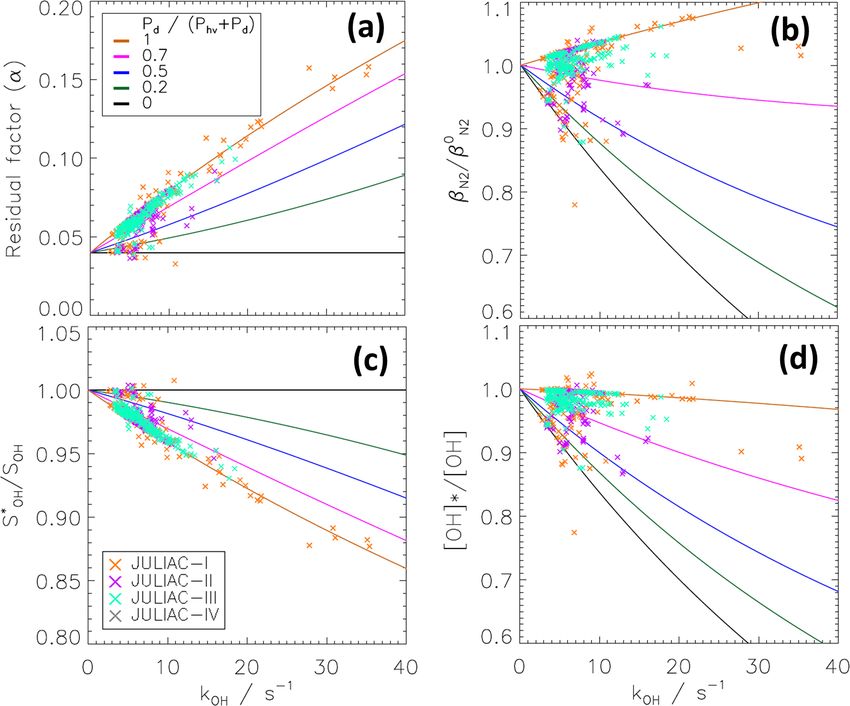
Table 3. Summary of meteorological conditions and trace gas concentrations during JULIAC given as daytime median values with 1σ
standard deviations of ambient variabilities.
OH NO O3 H2 O kOH b
kVOC T j (O1 D) Pd Phv
106 cm−3 ppbv ppbv %a s−1 s−1 ◦C 10−6 s−1 ppbv s−1 ppbv s−1
14 January–11 February 0.27 0.3 22.3 0.6 6.1 2.2 4.7 0.3 0.2 0.15
(±0.8) (±6.2) (±9.7) (±0.2) (±6.0) (±2.2) (±4.0) (±0.4) (±0.2) (±0.1)
9 April–6 May 1.6 0.2 41.6 0.7 5.8 3.0 15.6 2.0 1.9 0.6
(±2.3) (±1.7) (±17.5) (±0.2) (±2.6) (±1.4) (±7.5) (±2.7) (±0.8) (±0.2)
4 August–2 September 3.0 0.2 38.5 1.4 6.3 3.2 26.6 3.6 1.9 0.4
(±3.2) (±0.5) (±18.0) (±0.3) (±2.9) (±2.3) (±6.9) (±3.7) (±1.0) (±0.2)
28 October–24 November 0.4 0.8 16.8 0.8 5.6 1.7 8.4 0.5 0.9 0.1
(±1.1) (±2.8) (±11.1) (±0.2) (±3.5) (±1.5) (±4.5) (±0.7) (±0.5) (±0.1)
a Volume mixing ratio. b OH reactivity of non-methane VOCs, calculated as the difference between measured total k
OH and the sum of calculated reactivities of CH4 , CO, O3 , NO and
NO2 .
the top and a Reynolds number Re of 1920) of the radical the detected OH was found when the material of the injectors
source is 20 cm, resulting in plug flow condition that ensures was changed. Since Teflon and stainless steel have surface re-
a uniform distribution of OH and O3 in the calibration gas. action probabilities for radicals which are different by orders
This condition was confirmed by ozone measurements with of magnitude (Rozhenshtein et al., 1985), the result suggests
a modified chemiluminescence instrument (50 pptv limit of that OH loss at the injector surfaces is negligible regardless
detection), showing that the ozone concentration in the cen- of its material.
tral flow was the same within a few percent compared to the Since the injector tubes do not cause OH losses, the OH
mean ozone concentration leaving the radical source. transmission in the N2 mode (βN2 ) can be described as the
Several tests were performed to characterize heteroge- product of transmissions of the entrance section (β e ) and re-
neous OH losses at surfaces in the CMR. Three reactive action section (βNr 2 ) (see Fig. 2).
regions can be distinguished (Fig. 2): the entrance section
above the injectors, the injector tubes and the reaction sec- βN 2 = β e × βN
r
2
(8)
tion downstream of the injectors. The flow in the entrance
section is in the transition regime between laminar and tur- As a next step, the values of β e and βNr 2 were determined
bulent (Reynolds number Re = 2800), but turbulence is fur- experimentally using clean air as a carrier gas for OH. The
ther increased by the injectors which protrude approximately clean-air condition (kOH = 0) will be indicated by the super-
4 mm into the flow tube. In order to quantify potential OH script 0 in the following. First, the OH transmission of the
loss on the surface of the injectors, the stainless-steel injec- CMR tube without built-in injectors was determined by mea-
tors were replaced by Teflon tubes of the same geometry for a suring OH from the radical source with and without the CMR
0
mounted on the OH cell. A transmission βtube of 0.81 ± 0.02
test. Within measurement precision (±3 %), no difference in
was determined for a flow rate of 21.1 slpm. Assuming that
https://doi.org/10.5194/amt-14-1851-2021 Atmos. Meas. Tech., 14, 1851–1877, 2021
1858                                C. Cho et al.: Characterization of the FZJ-LIF-CMR for the measurement of OH radicals

                                                                            Table 4. Transmission and wall loss rate coefficients for OH and
                                                                            HO2 in the chemical modulation reactor (1/8 in. injectors) when
                                                                            nitrogen is injected.

                                                                                                                      OH                   HO2
                                                                                                              kw s−1          β        kw s−1     β
                                                                                  Entrance sectiona               12.3      0.92          5.5    0.96
                                                                                  Reaction sectionb                 33      0.69         14.5    0.85
                                                                                  Total CMR                          –      0.64            –    0.82

                                                                                a Transit time is 6.6 ms. b Transit time is 11.2 ms.

                                                                            CMR between 12 and 21.1 slpm was investigated (Fig. S1).
                                                                            When the flow rate increases, it has two opposing effects.
                                                                            First, it decreases the residence time in the CMR, leading to
                                                                            a steady increase of the OH transmission from about 60 %
                                                                            at 12 slpm to 65 % at 15 slpm. Second, an increasing flow
                                                                            rate causes more turbulence and faster radial transport to the
                                                                            wall. This is the likely reason for flattening of the transmis-
                                                                            sion curve at flow rates above 15 slpm. A further increase of
                                                                            the flow rate of more than 21 slpm does not improve the OH
                                                                            transmission in synthetic air. To minimize the possible ef-
                                                                            fect of secondary chemistry, the CMR was operated with the
                                                                            fastest flow rate achievable (21.1 slpm), which corresponds
                                                                            to a transmission a transmission βN0 2 of 0.64.
                                                                               Using the experimental values of βN0 2 and β e,0 , the rela-
Figure 2. Schematic of the chemical modulation reactor (CMR).
The flow tube has an entrance section with a length le up to the in-        tionship (Eq. 8) yields βNr,02 = 0.69 as the transmission of the
jector position. In this section, OH radicals are lost by wall reaction     reaction section. With a transit time 1tr = 11.2 ms, a wall
                                                      e , resulting in an                          r of 33 s−1 is obtained.
                                                                            loss rate coefficient kw
during the transit time 1te with a rate coefficient kw
OH transmission β e . Behind the injector position follows the reac-           The same procedure was used to determine also the CMR
tion zone, where OH is scavenged when propane is injected into the          transmission for HO2 radicals, which provides information
flow. The reaction zone has a length lr with a transit time 1tr and         needed to calculate OH production in the CMR by Reac-
                            r . The OH transmission β r in the reaction
wall loss rate coefficient kw                           i                   tion R4 (Sect. 4). In this case, the calibration source was op-
section depends on the chemical modulation mode (i = N2 when                erated with added CO (300 ppmv) in order to convert all OH
pure nitrogen is injected and i = sc when a scavenger–nitrogen mix-
                                                                            to HO2 in the calibration gas (Fuchs et al., 2011). In order
ture is injected). The total transmission for OH is given by the prod-
                                                                            to detect HO2 , the CMR was mounted on a HOx detection
uct β e βir .
                                                                            cell. The measured transmissions and wall loss rate coeffi-
                                                                            cients for HO2 are listed in Table 4 together with the results
the OH loss is caused by only wall reactions and follows first-             for OH.
order kinetics, a rate coefficient kw = 11.8 s−1 is calculated                 The rate coefficients for HO2 are a factor of 2 smaller than
from                                                                        for OH because HO2 is less reactive. If the wall loss was
                                                                            limited by the reactive collision frequency at the wall sur-
 0                                                                          faces, a larger difference would be expected because the re-
βtube = exp (−kw 1t) ,                                               (9)
                                                                            action probability γ on Teflon surfaces is about a factor of 10
where 1t is the transit time through the tube. The rate co-                 smaller for HO2 compared to OH (Rozhenshtein et al., 1985).
efficient kw that was obtained can be used to estimate the                  The rate coefficient ks for wall loss due to reactive surface
transmission of the entrance section (β e,0 ),                              collisions can be calculated for a cylindrical tube with radius
                                                                            R by
β e,0 = exp −kw e

                  1te ,                                (10)
                                                                                      u
which has a transit time 1te = 6.6 ms, yielding β e,0 = 0.92.               ks = γ                                                                      (11)
                                                                                     2R
   With built-in 1/8 in. injectors and nitrogen injection, an
OH transmission of βN0 2 = 0.64 ± 0.03 was measured for the                 if transport in the gas phase presents no resistance (Zasyp-
total CMR. The wall loss of OH radicals for a flow rate in the              kin et al., 1997). For OH with a mean molecular velocity u

Atmos. Meas. Tech., 14, 1851–1877, 2021                                                           https://doi.org/10.5194/amt-14-1851-2021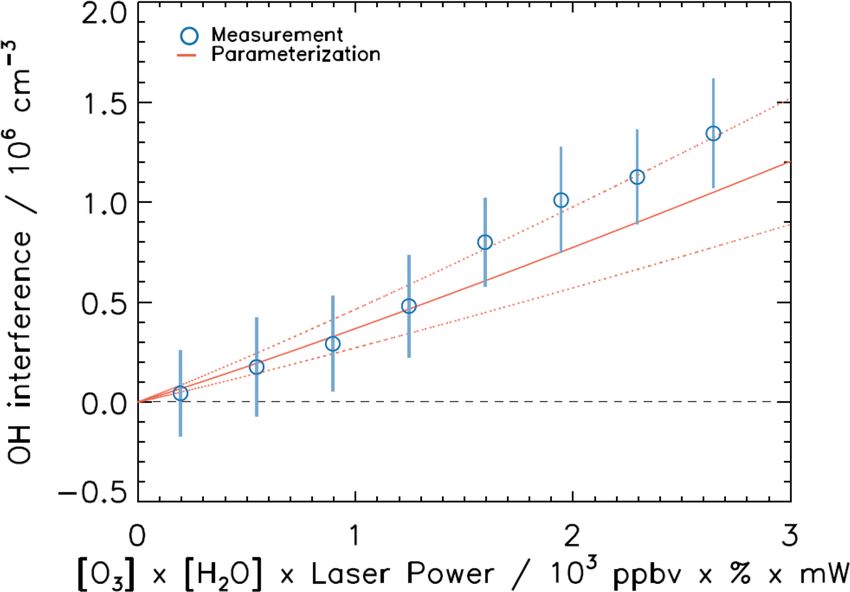
C. Cho et al.: Characterization of the FZJ-LIF-CMR for the measurement of OH radicals                                          1859

of 610 m s−1 (298 K) and γ of 2.5 × 10⁻³ for Teflon sur-            exponential decay. This behaviour indicates inhomogeneous
faces (Rozhenshtein et al., 1985), the value of ks is 152 s−1 .     mixing of propane in the CMR flow.
The measured rate coefficients for OH loss (kw ) (Table 4)             Figure 3a also shows that the use of 1/8 in. injectors
are an order of magnitude smaller, indicating that OH loss in       leads to improved mixing compared to 1/16 in. injectors. The
the CMR tube is limited by turbulent transport to the walls,        likely reason is that the 1/8 in. injectors produce a larger flow
which is about 3 times faster in the reaction section compared      resistance within the CMR and produce higher turbulence
to the CMR entrance region.                                         in the flow because of their larger surface. The disadvan-
                                                                    tage of the 1/8 in. injectors is a smaller CMR transmission,
3.2    Scavenging efficiency                                        βN0 2 = 0.64, compared to a value of 0.75 for the 1/16 in. in-
                                                                    jectors. Thus, the faster mixing of propane using the 1/8 in.
The same radical source operated with clean synthetic air           injectors goes along with a higher OH wall loss.
was also used for the characterization test of scavenging ef-          Figure 3b shows that the carrier gas (N2 ) flow rate has
ficiency. When propane is injected into the CMR, the chem-          only a minor influence on α 0 , when the injector flow rate is
istry in the reaction section changes. When no propane is in-       changed between 100 and 500 sccm. In order to ensure fast
jected (N2 mode), OH is only lost by wall reaction.                 exchange of the gases in the injector lines, the higher flow
  r,0            r

                                                                    rate of 500 sccm was chosen for routine operation. For the
βN  2
      = exp −kw    1tr                                  (12)
                                                                    majority of the results shown in this study, the 1/8 in. in-
In the scavenger mode, additional OH loss occurs by the gas         jectors were used to maximize the mixing in the CMR. The
phase reaction with propane. The OH transmission is then            1/16 in. injectors were only tested during part of the JULIAC
given by                                                            experiments (Table S1).
  r,0
βsc
               r
      = exp − kw

                  + ksc 1tr ,                          (13)            Ideally, α would be zero. In that case, the OH signal in
                                                                    the scavenger mode would be identical to the interference
where ksc is the pseudo-first-order rate constant for a reaction    signal (Si = SOH sc ), and the ambient OH signal would sim-
between OH and propane.                                             ply be given by the signal difference of both modes (SOH =
                                                                      N2      sc ). Higher propane concentrations should result in
ksc = kOH+propane [propane]                                 (14)    SOH   − SOH
                                                                    smaller α values, but Fig. 3a shows that a further increase of
Here, kOH+propane is the bimolecular rate constant for scav-        the propane concentration beyond 20 ppmv gives only small
enging, which has a value of 1.1 × 10⁻¹² cm3 s−1 at 298 K           improvements in α. In order to avoid OH scavenging in the
(Atkinson et al., 2006).                                            detection cell by propane concentrations that are too high
   The fraction of ambient OH remaining that subsequently           that would lead to an underestimation of the interference sig-
enters the measurement cell downstream of the CMR when              nal, the propane concentration in the CMR was chosen as
the CMR is operated in the scavenging mode is the ratio of          19 ppmv for routine operation. Note that 19 ppmv would be
  r to β r .
βsc     N2                                                          the nominal value if the injected propane is homogeneously
         r                                                          mixed into the total CMR flow. For this condition, 96 % of
      βsc
α=          ,                                               (15)    OH is scavenged (α 0 = 0.042). This value corresponds to
      βNr 2                                                         an effective scavenging rate coefficient ksc   eff of 283 s−1 in

which in the specific case of synthetic air (kOH = 0) becomes       Eq. (16). It is a factor of 1.8 smaller than calculated for com-
                                                                    plete homogenous mixing (ksc = 513 s−1 ).
        r,0
       βsc                                                             A plausible explanation for the weaker-than-expected de-
α0 =            = exp (−ksc 1tr ) ,                         (16)
       βNr,02                                                       pendence of α on the propane concentration is incomplete
                                                                    mixing of the injected scavenger. A minor fraction f of a
where α 0 was experimentally determined for OH in synthetic         few percent of the total CMR flow containing little or no
air from the radical source by calculating the ratio of OH          scavenger would explain the observed dependence of α 0 in
signals measured with and without any scavenger. The mea-           Fig. 3a. The fraction with no scavenger (k 0 sc = 0) can be
sured ratio is denoted α 0 , where the superscript indicates that   imagined as gas filaments with α1 (k 0 sc = 0) of 1 embed-
the sampled air does not contain any additional OH reactants        ded in the turbulent flow. The bulk flow, i.e. the major part
(kOH = 0). Note that the value of the residual factor α is dif-     (1 − f ), would contain all the injected propane well mixed,
ferent for ambient air (kOH 6 = 0) as is discussed in Sect. 4.      with α2 (k 00 sc = kOH+propane [Propane]). The resulting α 0 of
Figure 3a and b show the measured dependence of α 0 on the          the total CMR flow would then be
added amount of propane for different instrumental condi-
                                                                    α 0 = (1 − f ) α2 k 00 sc + f α1 k 0 sc = 0

tions. For small amounts of propane, α 0 decreases nearly ex-
                                                                         = (1 − f ) α2 k 00 sc + f.

ponentially as expected from Eq. (16), whose derivation as-                                                                      (17)
sumes homogenous mixing of the scavenger. At higher scav-           Using Eqs. (16) and (17), we obtain
enger concentrations, however, α 0 levels off into a weak de-
                                                                    α 0 = (1 − f ) exp k 00 sc 1tr + f.

pendency and decreases more slowly than expected from an                                                                        (18)

https://doi.org/10.5194/amt-14-1851-2021                                              Atmos. Meas. Tech., 14, 1851–1877, 2021
1860                             C. Cho et al.: Characterization of the FZJ-LIF-CMR for the measurement of OH radicals

Figure 3. (a) Residual factor (α 0 ) for OH in a flow of humidified synthetic air running through the CMR. The OH air mixture is provided
by a photolytic OH radical source. α 0 is shown as a function of the calculated concentration of propane (at 298 K and 1 atm), which is
injected as a scavenger with 500 sccm N2 into the CMR flow. The experimental α 0 values are shown for two types of injectors with different
outer diameters (1/8 and 1/16 in.). The blue open squares indicate the condition used for normal operation in this work. Measurements
are compared to calculations assuming either homogeneous or inhomogeneous mixing. (b) Same as (a), showing measured α 0 values for
different injector flow rates. (c) Ratio of experimental and modelled α 0 for the case with 1/8 in. injectors and 500 sccm N2 injector flow.
(d) Measured OH removal by internal scavenging inside the OH detection cell (see text).

This is a simple model for the case of inhomogeneous mixing             study. As employed in the HO2 transmission tests, the rad-
with an assumed value of f = 0.04, which provides a better              ical source was operated as a pure HO2 source. The CMR
description of the observed dependence of α on the propane              was mounted on the HOx detection cell, which used an NO
concentration than Eq. (16) (Fig. 3a and c). In this model,             concentration 10 times higher than during typical operation
the calculated reactivity k 00 sc is 534 s−1 , which is larger than     for ambient HO2 concentration measurements by an injec-
the ksc for complete homogeneous mixing, as the injected                tion of 8 sccm of 10 % NO (Linde NO 10 %, mixture in ni-
propane is assumed to be mixed in a smaller volume flow                 trogen) to achieve a high HO2 -to-OH radical conversion effi-
(96 % of the total volume flow).                                        ciency of 85 %. The HO2 radical concentration provided by
                                                                        the radical source is not affected by the propane injection in
3.3    Scavenging of internal OH                                        the CMR, but the HO2 is converted to OH in the detection
                                                                        cell. If a significant number of OH radicals were scavenged
                                                                        by propane inside the detection cell, a difference between the
As mentioned above, the concentration of propane is cho-                measured signals with and without propane injection in the
sen not to scavenge any OH radicals in the detection cell.              CMR would be observed. Different propane concentrations
Calculations suggest that less than 1 % of OH radicals are              (10 to 75 ppmv) were tested during the experiment (Fig. 3d).
scavenged in the detection cell at 19 ppmv of propane be-               A small amount of (3 ± 2) % of internal OH was scavenged
cause of the low pressure (4 hPa) and the short residence               when 19 ppmv of propane was applied. An increase of in-
time (3 ms) in the detection cell. A laboratory test to quan-           ternal removal up to a value of (5 ± 3) % was observed for
tify internal OH removal in the detection cell was proposed             the highest propane mixing ratio (75 ppmv). The internal-
by Woodward-Massey et al. (2020) and was also done in this

Atmos. Meas. Tech., 14, 1851–1877, 2021                                                    https://doi.org/10.5194/amt-14-1851-2021
C. Cho et al.: Characterization of the FZJ-LIF-CMR for the measurement of OH radicals 1861
scavenging value of (3 ± 2) % for the operation conditions in
this work applies to OH radicals, which are internally formed
and exposed to reaction with propane on a similar timescale
as in the HO2 -to-OH conversion (ca. 2 ms) in the test exper-
iment. OH that is produced photolytically in the laser beam
has a much shorter residence time (ca. 0.1 ms) before it is re-
moved by the fast gas flow and will therefore be much less
affected by internal scavenging. As discussed by Woodward-
Massey et al. (2020), internal OH that is immediately formed
after the sampled air has passed the inlet nozzle would have
a longer residence time, which could be larger by up to a fac-
tor of 2 compared to the HO2 conversion experiment. Even
in this case, the internal scavenging would have a small effect
and is therefore considered negligible.
3.4 OH detection sensitivity and calibration Figure 4. Time series of OH concentrations measured by DOAS
and LIF (with CMR) in humidified synthetic air in the SAPHIR
As mentioned in Sect. 2.1, the conversion of interference- chamber. The measured OH reactivity in the chamber air was less
than 2 s−1 . The chamber was illuminated by solar radiation, and
free ambient OH signals SOH into ambient concentrations
OH was mainly produced by solar photolysis of traces of nitrous
requires the experimental determination of the parameters
acid emitted from the chamber walls. The data shown are averaged
COH and βN2 (Eq. 6). The combined detection sensitivity over 300 s.
COH × βN0 2 of the measurement system with the mounted
CMR was calibrated with the radical source, which provided
a known OH concentration in humidified synthetic air. The
superscript 0 in βN0 2 indicates that the calibration was done
in synthetic air (kOH = 0). The calibration was independently cycles which yield three ambient OH data points (45 s). The
tested by an OH measurement comparison against the OH subsequent scavenger mode (135 s) again contains three on-
DOAS instrument which provides an absolute reference for and off-resonance cycles. Another disadvantage of the CMR
OH concentrations in the SAPHIR chamber. The chamber is the reduction of the OH detection sensitivity by a factor
was filled with clean synthetic air. Only water vapour (1.3 %) of 1.6 due to wall loss in the CMR, yielding a 1σ limit of de-
was injected, and the chamber roof was opened, allowing tection (LOD) of 7×105 cm−3 (Table 2). Note that this LOD
for the photolytic formation of OH radicals from HONO, value applies to a single OH data point of 45 s duration.
which is photochemically produced at the chamber walls Accuracy and precision of the OH measurements are gen-
(Rohrer et al., 2005). Figure 4 shows the OH radical concen- erally worsened because [OH]CHEM requires more experi-
trations measured by DOAS and LIF-CMR ([OH]CHEM ). The mental parameters (COH , α and βN2 ) for evaluation than
difference between the measured time series is on average OHWAVE , as well as more measurement modes, each of
(0.29 ± 0.9) × 106 cm−3 , which is less than 5 % of the aver- which contribute additional noise. The 1σ accuracy of OH
age measured OH concentrations between 08:30 and 12:00. measurements depends on the error of the radical source
Thus, the instruments agreed well within the combined 1σ (10 %) and the reproducibility of the experimental determi-
accuracies of the LIF-CMR calibration (±18 %) and DOAS nation of COH ×βN0 2 and α 0 . During the 1-year JULIAC cam-
(±6.5%), which confirms the LIF calibration. A linear re- paign (Sect. 4), the reproducibilities were 15 % and 10 %,
gression (not shown) which considers the precision of both respectively, resulting in a total 1σ accuracy of ±18 %. Ad-
instruments using the “fitexy” algorithm (Press, 1992) be- ditional uncertainties arise when air pollutants influence the
tween LIF-CMR and DOAS yields a slope of 0.97. The good chemistry in the CMR (see Sect. 4).
agreement gives confidence in the applied chemical modu-
lation technique under the operational conditions and in the
3.5 Interference tests
laboratory-determined parameters of α 0 and COH × βN0 2 used
for data evaluation.
The implementation of chemical modulation in the FZJ- The main purpose of the CMR is to discriminate the signal
LIF instrument has specific disadvantages compared to the of ambient OH radicals from signals of known and unknown
operation of the LIF OH detection without the CMR. It re- interferences. Two types of known interferences (from ozone
quires a longer measurement time because half of the time photolysis and NO3 radicals) were re-investigated in this
is spent for the measurement of interferences in the scav- work by making use of the chemical modulation technique.
enger mode. In the current work, measurement of ambient These tests were done in synthetic air to avoid potential in-
OH (N2 mode, 135 s) contains three on- and off-resonance terferences from other sources.
https://doi.org/10.5194/amt-14-1851-2021 Atmos. Meas. Tech., 14, 1851–1877, 20211862 C. Cho et al.: Characterization of the FZJ-LIF-CMR for the measurement of OH radicals
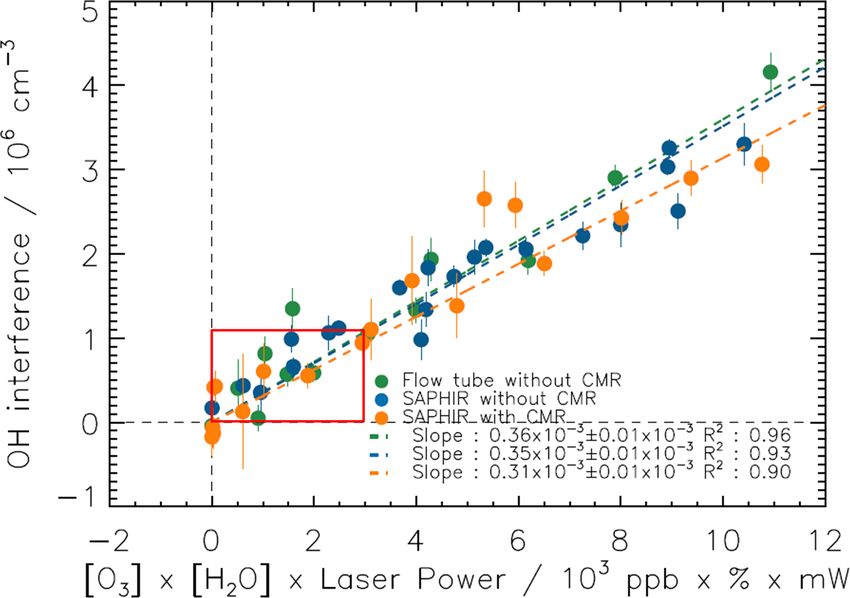
3.5.1 Interference from ozone photolysis
It is well-known that internal OH can be produced in the
308 nm laser beam of LIF systems by photolysis of O3 in
humid air according to Reactions (R1) and (R2) (Holland et
al., 2003).
The interference is proportional to the concentrations of
ozone and water vapour and laser power.
OHInterference,O3 +H2 O ∝ [O3 ] × [H2 O] × Laser Power (19)
In the past, OHWAVE measurements by the FZJ-LIF instru-
ment were routinely corrected for this interference based
on laboratory characterization. Similar tests were repeated
here without and with the CMR for a range of conditions
(Fig. 5). Mixing ratios of ozone and water vapour were var-
ied up to 450 ppbv and 1.8 %, respectively. Laser power Figure 5. OH interference, expressed as equivalent ambient OH
was modulated between 10 and 20 mW. A laboratory test concentration, from the laser photolysis of ozone in humidified syn-
was performed with the calibration source as a gas sup- thetic air for a range of concentrations of ozone, water vapour and
laser power. Tests were done with and without the CMR with a flow
ply with a total flow of 11 slpm and the photolysis lamp
tube or in chamber experiments. Measurements were fitted to a lin-
switched off. Ozone was added by a home-built ozone gen- ear function forced through the origin. The red box specifies the
erator and measured in the excess air with UV photome- interference for concentrations of ozone and water vapour normally
try (Ansyco). Relative humidity was monitored by a hu- observed in the lower troposphere.
midity sensor (HMT333, Vaisala). In two additional exper-
iments in the SAPHIR chamber, water vapour and ozone
were added in synthetic air in dark conditions (chamber roof interference with increasing NO3 concentration, which is
closed), and their concentrations were measured by the in- measured by a cavity ring-down instrument similar to the
struments listed in Table 2. The OH interferences observed in instrument described in Fuchs et al. (2009) and Wagner et
the laboratory and SAPHIR experiments scale linearly with al. (2011). A linear regression analysis yields a value that
the product of ozone and water vapour mixing ratios as ex- is equivalent to an OH concentration of 5.8 × 104 cm−3 per
pected (Eq. 19 and Fig. 5). All three experiments with and 10 pptv NO3 , which is negligible for typical ambient concen-
without the CMR agree with each other within 15 %. On av- trations of NO3 . The value is roughly 2 times smaller than
erage, the interference is equivalent to an OH concentration the result of Fuchs et al. (2016). The reason for the discrep-
of (3.4 ± 0.3) × 105 cm−3 per 50 ppbv of O3 and 1 % water ancy between the two tests is unclear. One reason could be an
mixing ratio, which is at the limit of detection for the LIF additional NO3 heterogeneous loss to the wall of the CMR,
instrument without the CMR, and a factor of 2 below the like HO2 and OH loss, when the CMR is applied. As the ori-
limit of detection with the CMR. The value of the interfer- gin of the NO3 radical interference in our LIF instrument is
ence agrees well with earlier determinations for the FZJ-LIF unknown; it cannot be ruled out that other experimental con-
instrument with reported values of (2.7 ± 0.8) × 105 cm−3 ditions affected the interfering signal. In any case, the small
(Holland et al., 1998) and (3.2 ± 0.8) × 105 cm−3 (Holland interference from NO3 is negligible for OH measurements
et al., 2003) for the same conditions. for the FZJ-LIF instrument, regardless of whether chemical
modulation is used or not. A similar conclusion was drawn
3.5.2 Interference from NO3 from experiments by Woodward-Massey et al. (2020) for the
LIF instrument used by the University of Leeds (UK).
Fuchs et al. (2016) have reported an OH interference from
NO3 radicals by an unknown mechanism producing OH in
the FZJ-LIF instrument. The observed interference was in- 4 Chemical modulation measurements in ambient air
dependent of water vapour in the gas phase and independent
of laser power. The reported interference signal in the pres- This section describes the application of chemical modula-
ence of 10 pptv NO3 was equivalent to an atmospheric OH tion in a real atmosphere with numerous atmospheric pol-
concentration of 1.1 × 105 cm−3 . In the present work, the lutants. Section 4.1 analyses the potential influence of atmo-
interference from NO3 was re-determined applying chem- spheric chemical conditions on the performance of the chem-
ical modulation. The experiments were performed in the ical modulation system, and Sect. 4.2 shows test results from
SAPHIR chamber using thermal decomposition of N2 O5 the JULIAC field campaign.
added from a condensed source which produces NO3 radi-
cals. Figure 6 shows a linear increase of the measured OH
Atmos. Meas. Tech., 14, 1851–1877, 2021 https://doi.org/10.5194/amt-14-1851-2021You can also read


