Identifying persistent temperature inversion events in a subalpine basin using radon-222
←
→
Page content transcription
If your browser does not render page correctly, please read the page content below
Atmos. Meas. Tech., 12, 4455–4477, 2019
https://doi.org/10.5194/amt-12-4455-2019
© Author(s) 2019. This work is distributed under
the Creative Commons Attribution 4.0 License.

Identifying persistent temperature inversion events in a subalpine
basin using radon-222
Dafina Kikaj1,2 , Janja Vaupotič2 , and Scott D. Chambers3
1 Jožef
      Stefan International Postgraduate School, Jamova cesta 39, 1000 Ljubljana, Slovenia
2 Jožef
      Stefan Institute, Department of Environmental Sciences, Jamova cesta 39, 1000 Ljubljana, Slovenia
3 ANSTO, Environmental Research, Locked Bag 2001, Kirrawee DC, NSW 2232, Australia

Correspondence: Dafina Kikaj (dafina.kikaj@ijs.si)

Received: 16 November 2018 – Discussion started: 22 February 2019
Revised: 15 May 2019 – Accepted: 17 July 2019 – Published: 21 August 2019

Abstract. One year of meteorological and atmospheric radon        according to World Health Organization guidelines. The effi-
observations in a topographically complex subalpine basin         cacy, simplicity, and cost effectiveness of the RBM for iden-
are used to identify persistent temperature inversion (PTI)       tifying PTI events has the potential to make it a powerful
events. PTI events play a key role in public health due to        tool for urban air quality management in complex terrain
the accumulation of urban pollutants that they cause. Two         regions, for which it adds an additional dimension to con-
techniques are compared: a new radon-based method (RBM),          temporary atmospheric stability classification tools. Further-
based on single-height 222 Rn measurements from a single          more, the long-term consistency of the radon source function
centrally located station, and an existing pseudo-vertical tem-   will enable the RBM to be used in the same way in future
perature gradient method (TGM) based on observations from         studies, enabling the relative magnitude of PTI events to be
eight weather stations around the subalpine basin. The RBM        gauged, which is expected to assist with the assessment of
identified six PTI events (four in winter, two in autumn), a      public health risks.
subset of the 17 events identified by the TGM. The RBM
was more consistent in its identification of PTI events for all
seasons and more selective of persistent strongly stable con-
ditions. The comparatively poor performance of the TGM            1   Introduction
was attributed to seasonal inconsistencies in the validity of
the method’s key assumptions (influenced by mesoscale pro-        Urban air pollution is one of the main environmental health
cesses, such as local drainage flows, nocturnal jets, and in-     risks in Europe (EEA, 2017; WHO, 2014). It derives from
termittent turbulence influence) and a lack of snow cover in      aerosols and/or trace gases of natural (e.g., sandstorms, vol-
the basin for the 2016–2017 winter period. Corresponding          canos, forest fires, and ocean spray) or anthropogenic ori-
meteorological quantities for RBM PTI events (constituting        gin (e.g., biomass burning, power generation, transport, and
27 % of the autumn–winter cold season) were well character-       industry) (Beeston et al., 2011; Ferrario et al., 2008; Lang-
ized. PTI wind speeds in the basin were consistently low over     mann et al., 2012; Miranda et al., 2015; Pey et al., 2013;
the whole diurnal cycle (typically 0.2–0.6 m s−1 ). Suitability   Vardoulakis and Kassomenos, 2008). Public health effects
of the two techniques for air quality assessment was com-         can be acute or chronic in nature, and include respiratory
pared using hourly PM10 observations. Peak PM10 concen-           illnesses, cardiovascular disorders, conjunctivitis, skin irrita-
trations for winter (autumn) PTI events were underestimated       tions, meningococcal meningitis, valley fever, and even mor-
by 13 µg m−3 (11 µg m−3 ) by the TGM compared with the            tality (Goudie, 2014; Griffin, 2005; Highwood and Kinner-
RBM. Only the RBM indicated that nocturnal hourly mean            sley, 2006; Pope and Dockery, 2006). With public health in
PM10 values in winter PTI events can exceed 100 µg m−3 ,          mind, the World Health Organization (WHO) identified nu-
the upper threshold of low-level short-term PM10 exposure         merous “criteria pollutants” in urban regions for which they
                                                                  have recommended guidelines on concentrations and/or du-

Published by Copernicus Publications on behalf of the European Geosciences Union.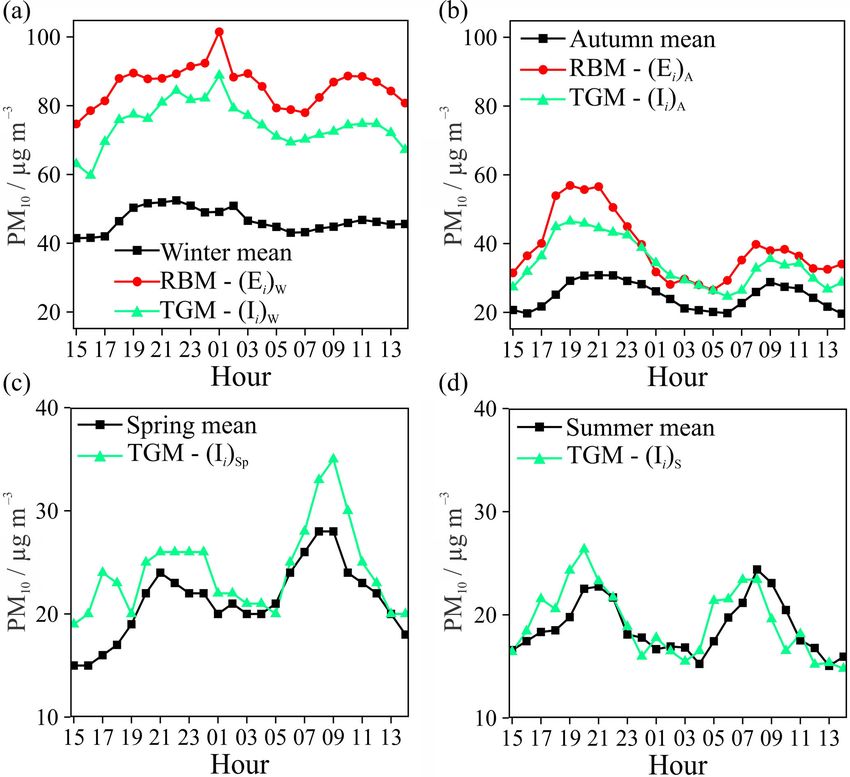
4456                                   D. Kikaj et al.: Identifying persistent temperature inversion events using radon-222

ration (the Air Quality Directive; EEA, 2017). An air pollu-          The first European field campaign to target PTI events
tion event is considered to have occurred when the concen-         took place in the Chamonix-Mont-Blanc valley, in January–
tration of one or more of the criteria pollutants exceeds the      February 2015. This study was motivated by the anomalously
guideline value for longer than the specified duration thresh-     high pollution concentrations frequently recorded there. The
old. Such pollution events can be of short duration (1–12 h,       comprehensive suite of meteorological and chemical obser-
day or night) or, under certain conditions, they can persist for   vations made throughout the campaign has been described by
days to weeks.                                                     Chemel et al. (2016). A meteorological approach, based on
   Urban air quality can be influenced by remote, regional,        differences between air temperatures from automatic weather
or local processes, depending on the prevailing meteorology        stations at various elevations of the sidewalls of the val-
(Kukkonen et al., 2005). The particular focus of this study is     ley, was used to characterize the stable nocturnal conditions
on pollution events arising as a result of local anthropogenic     (Dorninger et al., 2011; Whiteman et al., 2004) based on the
emissions, the effects of which are exacerbated under spe-         assumption of horizontally homogenous air temperature. The
cific synoptic weather conditions: cold-season anticyclones.       same pseudo-vertical temperature gradient method was em-
Anticyclonic weather conditions are associated with rela-          ployed by Largeron and Staquet (2016a) in the French Alps
tively calm winds and clear skies, due to regional-scale subsi-    to detect PTI events throughout the cold season (Novem-
dence. In summer, anticyclonic conditions can result in day-       ber 2006 to February 2007). There are, however, a variety of
time pollution events as a result of rapid secondary-pollutant     mesoscale processes that have the potential to disrupt the ver-
formation, or nighttime pollution events, when strong ra-          tical temperature profile and its horizontal homogeneity (in-
diative cooling results in the formation of shallow, poorly        cluding local drainage flows, nocturnal jets, and intermittent
mixed inversion layers. Such pollution events usually end          turbulence) (Whiteman et al., 2004; Williams et al., 2013).
abruptly each morning shortly after the onset of convective        Such influences can complicate the interpretation of pseudo-
mixing as a result of intense sunlight on dry surfaces. In such    vertical temperature gradients derived from stations of con-
cases, near-surface concentrations of primary emissions drop       trasting elevations on valley or basin walls, depending on
∼ 50 % from peak values by midmorning and reach their              their particular spatial locations.
minimum values in the early afternoon when the atmospheric            By contrast, measurement of a surface-emitted atmo-
boundary layer (ABL) is deep and uniformly mixed (Cham-            spheric tracer with appropriate physical properties (e.g., sim-
bers et al., 2015). In winter, however, day lengths are shorter,   ple source and sink characteristics), which responds directly
sun angles lower, and surfaces wet or frozen. In topographi-       to atmospheric mixing processes, has the potential to pro-
cally complex regions, when wind speeds and day length can         vide a more consistent and representative method by which
be even further reduced, and katabatic flows down the basin        to identify PTI events. Such a method should be uniformly
walls result in the “pooling” of cold air, large-scale subsi-      applicable, allowing seasonal changes in the number and du-
dence associated with slow-moving or stagnant anticyclonic         ration of such events to be determined. Furthermore, once a
systems can inhibit the daytime mixing that usually disperses      representative number of events have been identified, season-
accumulated nocturnal pollution, resulting in air pollution        ally dependent threshold concentrations of the tracer could
events that can persist for days to weeks (Baasandorj et al.,      be determined to help gauge the severity of the inversion
2017; Cuxart et al., 2006; Kassomenos and Koletsis, 2005).         events and characterize the meteorological conditions with
Here we refer to such extended periods of severe air pollution     which they are associated. The naturally occurring radioac-
as persistent temperature inversion (PTI) events.                  tive gas radon (222 Rn) is an ideal candidate for this task. The
   In light of the above, the ability to reliably identify PTI     use of radon as a tracer in atmospheric studies dates back
events and objectively quantify their magnitude is impor-          from the early 1900s (Eve, 1908; Satterly, 1910; Wigand and
tant for improved understanding of pollutant concentration         Wenk, 1928; Wright and Smith, 1915). In particular, how-
variability, assessing potential health impacts on residents,      ever, radon has achieved considerable credibility in the field
and developing new mitigation measures for air pollution           of atmospheric science as an indicator of vertical mixing
in such complex topographical regions. Unfortunately, there        and transport near the Earth’s surface from the 1960s until
have been relatively few observational studies of PTI events       present (Moses et al., 1960; Kirichenko, 1962; Cohen et al.,
(Clements et al., 2003; Dorninger et al., 2011; Lareau et          1972; Allegrini et al., 1994; Perrino et al., 2001; Sesana et al.,
al., 2013; Lehner et al., 2015; Silcox et al., 2012). To date,     2003; Galmarini, 2006; Avino and Manigrasso, 2008; Cham-
this lack of observational studies has mainly been due to the      bers et al., 2011, 2015, 2019; Williams et al., 2011, 2013,
difficulty in making the necessary meteorological measure-         2016; Pitari et al., 2014; Wang et al., 2016).
ments within the topographically challenging regions (Yao             Radon concentrations exhibit a high degree of variabil-
and Zhong, 2009). Furthermore, such studies often require          ity on hourly to seasonal timescales. The majority of this
the deployment of sophisticated instrumentation (e.g., ra-         variability is attributable to processes occurring at diurnal,
diosondes, tethered balloons, masts, or aircraft), which is typ-   synoptic, and seasonal timescales. Other influences, such as
ically expensive and labor intensive to operate (Baasandorj et     those arising from mesoscale motions, or the effects of ge-
al., 2017).                                                        ographical variability in soil characteristics, rainfall, wind

Atmos. Meas. Tech., 12, 4455–4477, 2019                                               www.atmos-meas-tech.net/12/4455/2019/
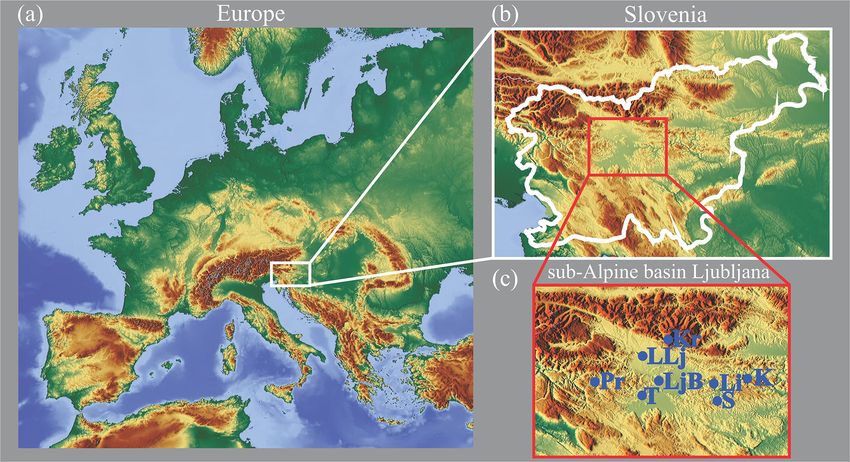
D. Kikaj et al.: Identifying persistent temperature inversion events using radon-222                                          4457

speed, and atmospheric pressure on the radon source func-          pseudo-vertical temperature gradient method for identifying
tion (Chambers et al., 2011; Etiope and Martinelli, 2002;          PTI events over the whole year; (iii) investigate the season-
Karstens et al., 2015; Levin et al., 2002; Mazur and Kozak,        ality of PTI event occurrence in the subalpine basin; and
2014; Salzano et al., 2016, 2018; Szegvary et al., 2007, 2009;     (iv) characterize the local meteorological conditions (air tem-
Zhuo et al., 2008), are of secondary significance and random       perature, relative humidity, cloud cover, wind speed, wind di-
in nature, so they typically average out in long-term (sea-        rection, and precipitation) associated with PTI events, as well
sonal) statistics. The PTI identification technique developed      as discuss the implications of these conditions for urban air
in this study necessitates the ability to characterize and sepa-   quality using hourly urban PM10 observations as an example.
rate the different temporal scales contributing to the variabil-
ity observed in a radon time series.
   Seasonal variability of radon concentrations is contributed     2     Methodology
to by long-term changes in (i) air mass fetch, (ii) radon source
function (through average soil moisture, snow cover, or soil       2.1    Radon as a tracer of atmospheric transport and
freezing) (Salzano et al., 2016, 2018; Szegvary et al., 2007,             mixing
2009; Zhuo et al., 2008), (iii) day length, and (iv) mean at-
mospheric boundary layer depth (higher in summer, lower            222 Rn  (hereafter radon) is the gaseous decay product of
in winter), brought about by the annual solar cycle. Synop-        226 Ra  (radium), a member of the 238 U (uranium) chain,
tic variability (timescale ≤ 2 weeks) is mainly attributable to    which is ubiquitous all over the Earth’s crust. Radon is
short-term changes in air mass fetch, boundary layer depth,        fairly uniformly distributed on local to regional scales
and ventilation of the boundary layer, brought about by the        (1 atom cm−2 s−1 ± 25 %; Jacob et al., 1997; Karstens et al.,
passage of synoptic weather systems. In this case, variability     2015), and has a source function that is 2–3 orders of mag-
of the radon source function over the air masses’ recent fetch     nitude greater from unsaturated land surfaces than from the
can have a greater influence on observed concentrations than       open ocean (Schery and Huang, 2004). Once emitted to the
the local radon source function at the measurement site. Diur-     atmosphere radon is directly influenced by the meteorologi-
nal variability, on the other hand, is primarily attributable to   cal processes that regulate turbulent mixing, namely, vertical
changes in the atmospheric mixing state (i.e., mixing depth or     and horizontal components of dispersion. Being an inert gas,
“stability”), and the strength of the local radon source func-     radon does not chemically react with other atmospheric con-
tion.                                                              stituents and its low solubility makes it unlikely to be washed
   The diurnal radon cycle is characterized by a midafter-         out by rainfall. Consequently, it is eliminated from the atmo-
noon minimum (the magnitude of which is related to the air         sphere predominantly by radioactive decay (half-life 3.82 d).
masses’ fetch history) and a nocturnal maximum near dawn           While radon’s short half-life prevents it from accumulating in
(when the atmospheric mixing depth is shallowest). The am-         the atmosphere greater than synoptic timescales, it is possi-
plitude of the diurnal radon cycle is directly related to the      ble to track air masses that have been in contact with terres-
degree to which near-surface turbulent mixing is suppressed        trial surfaces over the ocean, or within the troposphere, for
each night. Synoptic cycles of the afternoon minimum radon         2–3 weeks, enabling it to carry important geophysical infor-
concentrations can be analogous to the diurnal radon cycle,        mation over long distances. Since radon’s half-life is much
but on longer timescales. These cycles are characterized by        greater than mixing timescales of the atmospheric boundary
minimum values when gradient winds are strong (or terres-          layer, and since radon is still relatively conservative (within
trial fetch is limited), and maximum values when gradient          5 %–10 %) over the course of a whole night, radon is an ap-
winds are low and there is subsidence (or during extended          propriate atmospheric tracer for near-surface mixing studies
periods of terrestrial fetch, including stagnation episodes). In   from hourly to nightly timescales. Furthermore, based on the
the warmer months, when days are convective and nights are         relatively small fraction of terrestrial surfaces occupied by
stable, diurnal cycle amplitudes exceed synoptic cycle am-         urbanization, at the regional scale radon’s terrestrial source
plitudes. In the colder months, however, the amplitude of the      function is not significantly affected by human activity.
synoptic cycle can be comparable to, or even greater than,
that of the diurnal cycle. This seasonal change in relative        2.2    Measurement sites and surroundings
amplitudes of the diurnal and synoptic radon cycles forms
the basis of our method to identify PTI events.                    The Ljubljana subalpine basin site (SAB; 46.05◦ N, 14.51◦ E;
   The aims of this study are to use the first year of contin-     299 m above sea level, m a.s.l.) is in the capital city of Slove-
uous joint atmospheric radon and meteorological measure-           nia, which has a population of around 280 000. The city’s
ments in a subalpine basin (Ljubljana, Slovenia) to (i) de-        climate, classified as temperate and continental, is typical of
velop a seasonally independent radon-based method to reli-         southern European subalpine regions. Air temperatures ex-
ably identify persistent temperature inversion events in com-      hibit a distinct seasonal cycle, with daily means reaching a
plex topographic regions; (ii) compare the performance of          maximum of 22 ◦ C in summer and a minimum of 0 ◦ C in
the radon-based scheme to that of a previously published           winter. Prevailing winds for the region are NE, NNE, and

www.atmos-meas-tech.net/12/4455/2019/                                                Atmos. Meas. Tech., 12, 4455–4477, 2019
4458                                  D. Kikaj et al.: Identifying persistent temperature inversion events using radon-222

ENE, and the rainfall distribution is irregular, peaking in          The LjB weather station, operated by the National Meteo-
summer (ARSO, 2017).                                              rological Service at the Environmental Agency of the Repub-
   The SAB is surrounded by peaks of the Julian and               lic of Slovenia (ARSO), also has a comprehensive suite of
Kamnik–Savinje alps (Vrhovec, 1990). To the north the re-         meteorological sensors. The following parameters, recorded
gion is bounded by the Julian and Kamnik–Savinje alps             at 2 m a.g.l. and aggregated to hourly temporal resolution,
(highest peaks: Grintovec 2558 m and Krvavec 1742 m), to          were used in this study: air temperature (◦ C), relative humid-
the west the Šmarna Gora and Rašica hills connect to the Pol-     ity (%), wind speed (m s−1 ), wind direction (◦ ), and precipi-
hov Gradec hills (highest peak: Pasja Ravan, 1019 m), and         tation (mm h−1 ) as well as the standard air quality parameter
to the east there are the Posavje hills (highest peak: Kum,       PM10 (µg m−3 ) (ARSO, 2017). To supplement these obser-
1211 m). Immediately to the south is Ljubljansko Marshes          vations, total cloud cover (%) was obtained from the Global
(Šajn et al., 2011), a drained ancient moor that was frequently   Data Assimilation System (GDAS) model of NOAA ARL
a lake during the ice ages (Fig. 1b) (Pak, 1992).                 (National Oceanic and Atmospheric Administration Air Re-
   The air quality of Ljubljana is affected by a combina-         sources Laboratory).
tion of local and remote influences, the relative contributions      In addition to the LjB air temperature measurements near
of which are dictated by prevailing meteorology. The geo-         the bottom of the Ljubljana basin (299 m a.s.l.), ARSO air
graphic location of Slovenia (Fig. 1a) is such that remote        temperature observations were also retrieved from a number
influences on air quality, when they occur, are mainly a re-      of weather stations on the sidewalls of the basin at a range of
sult of pollution transport from northern Africa (Kallos et       elevations from 268 to 1742 m. A full list of station names,
al., 2006), from the North Atlantic Ocean, and across Italy       abbreviations, and elevations is provided in Table 1, and their
from the Mediterranean Sea (He et al., 2018), the northern        locations relative to LjB are shown in Fig. 1c. To facilitate
Balkan Peninsula, or eastern Europe (Poberžnik and Štrum-         subsequent analyses, each station was assigned an elevation
belj, 2016).                                                      category (low, medium, or high) according to its elevation
   Drag associated with the complex topography of the sur-        relative to the bottom of the basin (Table 1).
rounding region retards synoptic-scale winds, resulting in           The statistical analyses for this study were performed us-
a mean near-surface annual wind speed of only 1.3 m s−1 .         ing the ggplot2 (Wickham, 2009) and imputeTS (Moritz,
Extended periods of anticyclonic conditions (low-gradient         2017) packages under R 3.3.1 (R Development Core Team,
winds and subsidence) are also common for the region.             2008). All reported times are local (local time is UTC+1)
Combined with the unique concave shape of the subalpine           and the Northern Hemisphere seasonal convention has
Ljubljana basin (Rakovec et al., 2002), this results in com-      been adopted (i.e., winter: December–February; spring:
paratively calm conditions in the colder months, with fre-        March–May; summer: June–August; autumn: September–
quent foggy days and persistent temperature inversions            November).
(120 d y−1 ), favoring the buildup of locally sourced emis-
sions.                                                            2.4     Identifying persistent temperature inversion events

                                                                  2.4.1    The radon-based method (RBM)
2.3    Measurement methods
                                                                  Our method for identifying PTI events is based on continu-
Atmospheric radon measurements were made for 1 year               ous, near-surface, single-height observations of atmospheric
(14 December 2016 to 30 November 2017) at the Ljubljana           radon concentrations. The principle of the method is outlined
Bežigrad (LjB) automatic weather station in the central part      in the following two steps: (i) minimize or separate contribu-
of the city (46◦ 070 N, 14◦ 520 E; Fig. 1c), and are ongoing.     tions to the observed radon variability occurring at the four
The measurements were conducted using an AlphaGUARD               main timescales (sub-diurnal, diurnal, synoptic, and greater-
PQ2000 PRO (Bertin Instruments) ionization chamber oper-          than synoptic), and then (ii) compare the relative magni-
ating in diffusion mode with a 1 h integration time. The in-      tudes of variability contributed by the diurnal and synoptic
strument was mounted 1.5 m above ground level (m a.g.l.),         timescales. Since the separation and comparison of different
within a Stevenson Screen instrument shelter. Setup in this       timescale contributions to radon concentration variability is
way more than 95 % of the observed radon concentrations           performed separately for each season and year, changes in
represent the isotope 222 Rn (Kochowska et al., 2009). Con-       mean rates of radon emission between seasons or years do
sequently, to a good approximation contributions from the         not adversely affect the efficacy of the technique.
isotopes 220 Rn (thoron) and 219 Rn (actinon) can be ignored.        Although the performance of the method is seasonally in-
The AlphaGUARD has a lower limit of detection (LLD) of            dependent, the greatest number of PTI events in the SAB oc-
around 2 Bq m−3 . Over the year only 1 % of observed radon        curs in winter, so here we focus only on winter observations
concentrations were at or below this limit, which justifies the   for the purpose of demonstrating the method. The processes
continued use of the AlphaGUARD at this site as a tool for        involved in minimizing or separating contributing timescales
air quality assessment.                                           to the observed radon time series in order to isolate the syn-

Atmos. Meas. Tech., 12, 4455–4477, 2019                                              www.atmos-meas-tech.net/12/4455/2019/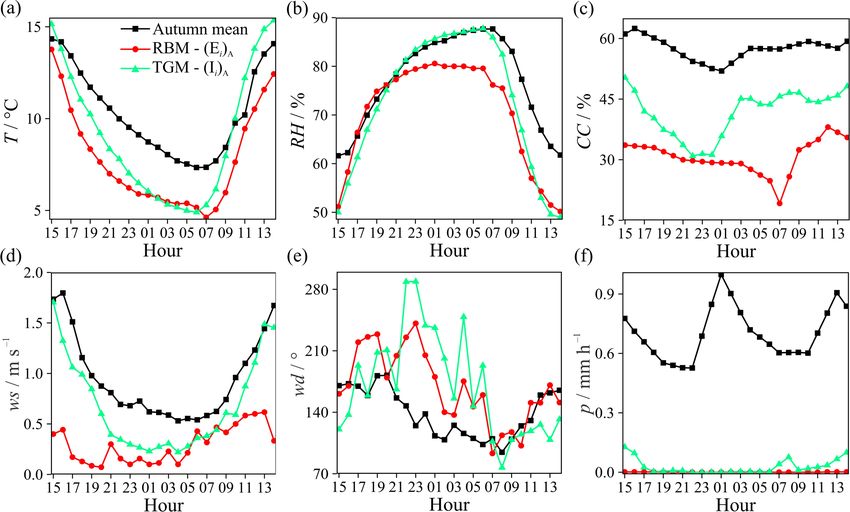
D. Kikaj et al.: Identifying persistent temperature inversion events using radon-222                                                4459

Figure 1. (a) Location of Slovenia within Europe, (b) topographic map of Slovenia with the location of Ljubljana indicated, and (c) to-
pographic map of the Ljubljana basin, with the locations of automatic weather stations indicated. Basemap source: © https://www.
openstreetmap.org/copyright, last access: 11 August 2019.

Table 1. Ground-based automatic weather station name, abbreviation, position, elevation, and elevation category.

        Station name                           Acronym    Latitude (◦ N)    Longitude (◦ E)   Elevation (m)    Elevation category
        Litija                                 Li         46◦ 060           14◦ 810           268 m            low
        Ljubljana-Bežigrad                     LjB        46◦ 070           14◦ 520           299 m            low
        Letališče Jožeta Pučnika Ljubljana   LLj        46◦ 210           14◦ 470           364 m            low
        Sevno                                  S          45◦ 980           14◦ 920           556 m            medium
        Topol                                  T          46◦ 090           14◦ 370           695 m            medium
        Pasja Ravan                            PR         46◦ 090           14◦ 220           1019 m           high
        Kum                                    K          46◦ 080           15◦ 070           1211 m           high
        Krvavec                                Kr         46◦ 290           14◦ 530           1742 m           high

optic timescale contributions for further analysis (i.e., Step               at LjB are shown in Fig. 2a. As detailed in Sect. 1,
1) are outlined below.                                                       these cycles are characterized by peak concentrations
                                                                             near sunrise, when near-surface mixing is usually sup-
  1. Minimizing instrument uncertainty and sub-diurnal                       pressed, and minimum values in the midafternoon,
     radon variability. Since afternoon radon concentra-                     when the ABL is deep (typically ≥ 1 km) and uniformly
     tions can be close to the instruments’ detection limit                  mixed. Depending on season (specifically, the duration
     (even in winter), measurement uncertainty cannot be                     and intensity of solar radiation), the timing and duration
     neglected. Furthermore, as outlined in Sect. 1 numer-                   of the diurnal maximum and minimum concentration
     ous factors contribute to natural variability in observed               periods may change by several hours (Fig. 2a). For a
     radon concentrations at sub-diurnal timescales. To min-                 given season, afternoon minimum radon concentrations
     imize the impact of the above contributions on our es-                  are primarily influenced by the combined radon emis-
     timation of diurnal minimum radon concentrations, we                    sions along the air masses’ recent (two to three radon
     started by performing a 3 h running mean smoothing on                   half-lives) fetch, which changes with the passage of syn-
     the observed radon concentrations (Fig. 3a, black line,                 optic weather systems. Diurnal variability (driven by
     CRn-observed ).                                                         changes in mixing depth and the local radon flux) is su-
                                                                             perimposed on top of this fetch-driven radon variability.
  2. Characterization of the synoptic variability (“fetch ef-                As an economical alternative to vertical radon gradient
     fect”). Mean summer and winter diurnal radon cycles

www.atmos-meas-tech.net/12/4455/2019/                                                     Atmos. Meas. Tech., 12, 4455–4477, 2019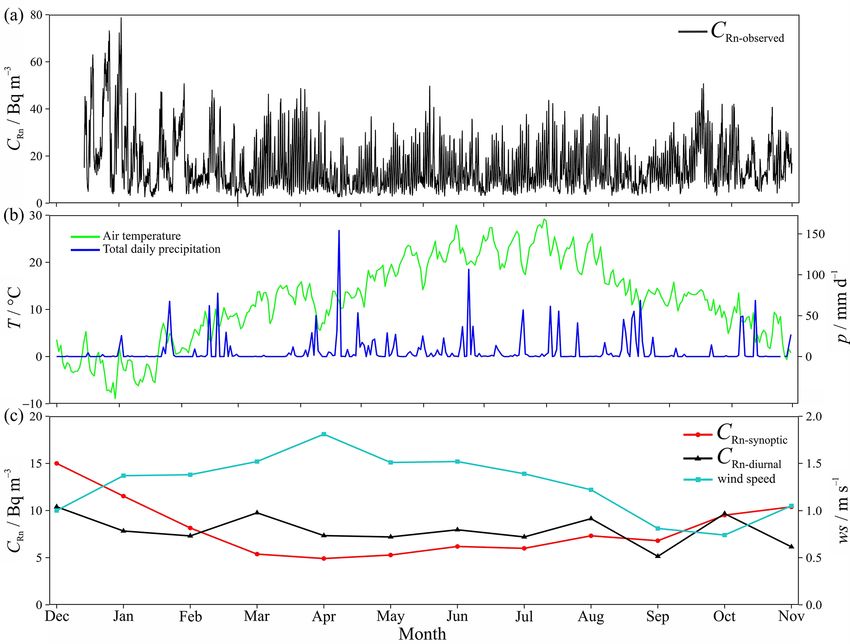
4460 D. Kikaj et al.: Identifying persistent temperature inversion events using radon-222
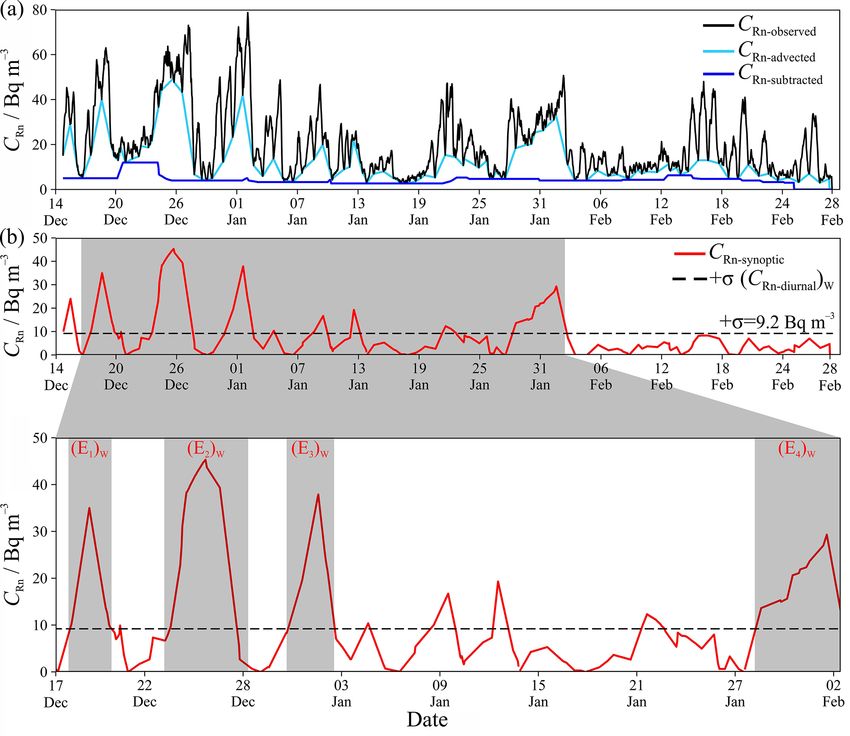
measurements (which require multiple research-grade radon signal (CRn-synoptic ) and the standard deviation of the
detectors), the fetch-related influence (synoptic contri- winter diurnal radon signal (+σ (CRn-diurnal ) W). Numerous
bution) to radon concentrations observed at a single cases were evident when accumulation of radon due to syn-
height can be approximated by linearly interpolating be- optic processes (CRn-synoptic ) exceeded +σ (CRn-diurnal ) W.
tween successive afternoon minimum values (Chambers At such times, synoptic controls on the near-surface radon
et al., 2015; Podstawczyńska and Chambers, 2018). For observations are more significant than diurnal controls. The
the purpose of this investigation we derived the daily final step is to set a duration threshold on these exceedances
minimum radon concentrations over the year of obser- for an event to be classified as a PTI.
vations by identifying the minimum smoothed concen- We consider a persistent temperature inversion event to
tration each afternoon between 14:00 and 19:00 LT. An have occurred when the synoptic contribution to the radon
example of this linearly interpolated approximation of signal exceeds the standard deviation of the diurnal contribu-
the air mass fetch contribution to the LjB radon concen- tion for that season for a period of at least 48 h:
trations is shown in Fig. 3a (light blue line, CRn-advected ).
It should be noted that the assumptions upon which this (CRn-synoptic ) > +σ (CRn-diurnal )season for ≥ 48 h. (1)
fetch-effect approximation is based are invalid under
severe weather conditions (e.g., during the passage of Although only a winter example is presented in Figure 3b,
strong frontal systems, or rapid changes from terrestrial the same approach was used for all seasons.
to oceanic fetch).
2.4.2 The pseudo-vertical temperature gradient
3. Isolation of synoptic contribution from longer timescale
method (TGM)
radon contributions. Variability on greater than syn-
optic timescales was evident in the radon time series,
If distributed ground-based air temperature measurements
which needed to be minimized prior to attempting to
are available over a wide range of representative elevations
identify PTI events. The first step was to characterize
within a basin or valley, it is possible to identify PTI events
typical synoptic timescale variability at LjB. We did
by analyzing pseudo-vertical temperature gradients between
this by performing a spectral analysis of the hourly
stations with significantly different elevations. This method,
LjB atmospheric pressure observations for each sea-
described by Largeron and Staquet (2016a), relies upon two
son (Fig. 2b; winter and summer examples). Through-
key assumptions: (1) horizontal homogeneity of air temper-
out winter and autumn our analysis indicated a syn-
ature between stations of similar elevations and (2) the ex-
optic timescale of 5 to 8 d, whereas in spring and
istence of significant vertical changes in air temperature be-
summer the synoptic timescale was typically 6 to 7 d.
tween stations at different elevations. The validity of these
We then calculated a running-minimum radon con-
assumptions can be assessed by calculating correlations be-
centration using a window derived from the spectral
tween stations within designated elevation groups, and be-
analysis of atmospheric pressure (7 d window for all
tween stations across designated elevation groups. If the
seasons). Lastly, this running-minimum concentration
assumptions hold, temperature gradients between stations
(Fig. 3a; blue line, CRn-subtracted ) was subtracted from
within the designated elevation groups can be calculated, and
the CRn-advected (fetch effect) derived in (2) above, in or-
a threshold value determined to identify PTI events.
der to isolate the synoptic timescale contributions to the
As detailed in Table 1, in the case of the Ljubljana
radon observations (Fig. 3b; red line, CRn-synoptic ). The
basin, air temperature observations were available from eight
µ±σ of the subtracted radon contribution was 4.2±2.1,
automatic weather stations representative of three differ-
3.1 ± 0.5, 3.8 ± 0.7, and 4.8 ± 1.3 Bq m−3 , for winter,
ent elevation categories (low ∼ 310 m, medium ∼ 630 m, and
spring, summer, and autumn, respectively.
high ∼ 1320 m) for detecting PTI events. Firstly, all hourly
Having isolated the synoptic-scale contribution to the ob- temperature observations from the eight stations over the De-
served radon time series, the next steps to develop the PTI cember 2016 to November 2017 period were separated by
identification tool were to (i) identify periods when synoptic season. Next, seasonal correlation coefficients between each
variability dominates diurnal variability, and (ii) decide on a of the eight stations were calculated separately (Table 2). Air
minimum length of time that this needs to occur for the event temperatures from the three low-elevation stations (Li, LjB,
to be considered a PTI. and LLj) were strongly correlated for all seasons, despite a
The diurnal (mixing-related) contribution to the LjB radon spatial separation of up to ∼ 60 km (Fig. 1c). Likewise, air
time series was obtained by subtracting the advected signal temperatures of the two medium-elevation stations (S and T)
from the measured radon concentrations (see Fig. 3a). For were strongly correlated for all seasons. In the case of the
the purpose of this study we chose the seasonal standard de- high-elevation stations (PR, K, and Kr), however, only mod-
viation (+σ ) of the diurnal radon contribution as a measure erate correlation coefficients were obtained (Table 2), indi-
of the significance of diurnal variability each season. For our cating a degree of non-homogeneity of the horizontal air tem-
winter example, in Fig. 3b we plotted the isolated synoptic perature field near the top of the basin.
Atmos. Meas. Tech., 12, 4455–4477, 2019 www.atmos-meas-tech.net/12/4455/2019/
D. Kikaj et al.: Identifying persistent temperature inversion events using radon-222                                              4461

Figure 2. (a) Summer and winter diurnal composite hourly radon concentration and (b) spectral analysis of the LjB hourly atmospheric
pressure data for summer and winter.

Table 2. Air temperature correlation coefficients between each of the eight ground-based automatic weather stations in spring, summer,
autumn, and winter.

                               Winter                                                          Spring
           Li   LjB     LLj    S        T      PR     K      Kr            Li   LjB     LLj    S        T      PR     K      Kr
    Li     1    0.96    0.94   0.81     0.74   0.59   0.47   0.27   Li     1    0.97    0.97   0.89     0.87   0.87   0.83   0.74
    LjB         1       0.95   0.84     0.78   0.59   0.47   0.26   LjB         1       0.96   0.91     0.91   0.80   0.86   0.80
    LLj                 1      0.80     0.75   0.59   0.46   0.24   LLj                 1      0.88     0.87   0.88   0.83   0.80
    S                          1        0.96   0.80   0.69   0.46   S                          1        0.97   0.96   0.96   0.90
    T                                   1      0.85   0.74   0.52   T                                   1      0.98   0.96   0.92
    PR                                         1      0.84   0.75   PR                                         1      0.76   0.71
    K                                                 1      0.75   K                                                 1      0.94
    Kr                                                       1      Kr                                                       1
                               Summer                                                          Autumn
           Li   LjB     LLj    S        T      PR     K      Kr            Li   LjB     LLj    S        T      PR     K      Kr
    Li     1    0.95    0.97   0.87     0.85   0.85   0.81   0.66   Li     1    0.97    0.95   0.88     0.85   0.82   0.80   0.70
    LjB         1       0.96   0.91     0.91   0.98   0.83   0.72   LjB         1       0.94   0.90     0.88   0.84   0.81   0.72
    LLj                 1      0.89     0.89   0.98   0.83   0.68   LLj                 1      0.85     0.83   0.82   0.78   0.70
    S                          1        0.97   0.96   0.96   0.90   S                          1        0.98   0.96   0.94   0.85
    T                                   1      0.98   0.96   0.92   T                                   1      0.97   0.95   0.86
    PR                                         1      0.76   0.71   PR                                         1      0.77   0.78
    K                                                 1      0.94   K                                                 1      0.73
    Kr                                                       1      Kr                                                       1

   Vertical temperature gradients between the low- and               temperature gradient measurements from the ground-based
medium-elevation stations and the medium- and high-                  stations over the whole year at night, when convective mix-
elevation stations were not as distinct in spring, summer, or        ing is not active. Only in the colder months (winter and
autumn as they were in winter, as indicated by strong cor-           some of autumn; under low-gradient wind conditions) can
relation coefficients between temperatures from those eleva-         the pseudo-vertical temperature gradient be used effectively
tions (Table 2). Thus, according to Whiteman et al. (2004),          over the whole diurnal cycle.
the actual vertical temperature profile of the basin’s atmo-            Making the assumption of year-round horizontal homo-
sphere can only be suitably approximated by pseudo-vertical          geneity of the temperature field (Largeron and Staquet,

www.atmos-meas-tech.net/12/4455/2019/                                                  Atmos. Meas. Tech., 12, 4455–4477, 2019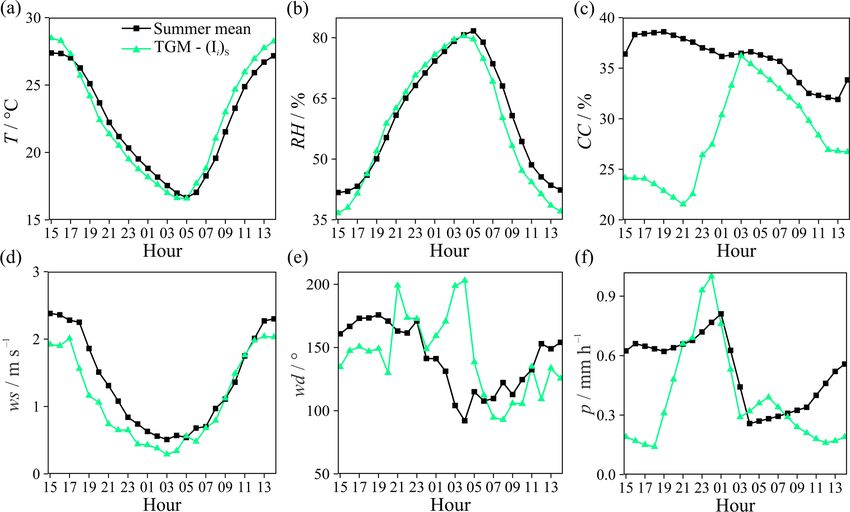
4462                                    D. Kikaj et al.: Identifying persistent temperature inversion events using radon-222

Figure 3. (a) Hourly mean observed radon concentrations, the advected radon contribution with subtracted radon indicated, and (b) isolated
synoptic timescale radon contribution in winter with the standard deviation (+σ ) of the diurnal contribution indicated. Four persistent
temperature inversion events (Ei )W detected by the RBM are shown in the shaded area and enlarged in the breakout panel beneath; see text
in Sect. 2.3.1 for details.

2016a), a relative measure of the degree of stability of the            iii. LjB and PR, (1T /1z)3 , 35 km apart, 1z = 720 m;
ABL can be made by calculating the vertical temperature
gradient between stations of different elevation categories              iv. LLj and Kr, (1T /1z)4 , 23 km apart, 1z = 1378 m.
(e.g., high–medium, high–low, or medium–low), (1T /1z)i ,              Following Largeron and Staquet (2016a) we derived our
where the index i refers to any pair of stations. To this              basin stability measure (the pseudo-vertical temperature gra-
end, following Largeron and Staquet (2016a), we calculated             dient) from the average of the four separate gradients:
pseudo-vertical temperature gradients for four station pairs.
Of the 21 possible gradient combinations we sought to avoid                         4
                                                                        1T       1X     1T
medium–high gradient pairs (since the high stations were not               (t) =             (t) .                                    (2)
                                                                        1z       4 i=1 1z i
internally well correlated), and avoided the use of station S
in the medium height category due to its comparatively high            We note, however, that 1T /1z and the individual gradients
correlation with temperatures of the low stations. Other com-          (1T /1z)i were typically very similar:
binations were chosen to minimize spatial separation. The
gradient pairs chosen for this study were as follows:                  1T          1T
                                                                           (t) ≈         (t) for i = 1. . .4.                 (3)
                                                                        1z         1z i
  i. Li and K, (1T /1z)1 , 29 km apart, 1z = 943 m;
                                                                       In order to avoid the detection of successive strong
 ii. LjB and T, (1T /1z)2 , 19 km apart, 1z = 396 m;                   nocturnal-only temperature inversions and isolate persistent

Atmos. Meas. Tech., 12, 4455–4477, 2019                                                   www.atmos-meas-tech.net/12/4455/2019/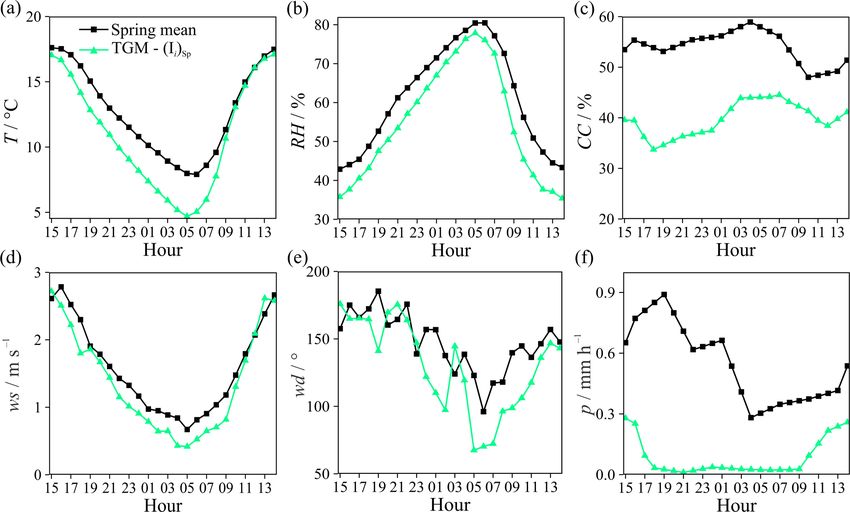
D. Kikaj et al.: Identifying persistent temperature inversion events using radon-222                                                  4463

Figure 4. The 24 h running mean pseudo-vertical temperature gradient in winter. Five persistent temperature inversion events (Ii )W detected
by the TGM are shown in the shaded area and enlarged in the breakout panel beneath; see text in Sect. 2.3.2 for details.

temperature inversion events, we applied a 24 h running                 quent synoptic stagnation events. These periods resulted in
mean smoothing to the pseudo-vertical temperature gradient              higher radon concentrations (long time over land). In January
((1T /1z)24 h ). Lastly, we calculated seasonal average (µ)             and February, even though monthly average wind speeds in-
values of 1T /1z to use as our seasonal thresholds for PTI              creased, recent air mass fetch was predominantly continental,
event identification, a slight deviation from the approach of           as indicated by dominant NE–E winds in seasonal wind roses
Largeron and Staquet (2016a), which used the cold season                (not shown), resulting in moderate monthly mean radon con-
average (November–December).                                            centrations. The lowest synoptic contributions to observed
  A persistent temperature inversion event is considered to             radon concentrations occurred in spring and summer. Dur-
have occurred when the (1T /1z)24 h value exceeds the sea-              ing these times the mean monthly wind speeds were higher
sonal average value for ≥ 48 h:                                         (strong mixing), and wind directions were often from the
                                                                        southwest, in the direction of the Gulf of Venice and Adri-
(1T /1z)24 h > µ(1T /1z)season for ≥ 48 h.                     (4)
                                                                        atic Sea, so terrestrial fetch for air masses was limited. In a
As an example of this technique we present the winter event             few specific cases (e.g., April and August), intense rainfall
selection results in Fig. 4. The same approach was used for             events appeared to be associated with a reduction in radon
all seasons.                                                            concentrations, likely attributable to short-term reductions in
                                                                        the radon flux (Fig. 5b).
                                                                           From March through September in Fig. 5a the variability
3     Results and discussion                                            in radon concentration appears to be of considerably higher
                                                                        frequency than from October through February. This is fur-
3.1    Data overview
                                                                        ther evidence of a change in dominant influences from di-
The time series of hourly average radon concentration at LjB            urnal to synoptic timescales, associated with changing day
revealed a seasonal cycle, characterized by a winter maxi-              length and intensity of solar radiation within the Ljubljana
mum and summer minimum (Fig. 5a). When monthly aver-                    basin. The period of greater synoptic influence (reduced di-
ages of the separated synoptic- and diurnal-scale contribu-             urnal radon variability) corresponds well with times when
tions to the radon observations are considered (Fig. 5c) it is          mean daily temperatures were close to or below 0 ◦ C, when
clear that the seasonal cycle is mainly controlled by synoptic          soil freezing was likely (Fig. 5a and b).
factors (changes in air mass fetch or time over land).
   From October through December monthly mean wind
speeds were typically low (Fig. 5c), associated with fre-

www.atmos-meas-tech.net/12/4455/2019/                                                      Atmos. Meas. Tech., 12, 4455–4477, 2019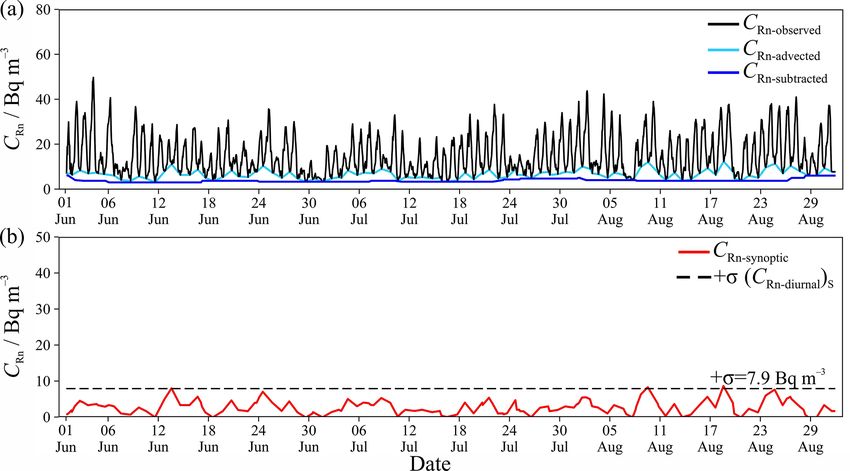
4464 D. Kikaj et al.: Identifying persistent temperature inversion events using radon-222
Figure 5. A total of 1 year (December 2016 to November 2017) of (a) hourly mean radon concentration, (b) hourly mean air temperature
and total daily precipitation, and (c) monthly mean of synoptic radon, diurnal mixing of radon, and wind speed.
Table 3. Persistent temperature inversion events (Ei ) by season According to the RBM approximately 20 % of winter ex-
(winter, W; spring, Sp; summer, S; autumn, A) detected by the perienced persistent strongly stable conditions, associated
radon-based method (RBM), including time period and duration. with anticyclonic synoptic conditions in the basin and sur-
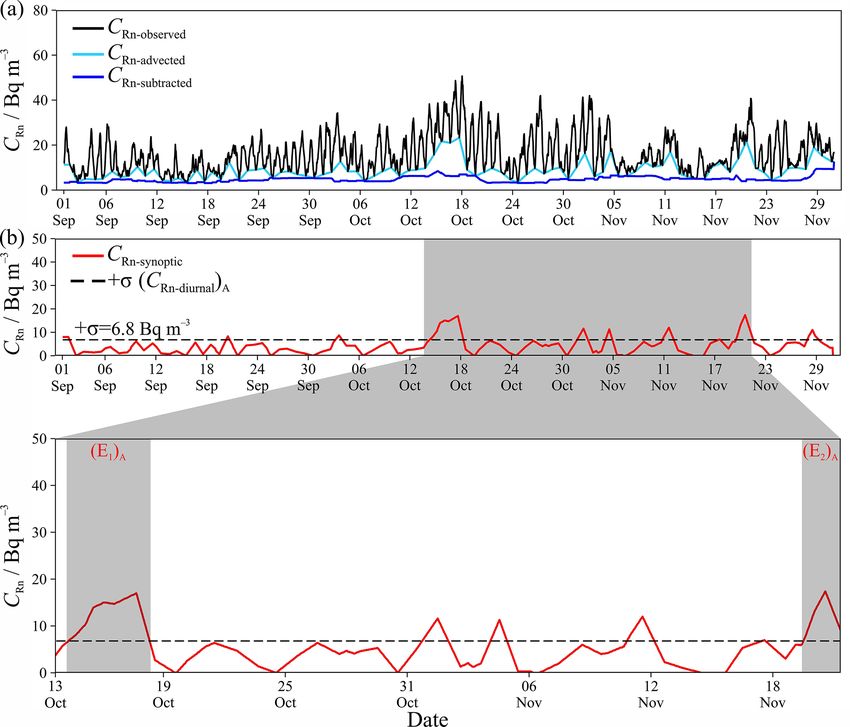
rounding regions. By contrast, the RBM classified only 7 %
Event Persistent inversion period Duration of autumn as PTI events. Events (E1 )A and (E2 )A lasted 4
(E1 )W 17/12/2016–19/12/2016 59 h (2.5 d) and 2 d, respectively, and both occurred in the second half of
(E2 )W 23/12/2016–27/12/2016 101 h (4.2 d) autumn.
(E3 )W 30/12/2016–02/01/2017 72 h (3 d)
(E4 )W 28/01/2017–02/02/2017 131 h (5.5 d) 3.3 Pseudo-vertical temperature gradient PTI event
(E1 )A 14/10/2017–18/10/2017 96 h (4 d) selection (TGM)
(E2 )A 19/11/2017–21/11/2017 48 h (2 d)
A total of 17 PTI events were detected throughout the mea-
surement year by the TGM. Dates, times, and duration of
these events are summarized in Table 4. Five events were de-
3.2 Radon-based PTI event selection (RBM) tected in winter (hereafter (Ii )W ), three in spring ((Ii )Sp ), two
in summer ((Ii )S ), and seven in autumn ((Ii )A ), as illustrated
The radon-based method (RBM) identified six PTI events in in Figs. 4, 9, 10, and 11.
the basin over the whole year of measurements. Four events Approximately 30 % of winter days experienced persis-
were detected in winter (hereafter (Ei )W ) and two in autumn tently stable conditions according to the TGM. All of the
((Ei )A ). Dates, times, and durations of these events are sum- TGM-classified events lasted from 3 to 8 d and were asso-
marized numerically in Table 3 and graphically in Fig. 3b ciated with strong inversion conditions (based on the mean
(winter) and Fig. 6b (autumn). The RBM detected no PTI vertical temperature gradients) with the exception of (I4 )W ,
events in spring and summer (see Figs. 7b and 8b). which was of lower intensity (Fig. 4). The highest number
Atmos. Meas. Tech., 12, 4455–4477, 2019 www.atmos-meas-tech.net/12/4455/2019/D. Kikaj et al.: Identifying persistent temperature inversion events using radon-222 4465
Figure 6. (a) Hourly mean observed radon concentrations, the advected radon contribution with subtracted radon indicated, and (b) isolated
synoptic timescale radon contribution in autumn with the standard deviation (+σ ) of the diurnal contribution indicated. Two persistent
temperature inversion events (Ei )A detected by the RBM are shown in the shaded area and enlarged in the breakout panel beneath; see text
in Sect. 2.3.1 for details.
of PTI events identified by the TGM was in autumn (Fig. 9). tude of relative humidity was ∼ 15 % on average (Fig. 12b),
Around 32 % of this season was classified as PTI conditions. with little variability in the extreme (µ + 1σ ) values (not
The identified (Ii )A had durations of 2 to 12 d, with (I1 )A , shown). Wind speeds between sunset and sunrise were low
(I2 )A , and (I7 )A being the shortest and with the least intense and relatively consistent (on average 0.5–0.7 m s−1 ), from
stability. The longest-lasting event with the strongest stability the ESE (Fig. 12d and e), with around 25 % cloud cover
was (I3 )A . predicted and no measured rainfall (Fig. 12f), all consis-
In contrast to the RBM, the TGM also identified PTI tent with anticyclonic synoptic conditions. The high vari-
events in spring (22 %) and summer (26 %) (Figs. 10 and 11). ability in NOAA GDAS nocturnal cloud amount (Fig. 12c)
may be associated with fog that frequently forms under PTI
3.4 Comparison of the radon-based and temperature conditions. There was no snow during the 2016–2017 win-
gradient methods ter, which would otherwise have led to stronger and longer-
lasting persistent temperature inversion conditions. Results
Diurnal composites, based on hourly means, of air tempera- from a companion study to this one, still in preparation, in-
ture, relative humidity, cloud cover, wind speed, wind direc- dicate that snow cover in the following 2017–2018 winter
tion, and precipitation for all conditions (winter mean) and reduced mean winter rates of radon emission by a factor of
for typical PTI event days in winter selected by RBM and 2–3. The mean atmospheric pressure during PTI events was
TGM are shown in Fig. 12. As evident, winter RBM PTI days ∼ 994 hPa, compared to ∼ 986 hPa for non-PTI conditions,
were mainly associated with modest diurnal temperature confirming the prevalence of anticyclonic conditions.
amplitudes (∼ 5 ◦ C on average), with morning minimums The mean diurnal temperature amplitude (6 ◦ C) of TGM
mostly between 0 and −4 ◦ C (Fig. 12a). The diurnal ampli- PTI events was 1 ◦ C larger than that of the RBM events, the
www.atmos-meas-tech.net/12/4455/2019/ Atmos. Meas. Tech., 12, 4455–4477, 20194466 D. Kikaj et al.: Identifying persistent temperature inversion events using radon-222 Figure 7. (a) Hourly mean observed radon concentrations, the advected radon contribution with subtracted radon indicated, and (b) iso- lated synoptic timescale radon contribution in spring with the standard deviation (+σ ) of the diurnal contribution indicated. No persistent temperature inversion events were detected by the RBM this season. Figure 8. (a) Hourly mean observed radon concentrations, the advected radon contribution with subtracted radon indicated, and (b) isolated synoptic timescale radon contribution in summer with the standard deviation (+σ ) of the diurnal contribution indicated. No persistent temperature inversion events were detected by the RBM this season. diurnal amplitude of relative humidity (20 %) was 5 % larger experienced some rainfall (Fig. 12c and f), which is very un- than that of the RBM events, and nocturnal extreme relative characteristic of stable (typically anticyclonic) conditions. It humidity values were less consistent (Fig. 12a and b; green should be noted that many of the differences between RBM vs. red lines). Diurnal minimum wind speeds were slightly and TGM PTI events selected in winter can be attributed higher (0.6–0.7 m s−1 ), and had a considerably larger diurnal to the single event (I4 )W , for which the mean temperature amplitude than that of the RBM events (Fig. 12d). The TGM- gradient indicated a lesser degree of stratification (Fig. 4). selected PTI days had more cloud cover (by 10 %–15 %) and Atmos. Meas. Tech., 12, 4455–4477, 2019 www.atmos-meas-tech.net/12/4455/2019/
D. Kikaj et al.: Identifying persistent temperature inversion events using radon-222                                                   4467

Figure 9. The 24 h running mean of the pseudo-vertical temperature gradient in autumn; seven persistent temperature inversion events (Ii )A
detected by the TGM are shown in the shaded section and enlarged in the breakout panel beneath; see text in Sect. 2.3.2 for details.

Figure 10. The 24 h running mean of the pseudo-vertical temperature gradient in spring; three persistent temperature inversion events (Ii )Sp
detected by the TGM are shown in the shaded area and enlarged in the breakout panel beneath; see text in Sect. 2.3.2 for details.

Atmospheric pressure (not shown) was also elevated for all               wind speeds (0.1–0.3 m s−1 ) throughout the night, but also
(Ii )W except (I4 )W .                                                   from the ESE (Fig. 13d and e; red lines). The mean diurnal
   The composite diurnal meteorological conditions associ-               amplitude of wind speed on autumn PTI days selected by
ated with the autumn PTI events (RBM and TGM) and au-                    RBM was ∼ 0.5 m s−1 compared to ∼ 2.5 m s−1 for non-PTI
tumn mean are shown in Fig. 13. Of particular note, wind                 autumn days (Fig. 13d). By comparison, PTI events iden-
speeds for the autumn RBM PTI events were even lower than                tified by the TGM had shorter nocturnal periods of lowest
those in winter, with broad ≥ 12 h periods of consistently low           wind speed (5–8 h) (Fig. 13d), with daytime µ+1σ values of

www.atmos-meas-tech.net/12/4455/2019/                                                       Atmos. Meas. Tech., 12, 4455–4477, 2019
4468                                      D. Kikaj et al.: Identifying persistent temperature inversion events using radon-222

Figure 11. The 24 h running mean of the pseudo-vertical temperature gradient in summer; two persistent temperature inversion events (Ii )S
detected by the TGM are shown in the shaded section and enlarged in the breakout panel beneath; see text in Sect. 2.3.2 for details.

Figure 12. Diurnal composites, based on hourly means, of (a) air temperature, (b) relative humidity, (c) cloud cover, (d) wind speed, (e) wind
direction, and (f) precipitation, for winter mean, and persistent temperature inversion events detected in winter by the RBM and TGM.

2–3.2 m s−1 (not shown). Between 00:00 and 05:00 LT near-                autumn TGM PTI events showed moderate-amplitude tem-
surface air temperature changed very slowly on RBM PTI                   perature variability (5 to 15 ◦ C), a 37 % amplitude change
nights (around −0.1 ◦ C h−1 ; Fig. 13a) compared with around             in relative humidity (with relatively consistent peak values
−0.4 ◦ C h−1 for non-PTI nights. On the other hand, diurnal              between 01:00 and 06:00 LT) (Fig. 13a, b). Relatively high
composites of meteorological quantities corresponding to the             cloud cover amounts were associated with autumn TGM

Atmos. Meas. Tech., 12, 4455–4477, 2019                                                      www.atmos-meas-tech.net/12/4455/2019/
D. Kikaj et al.: Identifying persistent temperature inversion events using radon-222                                                    4469

Figure 13. Diurnal composites, based on hourly means, of (a) air temperature, (b) relative humidity, (c) cloud cover, (d) wind speed, (e) wind
direction, and (f) precipitation, for autumn mean, and persistent temperature inversion events detected in autumn by the RBM and TGM.

                                                                             PTI events (around 40 %), with occasional rainfall recorded
                                                                             (Fig. 13c and f). In contrast to results from the TGM, from
                                                                             prior to sunset until several hours after sunrise, while some
Table 4. Persistent temperature inversion events (Ii ) by season
(winter, W; spring, Sp; summer, S; autumn, A) detected by pseudo-
                                                                             fog or cloud occurred, no rainfall was recorded at all under
vertical temperature gradient method (TGM), including time period            PTI conditions identified by the RBM in autumn (Fig. 13c
and duration.                                                                and f).
                                                                                 Diurnal composites of meteorological conditions associ-
       Event       Persistent inversion period          Duration             ated with spring and summer PTI events selected only by
                                                                             TGM and for mean spring and summer seasons are summa-
       (I1 )W      17/12/2016–19/12/2016                62 h (2.6 d)
                                                                             rized in Figs. 14 and 15. The spring air temperature, rela-
       (I2 )W      20/12/2016–27/12/2016                184 h (7.6 d)
       (I3 )W      29/12/2016–02/01/2017                93 h (3.8 d)         tive humidity, and wind speed diurnal composites show grad-
       (I4 )W      20/01/2017–24/01/2017                89 h (3.7 d)         ual and relatively consistent changes throughout the night to
       (I5 )W      27/01/2017–02/02/2017                152 h (6.3 d)        brief (not broad) minimum–maximum values around 05:00–
       (I1 )Sp     13/03/2017–21/03/2017                191 h (8 d)          06:00 LT, followed by a rapid change after sunrise (Fig. 14a,
       (I2 )Sp     25/03/2017–04/04/2017                246 h (10.3 d)       b, and d). The days identified here as PTI events actually
       (I3 )Sp     25/03/2017–04/04/2017                48 h (2 d)           correspond with days on which a strongly stable noctur-
       (I1 )S      31/07/2017–16/08/2017                386 h (16 d)         nal boundary layer has formed, which is then broken up in
       (I2 )S      20/08/2017–27/08/2017                186 h (7.8 d)        the morning by strong convection, rather than persistent in-
       (I1 )A      01/10/2017–03/10/2017                51 h (2.1 d)         version conditions. Further in support of this observation,
       (I2 )A      07/10/2017–09/10/2017                59 h (2.5 d)         only between 00:00 and 05:00 LT on the spring days iden-
       (I3 )A      10/10/2017–22/10/2017                277 h (11.5 d)
                                                                             tified by the TGM as PTI events did the wind direction
       (I4 )A      24/10/2017–29/10/2017                117 h (4.9 d)
       (I5 )A      30/10/2017–02/11/2017                79 h (3.3 d)
                                                                             switch to ESE (Fig. 14e), the expected direction of katabatic
       (I6 )A      19/11/2017–21/11/2017                65 h (2.7 d)         drainage at this site. The large mean diurnal amplitudes of
       (I7 )A      26/11/2017–28/11/2017                50 h (2.1 d)         temperature (∼ 13 ◦ C), relative humidity (∼ 45 %), and wind
                                                                             speed (∼ 2.5 m s−1 ) in spring (Fig. 14a, b, and d) were not
     Note: the events in bold were also detected by the radon-based method
     (RBM).                                                                  consistent with characteristics usually associated with PTI
                                                                             events. Similar characteristics were observed within the di-
                                                                             urnal composite plots of summer PTI events identified by

www.atmos-meas-tech.net/12/4455/2019/                                                         Atmos. Meas. Tech., 12, 4455–4477, 2019
4470 D. Kikaj et al.: Identifying persistent temperature inversion events using radon-222
the TGM (Fig. 15), indicative of stable nocturnal conditions (as may be driven by changes in mean soil moisture, snow
(though not as strong in summer) that rapidly become con- cover, or soil freezing) do not affect the comparative seasonal
vective after sunrise, rather than persisting as stable events efficacy of the technique, making it seasonally independent.
throughout the day. Further evidence that the TGM was even However, large spatial variability in the radon source func-
less selective of nocturnally stable conditions is the frequent tion (as experienced between land and open water bodies)
rainfall events observed on the nights in question (Fig. 15f). has the potential to prevent this technique from accurately
By definition, PTI events should not exhibit strong diurnal identifying PTI events, but only for study regions located on
cycles of temperature and relative humidity, should have con- (or close to, i.e., ≤ 10 km) the coast. For non-coastal regions,
sistently light to calm nocturnal wind speeds, and, since little the longevity of radon’s parent (226 Ra, half-life 1600 years)
daytime convective mixing is expected, daytime wind speeds ensures that the technique can be applied consistently over
should also be relatively light. Furthermore, since they usu- long periods and – when enough PTI events have been ob-
ally occur under anticyclonic synoptic conditions, when re- served within a given season – provide a means of objectively
gional subsidence prevails, rainfall is not expected. assessing their severity.
In summary, while no PTI events identified by the RBM in Compared to the pseudo-vertical temperature gradient
winter or autumn were missed by the TGM (Tables 3 and 4), method, which requires input from multiple ground-based
it is clear that the TGM is less selective of truly persistently weather stations (Whiteman et al., 2004), single-height radon
stable conditions than the RBM. However, the TGM classi- monitoring, from a single monitoring station near the bottom
fied a number of other periods in winter and autumn as PTI of the basin/valley, clearly provides a simple, economical,
events, and also considered that the (I3 )A was longer last- and low-maintenance means by which to identify persistent
ing than predicted by the RBM. This shortcoming is likely temperature inversion events with a substantially higher de-
attributable to the degree of validity of the assumptions on gree of success than some contemporary meteorological ap-
which the TGM is based for the Ljubljana basin. In spring proaches.
and summer (Figs. 14 and 15) some assumptions of the TGM
are less valid (i.e., less distinction between temperatures at 3.6 Advantages and limitations of the pseudo-vertical
different elevations), causing the method to produce mislead- temperature gradient method (TGM)
ing results. Large temperature gradients on very stable nights
push daily mean values well above the seasonal mean. For For the Ljubljana basin the TGM was found to not always
consecutive strongly stable nights, under anticyclonic con- be a reliable means of detecting PTI events. This was mainly
ditions, this is incorrectly interpreted as a PTI event by the due to limited validity of the necessary assumptions. The as-
TGM. sumption of a horizontally homogeneous temperature field
was often invalid in the case of the high-elevation sites,
3.5 Advantages and limitations of radon-based method where a variety of mesoscale processes, including drainage
(RBM) flows, nocturnal jets, and intermittent turbulence (Whiteman
et al., 2004; Williams et al., 2013) limit the ability to derive
The RBM relies upon accurate characterization of after- representative vertical temperature gradients from spatially
noon minimum radon concentrations. In this regard, mea- separated locations at different elevations. Furthermore, the
surement quality and time series analysis are important. The assumption of distinct differences between temperatures of
lower limit of detection of commercial, portable radon de- the different elevation groups based on daily means was typ-
tectors such as the AlphaGUARD (LLD 2–3 Bq m−3 ) is 2 ically only valid in winter (Table 2).
orders of magnitude poorer than that of research-grade two- Consequently, for most of the year the TGM was only able
filter radon detectors (LLD ∼ 0.02 Bq m−3 ; Chambers et al., to reliably identify stable conditions in the boundary layer
2014). Compared with sub-diurnal variability this necessi- at night, when buoyancy or gravitational effects tend to pro-
tates smoothing of radon observations if using a commercial duce horizontal isotherms (Whiteman et al., 2004). However,
instrument, the extent of which is likely to be application- pseudo-vertical temperature profiles are useful for identify-
/site-specific. An alternative, but more expensive, solution ing extended periods of strongly stable conditions based on
would be to make vertical radon gradient measurements us- 24 h data in winter (Largeron and Staquet, 2016a). According
ing research-grade detectors. This would ensure the most ac- to Whiteman et al. (2004), the TGM tends to be more repre-
curate, and simple, separation of diurnal (mixing-related) and sentative of PTI events when the study region has snow cover.
synoptic (fetch-related) contributions to observed radon con- A uniform cover of snow reduces the temperature contrasts
centrations. usually associated with radiation receipt on different aspect
The amount of radon that accumulates over a night or a slopes and different types of ground cover, helping to main-
given synoptic PTI event is directly related to the seasonal av- tain stability over the diurnal cycle (Whiteman et al., 2004).
erage radon flux. By performing the RBM separately for each The reduced accuracy of the technique in the SAB during the
season and year, long-term (i.e., seasonal mean) changes of 2016–2017 winter season may be attributable in part to a lack
the terrestrial radon flux from one season or year to the next of snow cover that winter.
Atmos. Meas. Tech., 12, 4455–4477, 2019 www.atmos-meas-tech.net/12/4455/2019/You can also read