Biomass-burning smoke heights over the Amazon observed from space
←
→
Page content transcription
If your browser does not render page correctly, please read the page content below
Atmos. Chem. Phys., 19, 1685–1702, 2019
https://doi.org/10.5194/acp-19-1685-2019
© Author(s) 2019. This work is distributed under
the Creative Commons Attribution 4.0 License.

Biomass-burning smoke heights over the Amazon observed from
space
Laura Gonzalez-Alonso1 , Maria Val Martin1,2 , and Ralph A. Kahn3
1 Chemical and Biological Engineering Department, University of Sheffield, UK
2 Now at Leverhulme Centre for Climate Change Mitigation, Animal Plant Sciences Department, University of Sheffield, UK
3 Climate and Radiation Laboratory, Code 613, NASA Goddard Space Flight Center, USA

Correspondence: Laura Gonzalez-Alonso (lgonzalezalonso1@sheffield.ac.uk)

Received: 5 September 2018 – Discussion started: 28 September 2018
Revised: 11 January 2019 – Accepted: 30 January 2019 – Published: 8 February 2019

Abstract. We characterise the vertical distribution of            (800 m) compared to non-drought (1100 m) conditions, in
biomass-burning emissions across the Amazon during the            particular over tropical forest and savanna fires. Drought con-
biomass-burning season (July–November) with an exten-             ditions favour understory fires over tropical forest, which
sive climatology of smoke plumes derived from MISR and            tend to produce smouldering combustion and low smoke in-
MODIS (2005–2012) and CALIOP (2006–2012) observa-                 jection heights. Droughts also seem to favour deeper bound-
tions. Smoke plume heights exhibit substantial variability,       ary layers and the percentage of smoke plumes that reach the
spanning a few hundred metres up to 6 km above the ter-           free troposphere is lower during these dry conditions. Con-
rain. However, the majority of the smoke is located at alti-      sistent with previous studies, the MISR mid-visible aerosol
tudes below 2.5 km. About 60 % of smoke plumes are ob-            optical depth demonstrates that smoke makes a significant
served in drought years, 40 %–50 % at the peak month of           contribution to the total aerosol loading over the Amazon,
the burning season (September) and 94 % over tropical for-        which in combination with lower injection heights in drought
est and savanna regions, with respect to the total number of      periods has important implications for air quality. This work
smoke plume observations. At the time of the MISR observa-        highlights the importance of biome type, fire properties and
tions (10:00–11:00 LT), the highest plumes are detected over      atmospheric and drought conditions for plume dynamics and
grassland fires (with an averaged maximum plume height of         smoke loading. In addition, our study demonstrates the value
 ∼ 1100 m) and the lowest plumes occur over tropical forest       of combining observations of MISR and CALIOP constraints
fires (∼ 800 m). A similar pattern is found later in the day      on the vertical distribution of smoke from biomass burning
(14:00–15:00 LT) with CALIOP, although at higher altitudes        over the Amazon.
(2300 m grassland vs. 2000 m tropical forest), as CALIOP
typically detects smoke at higher altitudes due to its later
overpass time, associated with a deeper planetary boundary
layer, possibly more energetic fires, and greater sensitivity     1   Introduction
to thin aerosol layers. On average, 3 %–20 % of the fires in-
ject smoke into the free troposphere; this percentage tends to    Fires burn across the Amazon region every year, releasing
increase toward the end of the burning season (November:          large amounts of trace gases and aerosols into the atmosphere
15 %–40 %). We find a well-defined seasonal cycle between         (e.g. Andreae and Merlet, 2001). The majority of these fires
MISR plume heights, MODIS fire radiative power and atmo-          are of anthropogenic origin: for deforestation, preparation
spheric stability across the main biomes of the Amazon, with      of agriculture fields, conversion of cropland to pasture or
higher smoke plumes, more intense fires and reduced atmo-         road and city expansion (Cochrane, 2003). Between 1976
spheric stability conditions toward the end of the burning sea-   and 2010, deforestation fires destroyed more than 15 % of
son. Lower smoke plume heights are detected during drought        the original Amazonian forest (Aragao et al., 2014). Most of
                                                                  these fires burn in the so-called arc of deforestation, along

Published by Copernicus Publications on behalf of the European Geosciences Union.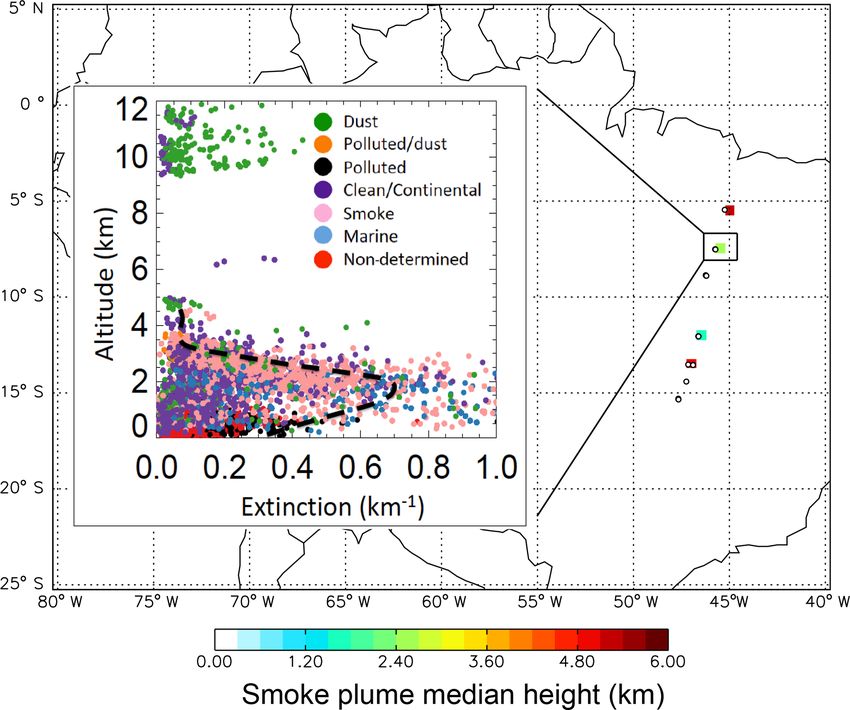
1686                                                        L. Gonzalez-Alonso et al.: Amazon biomass-burning smoke plumes

the eastern and southern borders of the Amazon forest, dur-           globe. Specifically over the Amazon, they found that on a
ing the dry season (typically from July to November) (Malhi           broad scale, smoke layers are typically located above bound-
et al., 2008). However, significant variability exists, caused        ary layer clouds, at altitudes of 1.6–2.5 km. Consistent with
by changes in meteorology, drought and land-management                the smoke altitudes detected by CALIOP, an analysis of in-
policies (e.g. Nepstad et al., 2006; Van der Werf et al., 2010;       jection heights using CO observations from TES and MLS
Alencar et al., 2011). Amazon fires can contribute up to about        estimated that about 17 % of fire plumes over South Amer-
15 % of the total global biomass-burning emissions (Van der           ica reached the free troposphere in 2006 (Gonzi and Palmer,
Werf et al., 2010). These emissions have important implica-           2010).
tions for air quality, atmospheric composition, climate and              Numerous studies have sought to understand the impact
ecosystem health (e.g. Ramanathan et al., 2001; Johnston              of biomass burning in the Amazon, on local to hemispheric
et al., 2012; Pacifico et al., 2015). For example, air pollu-         scales. In particular, during the past decade, several air-
tion from deforestation fires is estimated to cause on average        craft campaigns have been designed to study the effect
about 3000 premature deaths per year across South America             of biomass burning on greenhouse gases, aerosols loading,
(Reddington et al., 2015) and may decrease the net primary            clouds, regional weather and/or climate over the Amazon
productivity in the Amazon forest as a result of increases in         (e.g. BARCA (Andreae et al., 2012), SAMBBA (Allan et al.,
surface ozone (Pacifico et al., 2015).                                2014) and GoAmazon (Martin et al., 2016)). For example,
   Fires are also an important source of buoyancy locally,            modelling studies during SAMBBA showed the importance
which in combination with other atmospheric properties de-            of the vertical representation of aerosols from biomass burn-
termines the vertical distribution of fire emissions in the at-       ing over the region (Archer-Nicholls et al., 2015), as biomass
mosphere near the fire source (i.e. injection height). The al-        burning can modify local weather (Kolusu et al., 2015) and
titude at which smoke is injected is critical, as it determines       regional climate (Thornhill et al., 2018). Based on lidar ob-
the lifetime of the pollutant, its downwind transport disper-         servations taken in six research flights during SAMBBA (16–
sion pathway and the magnitude of its environmental im-               29 September 2014), Marenco et al. (2016) reported the pres-
pact (e.g. Jian and Fu, 2014; Archer-Nicholls et al., 2015;           ence of two distinct smoke aerosol layers, a fresh smoke
Paugam et al., 2016; Zhu et al., 2018). Space-borne observa-          layer extending from the surface to an altitude of 1–1.5 km,
tions have been used to study smoke injection heights across          and an elevated and persistent layer of aged smoke at 4–
the world. Using Multi-angle Imaging SpectroRadiometer                6 km. During the 2008 dry biomass season, continuous ra-
(MISR) stereo-height retrievals, smoke plume heights have             man lidar measurements of optical properties taken in Man-
been assessed across North America (Kahn et al., 2008; Val            aus (2.5◦ S, 60◦ W) also detected biomass-burning layers at
Martin et al., 2010), Indonesia (Tosca et al., 2011), Australia       3–5 km heights, although most of the smoke was confined be-
(Mims et al., 2010), south-eastern Asia (Jian and Fu, 2014)           low 2 km (Baars et al., 2012). Whilst the results from these
and Europe (Sofiev et al., 2013). For example, Val Martin             aircraft and in situ lidar observations are significant, there are
et al. (2010), using a 5-year climatology of smoke fire plumes        no analyses yet that seek to quantify the long-term average
and smoke clouds observed by MISR across North Amer-                  vertical distribution of smoke from fires across the Amazon
ica, showed that wildfire smoke can reach altitudes from a            and to identify the key factors that control plume rise over
few hundred metres above the ground to about 5 km, and that           this region.
5 %–30 % of the smoke plumes are injected into the free tro-             Here we present an 8-year climatology of smoke plume
posphere (FT), depending on the biome and year. Related               heights over the Amazon, derived from observations by the
work also demonstrated the important effect that fire radia-          MISR and CALIOP instruments on board the NASA Terra
tive power, i.e. a proxy of fire intensity, and atmospheric con-      and CALIPSO satellites, respectively. These data are anal-
ditions have on the initial rise of fire emissions (Freitas et al.,   ysed in combination with measurements of fire radiative
2007; Kahn et al., 2007; Val Martin et al., 2012). Tosca et al.       power (FRP) from NASA Moderate Resolution Imaging
(2011) reported that less than 4 % of smoke plumes reach the          Spectroradiometer (MODIS) instruments, assimilated mete-
free troposphere, based on a MISR 8-year climatology from             orological observations from MERRA-2 and drought con-
tropical forest and peatland fires over Borneo and Sumatra            dition indicators from the MODIS drought severity index
and found that the greatest plume heights were recorded dur-          (DSI). The objectives of this work are to characterise the
ing an El Niño year over Borneo.                                      magnitude and variability of smoke heights from biomass
   Smoke plume heights have also been determined us-                  burning across the Amazon and to assess the influence of
ing space-borne lidar observations from CALIOP (Labonne               biome type, fire intensity, local atmospheric conditions and
et al., 2007; Huang et al., 2015), aerosol index from the             regional drought on smoke vertical distribution as well as
TOMS and OMI instruments (Guan et al., 2010), and CO                  aerosol loading.
observations from TES and MSL (Gonzi and Palmer, 2010).
Huang et al. (2015) used a multi-year record of CALIOP
vertical aerosol distributions to study smoke and dust layer
heights over six high-aerosol-loading regions across the

Atmos. Chem. Phys., 19, 1685–1702, 2019                                                 www.atmos-chem-phys.net/19/1685/2019/
L. Gonzalez-Alonso et al.: Amazon biomass-burning smoke plumes                                                             1687

2     Data and methods                                           plume that can help to assess its structure and dynamical
                                                                 behaviour. In addition, MODIS thermal anomalies can be
We use a combination of remote-sensing data from multi-          superimposed, which helps identify the locations of smoke
ple sources to build a comprehensive climatology of smoke        sources from active fires. A user needs to digitise the bound-
plume heights and characterise the vertical distribution of      aries of the plume, starting at the source point, and to in-
smoke across the Amazon. We provide below a summary of           dicate the direction of smoke transport. The MINX stereo-
main datasets and tools used in the analysis and compile their   scopic algorithm also calculates wind speed from the dis-
main features in Table S1 of the Supplement.                     placement of plume contrast elements, which is used sub-
                                                                 sequently to compute wind-corrected heights, accounting for
2.1    MINX overview                                             displacement due to the proper motion of the plume elements
                                                                 between camera views. As with the MISR standard stereo-
The MISR INteractive eXplorer (MINX) software is an ap-          height product, MINX automatically retrieves smoke plume
plication written in Interactive Data Language (IDL) that is     heights and wind speed at a horizontal resolution of 1.1 km
used to analyse the physical properties of smoke plumes and      and vertical resolution of 250–500 m, but with greater accu-
to study plume dynamics (Nelson et al., 2013). MINX can          racy for the plume itself due to the user inputs (Nelson et al.,
use MODIS thermal anomalies to locate active fires, and          2013). MINX plume heights are reported above the geoid,
MINX then computes the smoke plume or cloud heights from         which correspond to the level of maximum spatial contrast
MISR stereo imagery. MINX also collects particle property        in the multi-angle imagery, typically near the plume top, but
results from the MISR standard aerosol retrieval algorithm       actually offer a distribution of heights in most cases, because
(Martonchik et al., 2009). MODIS and MISR are both aboard        aerosol plumes are rarely uniform (Flower and Kahn, 2017).
the NASA Terra satellite, which crosses the equator in the de-   Additionally, MINX provides local terrain height from a dig-
scending node at around 10:30 local time. These instruments      ital elevation map (DEM) product. Here we report heights
allow temporally and spatially coincident detection of active    above the terrain by taking account of the DEM values. Fur-
fires and their associated smoke plumes (Kahn et al., 2008).     ther information from the MISR standard aerosol product
   MODIS has a cross-track swath of 2330 km that provides        about aerosol amount and type is collected and reported,
global coverage every 1 to 2 days. The instrument has 36         along with FRP from MODIS (Nelson et al., 2013). MINX
spectral channels with wavelengths between 0.4 and 14.2 µm,      has been successfully used to investigate fire smoke plume
and detects thermal anomalies at 1 km spatial resolution (at     heights over many regions across the world (e.g. Kahn et al.,
nadir) under cloud-free conditions. MODIS reports fire ra-       2008; Val Martin et al., 2010; Tosca et al., 2011; Jian and Fu,
diate power based on a detection algorithm that uses bright-     2014).
ness temperature differences in the 4 and the 11 µm chan-           There are several limitations to the MISR-MINX approach
nels (Giglio et al., 2003); this FRP parameter is used as an     that must be considered when studying smoke plume heights.
indicator of fire location and qualitative intensity. We use     For example, MISR obtains global coverage only about once
MODIS Collection 6 (Table S1 in the Supplement). We note         per week, and the Terra overpass time in the late morning
that MINX provides FRP values in MW, although they are           does not coincide with the typical, late-afternoon peak of
actually in MW per 1 km pixel, which corresponds to W m−2 ,      fire intensity. MODIS does not observe FRP under cloud and
except toward the edges of the swath.                            dense smoke, and the MINX operator must decide whether
   MISR has nine push-broom cameras placed at viewing an-        to include any pyrocumulus clouds in the plume-height re-
gles spanning −70.5 to 70.5 relative to nadir in the satellite   trieval. These are the key limitations: they and others are
along-track direction (Diner et al., 1998). The cameras each     discussed further in the literature (e.g. Kahn et al., 2007;
provide imagery in four spectral bands (446, 558, 672 and        Val Martin et al., 2010; Nelson et al., 2013). In addition,
867 nm), which makes it possible to distinguish aerosol types    three MINX versions were used to generate the data in this
qualitatively (Kahn and Gaitley, 2015) and surface structure     study, which might introduce an additional bias. MINXv2
from the change in reflectance with view angle. This passive     and v3 included only MISR red-band plume height retrievals,
stereoscopic imagery method produces cloud and aerosol           whereas MINXv4 considers both red- and blue-band images.
plume heights, along with cloud-tracked winds aloft. MISR        Over land, digitalisation with the blue band usually provides
has a swath of 380 km common to all cameras, so global cov-      higher-quality retrievals, especially for optically thin plumes
erage is obtained every 9 days at the Equator and every 2        over bright surfaces. In contrast, the red band provides higher
days at the poles (Diner et al., 1998). The MISR standard        vertical resolution over dark surfaces and sometimes per-
stereo-height product provides vertical resolution of 275–       forms better for optically dense smoke layers (Nelson et al.,
500 m and a horizontal resolution of 1.1 km (Moroney et al.,     2013). We take these limitations into account throughout our
2002; Muller et al., 2002).                                      analysis.
   MINX has a graphical user interface that displays the nine
MISR multi-angle images. They can be visualised one by
one or as an animated loop, providing a 3-D view of the

www.atmos-chem-phys.net/19/1685/2019/                                             Atmos. Chem. Phys., 19, 1685–1702, 2019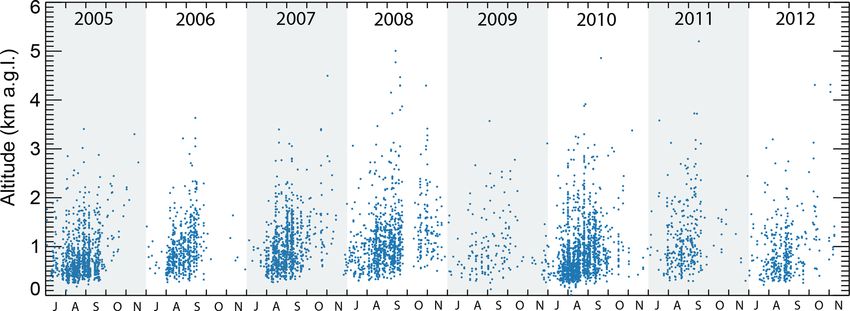
1688                                                    L. Gonzalez-Alonso et al.: Amazon biomass-burning smoke plumes

2.2    MINX smoke plume database                                  2.3   Land cover unit data

We limited our study to the burning season (July–November)        We use the MODIS Level 3 land cover product MCD12Q1
for the period of 2005–2012. Using MINX, we developed a           (Friedl et al., 2010) to determine the type of land cover as-
climatology of plume heights across the Amazon, consist-          sociated with each of our fire smoke plumes. This product
ing of 10 858 smoke plumes in the region (25◦ S–5◦ N lati-        contains 17 International Geosphere-Biosphere Programme
tude and 80–40◦ W longitude). Over this domain, the NASA          (IGBP) land cover classes, at a horizontal resolution of
Terra satellite overpass is every 4–8 days at 10:00–11:00 lo-     500 m and annual temporal resolution, from 2001 to the
cal time. Table 1 summarises the number of smoke plumes           present day. It is available from the Land Processes Dis-
in each year and the digitising source. The climatology in-       tributed Active Archive Center (https://e4ftl01.cr.usgs.gov/
cludes a combination of smoke plumes extracted from dif-          MOTA/MCD12Q1.051/, last access: 4 February 2019). We
ferent projects and created with different versions of MINX       merge land cover classes having similar characteristics into
(v2–4): plumes for August–September in the years 2006 and         four land types representing the main biomes across the
2007 are from the MISR Plume Height Project (Nelson et al.,       Amazon: tropical forest, savanna, grassland and crops.
2013); plumes in the year 2008 are from the global digital-
isation effort made for the AeroCom project (MPHP2 and            2.4   Atmospheric conditions
Val Martin et al., 2018); and the 5 remaining years and addi-
tional months are digitised as a part of the current project.     To assess the role of atmospheric conditions on the final ele-
   MINX computes several plume heights that describe the          vation of smoke plumes across the Amazon, we analyse data
altitude that smoke reaches in the atmosphere. In this work,      from the second Modern Era Retrospective-analysis for Re-
we use the best-estimate maximum and median smoke plume           search and Applications (MERRA-2) reanalysis model simu-
heights, which represent the distribution of stereo heights       lation (Bosilovich et al., 2015). We focus on the height of the
obtained at the level of maximum spatial contrast over the        planetary boundary layer (PBL) and the atmospheric stability
plume area (Nelson et al., 2013). In addition, as in previ-       at the location of our fires. As in previous studies (e.g. Kahn
ous studies, we remove smoke plumes with poor-quality re-         et al., 2007; Val Martin et al., 2010), we define the atmo-
trieval flags. This screening leaves a total of 5393 plumes,      spheric stability as the vertical gradient of potential tempera-
about 56 % of the original database, with 77 % and 23 %           ture. We use data from MERRA-2 at a horizontal resolution
plumes digitised in the red and blue bands, respectively. Our     of 0.625◦ longitude by 0.5◦ latitude, with 42 vertical pressure
final dataset includes plumes digitised in years with intense     levels between the surface and 0.01 hPa. MERRA-2 provides
fire activity associated with severe drought conditions (e.g.     hourly PBL height above ground level and potential temper-
2005, 2007 and 2010) (Chen et al., 2011), in years with low       ature profiles every 6 h (0:00, 06:00, 12:00 and 18:00 UT), so
fire intensity and considerable precipitation (2009 and 2011)     we linearly interpolate these data to the time and location of
(Marengo et al., 2013) and in 1 year when land-management         each fire plume origin.
policy measures limited deforestation (2006) (Nepstad et al.,
                                                                  2.5   Drought conditions
2006). Thus, our climatology is intended to capture smoke
plume variability under diverse conditions.                       To determine the presence and magnitude of droughts over
   As mentioned in Sect. 2.1, the MISR colour band im-            the Amazon during our study period, we use the MODIS
age used by the MINX algorithm to compute smoke plume             drought severity index (DSI). The DSI is a global drought
heights influences the quality of the plume height and wind       index derived by combining the MODIS16 Evapotranspi-
speed retrievals. A large majority of the fires detected across   ration (e.g. Mu et al., 2007) and the MODIS13 vegetation
our domain have optically thin smoke plumes. Thus, blue-          index (NDVI) data products (Huete et al., 2002). DSI pro-
band plume retrievals are more successful, with about 60 %        vides drought conditions on a global scale for all vegetated
of the smoke plumes receiving good- or fair-quality flags         areas at 8-day and annual temporal resolutions and 0.5 or
compared to 36 % for the red-band retrievals. In our dataset      0.05◦ horizontal spatial resolution for 2000–2011 (Mu et al.,
overall, most of the plumes were digitised from red-band im-      2013). In this work, we use the 8-day temporal resolution
ages, as it was the default option for MINX v2–3. However,        DSI and interpolate the data to the time and location of
whenever both band retrievals are available for a plume, the      our fire smoke plumes. Following Mu et al. (2013), we fur-
blue band is preferred in this study. The choice of the band      ther define drought conditions as “extreme severe” (DSI ≤
colour for the retrievals does not significantly affect the re-   −1.2), “mild moderate” (−1.2 ≤ DSI < −0.29), “normal”
sults presented here, as the difference in heights for smoke      (−0.29 > DSI > 0.29) and “wetter than normal” (DSI ≥
plumes digitised with both bands is negligible (∼ 60 m),          0.29).
lower than the ±250 m MINX uncertainty.

Atmos. Chem. Phys., 19, 1685–1702, 2019                                            www.atmos-chem-phys.net/19/1685/2019/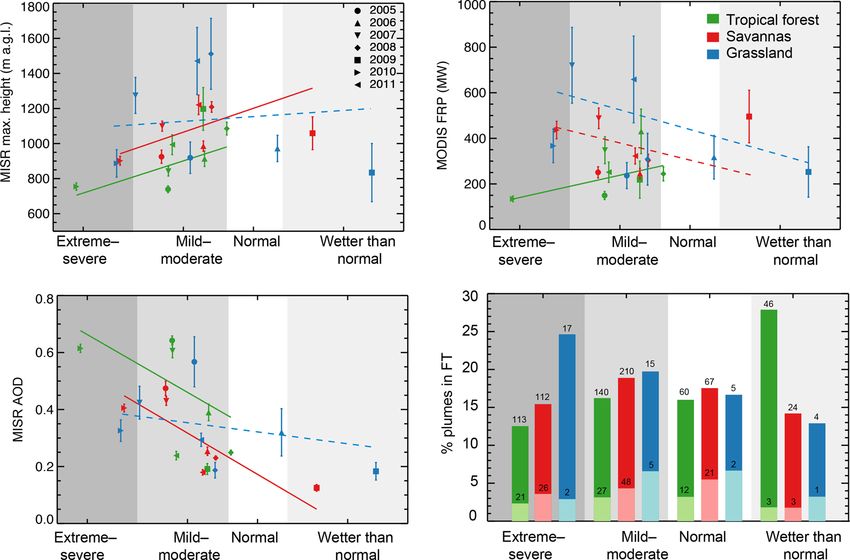
L. Gonzalez-Alonso et al.: Amazon biomass-burning smoke plumes                                                                               1689

Table 1. Summary of MISR smoke plumes over the Amazon domain (2005–2012).

                                                   Number of plumesa
                         Year              Total     Blue band        Red band         MINX version          Reference
                         2005               927              122             805       v3/v4                 This study
                         2006               513              501              12       v2/v4                 MPHPb /This study
                         2007               858              670             188       v2/v4                 MPHPb /This study
                         2008               889              889               0       v3.1                  MPHP2c
                         2009               150               55              95       v3/v4                 This study
                         2010              1373                0            1373       v3                    This study
                         2011               320              320               0       v4                    This study
                         2012               363               30             333       v3/v4                 This study
                         2005–2012         5393             2587            2806
                       a Total number of plumes and number of plumes digitised with blue- or red-band retrievals. b MISR Plume Height
                       Project; data from https://misr.jpl.nasa.gov/getData/accessData/MISRPlumeHeight/ (last access: 4 February 2019).
                       c MISR Plume Height Project2; data from https://misr.jpl.nasa.gov/getData/accessData/MisrMinxPlumes2/ (last
                       access: 4 February 2019).

2.6   CALIOP observations                                                         with the MISR smoke plumes, which are retrieved during late
                                                                                  morning.
                                                                                     The CALIOP swath is ∼ 100 m wide, so sampling is effec-
We also use extinction profiles derived from the CALIOP in-
                                                                                  tively a curtain. To obtain a climatology of CALIOP smoke
strument to provide an independent assessment of the vertical
                                                                                  plumes as in MISR, we developed an approach to identify in-
smoke distribution across the Amazon. CALIOP is a space-
                                                                                  dividual smoke plumes in the CALIOP data. We first grid all
borne two-wavelength polarisation lidar (532 and 1064 nm)
                                                                                  CALIOP aerosol extinction profiles classified as smoke (day
that flies aboard the CALIPSO satellite (Winker et al., 2013).
                                                                                  and night) at a horizontal resolution of 0.5◦ × 0.5◦ over the
CALIPSO was launched in 2006 into a sun-synchronous po-
                                                                                  Amazon region, and a vertical resolution of 250 m, from the
lar orbit of 705 km altitude as a part of the A-Train constella-
                                                                                  surface to 12 km. We chose this horizontal resolution to op-
tion, with an orbit repeat cycle of 16 days. CALIOP collects
                                                                                  timise computer processing time. Within each grid cell, we
backscatter and depolarisation data that constrain the vertical
                                                                                  then determine the vertical distribution of smoke extinction.
structure and some properties of aerosols and clouds around
                                                                                  We define the maximum smoke plume height in each grid
the globe (Vaughan et al., 2004; Liu et al., 2009). In addition,
                                                                                  cell as the maximum altitude reached by the extinction clas-
CALIOP provides a characterisation of the aerosol type (i.e.
                                                                                  sified as smoke. Similarly to the MINX definition of median
dust, polluted dust, marine, clean continental, pollution and
                                                                                  plume height, we consider the median of the CALIOP verti-
biomass burning) based on an externally determined surface
                                                                                  cal extinction distribution as the height at which most of the
type along with measured depolarisation ratios, integrated
                                                                                  smoke is probably concentrated. Smoke does tend to concen-
backscatter altitude and colour ratio (Omar et al., 2009). This
                                                                                  trate either in the PBL or in thin layers in the FT (Kahn et al.,
aerosol-type classification can be used to indicate the likely
                                                                                  2007; Val Martin et al., 2010).
sources that contribute to aerosol mass loading at specific lo-
                                                                                     To ensure we do not introduce a bias into the CALIOP
cations and times at which the instrument has coverage.
                                                                                  plume heights due to the 0.5◦ × 0.5◦ horizontal resolution,
   We use CALIOP Level 2 version 4 day and night data
                                                                                  we also retrieved the smoke plumes for the 2007 burning sea-
(CAL_LID_L2_05kmAPro-Standard-V4-10) over the Ama-
                                                                                  son at a horizontal resolution of 0.1◦ × 0.1◦ and find no sig-
zon for the July to November burning season, from 2006
                                                                                  nificant differences. For this subset, our 0.5◦ × 0.5◦ method
to 2012. In this work, we filter the data following Ford and
                                                                                  returns 131 plumes, with an average altitude of 3.65 km for
Heald (2012). This filtering approach uses cloud-aerosol dis-
                                                                                  the maximum plume heights, whereas the 0.1◦ ×0.1◦ method
tinction scores, extinction uncertainty values, atmospheric
                                                                                  returns 149 plumes, with an average altitude of 3.74 km.
volume descriptors, extinction quality control flags and to-
                                                                                     To identify CALIOP smoke plumes associated with active
tal column optical depths, and assumes that extinction ob-
                                                                                  fires, we select only those CALIOP-derived grid cells that
servations classified as “clear air” have zero aerosol extinc-
                                                                                  contain at least two MODIS Collection 6 fire pixels (Giglio
tion (rather than the fill value). CALIOP daytime retrievals
                                                                                  et al., 2003) at 80 % confidence level or higher, at the time
can be biased low due to the noise from scattered solar ra-
                                                                                  of CALIOP overpass. We also use the mean terrain elevation
diation (Winker et al., 2009; Rogers et al., 2011). However,
                                                                                  across each grid cell to reference the maximum and median
we analyse both day (i.e. early afternoon, ∼ 13:30 LT equator
                                                                                  heights to ground level, as CALIOP provides observations
crossing time) and night profiles to identify any differences
                                                                                  above sea level. We estimate the mean terrain elevation us-
in smoke heights, as well as to allow a better comparison

www.atmos-chem-phys.net/19/1685/2019/                                                                    Atmos. Chem. Phys., 19, 1685–1702, 2019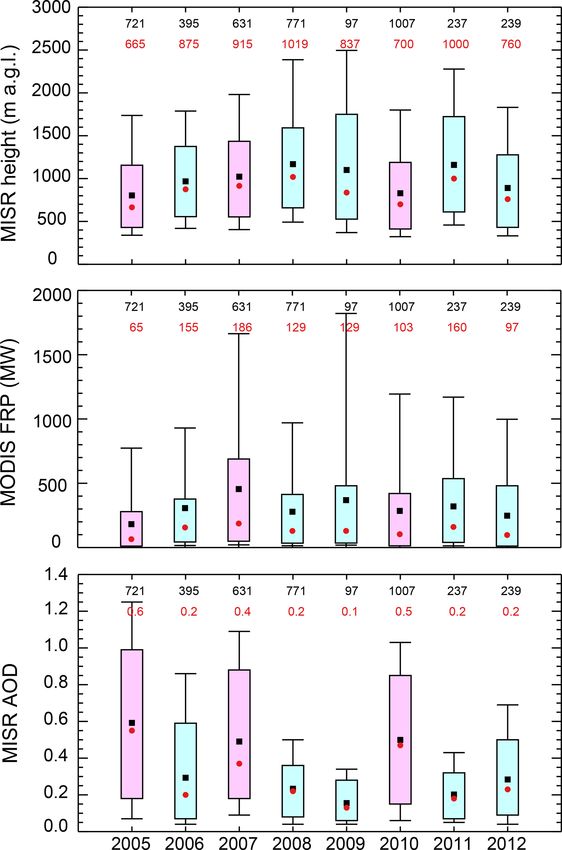
1690                                                           L. Gonzalez-Alonso et al.: Amazon biomass-burning smoke plumes

                                                                         et al. (2015) used 6 years of the CALIOP Level 2 vertical fea-
                                                                         ture mask (VFM) data and aerosol layer products over six re-
                                                                         gions to investigate the most probable height (MPH) of dust
                                                                         and smoke layers. They used two approaches to obtain MPH:
                                                                         one based on the probability distribution of the vertical pro-
                                                                         files of occurrence frequency (OF) (i.e. ratio of number of
                                                                         samples classified as dust or smoke by the VFM to the total
                                                                         samples per grid) and the other as the probability distribu-
                                                                         tion of the aerosol optical depth (AOD) vertical profiles. So
                                                                         MPH_OF and MPH_AOD correspond to the altitude with the
                                                                         largest OF and mid-visible AOD for a certain type of aerosol.
                                                                         Our definition of CALIOP median plume height is most sim-
                                                                         ilar to their MPH_AOD. However, Huang et al. (2015) anal-
                                                                         ysed vertical profiles over large-scale regions (e.g. the entire
                                                                         Amazon or Sahara), whereas in the current work, we anal-
                                                                         ysed and then aggregated the heights for individual smoke
                                                                         plumes.
Figure 1. Example of the approach followed for the CALIOP
                                                                            Our initial objective was to compare the CALIOP with
smoke plume characterisation. The map shows estimated smoke              the MISR plumes to assess the diurnal smoke evolution,
plume median heights (gridded at 0.5 × 0.5 horizontal resolution)        as CALIOP has a later sampling time than MISR over the
for 25 September 2010 at 06:25 UTC. MODIS active-fire pixels             Amazon (14:00–15:00 vs. 10:00–11:00 LT). However, de-
associated with the CALIOP smoke plumes are represented with             spite our effort to develop a comprehensive CALIOP cli-
open circles. The insert displays the vertical distribution of aerosol   matology, none of the CALIOP plumes coincide with the
extinction for a specific smoke plume in the map, with extinction        MISR plumes. As previous studies discuss (e.g. Kahn et al.,
values coloured by classified aerosol types. Dashed black line rep-      2008; Tosca et al., 2011), CALIOP and MISR, in addi-
resents the averaged extinction profile for the aerosols classified as   tion to having different sampling times, also have different
smoke (pink dots). In this profile, the CALIOP smoke plume has a         swath widths (380 km vs. 70 m). These differences make
median height of ∼ 2 km (green colour in the smoke plume median
                                                                         it difficult to observe the same fire on the same day, but
height scale) and a maximum height of 4.5 km above the terrain.
                                                                         they make CALIOP and MISR observations complemen-
                                                                         tary: MISR provides late-morning near-source constraints on
                                                                         aerosol plume vertical distribution, whereas CALIOP in gen-
ing terrain elevation from the CALIOP digital elevation map.             eral offers more regional constrains, later in the day (Kahn
Figure 1 shows an example of our approach for the CALIOP                 et al., 2008). Some differences between the products are thus
observation of 25 September 2010 at 06:25 UTC. For this ex-              expected.
ample, we identify a CALIOP smoke plume with 2 km me-
dian and 4.5 km maximum height above ground level. A total
of 2460 plumes are characterised with our approach over the              3     Results and discussion
Amazon for the months of July to November from 2006 to
2012; about 65 % of these plumes are linked to active fires              3.1    Smoke plume height observations
with some confidence (i.e. having a clear connection to a
MODIS fire pixel), and we only consider those in our analy-              Figure 2 maps the biomes of the Amazon region for which
sis, a total of 1600 plumes.                                             the MISR plume climatology was developed. Figure 3
   Previous studies used other CALIOP products to deter-                 presents the time series of the smoke plume heights for the
mine the vertical distribution of smoke plumes. The level 2              biomass-burning seasons (July–November) during the 2005–
aerosol layer product is commonly used to analyse smoke                  2012 study years. We also include a statistical summary of
plume heights from CALIOP, as it reports the top and base                the number of plumes within the time series by year, month,
heights of aerosol layers. Tosca et al. (2011) used their smoke          biome and drought conditions in Fig. S1 in the Supplement.
layer top altitudes and extinction coefficient profiles over             The largest number of plumes is recorded in 2010, with about
Borneo for September–October 2006. Using the CALIOP                      25 % of the total plumes in the database, whereas the smallest
Level 1 attenuated backscatter profiles at 532 nm, Amiridis              is in 2009 (3 %). These 2 years are the driest and the wettest
et al. (2010) estimated smoke injection heights from agricul-            in the climatology, respectively. Most of the plumes were
tural fires over Europe. They selected only those profiles of            observed in August and September (85 %), at the peak of
constant attenuated backscatter coefficient with height, with-           the burning season in most vegetated locations, in the domi-
out strong convection, and that were collocated with MODIS               nant biomes of savanna (48 %) and tropical forest (46 %), and
active-fire pixels from the Aqua satellite. Recently, Huang              during dry conditions (76 %). We find important interannual

Atmos. Chem. Phys., 19, 1685–1702, 2019                                                   www.atmos-chem-phys.net/19/1685/2019/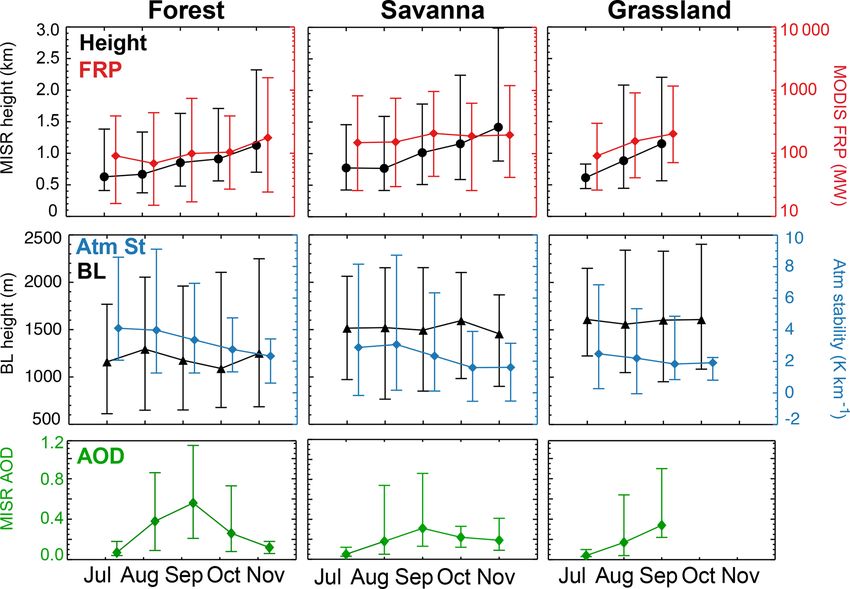
L. Gonzalez-Alonso et al.: Amazon biomass-burning smoke plumes                                                                                           1691

                                                                      Table 2. Statistical summary for main smoke plume parameters and
                                                                      atmospheric conditionsa . Atm stab is atmospheric stability.

                                                                                                     Tropical forest          Savanna          Grassland
                                                                        Median height (m)                 601 ± 339         743 ± 422         794 ± 471
                                                                        Max height (m)                    845 ± 499        1040 ± 585        1120 ± 653
                                                                        MODIS FRP (MW)                    209 ± 537         360 ± 658         421 ± 614
                                                                        AOD (unitless)                  0.51 ± 0.34        0.33 ± 0.28       0.35 ± 0.29
                                                                        Atm stab (K km−1 )               4.21 ± 2.97       3.16 ± 3.16       2.52 ± 2.50
                                                                        BL height (m)                    1270 ± 514        1490 ± 507        1620 ± 530
                                                                        Plumes in FT (%)b                      3–15              4–17              5–19
                                                                        Number                                 1744              2084                166
                                                                      a Reported the average ± SD and number of observations. b Reported range from more
                                                                      and less conservative definitions of plume in the FT (see text for explanation).

                                                                      2008; Val Martin et al., 2010). There are several factors that
                                                                      influence smoke altitudes and contribute to the differences
Figure 2. Locations of the MISR plumes analysed (black dots) over
                                                                      between biomes, such as fire intensity, availability of fuel,
the four main biomes considered in the study. The black square rep-
resents the Amazon domain.                                            combustion efficiency, atmospheric stability and entrainment
                                                                      (e.g. Lavoué et al., 2000; Trentmann et al., 2006; Luderer
                                                                      et al., 2006; Kahn et al., 2007, 2008; Val Martin et al., 2012).
                                                                      We assess some of these factors for our Amazon dataset next.
variability in the type of fires, with fires over tropical forest
dominant in 2005 (65 %) and 2010 (47 %), 2 of the 3 drought           3.2     Effect of atmospheric and fire conditions on smoke
years in our database as shown in Sect. 3.4 below and the                     plumes
majority of fires in savanna (54–65 %) for the other years.
We note that a large fraction of the plumes were observed in          We explore the relationship between smoke plume height,
2008 (17 %), even though it was not a drought year. The ma-           fire characteristics (i.e. MODIS FRP and AOD) and atmo-
jority of plumes in the 2008 record are digitised with blue-          spheric conditions derived in the vicinity of the fires through-
band retrievals (Table 1), which produce higher-quality re-           out the burning season, across the major biomes in the Ama-
sults in many situations, especially for optically thin plumes        zon except cropland. For atmospheric conditions, we focus
over land surfaces.                                                   both on how smoke plume height relates to boundary layer
   Throughout the study period, we find significant variabil-         height and on the effect of atmospheric stability on plume
ity in smoke plume height, with altitudes ranging from a              rise. We consider atmospheric stability conditions above our
few metres (essentially near-surface) to 5 km, depending on           fires as the average of the atmospheric stability over the at-
the biome (Fig. 3). Smoke plumes over cropland fires are              mospheric column (K km−1 ; Sect. 2.4) from the surface, at
scarce compared to the other fire types, as these fires are           the origin of the fire, to the maximum altitude that smoke
small and tend to be underdetected by MISR (Nelson et al.,            reached in the atmosphere. We add a buffer of 10 % to the
2013). We summarise the statistical parameters of the smoke           maximum altitude to account for any potential influence that
plumes for all observations except the cropland cases in Ta-          the atmosphere above the plume might have over the column.
ble 2. Over the Amazon, the vertical distribution of smoke            We include a summary of these main parameters in Table 2.
varies by biome. Statistically, the highest smoke altitudes              Consistent with previous studies (e.g. Val Martin et al.,
averaged by biome are detected over grasslands, with me-              2010, 2012; Sofiev et al., 2009; Amiridis et al., 2010), we
dian and maximum heights of 794 and 1120 m, respectively,             find that the highest-altitude smoke plumes tend to be associ-
whereas the lowest heights are detected over tropical forest          ated with highest MODIS FRP values, though there is signifi-
(601 and 845 m, respectively). In all the biomes, more than           cant variability in the relationship in all the biomes (r 2 = 0.2;
85 % of the smoke is located at altitudes below 2 km (Fig. S2         Fig. S3 in the Supplement). Smoke plumes detected over
in the Supplement).                                                   tropical forest fires have the lowest FRP (209 MW) and
   Similar altitudes and distributions have been found across         largest AOD values (0.51) (Table 2). The other two main
comparable fires in other parts of the world. For example, al-        biomes (savanna and grassland) have FRP and AOD values
titudes between 700 and 750 m were detected over the tropi-           similar to each other (360–421 MW and 0.33–0.35, respec-
cal forest in central America and Indonesia (Val Martin et al.,       tively). Tropical forest has deeper root systems, which al-
2010; Tosca et al., 2011). In contrast, smoke plume heights           low fires to access deeper soil layers (Nepstad et al., 2008)
over the Amazon are substantially lower than smoke plumes             that can maintain higher moisture content and lower oxygen
observed over the boreal biomes (960–1040 m) (Kahn et al.,            availability than other biomes, such as grasslands. High fuel

www.atmos-chem-phys.net/19/1685/2019/                                                         Atmos. Chem. Phys., 19, 1685–1702, 2019
1692 L. Gonzalez-Alonso et al.: Amazon biomass-burning smoke plumes Figure 3. Time series of the 2005–2012 MISR Amazon smoke-plume-height climatology, covering the July–November burning season for each year. Each blue dot represents the maximum smoke height above ground level (agl) for one plume. moisture content and low oxygen availability favour smoul- dering rather than flaming fires, which in turn tends to pro- duce greater smoke emission but lower radiant emissivity (Kauffman et al., 1995). Therefore, the low FRP and high AOD in tropical forest fires are consistent with these condi- tions, in which smouldering fires predominate, whereas high FRP and low AOD are typical with drier, less dense fuels, e.g. savanna and grassland, that tend to produce flaming fires (Giglio et al., 2006). In addition, high smoke opacity and tree canopy obscuring the fire-emitted 4-micron radiance as viewed by MODIS, as well as low radiant emissivity, rather than just low radiative total fire intensity, probably contribute to these differences (Kahn et al., 2008). Figure 4. Vertical distribution of MISR stereo-height retrievals for The atmospheric stability structure affects the vertical mo- all the plumes analysed, under strong (blue) and weak (red) atmo- tion of smoke and is a key factor in plume rise, either en- spheric stability conditions. hancing or suppressing the lifting. Some studies have shown the important role that atmospheric stability plays in plume rise (e.g. Kahn et al., 2007, 2008; Val Martin et al., 2010; vious observations that plumes under weak atmospheric con- Amiridis et al., 2010), and the quantitative representation of ditions tend to inject smoke to higher altitudes than those this factor still remains an open question in plume-rise model encountering strong stability, with maximum plume heights parameterisations. For instance, Val Martin et al. (2012) of 1150 and 654 m, respectively. A similar pattern is found showed that, in North America, fires that inject smoke to high for the median plume heights (821 and 482 m, respectively). altitudes tend to be associated with higher FRP and weaker Weak atmospheric stability conditions are also associated atmospheric stability conditions than those that inject smoke with deeper PBLs (∼ 1500 m) than strong stability condi- at low altitudes, in which smoke tends to be trapped within tions (∼ 1200 m) (not shown). the boundary layer. Similar results were found for agricul- Atmospheric conditions also correlate with biome type. tural fires over eastern Europe (Amiridis et al., 2010). We find that tropical forest fires tend to be associated with To analyse the influence of atmospheric stability over more stable atmospheric conditions than grassland fires (4.2 Amazon fires qualitatively, we divide our plume dataset into vs. 2.5 K km−1 ). Shallower PBLs are also observed over two groups that we define as having weak and strong at- tropical forest (1270 m) compared to grassland (1620 m). mospheric stability conditions based on MERRA-2 reanal- Tropical forests typically have higher relative humidity con- ysis. Over the Amazon, and at the locations and times stud- ditions and more constant temperatures than grasslands, ied, atmospheric stability ranges from −3 to 23 K km−1 . We which favours more stable conditions and lower PBL heights designate atmospheric stability < 2 K km−1 as “weak” and (Fisch et al., 2004). We note that our dataset was fully ac- atmospheric stability > 4 K km−1 as “strong”. Each group quired at Terra overpass time, which occurs between about contains about 30 % of plumes in the database. Figure 4 10:00–11:00 LT. This might produce a bias toward the more shows the vertical distribution of smoke stereo-height re- stable atmospheric conditions that occur preferentially dur- trievals for the plumes classified under weak and strong at- ing the morning; later in the afternoon convection tends to mospheric stability conditions. Our comparison supports pre- become more important (Itterly et al., 2016). Atmos. Chem. Phys., 19, 1685–1702, 2019 www.atmos-chem-phys.net/19/1685/2019/
L. Gonzalez-Alonso et al.: Amazon biomass-burning smoke plumes                                                             1693

3.3   Seasonality of smoke plumes heights                         although the few fires detected by MISR for those months
                                                                  were large and intense.
                                                                     Boundary layer heights and atmospheric stability condi-
Figure 5 shows the seasonal cycle of maximum plume height         tions may also vary by biome and throughout the season, in-
with FRP, AOD and atmospheric conditions over the major           fluencing plume-rise spatial and temporal distributions. On a
Amazon biomes. We further disaggregate these observations         seasonal basis, the PBL height does not follow a clear cycle
by biome, season and dry or wet years in Table S2 in the Sup-     in any of our biomes, but higher PBL heights are observed
plement. For these biomes, we find minimum plume heights          over grassland fires (Table 2) and across all the biomes dur-
of 600–750 m in July and maximum plume heights of 900–            ing dry years (Table S2). More stable atmospheric conditions
1400 m in October and November. Similarly, over tropical          are found at the beginning (3.6 K km−1 in July) compared to
forest and grassland, MODIS FRP values follow the plume-          the end of the burning season (1.9 K km−1 in November).
height patterns, with maximum values toward the end of the           Previous studies have shown that a substantial fraction of
burning season (180–200 MW) compared to the early season          smoke is injected above the boundary layer (i.e. into the
(90 MW). For savanna fires, MODIS FRP remains mostly              FT), although this fraction varies depending on biome and
constant throughout the season (∼ 150–200 MW). Savannas           fire type. For tropical fires over central America and Indone-
are known to be fire-adapted, and combustion efficiency typ-      sia, smoke from about 4–6 % of fires is reported to reach
ically remains constant throughout the season (Van der Werf       the FT (Val Martin et al., 2010; Tosca et al., 2011). This
et al., 2010). All these patterns are similar in wet and dry      fraction is larger for boreal fires (> 16 %), where fires are
years, although larger MODIS FRP values are observed over         more intense and the BL is typically lower than in tropi-
savanna and grassland fires in dry years (Table S2).              cal regions (Val Martin et al., 2010; Val Martin et al., 2018;
   Some previous studies show the seasonal peak in MODIS          Kahn et al., 2008). Following these studies, we consider that
FRP over the Amazon earlier, in August–September (Tang            smoke reaches the FT when the median height of the plume
and Arellano, 2017). However, their work relies on the max-       is at least 500 m above the PBL height. This is a conserva-
imum MODIS FRP detected by the Terra and Aqua satellites          tive definition that takes into account uncertainties in MINX
(4 times a day) over the Amazon, whereas our seasonality          and MERRA (e.g. Kahn et al., 2008; Val Martin et al., 2010;
shows the monthly median MODIS FRP observed by Terra,             Tosca et al., 2011). Because fires over the Amazon tend to
collocated with the MISR smoke plume observations (once a         be smaller in size than those in boreal forests, we also con-
day). In addition, the MISR swath is substantially narrower       sider a less conservative definition. We assume a plume is
than MODIS (380 vs. 2330 km), and many fires detected by          injected into the FT when the maximum plume height is at
MODIS are not observed by MISR. Our seasonality thus cap-         least 250 m above the PBL height. We understand that this
tures the fire intensity that drives the smoke plumes detected    is an upper limit, but it provides a bracket to our results. We
specifically by MISR, i.e. only at about 10:30 local time, and    include the percentage of the smoke plumes injected into the
the seasonal differences provide at least some indication of      FT for both definitions in Table 2, and present the season-
possible bias introduced by the MISR sampling of fires.           ality of these percentages in Fig. 6. Our analysis shows that
   In contrast to the seasonality of plume heights and fire in-   fires at the end of the burning season are more likely to in-
tensity, the peak monthly AOD occurs in September across          ject smoke in the FT, with 15 %–40 % in November vs. 2 %–
the major biomes, with a median AOD of 0.6 in tropical            10 % in July and 5 %–22 % at the peak of the burning sea-
forest and 0.3 in savanna and grasslands compared to AOD          son (August–September). This pattern seems to be related
values of 0.04–0.1 in July and November. Over the Ama-            to a combination of more intense fires and less stable atmo-
zon, total AOD correlates well with the number of fires,          spheric conditions. We find no influence of the monthly PBL
and both tend to peak during September each year (Mishra          depth variability, although deeper PBL heights are found
et al., 2015). Baars et al. (2012) reported optical depths in     across the Amazon in drier conditions (i.e. over grassland
the polluted biomass-burning season (July–November) to be         fires and/or dry years). Interestingly, our analysis also shows
6 times larger (on average) than in the pristine wet season       a slightly larger percentage of fires injecting smoke into the
(December–June), with highest values in September and Oc-         FT over grassland (5 %–19 %) compared to tropical forest
tober, for a site in the central Amazon near Manaus. In our       (3 %–15 %). As mentioned above, grassland fires are associ-
dataset, September, together with August, are the months in       ated with high PBL heights but also with large FRP values,
which the largest number of plumes were detected (Fig. S1         suggesting that these fires are energetic enough to produce
in the Supplement). However, our monthly statistics might         the buoyancy needed for the smoke to reach the FT.
be influenced by the number of observations in each month.
For example, the number of fires in August is driven by the       3.4   Interannual variability of smoke plumes and
year 2010, in which an unusually large number of fires were             drought conditions
observed compared to the other August months. In addition,
the large monthly median values in November are based on          We use MODIS DSI to assess the effect of drought conditions
the lowest number of plumes (Fig. S1 in the Supplement),          on smoke plume rise and the extent that these conditions con-

www.atmos-chem-phys.net/19/1685/2019/                                              Atmos. Chem. Phys., 19, 1685–1702, 2019
1694 L. Gonzalez-Alonso et al.: Amazon biomass-burning smoke plumes
Figure 5. Seasonal cycle of MISR smoke plume maximum height above the terrain (black circles), MODIS FRP (red diamonds), PBL heights
(black triangles), atmospheric stability (blue diamonds) and MISR AOD (green diamonds). Monthly median values are shown for tropical
forest, savanna and grassland biomes. Vertical bars indicate the 10th and 90th percentiles. Distributions with fewer than 10 observations are
omitted and all years are included.
Table 3. Summary of the main atmospheric parameters calculated
at the location of the plumes per yeara .
Year Number BL height Atm. Stab Percent in FTc
(m) (K km−1 )
2005b 927 1370 ± 546 4.32 ± 3.01 3–13
2006 513 1210 ± 518 3.50 ± 2.89 6–25
2007b 858 1380 ± 539 3.96 ± 3.30 3–18
2008 889 1480 ± 558 3.02 ± 2.28 4–23
2009 150 1100 ± 377 3.22 ± 2.60 4–27
2010b 1373 1550 ± 498 3.69 ± 3.53 2–7
2011 320 1150 ± 296 2.73 ± 2.38 8–28
2012 363 1330 ± 453 3.20 ± 3.29 4–13
Figure 6. Seasonal variation of Amazon plume injection above the
PBL (percent). Bar plots indicate the average of (median plume − a Reported the average ± SD. b Drought years. c Reported as percentage of plumes where
PBL height) > 0.5 km (dark grey) and (maximum plume − PBL (median plume − PBL height) > 0.5 km and maximum plume–BL height > 0.25 km (see
text for explanation).
height) > 0.25 km (light grey) (see text for explanation).
plumes in wet conditions, as discussed in Sect. 3.1. During
trol the interannual variability of smoke plumes across the re- drought years (2005, 2007 and 2010), smoke plumes regis-
gion. We present the interannual variability of MISR plume ter the lowest MODIS DSI annual averages values (−0.89,
heights, MODIS FRP and MISR AOD in Fig. 7, and sum- −0.91 and −1.50, respectively) compared to the other years
marise the annual averages of MODIS DSI, atmospheric sta- in the climatology (−0.63 to 0.18). Note that DSI is higher
bility, PBL height and percentage of smoke plumes in the in wetter years.
FT in Table 3. In addition, we include the annual relation- We find a significant positive relationship between MISR
ship of MISR plume heights, MODIS FRP and MISR AOD maximum plume heights and MODIS DSI (r = 0.7; p <
with MODIS DSI, and the percentage of plumes in the FT 0.01) in tropical forest and savanna fires, with higher
per drought level in Fig. 8. In our dataset, 76 % of plumes maximum plume heights in normal and/or wetter-than-
are recorded under extreme–mild drought conditions vs. 7 % normal (1000–1100 m) severe drought conditions (750–
Atmos. Chem. Phys., 19, 1685–1702, 2019 www.atmos-chem-phys.net/19/1685/2019/L. Gonzalez-Alonso et al.: Amazon biomass-burning smoke plumes 1695
some patterns when we subdivide the data by biome (Figs. 8
and S4 in the Supplement). For example, we find a signif-
icant positive relationship between MODIS FRP and DSI
(r = 0.6; p < 0.01) in tropical forest, with lower FRP in ex-
treme dry than normal–wet conditions (170 vs. ∼ 250 MW;
Fig. 8). Contrariwise, savanna and grassland fires have higher
FRP in extreme and mild dry than in wet conditions (∼ 500
vs. 250 MW), although the relationship is weak (r = −0.4;
p < 0.01). As mentioned above, interpretation of FRP can
be complicated by factors such as overlying smoke opacity
and fire emissivity (Kahn et al., 2008).
The relationship between smoke plume height, FRP and
drought conditions over the Amazon is somewhat complex.
Drought conditions over the Amazon increase fuel flamma-
bility and the number of fires, but do not necessarily increase
smoke elevation. Drought also decreases fuel load, i.e. fuel
available to burn, especially over grassland. Tang and Arel-
lano (2017) reported that drought in the Amazon favours
understory fires for tropical forest, which are dominated
by smouldering combustion and are linked to low-altitude
smoke plumes. In addition, spatial changes in drought lo-
cation can influence the type of biome affected and hence
the type of fire regime in a given year. For example, the
drought in 2005 was located at the north-eastern and cen-
tral regions, and the large majority of the plumes recorded
by MISR (65 %; Fig. S1) were from tropical forest fires, i.e.
related to smouldering and fires that inject smoke to lower
altitudes. In 2007, drought shifted to the south-eastern re-
gion, and the majority of the plumes (60 %; Fig. S1) were
from savanna and grassland fires associated with more flam-
ing burning conditions, i.e. higher FRP and smoke plume
Figure 7. Interannual variability of MISR maximum plume heights altitudes. Our analysis supports this observation. In 2005, a
above the terrain, MODIS FRP and MISR AOD, for the aggregate drought year, the smallest MODIS FRP (150 MW) and low-
of tropical forest, savanna and grassland. Bar plots indicate the dis-
est smoke plume heights (750 m) were recorded over tropical
tribution of the data for each year. The medians (red circles) and the
means (black squares) are shown along with the central 67 % (box)
forest (Fig. 8), whereas in 2007, another drought year, larger
and the central 90 % (thin black whiskers). The number of obser- FRP (500 and 750 MW) associated with higher smoke plume
vations (in black) and the median values (in red) included in each heights (1100 and 1300 m) was recorded over savanna and
distribution are given at the top of the plot. Drought years are in pink grassland fires, respectively.
and non-drought years are in light blue. The same data, stratified by In addition to the influence of drought in controlling the
biome type, are plotted in Fig. S4 in the Supplement. type of fires, drought can also affect atmospheric conditions.
We find that during drought years, PBL heights tend to be
about 200 m deeper than in wet years (Table 3). However,
900 m) (Fig. 8). Consistently, on an annual basis, these two on an annual basis, atmospheric stability does not vary sig-
biomes show the lowest smoke plume heights during dry nificantly, with values of ∼ 3–4 K km−1 , across the Amazon
years (Fig. S4 in the Supplement). Smoke plume heights in for the averaged biomass-burning season (Table 3). We also
grassland fires, however, do not show any strong relationship observe that a lower percentage of fires inject smoke plumes
with DSI (r = 0.1) or clear interannual variability driven by into the FT in drought compared to non-drought years (2 %–
droughts (Fig. S4). In general, lowest median smoke heights 18 % vs. 4 %–28 %; Table 3). On a biome basis, tropical
are observed in our dataset during the drought years of 2005 forest fires inject a larger percentage of smoke plumes into
and 2010 (Fig. 7), which are driven by tropical forest obser- the FT in wet than extreme–dry conditions (27 % vs. 12 %,
vations as it is the dominant biome (Fig. S1). Fig. 8), and shallower PBL heights may partially explain the
The relationship between MODIS FRP and drought levels larger percentage of MISR plumes detected in the FT during
over the Amazon is not straightforward on an annual basis as non-drought years. Contrariwise, grassland fires, although
we do not observe any clear interannual variability of FRP with fewer observations, inject more smoke plumes into the
driven by drought in Fig. 7. However, our analysis shows FT during extreme dry than wet conditions (25 % vs. 13 %,
www.atmos-chem-phys.net/19/1685/2019/ Atmos. Chem. Phys., 19, 1685–1702, 20191696 L. Gonzalez-Alonso et al.: Amazon biomass-burning smoke plumes
Figure 8. Relationship between MODIS DSI at the location of the plumes and MISR maximum plume height, MODIS FRP and MISR AOD
annually averaged, for tropical forest (green), savanna (blue) and grassland (red). Symbols represent the annual average and bars the standard
error of the mean. Regression lines are weighted by the number of plumes in each year; relationships with absolute r < 0.4 are plotted in
dashed lines. Also included is the percentage of smoke plumes in the FT in each biome and by drought condition. Bar plots indicate the
average of (median plume − PBL height) > 0.5 km (light colour) and (maximum plume − PBL height) > 0.25 km (dark colour), based on
MERRA-2 PBL heights (see text for explanation).
Fig. 8). These fires are associated with high FRP values in ment). Our results suggest that fires during drought periods
dry conditions and this extra fire energy may be enough to might significantly degrade regional air quality, as they are
produce the buoyancy needed to lift smoke directly into the associated with low smoke altitude and high aerosol loading.
FT, regardless of the PBL height. Note that in Fig. 8 (right
bottom), we present the data only subdivided by MODIS DSI 3.5 CALIOP smoke plume observations
and biome, regardless of the year, as in the rest of the panels
in Fig. 8. To further investigate smoke rise over the Amazon, we de-
Consistent with previous studies that have shown signif- velop a climatology of smoke plume heights using CALIOP
icant positive relationships between drought conditions and extinction profiles (Sect. 2.6). We identify a total of 1600
aerosol loading (e.g. Reddington et al., 2015; Tang and Arel- CALIOP smoke plumes linked to active fires from July to
lano, 2017), we find a significant relationship between MISR November 2006–2012 (Fig. S5 in the Supplement). Although
AOD and MODIS DSI on an annual basis in tropical forest the CALIOP climatology is one-third of the size of the MISR
and savanna fires (r = −0.7 and p < 0.01; Fig. 8). Years with climatology, these datasets agree well with respect to the
drier conditions have almost a factor of 3 greater AOD com- temporal and spatial distributions. Similarly to MISR, the
pared with years with wet conditions. Larger aerosol loading largest number of plumes correspond to the years 2007 and
in drought periods is likely due to increases in the number 2010 (22 % and 29 %), whereas the lowest records are in
and size of fires (e.g. Aragao et al., 2014) and subsequent in- 2009 and 2011 (4 % and 7 %). Most of the CALIOP plumes
creases in aerosol emissions. In addition, MISR AOD shows are also recorded at the peak of the biomass-burning sea-
significant interannual variability, with the largest AOD val- son (September; 51 %) and over savanna and tropical forest
ues recorded in 2005, 2007 and 2010 (0.4–0.6; Fig. 7), and in (37 % and 57 %, respectively) compared to grassland.
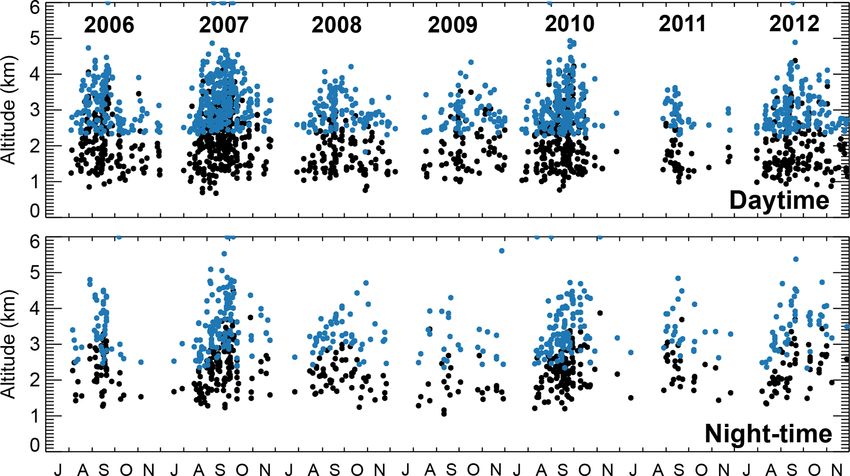
particular over tropical forest fires (0.6, Fig. S4 in the Supple- Figure 9 displays the time series of derived median and
maximum heights, for daytime and night-time observations.
Atmos. Chem. Phys., 19, 1685–1702, 2019 www.atmos-chem-phys.net/19/1685/2019/You can also read