West Belconnen Strategic Environmental Assessment - Air Quality Review - 2018 Update - ACT ...
←
→
Page content transcription
If your browser does not render page correctly, please read the page content below
Riverview Projects (ACT) Pty Limited
                                                      02-Feb-2018

West Belconnen Strategic
Environmental Assessment
Air Quality Review - 2018 Update

Revision 1 – 02-Feb-2018
Prepared for – Riverview Projects (ACT) Pty Limited – ABN: 165 870 539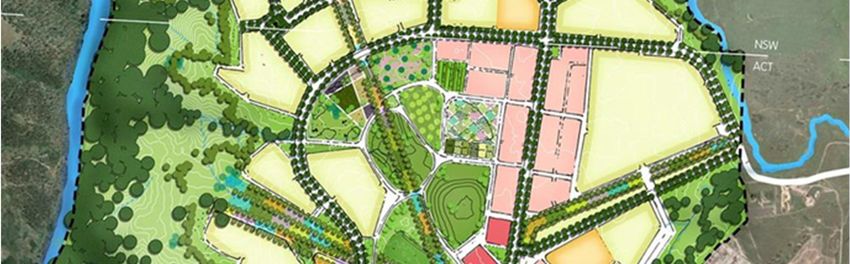
AECOM                                                  West Belconnen Strategic Environmental Assessment

West Belconnen Strategic Environmental Assessment
Air Quality Review - 2018 Update

Client: Riverview Projects (ACT) Pty Limited
          ABN: 165 870 539

Prepared by
AECOM Australia Pty Ltd
17 Warabrook Boulevard, Warabrook NSW 2304, PO Box 73, Hunter Region MC NSW 2310, Australia
T +61 2 4911 4900 F +61 2 4911 4999 www.aecom.com
ABN 20 093 846 925

02-Feb-2018

Job No.: 60339930

AECOM in Australia and New Zealand is certified to ISO9001, ISO14001 AS/NZS4801 and OHSAS18001.

© AECOM Australia Pty Ltd (AECOM). All rights reserved.

AECOM has prepared this document for the sole use of the Client and for a specific purpose, each as expressly stated in the document. No other
party should rely on this document without the prior written consent of AECOM. AECOM undertakes no duty, nor accepts any responsibility, to any
third party who may rely upon or use this document. This document has been prepared based on the Client’s description of its requirements and
AECOM’s experience, having regard to assumptions that AECOM can reasonably be expected to make in accordance with sound professional
principles. AECOM may also have relied upon information provided by the Client and other third parties to prepare this document, some of which
may not have been verified. Subject to the above conditions, this document may be transmitted, reproduced or disseminated only in its entirety.

Revision 1 – 02-Feb-2018
Prepared for – Riverview Projects (ACT) Pty Limited – ABN: 165 870 539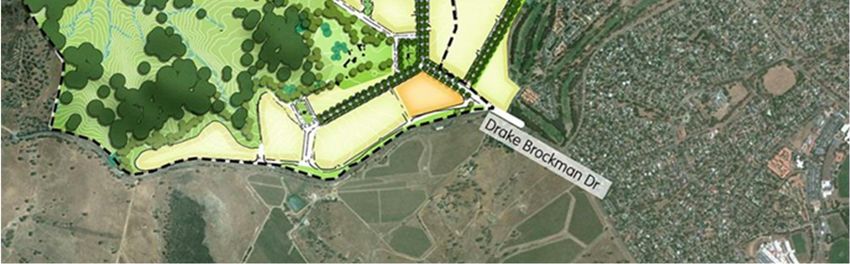
AECOM                                                 West Belconnen Strategic Environmental Assessment

Table of Contents
Executive Summary (2018 Update)                                                                             i
1.0      Introduction                                                                                      1
         1.1       Scope of Work                                                                           1
2.0      Background                                                                                        3
         2.1       Project Background                                                                      3
         2.2       Location and Regional Context                                                           3
         2.3       Site Description                                                                        5
                   2.3.1      Topography                                                                   5
                   2.3.2      Vegetation                                                                   7
                   2.3.3      Bushfire Risk                                                                7
         2.4       Project Staging                                                                         7
3.0      Legislation                                                                                      11
         3.1       National Environment Protection Measures                                               11
         3.2       Air Environment Protection Policy                                                      13
                   3.2.1      Transportation Activities                                                   13
                   3.2.2      Domestic, Social, Rural and Open Space Management Activities                13
         3.3       The Territory Plan                                                                     13
4.0      Climatic Conditions                                                                              15
         4.1       Long-term Climate Averages                                                             15
                   4.1.1      Wind Conditions                                                             16
                   4.1.2      Temperature                                                                 16
                   4.1.3      Rainfall                                                                    17
                   4.1.4      Relative Humidity                                                           17
         4.2       Project Area Microclimate                                                              17
                   4.2.1      Meteorology                                                                 17
                   4.2.2      Vegetation                                                                  23
                   4.2.3      Solar Access                                                                23
         4.3       Climate Change                                                                         23
5.0      Existing Air Quality                                                                             25
         5.1       Air Quality Monitoring                                                                 26
         5.2       Carbon Monoxide                                                                        27
         5.3       Nitrogen Dioxide                                                                       27
         5.4       Ozone                                                                                  27
         5.5       Particulate Matter (PM10 and PM2.5)                                                    28
6.0      Pollutant Sources                                                                                31
         6.1       Motor Vehicle Emissions                                                                31
         6.2       Wood Smoke                                                                             31
         6.3       Greenhouse Gas Emissions                                                               32
7.0      Mitigation Measures                                                                              33
         7.1       Motor Vehicles                                                                         33
         7.2       Wood Smoke                                                                             33
                   7.2.1      Existing ACT Programs on Wood Heaters                                       33
                   7.2.2      COAG National Plan for Clean Air                                            34
                   7.2.3      National Environment Protection Council Service Corporation -
                              Regulation Impact Statement                                                 34
                   7.2.4      Tuggeranong Valley Preliminary Assessment                                   35
                   7.2.5      Ambient Air Monitoring Review                                               36
                   7.2.6      Wood Heater Technology Standards                                            36
                   7.2.7      Australian Government Wood Heater Fuel Recommendations                      37
         7.3       Greenhouse Gas Emissions                                                               37
8.0      Conclusion                                                                                       39
9.0      References                                                                                       41
Appendix A
        NPI Data for Reporting Year 2011-12 & 2015-16                                                      A

Revision 1 – 02-Feb-2018
Prepared for – Riverview Projects (ACT) Pty Limited – ABN: 165 870 539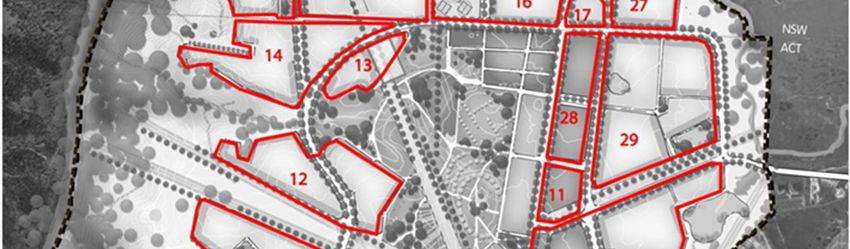
AECOM                                                 West Belconnen Strategic Environmental Assessment

Appendix B
        NEPCSC Regulation Impact Statement - Policy Actions and Policy Delivery Vehicles                  B

List of Tables
Table 1                   Air NEPM Air Quality Standards                                                  12
Table 2                   Air Toxics NEPM Air Quality Monitoring Investigation levels                     12
Table 3                   BoM Climate Averages - Canberra Airport (1939 – 2010)                           15
Table 4                   Ambient Air data for the Florey site from 2014 to 2016                          25

List of Figures
Figure 1                  West Belconnen Site Location                                                     4
Figure 2                  Google Earth’s image of the proposed development site                            5
Figure 3                  Wire Frame of Site Topography                                                    6
Figure 4                  Preliminary Staging Plan                                                         8
Figure 5                  Draft Master Planning                                                            9
Figure 6                  Canberra Airport Long-term Wind Roses                                           16
Figure 7                  Seasonal Microclimate Wind Roses for the West Belconnen Project Area            18
Figure 8                  Diurnal and Annual Microclimate Wind Roses for the West Belconnen Project
                          Area                                                                            19
Figure 9                  Frequency Distribution of Wind Speed                                            20
Figure 10                 Frequency Distribution of Stability Class                                       21
Figure 11                 Hourly Mixing Height                                                            22
Figure 12                 Diurnal Temperature Spread                                                      23
Figure 13                 Performance Monitoring Station Locations, Google copyright                      26

Revision 1 – 02-Feb-2018
Prepared for – Riverview Projects (ACT) Pty Limited – ABN: 165 870 539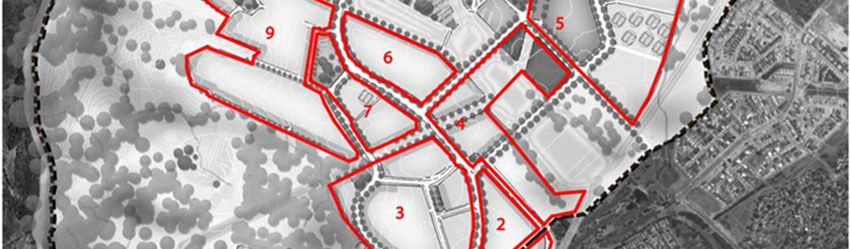
AECOM                                                 West Belconnen Strategic Environmental Assessment

                                                  This page has been left blank
                                                          intentionally.

Revision 1 – 02-Feb-2018
Prepared for – Riverview Projects (ACT) Pty Limited – ABN: 165 870 539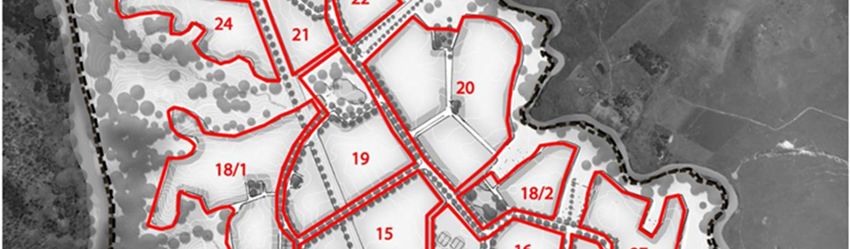
AECOM                                                 West Belconnen Strategic Environmental Assessment     i

Executive Summary (2018 Update)
This report is an update of the 2014 Air Quality Review (AQR) prepared as part of the West Belconnen
Strategic Environmental Assessment.
This update retains the relevant content of the 2014 AQR with additional subsections at the beginning
of each report section detailing, where relevant, updated data and information available since the
preparation of the 2014 AQR, also indicating which report subsections have required amendment.
Changes that have occurred since the preparation of the 2014 AQR are:
•     Updated information on air drainage flows in the Ginninderry region:
•     The ACT Environment Protection Act, commencing August 2019, requires wood heaters to have:
      -      A particulate emission factor not greater than 1.5 g/kg for an appliance without a catalytic
             combustor;
      -      A particulate emission factor not greater than 0.8 g/kg for an appliance with a catalytic
             combustor; and
      -      An overall average efficiency of not less than 60%.
•     A new air quality monitoring site has been established at Florey, only 5 kilometres east of the
      West Belconnen site, with monitoring commencing in February 2014. Available air quality data for
      the Florey site from 2014 to 2016 shows compliance with NEPM standards for carbon monoxide,
      ozone and oxides of nitrogen for all years. Particulate matter monitoring data shows only one
      exceedance of the NEPM 24 hour PM10 standard on 5 May 2015, due to a regional dust storm;
      and only one exceedance of the NEPM 24 hour PM 2.5 standard on 22 May 2016, due to smoke
      from hazard reduction burns, over the three year period from 2014 to 2016.
•     National Pollutant Inventory (NPI) data for the 2015-16 reporting year remains similar to data from
      the 2011-12 reporting year with no significant changes in reported data for both the ACT regional
      area and individual reporting facilities within the ACT.
This updated information has resulted in minor changes to the Conclusions contained in the 2014
AQR. These changes have been incorporated into the relevant sections of the Executive Summary as
amended below.

West Belconnen is a major area of future development for Canberra over the next 30 to 40
years. The proposed development involves the creation of new residential suburbs and their
associated community and commercial facilities, accommodating around 11,500 dwellings
and 30,000 people when fully developed. The purpose of this Air Quality Review (AQR) was
to assess the potential effects on air quality in the local area that might result from the
development and particularly the impact on the use of domestic wood burners on air quality.
This AQR reviewed the climate and geographic setting of the development area and
identified existing air quality issues in the Australian Capital Territory (ACT) region that might
affect the West Belconnen development and potential changes to air quality that the
development may cause. Additionally, mitigation measures were recommended to minimise
any potential adverse effects.
The development area consists of relatively flat lands for the majority of the site with only
moderate slopes on the western and southern borders. The development area and, more
specifically, the southern regions of the ACT are likely to experience significant temperature
inversions during cold, clear nights; the potential for pollution entrapment at ground level
increases under such conditions. Assessment of the air drainage flows in the local area have
concluded that wood smoke emissions originating in the proposed Ginninderry suburbs would
not impact upon adjacent Canberra suburbs under stable (nocturnal inversion) conditions (Air
Environment, 2017).

Revision 1 – 02-Feb-2018
Prepared for – Riverview Projects (ACT) Pty Limited – ABN: 165 870 539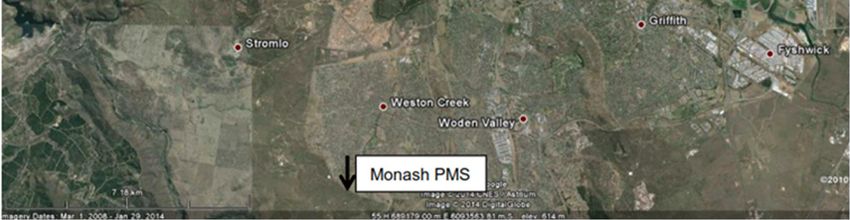
AECOM                                                 West Belconnen Strategic Environmental Assessment   ii

Recent (2014 to 2016) air monitoring data from the new Florey monitoring location verifies
that the air quality within the local area continues to be excellent with carbon monoxide,
nitrogen dioxide, ozone and PM10 levels around 25%, 35%, 60% and 60% of the ambient air
quality criteria respectively. Recorded PM2.5 levels, however, are at levels nearer to the
NEPM standards. The proposed development will affect air quality in the local area by
introducing additional pollution sources above those already present. The primary potential
pollution sources likely to affect air quality in the development area are bushfires (including
back-burning/hazard reduction activities), wood heaters and vehicles.
Following the release of the 2011 ACT Air Quality Report that identified breaches of the
particulate reporting standard, the Minister for Environment and Sustainable Development
announced the prohibition of wood heaters in the majority of the neighbouring Molonglo
Development. Similar considerations were suggested in a review of air quality issues in the
Molonglo Valley prepared by AECOM (2011).
The mitigation measures provided below should be considered for the West Belconnen
development together with continued government campaigns and regulation:
•     Wood heater efficiency and emissions standards compliant with the ACT Environment Protection
      Act;
•     Education on the use of wood heaters;
•     Controls on installation and 2nd-hand heaters;
•     Encouragement for the use of pellet heaters over standard wood heaters; and
•     Continuation of the ACT Government education and information programs such as the ‘Don’t
      Burn Tonight’ campaign.

Revision 1 – 02-Feb-2018
Prepared for – Riverview Projects (ACT) Pty Limited – ABN: 165 870 539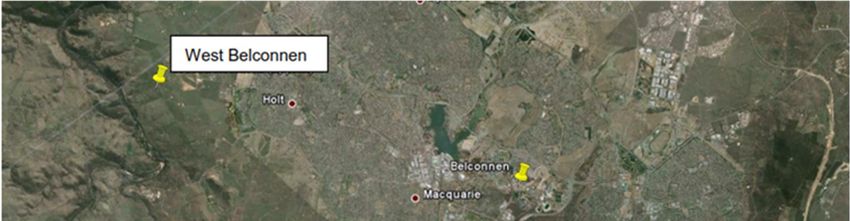
AECOM                                                 West Belconnen Strategic Environmental Assessment   1

1.0            Introduction
2018 Update
This section of the report did not require amendment.
The Australian Capital Territory (ACT) Government has identified the West Belconnen
development as a major area of future development for Canberra over the next 30 to 40
years, supporting approximately 11,500 dwellings and 30,000 people when fully developed.
The proposed development is to be staged over a number of years, resulting in the creation
of new residential suburbs, and will include community and commercial facilities such as
schools, shops, parks, green spaces and playgrounds in the West Belconnen area.
The ACT Government intends to implement best practice urban design, including the highest
standards in energy efficiency, water conservation, solar access and ecological
sustainability, to minimise the effects of the development on the natural environment.
Riverview Projects (ACT) Pty Ltd (Riverview) commissioned AECOM to review the potential
air quality impacts associated with the proposed development of the West Belconnen
development area. The key objectives of the Air Quality Review (AQR) were to:
•     Understand the climate of the West Belconnen development area;
•     Identify the current air quality risks for the West Belconnen development;
•     Identify impacts that development within the West Belconnen area may have on the local air
      quality; and
•     Recommend potential mitigation measures.

1.1            Scope of Work
The scope of work for the AQR was as follows:
•     Identification of the climate/geographic setting of the West Belconnen development by reviewing
      available existing meteorological and topographical data representative of the study area;
•     Identification of the current air quality issues for the West Belconnen development by reviewing
      available existing air quality data representative of the study area;
•     Identification of the effects that development within the West Belconnen development may have
      on the air quality of the area; and
•     Recommendation of potential mitigation measures during the operational phases of the
      development.

Revision 1 – 02-Feb-2018
Prepared for – Riverview Projects (ACT) Pty Limited – ABN: 165 870 539
AECOM West Belconnen Strategic Environmental Assessment 2
This page has been left blank
intentionally.
Revision 1 – 02-Feb-2018
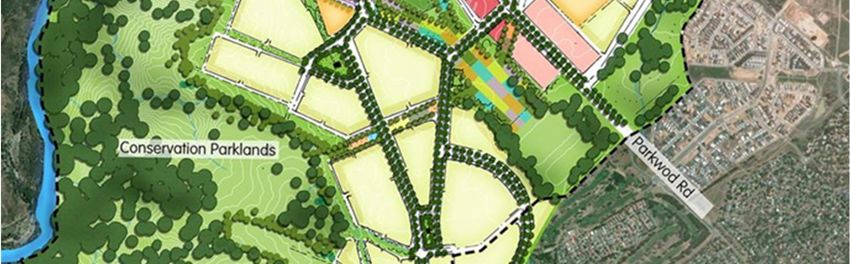
Prepared for – Riverview Projects (ACT) Pty Limited – ABN: 165 870 539AECOM West Belconnen Strategic Environmental Assessment 3 2.0 Background 2018 Update An updated air drainage flow study (Air Environment, 2017) has concluded that “wood smoke emissions originating in the proposed Ginninderry suburbs would not impact upon adjacent Canberra suburbs under stable (nocturnal inversion) conditions” with Section 2.3.1 below amended to reflect this updated information. 2.1 Project Background In 2004, the ACT Government released The Canberra Plan (CMD, 2004) to guide Canberra’s future growth and development. The Canberra Plan has three main components: The Canberra Spatial Plan, the Canberra Social Plan and the Canberra Economic White Paper. The aim of the strategic direction outlined in the Spatial Plan is to manage the change necessary to achieve sustainable urban growth that balances social, economic and environmental outcomes and fulfils the aspirations of the community. The West Belconnen development plan commenced under ACT Legislation in December 2008. This plan enabled urban development in parts of the West Belconnen development through the introduction of urban zones and a structure plan. It responds to the strategic direction provided by The Canberra Spatial Plan, which identified the West Belconnen development as Canberra’s next major urban area. 2.2 Location and Regional Context The proposed development is in an area covering around 1,600 hectares adjacent to the existing ACT suburbs of Holt and Macgregor and approximately 13 km northwest of the Canberra central business district as shown in Figure 1. The two main connections from the existing suburbs are from Parkwood Road and Drake Brockman Drive. The site is surrounded by undulating land particularly on the western edge of the development. The Murrumbidgee River runs from the south to the north through the valley on the west of the proposed development and the Ginninderra Creek runs on the east of the proposed site. The land has historically been used for rural purposes, and much of the area has been cleared. There is also an existing recycling facility which is located in the centre of the proposed development. Revision 1 – 02-Feb-2018 Prepared for – Riverview Projects (ACT) Pty Limited – ABN: 165 870 539
AECOM                                                 West Belconnen Strategic Environmental Assessment   4

Figure 1     West Belconnen Site Location

Revision 1 – 02-Feb-2018
Prepared for – Riverview Projects (ACT) Pty Limited – ABN: 165 870 539
AECOM                                                 West Belconnen Strategic Environmental Assessment   5

2.3            Site Description
The key site features are summarised in the following sections.
    2.3.1          Topography
The area of the valley consists of flat land interspersed with moderate slopes, the steepest of
which are located in the Murrumbidgee river gorge on the western border of the
development. A gully line on the border south of the development site also exists.
Elevations within the proposed development area range up to 560 metres above
sea level.
Figure 2 is a Google Earth image (accessed April 2014) of the proposed development site
showing the topography of the land. The image shows the depression to the west of the site
while the remainder of the land is relatively flat with some undulation. The development site
is delimited by the Murrumbidgee river gorge on the western side and a gully on the south
border.

Figure 2     Google Earth’s image of the proposed development site

Figure 3 shows two wire frames of the general topography, the first overlaid on an aerial
image and the second showing the terrains with a colour scale for the elevations in meters.
The terrain data was sourced from the Shuttle Radar Topography Mission (SRTM) ~90m
global data base. Again, the figure shows the valley to the western side of the development
area as the main topographical feature, while the development area is relatively flat with
some minor undulations. The bottom of the valley is approximately 420m, compared to the
general elevation of the development site of around 550m, resulting in a valley depth of
around 130m.
During winter months (when wood heaters are likely to be used), drainage flows tend to become
established at dusk and gradually strengthen overnight, being at their strongest in the hours before
dawn. Under drainage flow conditions such as this, wood heater emissions from virtually anywhere in
the Ginninderry region would be transported into the Murrumbidgee River valley, and out along the
valley axis to the north (Air Environment 2017).

Revision 1 – 02-Feb-2018
Prepared for – Riverview Projects (ACT) Pty Limited – ABN: 165 870 539
AECOM West Belconnen Strategic Environmental Assessment 6 Figure 3 Wire Frame of Site Topography Revision 1 – 02-Feb-2018 Prepared for – Riverview Projects (ACT) Pty Limited – ABN: 165 870 539
AECOM West Belconnen Strategic Environmental Assessment 7
2.3.2 Vegetation
As mentioned above, the site has been extensively cleared, largely as a consequence of
existing farming activities and the existing recycling facility centre. Existing vegetation
primarily consists of pasture land, with some pine plantations in the western areas. Lowland
woodlands and grasslands are also present.
2.3.3 Bushfire Risk
Bushfires are a known hazard in the ACT due to the dry summers and flammable vegetation.
Severe, damaging fires occur on a regular basis, generally every 6 – 27 years. The most
serious fires occurred in 2003, and affected the Molonglo and Mount Stromlo areas, just
south of the proposed development.
The risk of bushfires occurring is most prominent when strong winds from central Australia
are directed towards Canberra. The most dangerous wind direction for Canberra and its
surrounding regions (north-west) is also a common wind direction for the area (ACTPLA,
2007).
2.4 Project Staging
The Master Planning is still at an early phase in a draft form and the development stages
have not been finalised yet. It is expected, however, that land within the proposed
development will be released in a staged manner. A preliminary timing of development is
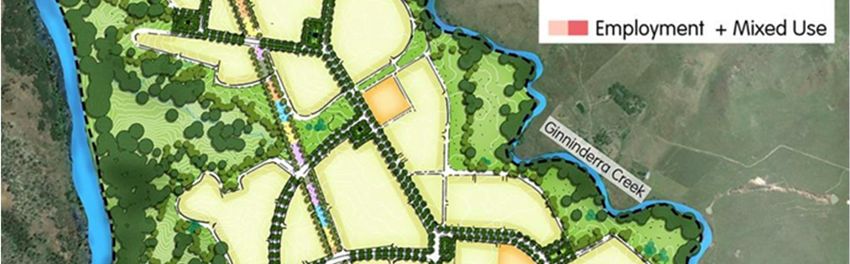
provided in Figure 4. Key site uses provided in Figure 5 below have been extracted from
the draft Master Planning available at the time of writing from
http://talkwestbelconnen.com.au/planning/evolving-draft-master-plan/.
Revision 1 – 02-Feb-2018
Prepared for – Riverview Projects (ACT) Pty Limited – ABN: 165 870 539AECOM West Belconnen Strategic Environmental Assessment 8 Figure 4 Preliminary Staging Plan Revision 1 – 02-Feb-2018 Prepared for – Riverview Projects (ACT) Pty Limited – ABN: 165 870 539
AECOM                                                 West Belconnen Strategic Environmental Assessment   9

Figure 5     Draft Master Planning

Revision 1 – 02-Feb-2018
Prepared for – Riverview Projects (ACT) Pty Limited – ABN: 165 870 539
AECOM                                                 West Belconnen Strategic Environmental Assessment   10

                                                  This page has been left blank
                                                          intentionally.

Revision 1 – 02-Feb-2018
Prepared for – Riverview Projects (ACT) Pty Limited – ABN: 165 870 539
AECOM West Belconnen Strategic Environmental Assessment 11
3.0 Legislation
2018 Update
In February 2016 the National Environment Protection Council amended the National Environment
Protection (Ambient Air Quality) Measure to include an annual PM 10 standard of 25 µg/m3, reduced the
number of 24 hour PM10 exceedances from five to zero and upgraded the PM 2.5 standards from
advisory. These changes have been updated in Table 1 below.
The ACT Environment Protection Act (Subdivision 15.1.2) was updated in August 2017 to include
specific offences in regard to Domestic solid fuel burning appliances requiring compliance with
Australian Standards AS/NZS 4012 and AS/NZS 4013.
Commencing August 2015, AS/NZS 4012 and 4013 require wood heaters to have:
• A particulate emission factor not greater than 2.5 g/kg for an appliance without a catalytic
combustor;
• A particulate emission factor not greater than 1.4 g/kg for an appliance with a catalytic combustor;
and
An overall average efficiency of not less than 55%
Commencing August 2019, AS/NZS 4012 and 4013 require wood heaters to have:
• A particulate emission factor not greater than 1.5 g/kg for an appliance without a catalytic
combustor;
• A particulate emission factor not greater than 0.8 g/kg for an appliance with a catalytic combustor;
and
• An overall average efficiency of not less than 60%.
3.1 National Environment Protection Measures
National Environment Protection Measures (NEPMs) are broad framework-setting statutory
instruments that outline agreed national objectives for protecting or managing particular
aspects of the environment. Air quality in the ACT is governed by the National Environment
Protection (Ambient Air Quality) Measure (the Air Quality NEPM) as amended (2003). This
NEPM provides guidance relating to air in the external environment, which does not include
air inside buildings or structures.
The Air Quality NEPM outlines monitoring, assessment and reporting procedures for the
following criteria pollutants:
- Carbon monoxide;
- Nitrogen dioxide;
- Sulfur dioxide;
- Particles as PM10 (particles with diameters less than or equal to 10 mm);
- Particles as PM2.5 (particles with diameters less than or equal to 2.5 mm);
- Photochemical oxidants (as ozone); and
- Lead.
The Air Quality NEPM standards apply to air quality experienced by the general population
within a region, and not to air quality in areas within the region affected by localised air
emissions, such as heavily trafficked streets. The goal of the Air Quality NEPM was to
achieve the standards with the allowable exceedances, as assessed in accordance with the
associated monitoring protocol, by 2008. The standards were set at a level intended to
adequately protect human health and well-being. The ambient air quality standards defined
in the Air NEPM are listed in Table 1.
Revision 1 – 02-Feb-2018
Prepared for – Riverview Projects (ACT) Pty Limited – ABN: 165 870 539AECOM West Belconnen Strategic Environmental Assessment 12
Table 1 Air NEPM Air Quality Standards
Pollutant Air NEPM Standard Averaging Period
Carbon monoxide 9.0 ppm 8 hour*
Nitrogen dioxide 0.12 ppm 1 hour*
0.03 ppm Annual
Sulfur dioxide 0.20 ppm 1 hour*
0.08 ppm 24 hour*
0.02 ppm Annual
3
PM10 50 µg/m 24 hour
3
25 µg/m Annual
3
PM2.5 25 µg/m 24 hour
3
8 µg/m Annual
Photochemical oxidants 0.10 ppm 1 hour*
(as ozone) 0.08 ppm 4 hour*
3
Lead 0.50 µg/m Annual
ppm: parts per million
3
µg/m : micrograms per cubic metre
* Not to be exceeded more than one day per year
In addition to the Air Quality NEPM, the National Environment Protection (Air Toxics) Measure (Air
Toxics NEPM) provides a framework for monitoring, assessing and reporting on ambient levels of air
toxics. The purpose of this NEPM is to collect information to facilitate the development of standards
for ambient air toxics.
The Air Toxics NEPM includes monitoring investigation levels for use in assessing the
significance of monitored levels of air toxics with respect to human health. The monitoring
investigation levels are levels of air pollution below which lifetime exposure, or exposure for
a given averaging time, does not constitute a significant health risk. If these limits are
exceeded in the short term, it does not mean that adverse health effects automatically
occur; rather some form of further investigation by the relevant jurisdiction of the cause of
the exceedance is required. The relevant monitoring investigation levels defined in the Air
Toxics NEPM are listed in Table 2.
Table 2 Air Toxics NEPM Air Quality Monitoring Investigation levels
Pollutant Air NEPM Standard Averaging Period
Benzene 0.003 ppm Annual
Formaldehyde 0.04 ppm 24 hours
Benzo(a)pyrene as a marker for 0.3 ng/m3 Annual
polycyclic aromatic
hydrocarbons (PAHs)
Toluene 1 ppm 24 hour
0.1 ppm Annual
Xylenes (as a total of ortho, 0.25 ppm 24 hour
meta and para isomers) 0.2 ppm Annual
ppm: parts per million
3
µg/m : micrograms per cubic metre
Revision 1 – 02-Feb-2018
Prepared for – Riverview Projects (ACT) Pty Limited – ABN: 165 870 539AECOM West Belconnen Strategic Environmental Assessment 13
3.2 Air Environment Protection Policy
The Air Environment Protection Policy 1999 (AEPP) was prepared by the Environment
Management Authority to manage air emissions in the ACT such that the air quality
standards in the Territory at least meet the NEPM standards. The AEPP provides guidance
to assist people to meet their environmental obligations, but is not legally binding, and does
not apply to motor vehicles operating on public streets, trains, or aircraft.
The major sources of air emissions in the ACT are transportation and fires from non-
industrial activities. The AEPP recommends different strategies to control emissions for
different types of activities, including:
• Restricting the purposes for which the activity may be undertaken;
• Requiring the activity to be undertaken in a particular way; and
• Requiring emissions from the activity to meet specified standards.
3.2.1 Transportation Activities
Emissions from motor vehicles are the major source of air pollution in the ACT. Urban
planning, vehicle design and emission controls, and fuel composition are the primary means
of mitigating the environmental impacts of their emissions.
Emissions from motor vehicles being driven on public streets are subject to the Motor
Traffic Act 1936 except when taking part in reliability trials or speed tests for which a permit
under the Motor Traffic Act has been issued. Vehicles covered by the Motor Traffic Act are
subject to random in-service testing. Where the Motor Traffic Act does not apply, emissions
from the vehicle are subject to the Environment Protection Act. Under these circumstances,
the vehicle must comply with the emission requirements of the Motor Traffic Act and the
general environmental duty.
Part IV of Schedule 2 of the Act includes provisions that regulate the composition and sale
of petrol.
3.2.2 Domestic, Social, Rural and Open Space Management Activities
The main air pollutants produced by these activities are smoke and fumes from fires, spray
and fumes from the use of chemicals, and dust. Of these, fires are the main source of air
emissions.
Outdoor fires are controlled both in the types of material that can be burned, when the fires
may be lit, and in the allowable emissions, which are dependent on the purpose for which
the fire was lit. Indoor fires are also restricted in the types of materials that can be burned
and the way in which the fires are managed. Synthetic substances, painted or chemically
treated woods, chemicals, unseasoned wood and wastes are not allowed to be burned,
except in incinerators that hold an environmental authorisation to do so.
Under Regulation 14, a person must take “such steps as are practicable and reasonable to
prevent or minimise the environmental harm caused, or likely to be caused, by the emission
of pollutants into the air from the fire.” These steps include managing the fire such that
excessive smoke is not produced.
3.3 The Territory Plan
The Territory Plan guides the planning and development of the ACT. It is used to: manage
development, particularly how land is used and what can be built; to assess development
applications; and to guide the development of new estate areas (future urban land) and
manage public land.
Revision 1 – 02-Feb-2018
Prepared for – Riverview Projects (ACT) Pty Limited – ABN: 165 870 539AECOM West Belconnen Strategic Environmental Assessment 14
This page has been left blank
intentionally.
Revision 1 – 02-Feb-2018
Prepared for – Riverview Projects (ACT) Pty Limited – ABN: 165 870 539AECOM West Belconnen Strategic Environmental Assessment 15
4.0 Climatic Conditions
2018 Update
This section of the report did not require amendment.
The term climate refers to long-term average weather patterns that are experienced in an area.
While substantial variation in weather conditions can occur between years, the climate of an area
remains relatively stable, with changes occurring on a gradual basis. Weather parameters
commonly used to define climate include temperature, rainfall, wind speed and humidity. The
following sections provide a summary of both the long-term trends for the regional area as well as
the microclimate specific to the development area.
4.1 Long-term Climate Averages
The Bureau of Meteorology (BoM) records long-term meteorological data at a number of
automatic weather stations across the country. The BoM station closest to the West Belconnen
development is located at the Canberra Airport (latitude 35.30°S, longitude 149.2°E, height 577
m), approximately 16 km east of the West Belconnen development. This monitoring station is
located on flat land between Canberra city and the Fairbairn Pine Plantation. The airport site is
comparatively flatter than the West Belconnen development, which, as described in Section
2.3.1, has undulating hills and valleys. As such, differences in wind patterns between the two
sites would be expected. As hills and valleys create wind turbulence, drainage flows/katabatic
winds not likely to be experienced on a flat plain, the wind conditions at Canberra Airport are not
considered likely to represent equivalent conditions at the development site. Other climate
parameters are, however, considered to be generally indicative of conditions at the site, such as
temperature and relative humidity.
Data recorded at Canberra Airport between 1939 and 2010 are summarised in Table 3. It should
be noted that the recent weather conditions experienced in the area do not greatly affect the
current climate averages (which are based on over 70 years of average weather data).
Table 3 BoM Climate Averages - Canberra Airport (1939 – 2010)
Statistics Jan Feb Mar Apr May Jun Jul Aug Sep Oct Nov Dec Annual
Average temperature (°C)
Maximum 28 27 25 20 16 12 11 13 16 19 23 26 19.7
Minimum 13 13 11 6.7 3.2 1 -0.1 1 3.3 6.1 8.8 11 6.5
Rainfall
Average rainfall (mm) 59 56 51 46 44 40 41 46 52 62 64 54 616.4
Decile 5 (median)
49 55 32 30 38 31 36 46 52 55 60 44 616.6
rainfall (mm)
Mean number of days
5.6 5.1 4.8 4.8 5.1 5.7 5.8 7 7 7.8 7.5 5.9 72.1
of rain ≥ 1 mm
Average 9 am conditions
Temperature (°C) 19 18 16 12 8 5 3.9 5.9 9.6 13 16 18 12.1
Relative humidity (%) 63 68 71 75 82 85 85 78 71 65 63 60 72
Wind speed (km/h) 7.5 6.4 6.1 6.5 6.9 7.8 8.5 9.9 10 11 9.8 9.1 8.3
Average 3 pm conditions
Temperature (°C) 27 26 23 19 15 11 11 12 15 18 21 25 18.5
Relative humidity (%) 37 40 42 46 54 60 58 52 49 47 41 37 47
Wind speed (km/h) 17 15 15 14 14 15 17 20 21 21 20 19 17.3
red = highest value blue = lowest value
Revision 1 – 02-Feb-2018
Prepared for – Riverview Projects (ACT) Pty Limited – ABN: 165 870 539AECOM West Belconnen Strategic Environmental Assessment 16
4.1.1 Wind Conditions
Wind roses are used to show the frequency of occurrence of winds by direction and strength.
Each wind rose arm represents a wind blowing from the direction it is projected i.e. arm
pointing up represents northerly winds. The length of the bar represents the frequency of
occurrence of winds from that direction, and wind speed categories are defined by different
colours.
The Canberra Airport long-term wind roses for 9 am and 3 pm data are provided in Figure 6.
The data was measured from March 1939 to September 2010 and represents the closest
long-term monitoring station to the development.
The areas wind patterns are generally dominated by winds from the northwest in both the
morning and afternoon, with calm winds more prevalent in the morning with 42% calms
compared to 9% in the afternoon. Table 3 shows that the 9am average wind speed is 8.3
km/h (2.3 m/s) compared to the higher 3pm average of 17.3 km/h (4.8 m/s). These data
support the high calm conditions in the morning. The table also shows that higher winds are
expected in the spring time with the lowest winds in the autumn time. The wind pattern
suggests that dispersion would generally be at its worst during the early hours of autumn and
best in the later hours of spring.
Canberra Airport BoM 1939-2010 9 am Canberra Airport BoM 1939-2010 3 pm
Figure 6 Canberra Airport Long-term Wind Roses
4.1.2 Temperature
The BoM reported that the average maximum temperature at Canberra Airport during 2013
was 21.7 °C, 2.0 °C above the historical average. This is the second-warmest year on record
for Canberra, following 21.8 °C in 2006. Every month during 2013 recorded above-average
daytime temperatures. January, July and September all broke their long-term monthly
records, and winter was the equal-warmest on record.
The particularly warm temperatures during the cool season were reflected in a lack of cold
days for the year: only four days dropped to 10 °C or lower (long-term average was 19 days),
the fewest on record for Canberra. Temperatures reached at least 30 °C on 47 days (long-
term average was 32 days), including the second-hottest day on record for Canberra with
42.0 °C on 18 January.
The average minimum temperature at Canberra Airport during 2013 was 6.2 °C, 0.3 °C
below the historical average. There were 52 nights below 0 °C during the year, slightly below
the historical average of 60 days, but only two nights dropped below -5 °C (average 7 nights).
Revision 1 – 02-Feb-2018
Prepared for – Riverview Projects (ACT) Pty Limited – ABN: 165 870 539AECOM West Belconnen Strategic Environmental Assessment 17
Night-time temperatures were well below average during both autumn and spring, but above
average during winter. October and November were both more than 2 °C below normal, with
several severe frosts causing widespread agricultural damage during October.
The very warm daytime temperatures but the only slightly cool nights meant the mean
temperature for Canberra Airport was 14.0 °C, 0.9 °C above the historical average.
4.1.3 Rainfall
The highest rainfall occurs in spring with an average rainfall of 64mm in November, while the
lowest rainfall occurs during winter with 40mm and 41mm in June and July respectively. The
greatest rain frequency was found in spring and the lowest rain frequency in autumn.
4.1.4 Relative Humidity
Relative humidity is a measure of how much moisture is in the air, and varies throughout the
day. The highest relative humidity occurs in winter while the lowest is in summer. Humidity
levels at 9 am are higher than at 3 pm.
4.2 Project Area Microclimate
The term microclimate refers to a local atmospheric zone where the weather conditions may
differ from that of the surrounding regional area. The term is typically applied to a relatively
small area, within a few metres of the Earth’s surface.
Microclimates are affected by a number of factors including: latitude; soil type; the presence of
(or proximity to) water bodies such as oceans, lakes and rivers; the slope or aspect of the
area; vegetation coverage; and land use aspects, such as the presence of buildings and
asphalt. Without detailed, site-specific data available, the microclimate of the West Belconnen
development area is difficult to determine. As such, only general comments regarding the
current microclimate and the potential changes resulting from the proposed development are
discussed below.
4.2.1 Meteorology
As no meteorological monitoring is undertaken in the West Belconnen development or
adjacent areas, actual meteorological conditions in the valley are not known. The CSIRO has,
however, developed a computer model (The Air Pollution model, or TAPM) that can be used
to predict meteorological conditions in any area of Australia based on its extensive databases
containing synoptic weather data, topography, and land use information (among other
factors). TAPM predicts three-dimensional meteorology, including terrain-induced
circulations. TAPM is a PC-based interface that is connected to databases of terrain,
vegetation and soil type, leaf area index, sea-surface temperature, and synoptic-scale
meteorological analyses for various regions around the world. TAPM is commonly used for
environmental impact assessments where on-site meteorological stations are not present,
such as this development, and its use is prescribed in the NSW EPA Approved Methods for
the Modelling and Assessment of Air Pollutants in NSW (DEC 2005).
TAPM was run for the 2012 calendar year to estimate meteorological conditions at the site
(the most recent calendar year available at the start of the report preparation). The resultant
microclimate data are summarised in the following sections.
4.2.1.1 Wind Conditions
Wind roses from the 2012 TAPM development area data are presented for the seasonal
averages in Figure 7 and for the 9am, 3pm and annual averages in Figure 8.
The vector average winds in the development area blow from the north-eastern quadrant with
higher winds present from the south-eastern quadrant, although there is substantial seasonal
variation according to time of day. Light winds tend to blow from the northeast in the
morning, while stronger winds blow from the northwest in the afternoon. Seasonally there is
some apparent variation in wind direction, with winds generally blowing from the northeast
quadrant for all months, with summer, autumn and spring showing stronger winds from the
Revision 1 – 02-Feb-2018
Prepared for – Riverview Projects (ACT) Pty Limited – ABN: 165 870 539AECOM West Belconnen Strategic Environmental Assessment 18 southeast while winter shows stronger winds from the northwest. Winter and spring tend to have a wider pattern of data compared to other months. The frequency distribution of the predicted winds is presented in Figure 9. The average wind speed for the area is 3.6 m/s. Approximately half the wind speeds are between 4 – 6 m/s. The highest calm wind (
AECOM                                                 West Belconnen Strategic Environmental Assessment     19

                           9 am 2012                                                            3 pm 2012

                                                            Full year 2012

Figure 8     Diurnal and Annual Microclimate Wind Roses for the West Belconnen Project Area

Revision 1 – 02-Feb-2018
Prepared for – Riverview Projects (ACT) Pty Limited – ABN: 165 870 539
AECOM West Belconnen Strategic Environmental Assessment 20 Figure 9 Frequency Distribution of Wind Speed 4.2.1.2 Stability Class An important aspect of pollutant dispersion is the atmospheric turbulence level in the region of the pollution plume (near the ground in this case). Turbulence acts to increase the cross- sectional area of the plume due to random motions, thus diluting or diffusing a plume. Atmospheric stability categories are used in conjunction with other meteorological data to describe atmospheric conditions and thus dispersion. The most well-known stability classification is the Pasquill-Gifford scheme, which denotes stability classes from A to F. Class A is described as highly unstable and occurs in association with strong surface heating and light winds, leading to intense convective turbulence and much enhanced plume dilution. At the other extreme, class F denotes very stable conditions associated with strong temperature inversions and light winds, which commonly occur under clear skies at night and in the early morning. Under these conditions, plumes can remain relatively undiluted for considerable distances downwind. Intermediate stability classes grade through moderately unstable (B), slightly unstable (C), neutral (D) to slightly stable (E). Whilst classes A and F are strongly associated with clear skies, class D is linked to windy and/or cloudy weather, and short periods around sunset and sunrise when surface heating or cooling is small. As a general rule, unstable (or convective) conditions dominate during the daytime and stable flows are dominant at night. This diurnal pattern is most pronounced when there is relatively little cloud cover and light to moderate winds. The frequency distribution of estimated stability classes in the 2012 TAPM data for the project area is provided in Figure 10. The data show a higher trend towards neutral and stable wind classes. The breakdown of classes was 13% for A and B (unstable), 47% for C and D (neutral) and 40% for E and F (stable) class, which is consistent with the pattern expected for an inland location in a valley setting. Together, the high likelihood of stable and neutral classes indicates a high likelihood for pollution released within the area to have limited dispersion. Revision 1 – 02-Feb-2018 Prepared for – Riverview Projects (ACT) Pty Limited – ABN: 165 870 539
AECOM                                                 West Belconnen Strategic Environmental Assessment   21

Figure 10 Frequency Distribution of Stability Class

4.2.1.3        Mixing Height
Mixing height is the depth of the atmospheric surface layer beneath an elevated temperature
inversion and is an important parameter within air pollution meteorology. The mixing height
defines the height above the earth’s surface where the mixing of air occurs. Vertical
diffusion or mixing of a plume is generally considered to be limited by the mixing height, as
the air above this layer tends to be stable, with restricted vertical motions. High mixing
heights are therefore associated with the greatest pollutant dispersion. Low mixing heights
mean there is less air for pollutants to be dispersed within, leading to greater pollutant
concentrations at ground level.
The predicted mixing heights for 2012 for the project area are provided in Figure 11, and are
likely to be representative of the surrounding area as mixing height is a phenomenon that
would affect the local air shed as a whole. Diurnal variation is seen in mixing heights, with
the maximum heights seen in the early afternoon and minimum mixing heights occurring
during the early morning. As with most developed valleys in ACT, average mixing heights in
the West Belconnen development are relatively low, with an average maximum of around
1,000 m and an average minimum of around 250 m, although the predicted maximum was
around 3,500m. Again, this may lead to higher pollutant concentrations at ground level if
pollutants are present in the air shed and specifically if pollution sources are active at night-
time. This is particularly relevant to sources such as residential wood heaters and constant
industrial emissions.

Revision 1 – 02-Feb-2018
Prepared for – Riverview Projects (ACT) Pty Limited – ABN: 165 870 539
AECOM                                                 West Belconnen Strategic Environmental Assessment   22

Figure 11 Hourly Mixing Height

4.2.1.4        Temperature
Under normal atmospheric conditions, air temperature decreases with increasing height. Under a
temperature inversion, this pattern is reversed such that the ground is rapidly cooled, making the air
close to the ground cooler than the air above it. Cold air is denser than warm air, so the cold air tends
to flow downhill (known as cold air drainage or katabatic winds), and pools in frost hollows (low
topographic areas). Pollution within the cold air drainage flow can become trapped and accumulate
below the inversion layer, resulting in high pollutant concentrations.
As temperature inversions commonly occur during winter, on still nights, air quality issues are
exacerbated at these times, as these are the conditions during which domestic heating is likely to be
employed. Particulates emitted from wood heaters are a major concern. As the meteorological
conditions cannot be controlled, management of air quality associated with these conditions must be
addressed through control of night-time pollutant emissions should temperature inversions be likely.
As previously discussed, the gorge to the west of the development area presents the potential for
ground-level pollution relating to cold air drainage flow during temperature inversions to flow down the
valley and into the central and southern regions of the ACT. This issue is likely heightened by the
north-easterly vector wind direction trend shown in the winter wind rose in Figure 7 and the annual
wind rose in Figure 8 that would push the air from the development towards the western gorge and
further down into the ACT. This is specifically relevant to the use of wood heaters during still winter
nights. The long-term regional data also shows a high level of calm wind conditions associated with
cold air drainage.
Figure 12 presents the predicted average hourly temperatures for 2012. The graph shows the
expected diurnal variation in temperature, where the highest temperatures are found during the
afternoon, and the lowest temperatures occur in the early morning.

Revision 1 – 02-Feb-2018
Prepared for – Riverview Projects (ACT) Pty Limited – ABN: 165 870 539
AECOM                                                 West Belconnen Strategic Environmental Assessment   23

Figure 12 Diurnal Temperature Spread

    4.2.2          Vegetation
Vegetation absorbs both light and heat. The proposed development site has been
extensively cleared, with much of the area now consisting of grassland and remnant trees.
The proposed development would involve further clearing to remove much of the current
vegetation in many areas, and replacing it with buildings and asphalt roads, which radiate
heat back into the air. As such, the temperature close to the ground in the area is likely to
increase as a result of the proposed development. Adverse temperature increases can
potentially be mitigated through the extensive installation of solar collection devices, which
would absorb sunlight and generate useful electricity. Maximising green space in the
development plan can also help mitigate any potential impacts. The current draft Master Plan
includes for such green spaces in the form of parks, ponds and wetlands which should be
retained to mitigate some of this ground floor temperature’s increase.
    4.2.3          Solar Access
The north-facing slopes within the area are exposed to more direct sunlight than the south-
facing slopes and, as such, are warmer for longer. The degree to which this occurs depends
on the exact orientation of the slopes.

4.3            Climate Change
The average global temperature has increased by 0.6° C over the past century. In Australia,
an increase of around 0.7° C has been documented, and further increases of between 1 - 6 °
C are predicted to occur by 2070. Rainfall events are expected to decrease in frequency but
become more intense, resulting in greater flooding (ACTPLA, 2007).
Climate change is likely to affect the ACT, including the West Belconnen development, in a
number of ways. Temperatures in the area are expected to increase over the coming
decades, resulting in a greater number of hot days and fewer cold nights (ACT Government,
2007). This may result in additional energy requirements during the warmer months to power
air conditioning, but may also result in lower demand for heating during winter. The higher
temperatures may also result in decreased water availability due to increased evaporation,
particularly as the total annual rainfall is not expected to dramatically change. Conversely,
however, evaporation may decrease as a result of global dimming, which refers to a
reduction of solar energy reaching the surface due to higher pollution levels in the
atmosphere reflecting the energy back into space (ACTPLA, 2007).

Revision 1 – 02-Feb-2018
Prepared for – Riverview Projects (ACT) Pty Limited – ABN: 165 870 539
AECOM West Belconnen Strategic Environmental Assessment 24 A change in the distribution of rain events is, however, anticipated – summer and autumn are predicted to become wetter, while winter and spring are expected to become drier. More intense storm events are also expected to occur, and droughts are predicted to become both more severe and more frequent, particularly in winter and spring (ACT Government, 2007). Average wind speeds are predicted to increase in summer months in the ACT (ACT Government, 2007). The risk of fires is also predicted to increase, with the number of days classified as having very high or extreme fire danger potentially increasing by 13 – 26 % (ACT Government, 2007). At this stage it is still very difficult to predict the impact that climate change may have on the development. As climate change is an issue that affects large scale areas, such as whole states or countries, climate change legislation is generally driven by federal government approaches and, as such, no specific issues or measures have been discussed in this report. Revision 1 – 02-Feb-2018 Prepared for – Riverview Projects (ACT) Pty Limited – ABN: 165 870 539
AECOM                                                   West Belconnen Strategic Environmental Assessment                    25

5.0            Existing Air Quality
2018 Update
The ACT Government established a new ambient air monitoring station at Florey which commenced
operation in late February 2014. This new monitor is located approximately 5 kilometres east of the
West Belconnen site, much closer than the previous monitoring locations at Civic (located
approximately 15 kilometres to the south east) and Monash (located approximately 25 km to the
south). Figure 13 below has been updated to show location of the Florey monitoring site.
The Air Quality update for this review will therefore focus on the reported monitoring data for the
Florey site. Table 4 lists the ambient air monitoring data for the Florey site for the calendar years 2014
to 2016 inclusive.
Table 4      Ambient Air data for the Florey site from 2014 to 2016

                                        Air NEPM                Averaging
Pollutant                                                                             2014             2015         2016
                                        Standard                 Period
Carbon monoxide                          9.0 ppm                 8 hour*               2.2              2.0          1.9
                                                                                              1                 1
Nitrogen dioxide                        0.12 ppm                  1 hour*            0.045            0.033         0.0341
                                        0.03 ppm                  Annual             0.006            0.005         0.005
                                                3
PM10                                    50 µg/m                   24 hour             30.2             70.8          28.8
                                        25 µg/m3                  Annual                -                -           10.7
                                    Number of 24 hour exceedances                        0                  1         0
                                                    3
PM2.5                                    25 µg/m                  24 hour              22.8            24.3         27.2
                                                3
                                         8 µg/m                   Annual               5.9             6.5          7.0
                                    Number of 24 hour exceedances                        0                  0         1
                                                                                              1                 1
Photochemical oxidants                  0.10 ppm                  1 hour*            0.074            0.040         0.0501
(as ozone)                              0.08 ppm                  4 hour*            0.0402           0.0372        0.0502
ppm: parts per million
     3
µg/m : micrograms per cubic metre
* Not to be exceeded more than one day per year
1
  Maximum daily 1 hour average
2
  Maximum daily 4 hour average

Ambient air quality has been within NEPM standards for all pollutants except:
•     A single PM10 24 hour average of 70.8 µg/m3 in 2015, on 5 May, due to a regional dust storm; and
•     A single PM2.5 24 hour average of 27.2 µg/m 3 in 2016, on 22 May, due to smoke from hazard
      reduction burns.
The following subsections have been amended to reflect the air quality data from the Florey site.
Air quality in the ACT is considered to be excellent, particularly in relation to other Australian
capital cities, mainly because the area has no heavy industry (ACT Government 2013). The
primary sources of air pollution in the ACT are motor vehicles, wood smoke, and
bushfires/dust storms. Other sources as gained from a review of the National Pollutant
Inventory (NPI) database for reporting years 2011-12 and 2015-16 for the regional area
include landfills, agriculture, asphalt plants, quarries, hospitals, aviation, sewerage treatment
plants and pipelines, and power stations. The full list of the NPI data sorted by facility and by
substance is provided in Appendix A.
Temperature inversions during winter are often associated with excessive particulate levels in
some areas, particularly developed valley areas. High particulate levels also occur in
summer due to bushfires.

Revision 1 – 02-Feb-2018
Prepared for – Riverview Projects (ACT) Pty Limited – ABN: 165 870 539
AECOM West Belconnen Strategic Environmental Assessment 26
5.1 Air Quality Monitoring
ACT Health operates an ambient air quality network on behalf of the ACT Government,
consisting of three monitoring stations. One station is located at Florey, approximately 5
kilometres east of the West Belconnen site, much closer than the other two monitoring
locations at Civic (located approximately 15 kilometres to the south east) and Monash
(located approximately 25 km to the south). Station locations are shown in Figure 13.
Florey PMS
Figure 13 Performance Monitoring Station Locations, Google copyright
Continuous monitoring of carbon monoxide, nitrogen dioxide, particulate matter (PM 10 and
PM2.5) and ozone is undertaken at the Florey monitoring station.
The most recent (2016) Air Quality report published by the ACT Environment Protection
Authority (EPA) (EPA, 2017) states:
“Monitoring results in 2016 demonstrate that Canberra’s air quality is generally excellent, with
no exceedances of the AAQ NEPM standards for carbon monoxide, nitrogen dioxide, and
particles as PM10.The major impacts on Canberra’s air quality in 2016 came from the
accumulation of combustion particles from hazard reduction burns and wood heaters”.
The following sections summarise the data presented in the 2014, 2015 and 2016 ACT Air
Quality Reports for the Florey location.
This section provides a summary of the data only, with more detailed discussion of pollutant
sources provided in Section 6.0 and mitigation measures provided in Section 7.0.
Revision 1 – 02-Feb-2018
Prepared for – Riverview Projects (ACT) Pty Limited – ABN: 165 870 539AECOM West Belconnen Strategic Environmental Assessment 27 5.2 Carbon Monoxide Carbon monoxide (CO) is a colourless, odourless gas produced by the incomplete combustion of fuels containing carbon (e.g. oil, gas, coal and wood). Carbon monoxide is absorbed through the lungs of humans, where it reacts to reduce the blood’s oxygen-carrying capacity. In urban areas, motor vehicles account for up to 90 % of all CO emissions. Historically, no exceedances of the 8-hour NEPM standard for carbon monoxide have occurred since 1999 at the Civic and Monash monitoring locations. Recent maximum concentrations at Florey continue this trend, ranging from 1.9 ppm in 2016 to 2.2 in 2014, approximately 25% of the standard. Wood heating is considered to be the main source of carbon monoxide emissions (ACT Government, 2008), and explains the seasonal concentration pattern, with peak concentrations occurring in winter (highest measurement for 2012 was in June). Should wood burning heaters be permitted in the proposed development, an increase in local carbon monoxide concentrations would be expected, however, the Canberra air shed has the capacity to accommodate a substantial increase in carbon monoxide levels without exceeding the NEPM standard 5.3 Nitrogen Dioxide Nitrogen dioxide (NO2) is a brownish gas with a pungent odour. It exists in the atmosphere in equilibrium with nitric oxide. The mixture of these two gases is commonly referred to as nitrogen oxides (NOx). Nitrogen oxides are a product of combustion processes. In urban areas, motor vehicles and industrial combustion processes are the major sources of ambient nitrogen oxides. Nitrogen dioxide can cause damage to the human respiratory tract, increasing a person’s susceptibility to respiratory infections and asthma. Sensitive populations, such as the elderly, children, and people with existing health conditions are most susceptible to the adverse effects of nitrogen dioxide exposure. Nitrogen dioxide can also cause damage to plants, especially in the present of other pollutants such as ozone and sulphur dioxide. Nitrogen oxides are also primary ingredients in the reactions that lead to photochemical smog formation. Data from the recently established Florey site shows that nitrogen dioxide levels in the local area are well below the NEPM standards with maximum hourly levels ranging from 0.045 ppm (38% of the standard) in 2014 to 0.033 ppm (28% of the standard) in 2015 and annual average levels 0.006 to 0.005, 20% and 17% of the NEPM standard respectively. An increase in motor vehicles during the construction and operational phases of the development would contribute to increased levels of nitrogen dioxide or nitrogen oxides. The available air quality data, however, suggest that there is substantial room within the air shed to accommodate an increase in nitrogen dioxide concentrations. 5.4 Ozone Photochemical oxidants (often referred to as photochemical smog) are a complex mixture of chemicals produced in the atmosphere by the action of sunlight. The principal component of photochemical oxidants is ozone. Ozone measurements are commonly used as a surrogate for photochemical oxidants. Ozone is a colourless, highly reactive gas with a distinctive sharp odour. At ground level, elevated concentrations of ozone can cause respiratory problems and cardiovascular disease in humans, and can affect the healthy normal population as well as sensitive sub-populations. It can worsen bronchitis, emphysema, and asthma. Ozone can also affect the growth of vegetation and damage materials and ecosystems. At ground level, ozone is created by a chemical reaction between nitrogen oxides and volatile organic compounds (VOCs) in the presence of sunlight. As such, nitrogen oxides and volatile organic compounds are referred to as ozone precursors. Motor vehicle exhaust, industrial emissions, gasoline vapours, chemical solvents as well as natural sources (such as bushfires) emit ozone precursors. The highest concentrations of ozone normally occur on Revision 1 – 02-Feb-2018 Prepared for – Riverview Projects (ACT) Pty Limited – ABN: 165 870 539
You can also read