Air quality - Department of Environmental Affairs
←
→
Page content transcription
If your browser does not render page correctly, please read the page content below
Chapter 10

Air quality
The atmosphere is the earth’s largest single shared resource, which
protects and supports life through the absorption of dangerous
ultraviolet solar radiation, warming the surface and regulating
temperature.

                            Air quality | 181
Chapter 10

Contents

10.1 INTRODUCTION
10.2 AIR QUALITY
     10.2.1 Indoor air quality
     10.2.2 Ambient air quality
10.3 SOURCES OF AIR POLLUTION
     10.3.1 Vehicle emissions
     10.3.2 Electricity generation and consumption
     10.3.3 Domestic fuel burning
     10.3.4 Industrial emissions
     10.3.5 Biomass burning
     10.3.6 Landfill site gas emissions
     10.3.7 Tyre burning emissions
     10.3.8 Airport emissions
     10.3.9 Agricultural emissions
10.4 COMMON AIR POLLUTANTS IN SOUTH
     AFRICA
10.5 AMBIENT AIR QUALITY MONITORING IN SOUTH
     AFRICA
     10.5.1 Monitored pollutant
		           concentrations
     10.5.2 Ambient air quality and associated
		impacts
     10.5.3 Regional and global issues
     10.5.4 Other pressing air quality issues
10.6 RESPONSES TO AIR QUALITY PROBLEMS
10.7 CONCLUSION
10.8 REFERENCES
10.9 ANNEXURE 10. A: Ambient air pollutant
     concentrations

10.1 INTRODUCTION
The atmosphere is the earth’s largest single shared resource,
which protects and supports life through the absorption of
dangerous ultraviolet solar radiation, warming the surface and
regulating temperature. However, these vital roles are under
serious threat due to human-driven activities that result in
the introduction of pollutants into the atmosphere (Hunter et
al. 2002). These activities or drivers include industrialization,
urban growth, population growth and changing consumption
patterns. Significant sectors contributing to atmospheric
degradation are transport, power generation, incineration,
waste and biomass burning.

Air emissions requiring management on local and regional
levels include sulphur dioxide, nitrogen oxide (NO) and
nitrogen dioxide (NO2), carbon monoxide (CO), VOCs,
benzene (C6H6), POPS and particulate matter. Some of these
primary pollutants undergo chemical transformation in the
atmosphere, creating secondary pollutants such as sulphuric
acid (H2SO4 - acid deposition) and ozone (O3). When dispersed
by winds, these pollutants persist long enough to pose
problems in distant areas, in some cases posing an additional
problem of trans-boundary pollution (Hunter et al. 2002).

Gaseous emissions such as carbon dioxide from fossil fuel
combustion, methane and CFCs, while not directly hazardous
to human and ecological functioning, are now recognized

                                                         Air quality | 182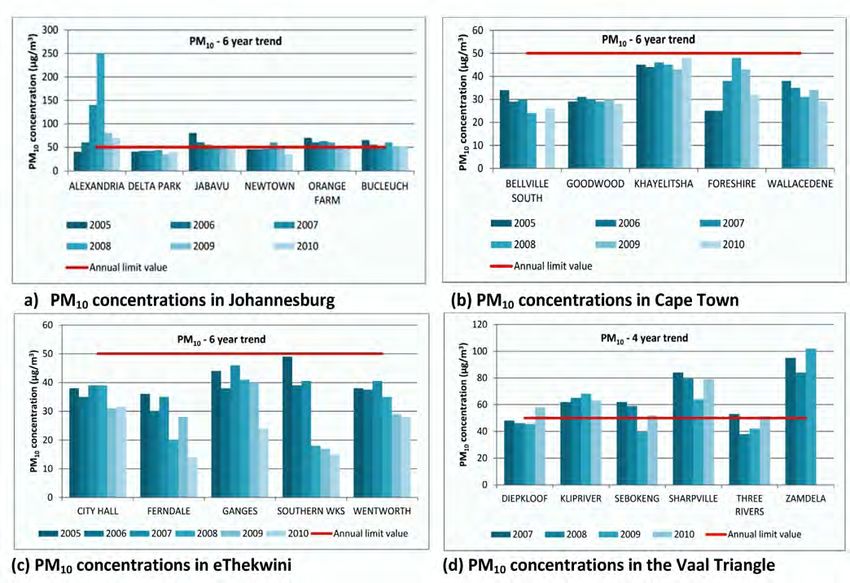
as perturbing to the functioning of the atmosphere on a             pollution levels are extremely high, average daily PM10
global scale. Other global environmental challenges with            concentrations in households can be up to ~1,000 µg/m³ (WHO
local significance to South Africa include climate change,          2000), exceeding the World Health Organization’s (WHO) and
stratospheric ozone depletion due to CFC emissions,                 other international guidelines (WHO 2000). This is because
and mercury emissions from coal combustion for power                incomplete combustion of the fuels results in the release of
generation and cement production. General environmental             high concentrations of some air pollutants associated with
degradation and the depletion of natural resources are also         combustion into the living environment.
major challenges facing the country and hence the drive
towards resource management and conservation.                       10.2.2 Ambient air quality
One of the reasons why air pollution is such a threat to human      Ambient air quality is defined as the physical and chemical
health is that we have no choice over the air we breathe            measure of pollutant concentrations in the ambient
(Koenig 2000). Thus in our homes, outdoors and workplaces,          atmosphere to which the general population will be
we often breathe air which is not as clean as we would              exposed. In most developing countries, ambient air quality is
prefer. Inhalation is a route of entry into the body for toxic      reported to have deteriorated seriously, especially in urban
chemicals, resulting in respiratory illnesses such as asthma,       areas, exposing populations to pollutant levels above the
increased susceptibility to acute respiratory infections, cancer,   recommended limits (UNEP 2002).
heart and lung diseases. Air pollution can cause a variety
of environmental effects which include acid rain that can           Outdoor air pollution is perceived as a serious problem due
damage forests and crops, or acidify soil and water bodies,         to elevated concentrations of some pollutants which result
and eutrophication, a condition in a water body where high          in adverse health and environmental effects. However, the
concentrations of nutrients, such as nitrogen, stimulates           realization of the health effects associated with air pollution
blooms of algae leading to death of fish (Koenig 2000).             has led to various responses at international, national and
                                                                    local levels aimed at improving air quality.

10.2 AIR QUALITY
                                                                    10.3 SOURCES OF AIR POLLUTION
In South Africa, outdoor and indoor air pollution continues
to be perceived as a serious problem, with emissions for            Air pollution emanates from various sources, which include
sulphur dioxide, particulate matter, nitrogen dioxide, nitrogen     natural and anthropogenic sources. Natural sources of air
oxides, ozone, benzene and VOCs, and the corresponding              pollution include volcanoes, which produce sulphur, chlorine
concentrations a cause of concern. Air quality in various areas     and particulates. Wildfires result in the production of smoke,
of the country is affected by pollutants emitted by numerous        carbon dioxide and carbon monoxide. Other natural sources
sources. These sources include power generation activities,         of air pollution include domestic animals such as cattle, which
industrial processes, waste disposal, transportation (private       release methane, and pine trees, which release VOCs. Most
and public vehicles), biomass burning, domestic fuel burning,       forms of air pollution are as a result of human activities and
landfill sites, waste water treatment and agriculture.              include fossil fuel burning (coal, oil and natural gas in industrial
                                                                    processes), electricity generation, vehicle emissions, aircraft
                                                                    emissions, domestic fuel burning, and the use of household
10.2.1 Indoor air quality                                           materials that contain persistent organic pollutants, biomass
Indoor sources are the primary cause of indoor air quality          burning and waste incineration.
problems in homes. Poor ventilation can increase indoor
pollutant levels due to weak dilution of emissions from indoor      10.3.1 Vehicle emissions
sources. There are numerous sources of indoor air pollution,
including combustion of domestic fuels such as coal, wood,          Vehicle emissions contribute to the deterioration in air
paraffin, tobacco smoke, asbestos products, pesticides used         quality, especially in urban areas. There is an increase in
in the home, and household cleaning products.                       the number of privately owned vehicles in South Africa. The
                                                                    increase in the number of vehicles has, as expected, resulted
Public exposure to air pollution has been largely associated        in an increase in fuel consumption (Figure 10.1). In urban
with outdoor pollution. However, the largest exposures to           areas, vehicle emissions may be responsible for 90 to 95 per
health-damaging pollution probably occur in the developing          cent of carbon monoxide and 60 to 70 per cent of nitrogen
world among the poorest and most vulnerable populations,            oxides within the atmosphere (Schwela 2004). Emissions from
largely women and young children, who are most exposed              vehicles contribute to photochemical smog, especially in areas
to indoor pollution sources (Smith 2002). The fact that             that experience high traffic density such as central business
domestic fuel burning occurs under unfavourable combustion          districts (CBDs) (Schwela 2004) (Box 10.1). Vehicle emissions
conditions, often without venting to the outside, largely           in Cape Town have been identified as one of the sources of
impacts on indoor air quality.                                      brown haze (Piketh et al. 2004).

Indoor combustion for cooking and heating, using coal, wood,
paraffin or traditional sources of fuel (dung and agricultural
residues) may produce high levels of particulate matter
(condensed volatile organic vapours) and carbon monoxide.
Exposure to indoor air pollution is dependent on the type
of fuel used, type of equipment used, location of the stove,
and ventilation of the space (Smith 2002). Resultant indoor

                                                         Air quality | 183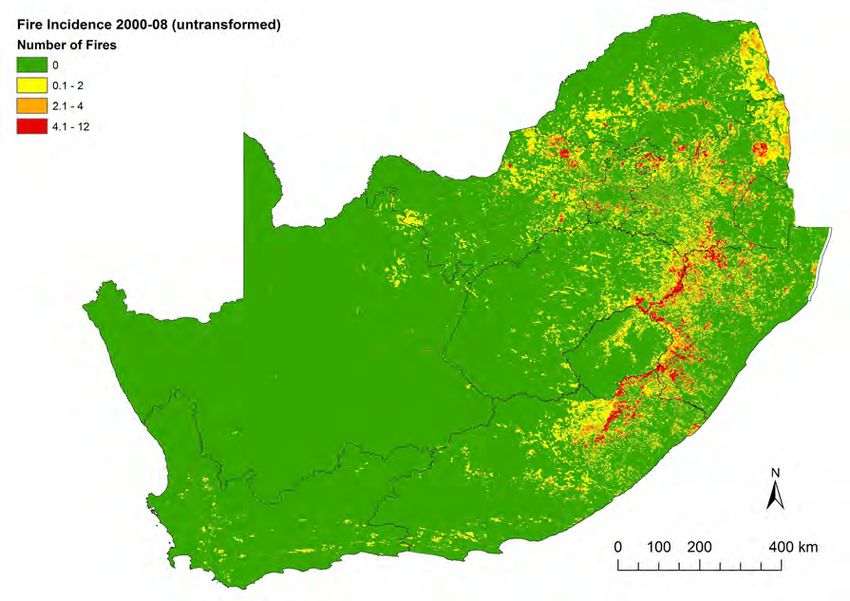
14000

                   12000

                   10000
  Million litres

                   8000

                   6000

                   4000

                   2000

                      0
                           1988 1989 1990 1991 1992 1993 1994 1995 1996 1997 1998 1999 2000 2001 2002 2003 2004 2005 2006 2007 2008 2009

                                                                        Petrol      Diesel

Figure 10. 1: Consumption of petrol and diesel in South Africa from 1988 to 2009
Source: SAPIA (2012)

10.3.2 Electricity generation and consumption
                                                                                  However, the new CO2 tax is expected to add around two
The generation of electricity in South Africa is largely                          per cent to the cost of a new vehicle, and some doubt has
dependent on coal. The generation of electricity through                          been expressed as to whether this will have a significant
coal-fired power stations results in the emission of pollutants                   effect on motivating new vehicle buyers to purchase
such as particulate matter, sulphur dioxide, nitrogen oxides                      environmentally friendly vehicles. Another negative
and mercury. The air quality impacts of the pollutants that                       comment expressed by many is that the current standard
are produced by power generating activities are largely felt                      of South African fuel makes it almost impossible to either
in the province of Mpumalanga where most of the coal                              import or manufacture a passenger vehicle in South Africa
reserves lie. The detailed impacts of electricity generation on                   that can achieve the 120 g/km threshold.
the environment can be found in Chapter 12: Energy of this
report.                                                                           A number of countries have implemented carbon taxes or
                                                                                  energy taxes that are related to carbon content. For example,
 Box 10. 1: Carbon dioxide vehicle emissions tax                                  environmental taxes with implications for greenhouse gas
                                                                                  emissions have been levied in OECD countries on energy
 A carbon tax is an environmental tax levied on the carbon                        products and vehicles rather than CO2 emissions directly.
 content of fuels and is a form of carbon pricing. Fuel
 combustion results in the release of CO2, a greenhouse                          10.3.3 Domestic fuel burning
 gas contributing to the threat of human-induced climate
 change. Greenhouse gas emissions are a result of fossil fuel                    A growing concern is the level of pollution from domestic
 combustion and are closely related to the carbon content of                     fuel burning and the associated health effects. Low-income
 the respective fuels they originate from. It is for this reason                 households and informal settlements are dependent on
 that a tax on these emissions can be levied by taxing the                       domestic fuels, such as coal, paraffin and wood, for cooking
 carbon content of fossil fuels at any point in the product                      and heating.
 cycle of the fuel.
                                                                                 Domestic fuel burning results in pollutants such as sulphur
 In September 2010, South Africa implemented a CO2                               dioxide, carbon monoxide, VOCs and particulates. The
 emissions tax on new passenger vehicles as part of a                            release of sulphur dioxide, or hydrogen sulphide and carbon
 sustainable development initiative and climate change                           dioxide is dependent on combustion and fuel characteristics.
 mitigation measure. This CO2 tax currently applies to new                       Complicating issues further, is the fact that most of the
 passenger vehicles at the time of sale but will in future                       household activities are undertaken using simple, small-
 include commercial vehicles once CO2 standards have been                        scale cook stoves. Many of these stoves are not vented (do
 set for these vehicles. Passenger vehicles which emit over                      not have flue or hoods for the exit of pollutants from the
 120 g/km are subject to a tax of R75 per g/km over this                         living environment). In addition, poor combustion conditions
 figure. The main objective of this CO2 tax is to influence                      result in high emission rates, which in turn significantly affect
 the composition of South Africa’s vehicle fleet to become                       neighbourhood air quality.
 more energy efficient and environmentally friendly while
 generating revenue.                                                             10.3.4 Industrial emissions
                                                                                 Industry is a major consumer of energy and depends mainly
 There are however concerns that this CO2 tax will increase
                                                                                 on fossil fuels, especially coal. The industrial/mining sector
 the price of new vehicles and reduce sales, thereby
                                                                                 is also a major consumer of electricity nationally. The largest
 negatively affecting the automobile industry. It has also
                                                                                 industrial consumer of electricity is the mining sector, followed
 been argued that the tax is discriminatory as it targets new
                                                                                 by the iron and steel, and non-ferrous metals industries.
 vehicles and not the existing vehicles in the country.

                                                                    Air quality | 184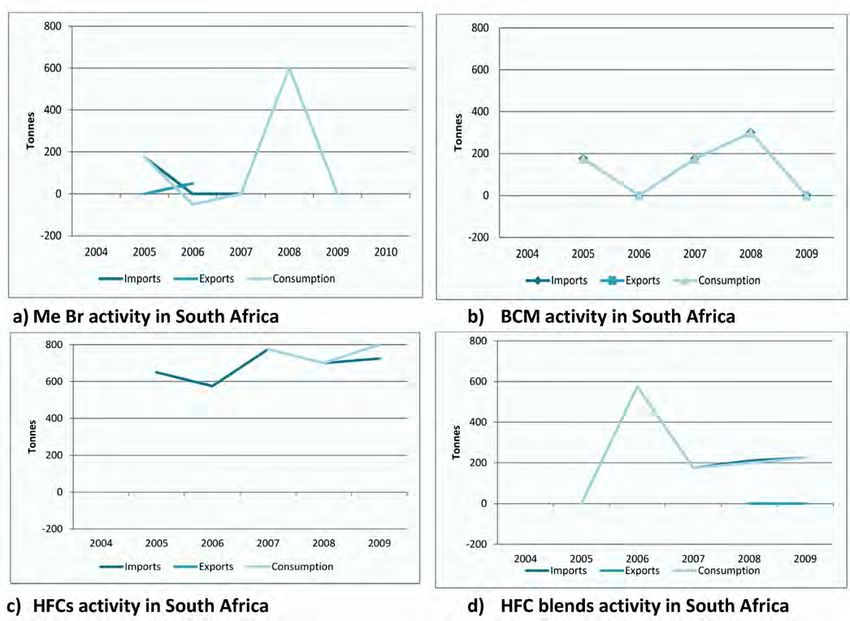
Air pollution is a major concern in areas of heavy industrial
development such as the Vaal Triangle Airshed Priority Area,        Gauteng currently has 380 identified mine residue areas of
South Durban Industrial Basin (SDIB) and the Highveld Priority      which the majority are gold-mining residues (GDARD 2009).
Area (HPA).                                                         These gold tailings contain compounds such as residues of
                                                                    cyanide (used during gold extraction) and heavy metals such
Poor past land use planning in South Africa has resulted in the     as arsenic which is enriched by a factor of approximately
positioning of heavy industrial developments in proximity to        50 in the gold-bearing ore relative to average crustal rock.
heavily populated residential areas (Leaner et al. 2009). The       In 2010 the Mine Health and Safety Council commissioned
negative environmental effects of air pollution resulting from      a major study to determine the health implications of
industrial operations are felt directly during the active phase.    atmospheric emissions from gold mine tailings storage
However, in some cases, these negative environmental effects        facilities. Results are anticipated in 2013.
may be experienced long after industrial operations have
ceased. This is evident in Gauteng where mine residue areas
(Box 10.2) resulting from intensive mining activities which        10.3.5 Biomass burning
were undertaken in the Witwatersrand, have become a serious
source of wind-blown dust. Compounding the problem is the          Biomass burning is a significant source of gases and particulate
close proximity of human settlements right up to the foot of       matter emissions to the atmosphere. Pollutants associated
the mine tailings storage facilities.                              with biomass burning include greenhouse gases (carbon
                                                                   dioxide, methane and nitrous oxide), carbon monoxide, and
 Box 10. 2: Mine residue areas in Gauteng                          VOCs especially in the tropical and subtropical regions. The
                                                                   emission of carbon monoxide, methane and VOC affects
 Mine residue areas in Gauteng include tailings disposal           the oxidation capacity of the atmosphere by reacting with
 facilities, waste rock dumps, open cast excavations and           hydroxyl (OH) radicals. Emissions of nitric oxide and VOCs lead
 quarries. Many of these mine residue areas are sources            to the formation of ozone and other photochemical oxidants
 of dust pollution, especially during secondary reclamation        (Koppman et al. 2005). Almost 90 per cent of all biomass
 of the tailings that entails removal of protective layers of      burning emissions are thought to be anthropogenic (Koppman
 vegetation for the duration of the reclamation project. On        et al. 2005).
 the Far West Rand (Randfontein and Carltonville), enhanced
 concentrations of uranium (relative to average crustal rock)      Veld fires are a persistent problem in South Africa as they
 have led to concerns about mobilization of radioactive            pose a risk to life, and cause damage to property and
 substances. Of major concern is that some residential areas       the environment. According to the National Veldfire Risk
 are located in proximity to or downwind of these tailings         Assessment (Forsyth et al. 2010), there is a marked trend in
 dumps, either through intentional planning (Davidsonville)        fire incidence from the eastern to western parts of the country
 or incidental expansion of older townships (Meadowlands).         and, to a lesser extent from northern to southern parts (Map
                                                                   10.1) (Forsyth et al. 2010).

Map 10. 1: Map of fire incidences in South Africa for January 2000 to December 2008
Source: Forsyth et al. (2010)

                                                        Air quality | 185
Aside from air quality impacts veld fires cause economic,           The indiscriminate burning of tyres to recover the scrap
social and environmental losses including industrial losses         metal is a major concern. For example in Cape Town, it has
of infrastructure and the related financial implications,           been reported that at Cape Town International Airport, the
destruction of power lines and other infrastructure such as         black smoke limits or impairs vision resulting in pilots using
farm and country resorts. The social impacts thereof include        their instruments to assist with the landing of aircraft (www.
loss of homes and resources for rural livelihoods, stock losses     capetown.gov.za 2012).
and loss of grazing. The environmentally damaging effects of
veld fires include the loss of biodiversity, damage to vegetation   There has been regulatory development with regard to
and the release of pollutants to the atmosphere (Forsyth et al.     the issue of used tyres in South Africa. In pursuance of the
2010).                                                              National Environmental Management: Waste Act (No 59 of
                                                                    2008 – NEM:WA) and within the framework of the waste
10.3.6 Landfill site gas emissions                                  management hierarchy, there is increasing focus on producers
                                                                    and users of tyres to ensure safe reuse, materials and energy
Land fill sites are a major source of methane, and a contributory   recovery and safe disposal of tyres. This will have an impact
factor to carbon dioxide. These gases are primarily of concern      by availing more air space in landfill sites and reduce toxic
as they are greenhouse gases. A range of other gases may be         emission and harmful exposure as a result of the indiscriminate
emitted, including odorous gases such as hydrogen sulphide          burning of used tyres.
and mercaptans, toxins such as phenols and chlorobenzene
and carcinogens such as benzene and methylene chloride
(Abushammala et al. 2009). The gases generated in landfills
                                                                    10.3.8 Airport emissions
result from the process of waste decomposition and are              There are various sources of emissions associated with airport
related to the waste composition and landfill technologies          activities. These include road traffic at and around airports,
used (Abushammala et al. 2009).                                     aircraft exhaust fumes, emissions from ground service
                                                                    equipment and auxiliary power units and airport buildings.
10.3.7 Tyre burning emissions
                                                                    Aircraft often travel for great distances at varying altitude,
Air emissions from tyre burning include uncontrolled                generating emissions that can potentially impact local, regional
and controlled emissions. Uncontrolled sources are open             and global air quality (ICAO 2011). Emissions associated with
tyre fires, which produce many products of incomplete               aircraft activities include carbon dioxide, particulate matter,
combustion and release them directly into the atmosphere.           nitrogen oxides, carbon monoxide, sulphur dioxide and VOCs
Controlled combustion sources include incineration in boilers       (ICAO 2011). Aircraft emissions are a function of the fuel
and kilns specifically designed for efficient combustion of solid   specifications, number of aircraft operations which include
fuel (Reisman 1997). Emissions from controlled combustion           landing and take-off cycles, aircraft fleet mix, and length of
sources are much lower and more often than not, these               time aircrafts spend in each of the modes of operation: take-
sources also have appropriate air pollution control equipment       off, climb out, approach and idle (ICAO 2011). South Africa has
for the control of particulate emissions (Reisman 1997). Open       a number of domestic and international airports. Although
tyre burning emissions include significant quantities of fine       comprehensive emissions inventories were undertaken for the
black carbon (classified for control purposes as PM10 and           international airports in Cape Town (Cape Town International
PM2.5).                                                             Airport) and in Johannesburg (O.R. Tambo International
                                                                    Airport) (Burger & Watson 2003) and the results reported in
Emissions from open tyre-burning can cause significant acute        the 2005 State of Air Report, more research in this field is still
(short-term) and chronic (long-term) health effects such as         required.
respiratory effects, cancer and nervous system depression
(US-EPA 1997). They can also lead to the pollution of soil,
surface water, and ground water and an integrated approach
must be applied to manage these impacts.

                                                         Air quality | 186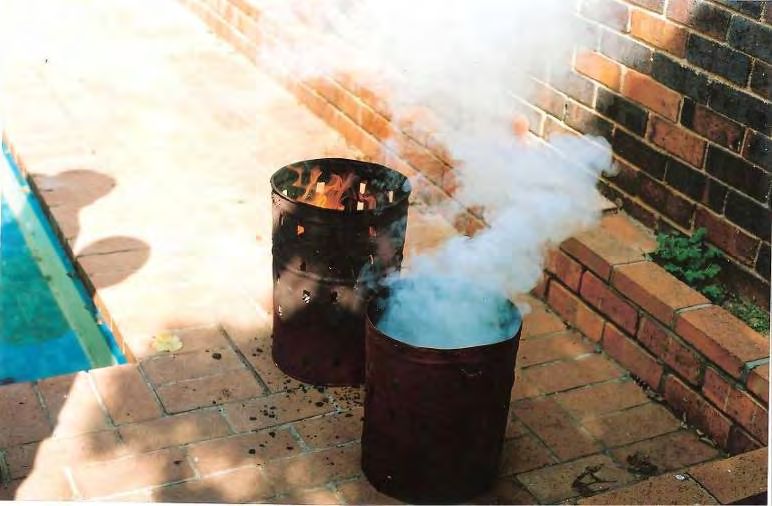
10.3.9 Agricultural emissions                                      occurs releasing pollutants such as carbon monoxide and
                                                                   particulates. Measures being taken to reduce emissions from
Agricultural activities can be considered a significant            sugarcane burning include sugarcane burning policies, green
contributor to particulate emissions through tilling, harvesting   harvesting and sustainable sugarcane farm management
and other activities associated with field preparation. Gaseous    system (KZN DAEA&RD 2011).
and particulate emissions are also released to the atmosphere
through agricultural activities such as fertilizer and chemical
treatment, land resource management practices such as              10.4 COMMON AIR POLLUTANTS IN
burning of residue crops and vegetation (UN-EPA 2012).             SOUTH AFRICA
The sugarcane industry burns 90 per cent of its crop at harvest,
while ten per cent is harvested green. In 2008, KwaZulu-           The most common air pollutants in the country are shown in
Natal identified sugarcane burning as a significant source of      Table 10.1. The priority pollutants are a good indicator of air
air pollution (KZN DAEA&RD 2011). It has been established          quality in general.
that during sugarcane burning, incomplete combustion

Table 10. 1: Pollutants of concern in South Africa
                                                                         Possible future pollutants
 Current criteria pollutants
                                             National pollutants                             Local pollutants
 Sulphur dioxide                             Mercury                                         Chrome
 Nitrogen dioxide                            Particulate matter (PM2.5)                      Fluoride (particulate and gas)
 Ozone                                       Dioxins                                         Manganese (Mn)
 Carbon monoxide                             Furans
 Lead (Pb)                                   POPs
 Particulate Matter (PM10)                   Other VOCs
 Benzene                                     Pollutants controlled by international
                                             conventions ratified by South Africa
Source: DEA (2007)

10.5 AMBIENT AIR QUALITY MONITORING                                approaches (DEA 2011a). Monitoring campaigns around the
                                                                   country have also been driven by the implementation of
IN SOUTH AFRICA                                                    the NEM:AQA. Currently, the National Ambient Air Quality
In South Africa, a substantial amount of ambient air quality       Monitoring Network (NAAQMN) has 94 government air
monitoring is conducted by a wide range of monitoring              quality monitoring stations operated by all three spheres of
agencies, using a range of monitoring methodologies and            government (Map 10.2).

Map 10. 2: Overview of the government-owned air quality monitoring networks
Source: DEA (2011a)

                                                        Air quality | 187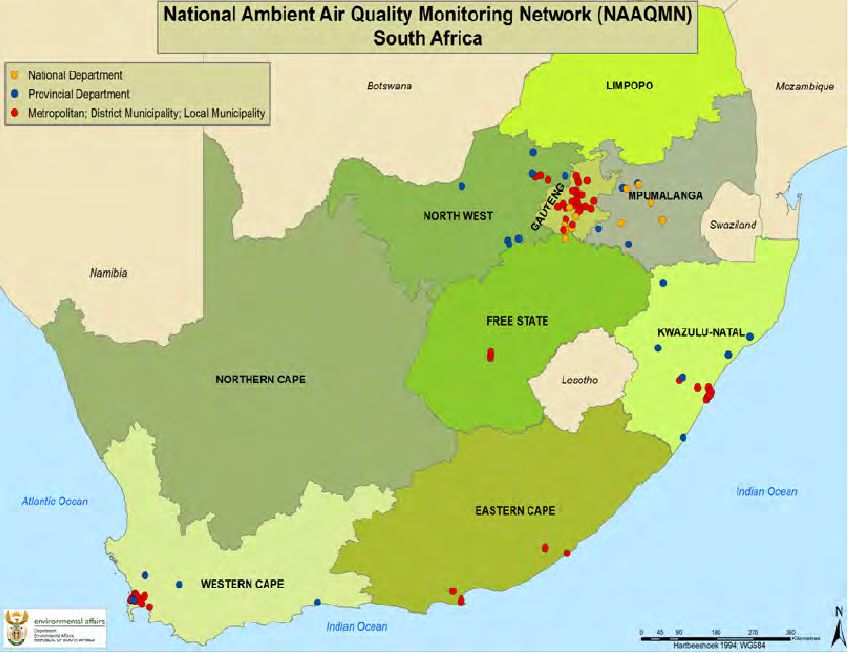
The DEA currently operates five stations in the HPA. The SAWS     10.5.1 Monitored pollutant concentrations
owns six stations located in the Vaal Triangle Airshed Priority
Area (VTAPA). Four provincial departments currently operate 21
                                                                  10.5.1.1 Particulates
stations, with the Western Cape Department of Environmental
Affairs and Development Planning (DEA&DP) operating               Elevated Particulate Matter concentrations still occur in various
four stations, KwaZulu-Natal Department of Agriculture,           parts of the country, exceeding the South African annual PM10
Environmental Affairs and Rural Development (DAEA&RD)             ambient air quality standard especially in residential areas.
operating six stations, North West Department of Agriculture,     Elevated PM10 concentrations in excess of air quality limits are
Conservation, Environment and Rural Development (DACERD)          also recorded by some industrial monitoring sites. Most of the
operating seven stations, and Mpumalanga Department of            exceedances of the PM10 annual standard occur in the priority
Economic Development, Environment and Tourism (DEDET)             areas, so re-affirming the decisions to declare such areas a
operating four stations. The DEA has recently commissioned        priority zones (Figure 10.2 and 10.3).
three continuous air quality monitoring stations in the
Waterberg District in Limpopo. The remaining stations are         National government has set a target that by 2020, air quality
owned by municipalities.                                          in all low-income settlements should be in full compliance with
                                                                  ambient air quality standards. Particulate matter is therefore a
The most commonly monitored pollutants are sulphur dioxide,       national concern due to exceedances of the National Ambient
nitrogen dioxide, nitrogen oxides, ozone, and particulate         Air Quality Standards (NAAQS), which are designed for the
matter (ambient PM10 and PM2.5). The other pollutants             protection of the environment and human health.
measured include lead, carbon monoxide, total suspended
particles (TSPs), VOCs, benzene, toluene, ethylbenzene,
xylene components (BTEX), hydrogen sulphide, and total
reduced sulphur (TRS).

Figure 10. 2: Measured annual average PM10 mass concentrations at: a) Johannesburg; b) Cape Town; c) eThekwini; and,
d) Vaal Triangle monitoring stations for 2005 to 2010
Stations are labelled on x-axis. Red lines indicate the national standard for annual PM10 mass concentration.
Source: DEA (2011b)

                                                       Air quality | 188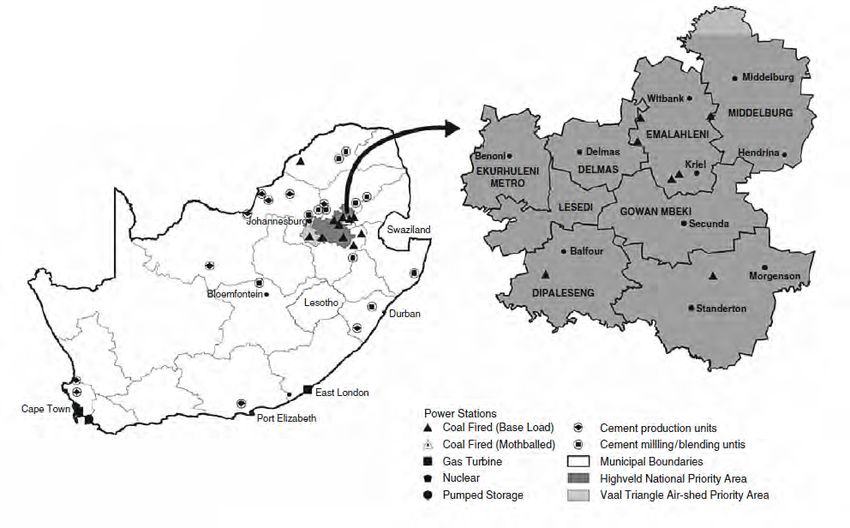
100 20
PM10 - 3 Year Trend
90 SO2 - 6 year trend
SO2 concentration (ppb)
80 15
PM10 concentration (µg/m3)
70
60 10
50
5
40
30
0
20
Belville South Bothasig Goodwood Tableview Wallacedene
10
2005 2006 2007 2008 2009 2010 SO2 limit
0
Ermelo Hendrina Middleburg Secunda Witbank
2008 2009 2010 Annual limit value Figure 10. 4: Sulphur dioxide concentrations in Cape Town
Source: DEA (2011b)
Figure 10. 3: PM10 concentrations at the Highveld Priority
Area
Source: DEA (2011b) 25
Sulphur dioxide - 6 year trend
20
10.5.1.2 Sulphur dioxide
SO2 concentration (ppb)
In the domestic fuel burning areas such as Diepkloof, 15
Sebokeng, Sharpville, the annual air quality standard for
sulphur dioxide is rarely exceeded except in Alexandra in 10
Johannesburg. Although concentrations at some industrial
sites at the HPA exceed the sulphur dioxide annual air 5
quality standard, significant improvements in the reduction
0
of sulphur dioxide emissions have been reported at Cape Alexandria Jabavu Orange Farm Bucleugh
Town (Killarney), Richards Bay (RBCCA 2008 and 2011) and 2005 2006 2007 2008 2009 2010 Annual limit value
eThekwini Metropolitan Municipality.
Figure 10. 5: Sulphur dioxide concentrations in Johannesburg
Petrochemical, metallurgy, power generation, pulp and paper, Source: DEA (2011b)
and ceramic processes are some of the industrial processes
that contribute to sulphur dioxide emissions. Figure 10.4,
Figure 10.5 and Figure 10.6 show sulphur dioxide trends in
monitoring stations around the country.
20 20
18
SO2 concentration (ppb)
Sulphur dioxide - 4 year trend Sulphur dioxide - 6 year trend
16 15
SO2 concentration (ppb)
14
12 10
10
5
8
6
0
4 Ferndale Ganges Southern Wks Wentworth
2
2005 2006 2007
0
Diepkloof Klipriver Sebokeng Sharpville Three Rivers Zamdela 2008 2009 2010
Annual limit value
2007 2008 2009 2010 Annual limit value
(a) So2 concentrations in the Vaal Triangle (b) So2 concentrations in eThekwini
25 20
SO2 concentration (ppb)
Sulphur dioxide - 3 year trend Sulphur dioxide - 6 year trend
20 15
SO2 concentrtion (ppb)
15 10
5
10
0
5 Arboretum Brackenham CBD Harbour West Scorpio
2005 2006 2007
0
Ermelo Hendrina Middleburg Secunda Witbank 2008 2009 2010
2008 2009 2010 Annual limit value Annual limit value
(c) So2 concentrations in the Highveld Priority Area (d) Richards Bay annual average So2 concentrations
Figure 10. 6: Measured annual average sulphur dioxide (SO2) concentrations in: a) Vaal Triangle; b) eThekwini; c) Highveld;
and, d) Richards Bay monitoring stations for various periods
Stations are labelled on x-axis. Red lines indicate the national standard for annual sulphur dioxide.
Source: DEA (2011b)
Air quality | 189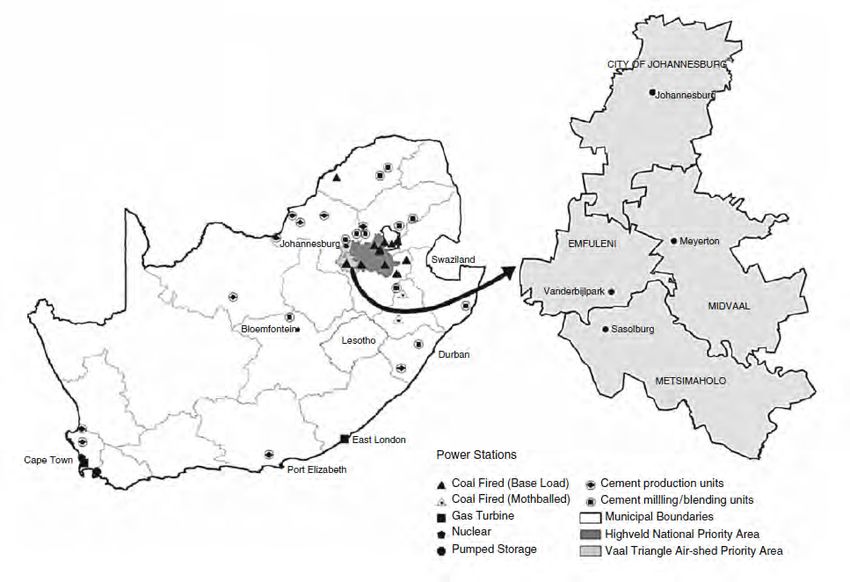
10.5.1.3 Nitrogen dioxide and ozone
                                                                   children with certain genes on days following exposure. For
Air quality limits for nitrogen dioxide and ozone are exceeded     adults, living in communities in the south, as compared to
at road traffic-related sites, some domestic fuel burning areas    the north, was significantly associated with hay fever, and
and industrial areas. The increasing number of vehicles in the     somewhat associated with chronic bronchitis, wheezing
country is expected to have an impact on future traffic-related    with shortness of breath, and hypertension.
nitrogen dioxide.

10.5.1.4 Carbon monoxide
Carbon monoxide is an indicator for traffic emissions and
fuel combustion activities. Generally carbon monoxide levels
are low and are not an area of focus in ambient air quality
management. However, exposure to carbon monoxide is a
concern in the context of indoor air quality and is exacerbated
by incomplete combustion and poor ventilation.

10.5.1.5 Availability of data
Despite the availability of continuous monitored data from
the stations which make up the NAAQMN, there is limited air
quality monitoring capability in South Africa. In some areas,
no air quality monitoring activities occur.                       10.5.2.2 Fauna and flora risks

10.5.2 Ambient air quality and associated impacts                 Air pollution impacts on plants and animals, although limited
                                                                  research on these impacts has been undertaken in South
                                                                  Africa. The most common pollutants that have adverse
10.5.2.1 Health risks                                             effects on plants include sulphur dioxide, fluoride, chlorine,
Air pollution can causes adverse health impacts (Matooane et      ozone and ethylene. The effects of pollution on plants include
al. 2004). Pollution from the burning of domestic fuel (coal,     ‘burning’ at leaf tips or margins, stunted growth, premature
wood and paraffin) has been described as the single largest       leaf growth, delayed maturity, early drop of blossoms and
contributor to the negative health impacts of air pollution       reduced yield or quality (Alabama Cooperative and Extension
(FRIDGE 2004) (Box 10.3).                                         System 2009). However, a complicating issue is the fact
                                                                  that injuries or damages to plants from air pollution can
                                                                  be confused with the symptoms caused by bacteria, fungi,
 Box 10. 3: South Durban Health Study                             viruses, nematodes, insects, nutritional deficiencies and
                                                                  toxicities and environmental factors such as temperature,
 The South Durban Health Study aimed to assess the                wind and water (Enviropaedia 2011). Other pollutants such
 influences of industrial and vehicular emissions on              as sulphur dioxide, nitrogen dioxide and carbon dioxide can
 respiratory health (epidemiological), to survey the range        dissolve in water to form acid rain. Depending on the pH level,
 of ambient exposures and to determine the health risk            effects of acid rain can range from plant damage to plant
 these pose for the community. The study included South           death, depending on concentration and period of exposure
 Durban (Bluff (Dirkie Uys), Merebank (Nizam), Wentworth/         to toxins. Entire ecosystems are also in danger because of
 Austerville (Assegai), Lamontville (Entuthekwini)) and           changes in soil chemistry (Enviropaedia 2011).
 North Durban (KwaMashu (Ngazana), Newlands East
 (Ferndale) and Newlands West (Briardale)) (Naidoo et al.         Damage to plants caused by air pollution is most common
 2007).                                                           close to large urban areas and industrial areas such as power
                                                                  generation plants, smelters, incinerators, landfill sites, pulp
 The research estimated lifetime cancer risks from inhalation     and paper mills, fossil fuel burning (Weissflog et al. 2004).
 of pollutants. Individual lifetime risk is defined as the
 increased lifetime risk of cancer for an individual exposed      Animals are exposed to air pollutants through inhalation of
 to the maximum predicted long-term concentration                 gases or small particles, ingestion of particles suspended
 (Naidoo et al. 2007). The largest risks were posed by VOC’s      in food or water and absorption of gases through the skin.
 (benzene) and semi-volatile compounds (dioxins, furans           Pollutants such as ozone, sulphur dioxide and nitrogen dioxide
 and naphthalene).                                                primarily affect the respiratory system. Heavy metals (e.g. lead,
                                                                  arsenic, and cadmium) are emitted from various operations
 The study indicated that for children attending primary          such as smelters and may affect the circulatory, respiratory,
 school in South Durban, compared to the northern                 gastrointestinal, and central nervous systems of animals. The
 suburbs, had an increased risk for persistent asthma and         most affected organs are the kidney, liver, and brain. Entire
 for marked airway hyperactivity (eThekwini Municipality          populations can be affected as metal contamination can cause
 2006). Higher outdoor concentrations of nitrogen dioxide,        changes in birth, growth, and death rates (Air Pollution 2011).
 nitrogen oxides, PM10, and sulphur dioxide were strongly         Acid rain has effects on animals and these include a decline in,
 and significantly associated with poorer lung function           and loss of, fish populations and amphibians. Although birds
 notably among children with persistent asthma and                and mammals are not directly affected by water acidification,

                                                       Air quality | 190
they are indirectly affected by change in the quantity and of this period, stocks were in the main storage location.
quality of their food resources (Air Pollution 2011). A total number of between 60 to 80 tonnes of pesticides
have been collected from various farms and provincial
10.5.3 Regional and global issues sectors in Limpopo. Current project activities in the
province include the completion of an inventory of these
stocks and thereafter the repackaging of the pesticides for
10.5.3.1 Persistent organic pollutants
safe interim storage before suitable disposal (FAO 2011).
POPs are organic compounds of human origin that resist The collection phase of the project has been considered a
degradation and accumulate in the fatty tissue of living success and an indication of multi-stakeholder cooperation
organisms, including humans, and are found at higher among national and provincial government departments,
concentrations at higher levels in the food chain (WHO 2003). pesticide industry, NGO groups and farmers.
These pollutants can be transported over long distances in
the atmosphere resulting in widespread global distribution
to regions where these substances have not been used. The There is currently no comprehensive monitoring program of
toxicity of POPs and the threat they pose to human health, POPs in South Africa. However, in line with the requirements of
other living organisms and the environment, has resulted in a the Stockholm Convention for establishing baseline trends at
global response to these chemicals in recent years (Ritter et al. global background sites, two programmes for monitoring POPs
1995). Twelve POPs have been recognized internationally as in the environment were set up for the African region. These
the cause of adverse effects on humans and the environment programmes are the Global Passive Sampling Programme and
(Box 10.4). These were placed in three categories: Monitoring Network in the African Continent (MONET Africa).
• Pesticides such as dichlorodiphenyltrichloroethane (DDT) South Africa was a participant in both programmes and three
and chlordane; sampling sites were selected in the country, namely; the
• Industrials chemical such as polychlorinated biphenyls Molopo Nature Reserve, Barberspan and Vanderbijlpark (DEA
(PCBs) used in transformer oils; and, 2011c). Molopo Nature Reserve and Barberspan showed very
• Chemical by-products such as dioxins and furans which little air pollution (not detectable - ND). The levels of DDT
are produced from combustion processes such as waste were quantifiable at all sites (DEA 2011c).
incineration and industrial processes (WHO 2003).
An extensive ambient air monitoring programme for POPs
Concentrations of POPs have not been measured on a regular was undertaken in Durban focusing on the South Durban
basis in urban African communities. Combustion processes Industrial Basin (SDIB), an area with one of the highest
can generate many POPs, (e.g., polychlorinated dibenzodioxins industrial concentrations in Africa (eThekwini Municipality
(PCDDs)), polychlorinated dibenzofurans (PCDFs) and PCBs, 2006). Industrial activities include petroleum refineries, a
and atmospheric transport is often the primary route for paper mill, an international airport, landfill sites, incinerators,
transporting these contaminants into the environment processing and manufacturing industries, harbour and rail
(Batterman et al. 2007). For airborne PCDFs, recent inventories facilities and other industries. Several low-income residential
show that the largest single category contributor of emissions areas are located close to these industrial activities (eThekwini
is uncontrolled combustion processes, e.g., biomass burning Municipality 2006).
(forest, grassland, crop residue), waste burning, and accidental
domestic/industrial fires (Batterman et al. 2007). The results of the monitoring campaign indicated that the
average levels of PCDFs at the sites were fairly uniform, and
Box 10. 4: Africa Stockpile Programme - Achievements in the Wentworth site tended to have the highest concentrations
South Africa of the five most important congeners. All of the PCDDs and
PCDFs were found predominantly in the particulate phase. In
In response to the problems of pesticides in Africa, the contrast, PCBs were found predominantly in the vapour phase,
African Stockpiles Programme (ASP) was initiated for with the highest levels being found at the central Wentworth
the clean-up and safe disposal of over 50,000 tonnes of site (eThekwini Municipality 2006).
obsolete pesticide waste stockpiled across Africa (Africa
Stockpiles Programme 2009). Humans can be exposed to POPs through diet, occupation,
accidents and the environment, including the indoor
In South Africa, a decision was made to implement a environment. Exposure to POPs, either acute or chronic, can
pilot collection and inventory exercise in Limpopo as the be associated with a wide range of adverse health effects,
province has a strong agricultural sector. As part of this including illness and death. Human acute exposure to
exercise, a strategy was developed in co-operation with dioxins and furans can occur, through occupational risks (e.g.
farmers’ cooperatives and pesticide distributors for the herbicide production, industrial accidents or chemical fires),
delivery of obsolete pesticides from farms to the network and through burning of garbage in dump areas.
of existing pesticide distribution centres in the province.
A total of 24 centres were established and adequate 10.5.3.2 Transboundary transportation of pollutants
safety and containment for stocks upon delivery was
Pollutants emitted from natural or anthropogenic sources
provided. Information was provided to farmers on how
into the atmosphere may be transported over short or long
to safely package and transport the stocks. In addition, a
distances, with global dispersion resulting in ultra-long range
comprehensive communication and awareness campaign
transport. When air pollutants cross geographical boundaries
was initiated (FAO 2011). The collection phase of this
or migrate across several geographic zones, the pollution is
project took place for a period of 60-days and at the end
hence referred to as ‘transboundary’ (Freiman & Piketh 2002).
Air quality | 191Since the atmosphere is a shared resource, concerns have long-range transportation of both aerosols and trace gases
arisen from the effects of this transboundary pollution which across the subcontinent.
is capable of affecting systems at a regional scale.
Research shows transboundary transport occurs either
because the pollutants have very low deposition velocities
(for example pollutants associated with haze and fine
particulate matter), or an extended period of time is required
for the pollutant to develop from the precursor compounds
(smog, acid rain) or are chemically inert (mercury) (UNEP
2007). There are two major challenges with transboundary
pollutants; first the international cooperation required to
address them and second the provision of appropriate data
upon which mitigation decisions can be made (UNEP 2007).
In South Africa, the Mpumalanga Highveld, with a large
concentration of industrial infrastructure, is a major air
pollution source region of high-elevation emissions that are
transported to neighbouring countries (Swaziland, Lesotho,
Mozambique, Zimbabwe and Botswana). The Highveld region
accounts for the major fraction of South Africa’s emission
inventory of industrial particulates, sulphur dioxide and
nitrogen oxides (Freiman & Piketh 2002). Due to the presence
of mercury in coal, the Mpumalanga Highveld is a significant
source of this pollutant due to the majority of coal-fired
electricity generation plants being located in this region
(Leaner et al. 2009).
Industrial emissions from the Zambian copper belt have Map 10. 3: Seasonal atmospheric transport from Zambia
been detected in South Africa (Meter et al. 1999). Large scale over the southern Africa subcontinent
circulation over southern African results in industrial aerosols Source: NWDAC&E (2008)
and trace gases emitted from the Highveld returning to the
region after several days (D’Abreton & Tyson 1996; Piketh et 10.5.3.3 Acid deposition
al. 1998). Acidic deposition occurs when emissions from the combustion
of fossil fuels and other industrial processes undergo chemical
The Zambian Copperbelt is an important source of sulphur reactions in the atmosphere to form acidic compounds and
dioxide. Currently it is estimated that the emissions from are deposited as wet deposition and dry deposition. The
these industrial emissions are up to 2.24 Mt per annum main chemical precursors leading to acidic conditions are
(Meter 1999; Meter et al. 1999; Piketh & Walton 2004). atmospheric concentrations of sulphur dioxide and nitrogen
Research indicates that of the total 1.1 Mt of sulphur emitted oxides (Ecological Society of America 2000).
into the regional atmosphere annually (excluding Zambia), 66
per cent originates in South Africa and about 90 per cent of In South Africa, the industrial Highveld plateau is considered
this is from the Mpumalanga Highveld (Sivertsen et al. 1995; as a significant source of pollutants associated with acid
Wells et al. 1996). deposition and accounts for approximately 90 per cent of
South Africa’s scheduled emissions of industrial dust, sulphur
The role of biomass burning emissions in contributing to the dioxide and nitrogen oxides (Wells et al. 1996, as cited in
air pollution loads cannot be underestimated and biomass Josipovic et al. 2009).
burning is an important source in long-range transport of air
pollution in South Africa. Biomass burning is a seasonal source A major study on acid deposition over South Africa indicated
with highest intensities during the dry season, or between that concentration distributions for acidic gases sulphur dioxide
June and October. During this period in southern Africa, a and nitrogen dioxide show prevailing high concentrations
large number of fires are detected north of 20 degrees south over the industrial Highveld (Josipovic et al. 2009) (Map 10.4).
(Piketh & Walton 2004). A high frequency of burning events is The main findings indicated that the levels of acid deposition
also detected in northern and central Angola, the Democratic measured in the study do not exceed, and are not likely to
Republic of the Congo and north-western Zambia (Piketh & exceed, critical levels and thus the challenge of acid rain over
Walton 2004). These pollutants reach South Africa with high South Africa is not as serious an issue as previously thought.
concentrations, a phenomenon labelled the ‘River of Smoke’.
The biomass burning season in Africa starts near the equator
around June and moves southward where it reaches maximum
intensity in southern Africa around September (Map 10.3)
(NWDAC&E 2009). Associated with biomass burning is the
Air quality | 192Acid rain affects plants and animals and produces complex
changes in normal soil chemistry. It also causes staining and
chemical corrosion of buildings and monuments resulting in
high economic costs.
10.5.3.4 Stratospheric ozone depletion
The ozone layer is an atmospheric layer of naturally occurring
ozone gas that is located approximately 15 to 30 km above
the earth and serves as a shield from the harmful ultraviolet
B (UVB) radiation emitted by the sun (Kirk-Davidoff et al.
1999; Shindell et al. 1998). There is widespread concern
that the ozone layer is deteriorating due to the release of
anthropogenic CFC gases. Such deterioration allows large
amounts of UVB rays to reach earth, which can cause among
others, adverse health impacts, skin cancer and cataracts in
humans and harm to plants and animals (Kirk-Davidoff et al.
1999; Shindell et al. 1998).
Hydrochlorofluorocarbons (HCFCs) dominate consumption at
approximately 25,759 tonnes (81.4 per cent) of total ozone
depleting substances (ODS) consumed during the period 2004
to 2009 in South Africa (Figure 10.7) (DEA 2009).
Map 10. 4: Total (dry plus wet) acidic deposition rates
(meq/m2 per year)
Source: Josipovic et al. (2009)
Figure 10. 7: Ozone depleting substances consumption trends in South Africa for the period June 2004 to June 2009
Source: DEA (2009)
Air quality | 193CFC chemicals found mainly in refrigerants, industrial solvents Currently, there are six stations for monitoring UVB radiation
and aerosol spray cans, and heavily used by industrialized in the country. The stations are located in Pretoria, Cape Town,
nations for the past 50 years, are the primary culprits in the Durban, Cape Point, De Aar and Port Elizabeth. The main
breakdown of the ozone layer. This is because in the upper purpose of the UVB network is to create and enhance public
atmosphere, CFCs are exposed to solar ultraviolet rays, which awareness and provide real time information of the hazard of
causes them to break down into substances that include exposure to biologically active UVB radiation reported using
chlorine. The chlorine reacts with the oxygen atoms in ozone the ‘sunburning’ or erythemally-weighted radiation (UVEry)
and destroys the ozone molecule. According to the United (McKenzie et al. 2004).
States Environmental Protection Agency (US-EPA), one atom
of chlorine can destroy more than a hundred thousand The monthly maximum UVB levels occur in January and
ozone molecules. The ozone layer above the Antarctic has the minimum levels in June. A comparison of the stations
been particularly impacted by pollution since the mid-1980s indicates that UVB levels in De Aar are the highest while Port
(National Geographic 2011). This region’s low temperatures Elizabeth is the lowest. UVB levels in Pretoria are second
speed up the conversion of CFCs to chlorine. In summer, when highest, followed by Durban and Cape Point (Figure 10.8). The
the sun shines for long periods of the day, chlorine reacts with use of the UV Index indicates that maximum UVB levels for all
ultraviolet rays, destroying ozone on a massive scale by up to stations except Port Elizabeth, lie within the extreme exposure
65 per cent (National Geographic 2011). category.
16
Several of the anthropogenic greenhouse gases (for example
CFCs and N2O) are also ozone depleting gases. Interactions 12
between climate change and stratospheric ozone may delay
UV indexes
8
recovery of the ozone layer by 15 to 20 years (Kelfkens 2002).
The depletion of stratospheric ozone and global warming due 4
to the build-up of greenhouse gases interact to alter ultraviolet
related effects on health (Kelfkens 2002). 0
Jan Feb Mar Apr May Jun Jul Aug Sep Oct Nov Dec
10.5.3.4.1 Effects of stratospheric ozone depletion CP CTI DA PE DBN PTA
There is a range of certain or possible health impacts of Figure 10. 8: Average maximum monthly UV indices
stratospheric ozone depletion. Many epidemiological studies Source: Ncongwane and Coetzee (2010)
have implicated solar ultraviolet radiation as a cause of skin
cancer (melanoma and other types). Assessments by the 10.5.4 Other pressing air quality issues
UNEP (1998) projected significant increases in skin cancer
incidence due to stratospheric ozone depletion (UNEP 1998). South Africa faces various air pollution challenges which
The assessment anticipated that for at least the first half of include persistent issues such as domestic fuel burning and
the twenty first century (and subject to changes in individual industrial emissions. In addition to these problems, the country
behaviours) additional solar ultraviolet radiation exposure will faces other pressing air quality issues. These emerging issues
augment the severity of sunburn and incidence of skin cancer. include waste disposal emissions, tyre burning emissions,
High intensity ultraviolet radiation also damages the eye’s emissions from filling stations, small boilers, asphalt plants
outer tissues causing ‘snow blindness’, the ocular equivalent and emerging priority pollutants such as dioxins and furans,
of sunburn (UNEP 1998). formaldehyde and poly aromatic hydrocarbons.
Research shows that high ambient solar ultraviolet radiation, 10.5.4.1 Mercury emissions
particularly UVB exposure, occurs in countries such as South Mercury is a transboundary pollutant which has both natural
Africa, Australia and New Zealand (Norval et al. 2011). South and anthropogenic sources. Important human activities
Africa has very high levels of solar radiation, over twice that of that result in mercury release include coal combustion,
Europe and 1.5 times higher than in the United States (Eumas waste incineration, cement production and ferrous metals
et al. 2006). production. However, despite the identification of the
important sources of mercury in South Africa and other
10.5.3.4.2 Responses to stratospheric ozone depletion southern African countries, information on specific mercury
International responses include the Montreal Protocol of sources and concentrations in the region is poorly understood
1987, followed by the London (1990), Copenhagen (1992), (Leaner et al. 2009). For example, South Africa is a major
Vienna (1995), another Montreal (1997), and Beijing (1999) producer of a variety of metals such as gold, platinum,
amendments. South Africa acceded both to the Vienna lead and zinc. Although the production of these minerals
Convention for the Protection of the Ozone Layer and the and materials is known to contribute to mercury pollution,
Montreal Protocol on Substances that Deplete the Ozone detailed mercury emissions inventories for these sources are
Layer in 1990, and to the London Amendment to the Montreal not available (Leaner et al. 2009). Attempts have, however,
Protocol in 1992. South Africa has developed an Ozone been made by various stakeholders in South Africa to quantify
Layer Protection Strategy as a response measure necessary emissions from various sources.
to mitigate ozone layer depletion. The DEA has started the
process of developing a national strategy for phasing out
ozone-depleting substances and is formulating a full phase-
out plan for methyl (DEA 2009).
Air quality | 194Coal-fired power plants were identified as the largest potential mercury emissions. UNEP has also provided funding to
source of mercury emissions, especially given the fact that the undertake mercury emission measurements at two Eskom
country is a major producer (especially in the Highveld) and power stations and is in discussions regarding a possible
consumer of coal (Leaner et al. 2009) (Figure 10.9). demonstration project that will seek to reduce mercury
emissions from coal-fired power generation (Leaner et al.
35 2009).
30 10.5.4.2 Black carbon
Black carbon is an air pollutant formed through the
Total Hg (Tonnes / year)
25
incomplete combustion of fossil fuels, biofuels and biomass
20
and is a component of PM2.5. This pollutant is associated
15 with significant adverse health effects such as lung cancer,
respiratory and cardiovascular conditions (UNECE 2011).
10
In South Africa (and in general), anthropogenic sources of
5
black carbon include domestic fuel burning, road transport,
0 especially diesel-fuelled transportation, and biomass burning.
These sources have also been identified to be the most
important with regards to black carbon mitigation potential.
For example, domestic fuel burning mitigation measures
include the use of modern combustion stoves and substitution
of biomass fuels with ‘cleaner fuels’ such as electricity in
residential areas. Vehicle emissions can be reduced through
elimination of high-emitting vehicles (UNECE 2011).
Black carbon is also known as a ‘short-lived climate forcer’.
Figure 10. 9: Average atmospheric mercury emissions This effectively means that it is a warming agent with a
(1 metric tonne = 1 Mg) estimated for different source
relatively short lifetime in the atmosphere, ranging between
categories in South Africa during 2004
days and weeks and contributes to global warming through
Source: Leaner et al. (2009)
the absorption of sunlight as it penetrates from space. This
leads to direct heating of the atmosphere (UNEP 2011).
Cement production, coal gasification, non-ferrous metals
production and fuel production, crude oil refining, coal
The reduction of black carbon and other ‘short lived climate
combustion in residential heating and medical waste
forcers’ such as tropospheric ozone and methane will
incineration are some of the significant mercury source
provide significant benefits through improved air quality and
categories identified in South Africa. The total atmospheric
mitigation of climate change (UNEP 2011).
emissions from all potential sources in South Africa in 2004
were estimated to be about 40 Mg (Leaner et al. 2009). 10.5.4.3 Fishmeal production
Mercury can cause a number of negative effects on humans Fishmeal production in South Africa has over the years been
and animals such as kidney damage, stomach disruption, transformed into a multi-million rand industry. Fish unsuitable
intestinal damage, reproductive failure, deoxyribonucleic for human consumption, together with cannery waste (heads,
acid (DNA) alteration, disruption of the nervous system, tails and guts) are converted into valuable fishmeal at various
damage to brain functions, damage to DNA and chromosomal factories along the west and south-east coasts of South Africa
damage. Allergic reactions include skin rashes, tiredness and (De Koning 2005). The process of making fishmeal from fish
headaches. Negative reproductive effects, birth defects and processing plants generates various pollutants, especially the
miscarriages are also some of the main effects of mercury odour released from the decomposing, cooking and drying of
in humans (Oosthuizen et al. 2010). The extent of mercury fish and by- products. Fishmeal driers are the largest source
exposure in communities in South Africa is largely unknown of odour pollution within food processing plants (De Koning
(Oosthuizen et al. 2010). 2005).
International responses to mercury, as it is a transboundary In response, the DEA initiated a human health risk assessment
pollutant, include the mercury guidelines under the Basel which included measurements of gases in four fish processing
Convention, international trade in mercury under the plants. The assessment included those compounds known to
Rotterdam Convention, and methylmercury under the be emitted by the fish industry that are also known to be toxic
Stockholm Persistent Organic Pollutants Convention. However, at certain concentration levels, namely hydrogen sulphide,
2013 will be of particular public importance as this will be the trimethlyamine and formaldehyde.
year of the launch of the UNEP Global Legally Binding Treaty
on Mercury. The DEA is a participant in the development of
this global, legally binding, instrument on mercury and has
already identified mercury as a national pollutant of concern.
In addition, the DEA is working on partnership with UNEP to
populate and gain a better understanding of the country’s
Air quality | 19510.6 RESPONSES TO AIR QUALITY
Box 10. 5: Declaration of priority areas in South Africa
PROBLEMS
Various air quality management instruments have been Several pollution ‘hotspots’ or priority areas exist in South
developed over the years and include environmental Africa and in line with the requirements of the NEM:AQA,
legislation, emissions inventories, dispersion modelling and two areas have been declared as priority areas: the VTAPA
concentration inventories. South Africa has responded to (first priority area to be declared – Map 10.5) and the HPA
its air pollution challenges in various ways which include (second priority area to be declared – Map 10.6), with
legislative reform, revision of ambient air quality limits, intentions to declare the expanded Waterberg as the third
proactive planning by local authorities and sector specific national priority area.
controls as indicated below:
• The promulgation of the NEM:AQA. Key elements of this Priority areas are generally areas where ambient air quality
are the establishment of a clear institutional and planning standards are being, or may be, exceeded. The declaration
framework for air quality management; of these priority areas is as a result of the high pollution
• The development of a South African Air Quality levels associated with heavy industrial activities and the
Information System (SAAQIS) to ensure the availability of associated health and negative environmental effects.
credible and readily available air quality data. This data Several activities such as heavy industries, transportation,
is in turn used to ensure that appropriate measures to landfill and waste incineration and domestic fuel burning
improve air quality are taken; are characteristic of the VTAPA (Leaner et al. 2009). A range
• The development and maintenance of an effective of activities such as industrial, mining and agricultural
governance framework for air quality management, activities which include coal-fired power stations, timber
National Framework for Air Quality Management in South and related industries, metal smelters, petrochemical
Africa, as provided for in the NEM:AQA, so as to ensure plants, heavy and small industrial operations exist in the
that current and future impacts of atmospheric emissions HPA. Following the declaration of these priority areas, Air
are avoided, minimized, mitigated or managed; Quality Management Plans (AQMPs) have been developed
• Declaration of priority areas, as provided for in the with the goal of improving air quality. In addition, the
NEM:AQA and ensuring that there are significant DEA has been investigating means of optimizing the
improvements in air quality in the declared priority areas implementation of the Vaal Triangle AQMP and this has
and compliance with the ambient standards (Box 10.5); resulted in the initiation of a medium term review of the
• Development of national, provincial, municipal and plan’s implementation status.
priority area AQMPs in fulfilment of the requirements of
the NEM:AQA in areas with poor or potentially poor air The DEA operates several ambient air quality monitoring
quality (Table 10.2); stations in the two National Priority Areas of South Africa.
• Improvement of indoor and ambient air quality in These monitor priority pollutants such as particulate matter
dense, low-income urban settlements through ambient (PM10 and PM2.5), SO2, NO2, O3, CO, Pb, benzene, toluene,
monitoring, Basa njengo Magogo (BnM) (Box 10.6), ethyl benzene and xylene (BTEX) other pollutants.
housing guidelines, energy carrier options and the
Strategy for Addressing Air Pollution in Dense, Low-
income Settlements, especially given the fact that it
is proposed that by 2020 air quality in all low-income
settlements should be in compliance with National
Ambient Air Quality Standards (NAAQS);
Air quality | 196You can also read