WORLD AIR QUALITY REPORT - 2019 Region & City PM2.5 Ranking - IQAir
←
→
Page content transcription
If your browser does not render page correctly, please read the page content below
2019
       WORLD
  AIR QUALITY
      REPORT
Region & City PM2.5 Ranking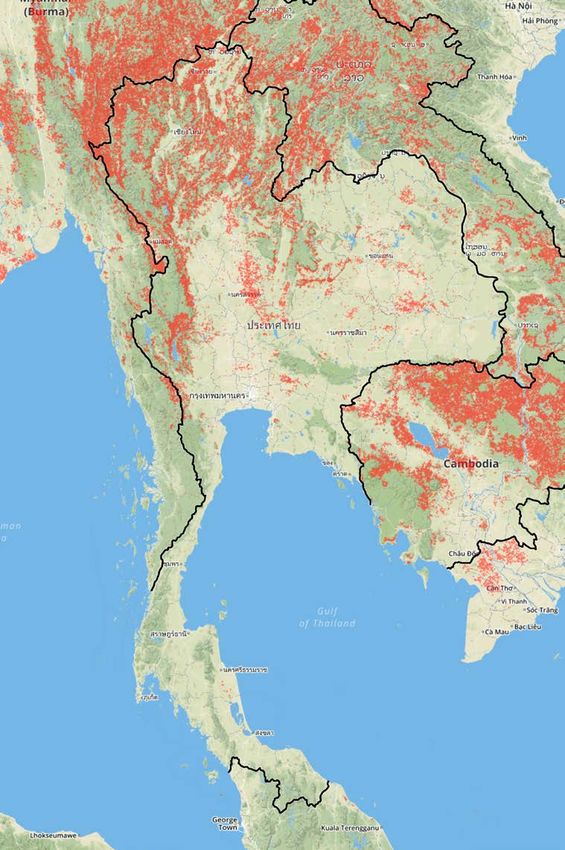
Contents
        About this report ...............................................................................................       3
        Executive summary ............................................................................................          4
        Where does the data come from? .........................................................................                5
           Why PM2.5?
        Data presentation .............................................................................................         6
           WHO Air Quality Guidelines
           US Air Quality Index (AQI)
        Global overview .................................................................................................       7
           World country ranking
           World capital city ranking
           Overview of public monitoring status

        Regional Summaries
            East Asia .................................................................................................... 10
            		            China ....................................................................................... 12
            		            South Korea .............................................................................. 13
            Southeast Asia ........................................................................................... 14
            		            Indonesia ................................................................................. 15
            		            Thailand ................................................................................... 16
            		            Vietnam ................................................................................... 17
            South Asia .................................................................................................. 18
            		            India ....................................................................................... 19
            		            Pakistan .................................................................................... 20
            Western Asia ............................................................................................... 21
            Europe ....................................................................................................... 22
            Northern America ....................................................................................... 23
            		            United States ............................................................................ 24
            Latin America & Caribbean ............................................................................ 25
            Africa .......................................................................................................... 26
            		            South Africa ............................................................................. 27
            Oceania ....................................................................................................... 28

        Next Steps .......................................................................................................      29
           What can I do?
        Methodology ...................................................................................................         30
           Data sources
           Data calculation
           Data availability
           Disclaimer
        FAQ .................................................................................................................   32
        References ......................................................................................................       33

2 |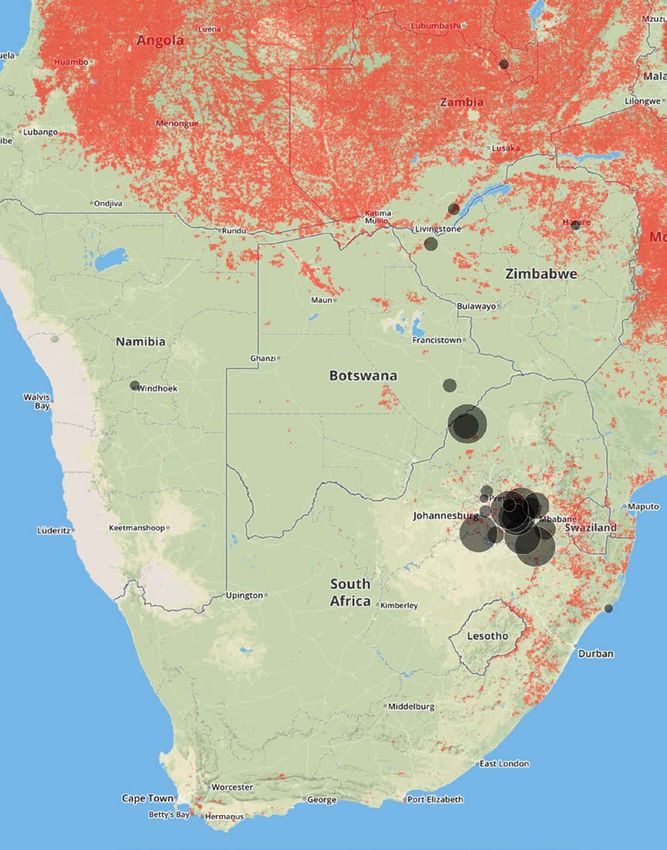
About this report
      The 2019 World Air Quality Report is based on data from the world’s largest centralized platform for real-time air
      quality data, combining efforts from thousands of initiatives run by citizens, communities, companies, non-profit
      organizations and governments.

      Through aggregating, validating and visualizing real-time data from governments and sensors operated by in-
      dividuals and organizations, IQAir strives to raise awareness of air pollution, allowing people to take action to
      improve air quality and protect their health.

      The 2019 World Air Quality Report is based on a subset of the information provided through the platform. It in-
      cludes only PM2.5 (fine particulate matter) data as acquired from ground-based air quality monitoring stations
      with high data availability.

      An extended presentation of the world’s most polluted cities during 2019 is available online, allowing further ex-
      ploration of air quality across different regions and subregions in 2019 in an interactive format. Live and forecast
      air quality information for all included locations can also be explored through the IQAir Air Quality Map, which
      presents a real-time overview of the world’s air quality data in one place.

3 |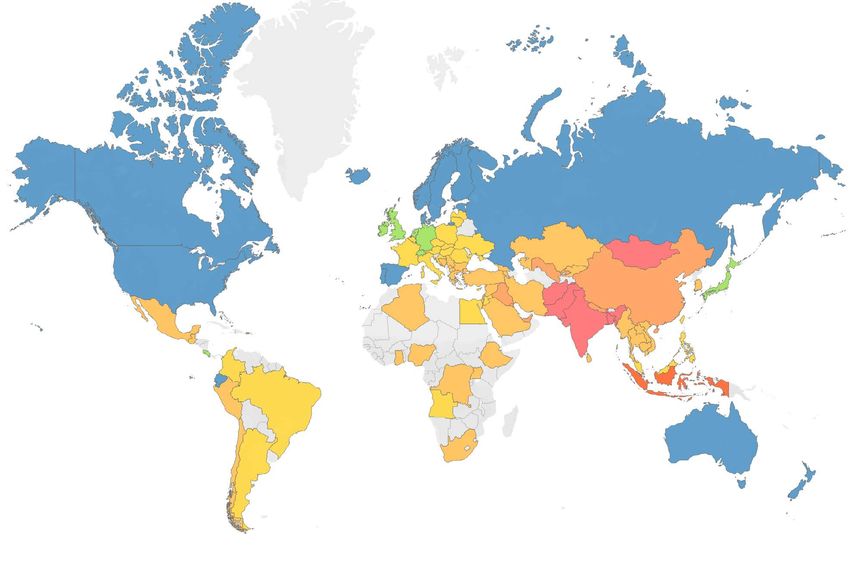
Executive summary
      Air pollution constitutes the most pressing environmental health risk facing our global population. It is estimated to
      contribute toward 7 million premature deaths a year, while 92% of the world’s population are estimated to breathe
      toxic air quality (WHO, 2016). In less developed countries, 98% of children under five breathe toxic air. As a result,
      air pollution is the main cause of death for children under the age of 15, killing 600,000 every year (WHO, 2018). In
      financial terms, premature deaths due to air pollution cost about $5 trillion in welfare losses worldwide (The World
      Bank, 2016).
                                                  This report presents PM2.5 data made publicly available during 2019,
                                                  in order to highlight the state of particulate pollution around the world
      Whilst 90% of the global                    and raise awareness about public access to air quality data. The ma-
      population breathes                         jority of this data has been published in real-time or near real-time, by
                                                  governmental sources, as well as independently operated and validat-
      air exceeding WHO                           ed non-governmental air quality monitors.
      exposure targets, vast
                                                  Regionally, South Asia, Southeast Asia, and the Western Asia carry
      populations around the                      the highest burden of fine particulate matter (PM2.5) pollution overall,
      world lack access to air                    with only 6 of 355 cities included meeting WHO annual targets in these
                                                  areas collectively. Cities within these regions also rank highly in the
      quality information.                        top of the global city ranking. Of the world’s top 30 most polluted cities
                                                  during 2019, 21 are located in India, 27 in South Asia, and all the top 30
                                                  cities are within greater Asia.

      Using a weighted population average, Bangladesh emerges as the most polluted country for PM2.5 exposure,
      based on available data. Pakistan, Mongolia, Afghanistan and India follow behind respectively, deviating from one
      another by less than 10%. Bosnia and Herzegovina is the highest ranking country in Europe for PM2.5 pollution,
      featuring as the 14th most polluted country globally, with only 4μg/m³ less than China’s national PM2.5 weighted
      average.

      Publishing real-time monitoring data is essential to tackle the urgent issue of air pollution. What is not measured
      cannot be managed, and sharing live data enables populations to respond quickly and safeguard their health.

      2019 saw a significant increase in air quality monitoring coverage, with the           Awareness of air
      number of monitoring stations included in this report increasing by more
      than 200% since the year prior. These gains are due both to expanded or new            pollution remains low
      governmental monitoring networks, as well as sensor contributions from                 in areas where
      non-governmental organizations, private industry and individuals.
                                                                                             real-time monitoring
      Still, vast populations around the world lack access to air quality information.       is limited but
      Often these areas are estimated to have some of the world’s most severe air
      pollution, putting the health of huge populations at risk. More monitoring             pollution levels may
      data is needed to bridge the information gap, and better tackle air pollution          be high.
      globally.

4 |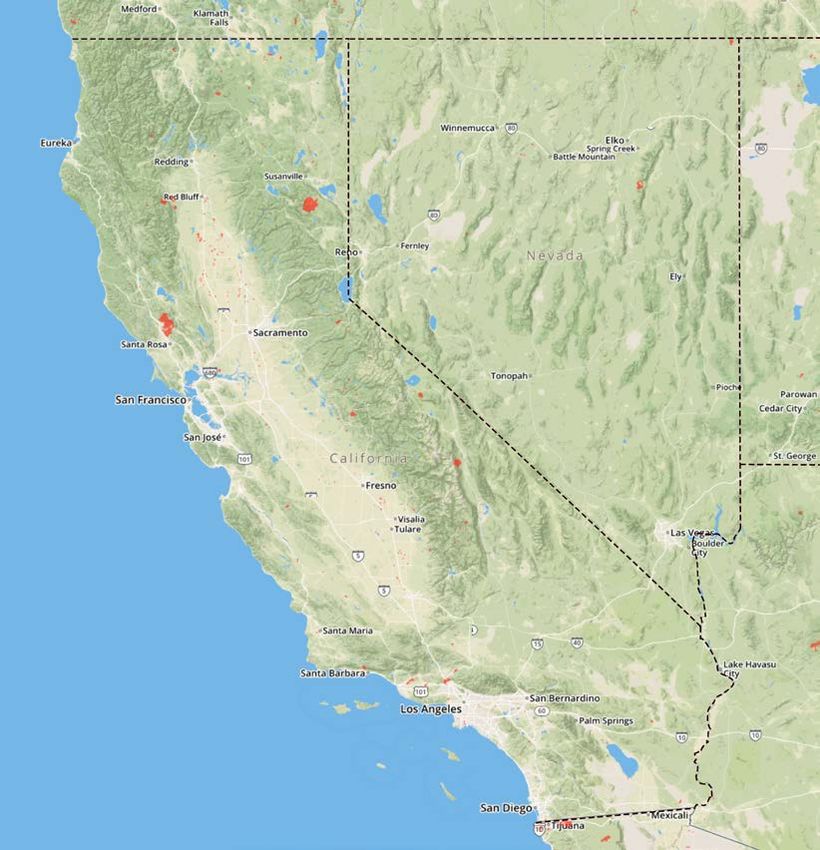
Where does the data come from?
      This report includes data aggregated from a range of ground-based PM2.5 monitoring stations. Data sources
      include real-time, hourly data from governmental monitoring stations, as well as validated PM2.5 monitors
      operated by private individuals and organizations. Some locations are additionally supplemented by govern-
      mental historical datasets of hourly PM2.5 measurements, where available.

      All measurements have been collected at a monitoring station level, and are then grouped into settlements.
      Whilst the sizes and densities of these settlements vary, the majority are urban, and so for the purpose of this
      report, all settlements are hereafter referred to as cities.

      Why PM2.5?
      This report focuses on PM2.5 concentrations, as this is the pollutant widely regarded as most harmful to human
      health. PM2.5 is defined as ambient airborne particles measuring up to 2.5 microns in size. Its microscopic size
      allows the particles to enter the blood stream via the respiratory system and travel throughout the body, causing
      far-reaching health effects, including asthma, lung cancer and heart disease. Air pollution has also been associ-
      ated with low birth weight, increased acute respiratory infections and stroke.

      Worldwide ambient air pollution accounts for1:
        - 29% of all deaths and disease from lung cancer
        - 17% of all deaths and disease from acute lower respiratory infection
        - 24% of all deaths from stroke
        - 25% of all deaths and disease from ischaemic heart disease
        - 43% of all deaths and disease from chronic obstructive pulmonary disease

      Airborne particulate matter can originate from a range of sources. Combustion
      from vehicle engines, industry, fires and coal burning represent the most common
      man-made sources, whilst sandstorms, agriculture, and chemicals reacting in
      the atmosphere represent the most common natural sources.

      1       https://www.who.int/airpollution/ambient/health-impacts/en/

5 |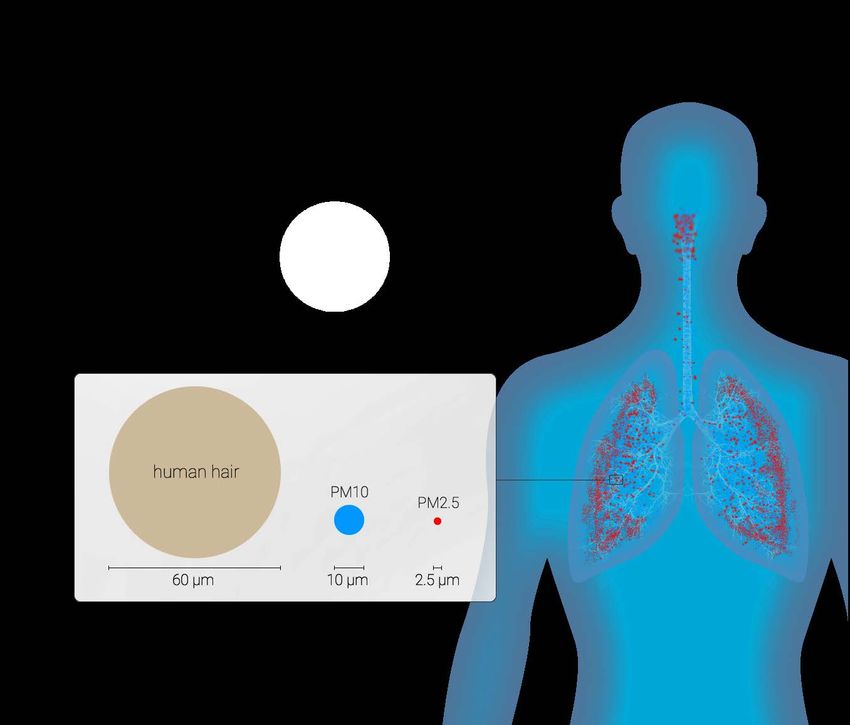
Data presentation
      In order to correlate concentration values to a more relatable reference for health risk, this report refers to two
      guidelines for PM2.5 pollution: the World Health Organization (WHO) Air Quality Guideline value for PM2.5 expo-
      sure and the United States Air Quality Index (US AQI). The color index uses the US EPA standard, supplemented
      by the WHO guideline for values under 10µg/m³.

      WHO Air Quality Guideline
      Whilst the WHO cautions that no level of PM2.5 exposure has been proven to be free of health impacts, it has
      outlined an annual mean exposure threshold of 10µg/m³ to minimize the risk of health impacts from PM2.5.

                                                WHO PM2.5 Target: 10 µg/m³

      United States Air Quality Index (US AQI)
      The US AQI is among the most widely recognized index for communicating air quality. The index converts pollutant
      concentrations into a color-coded scale of 0-500, where higher values indicate increased health risk. The US AQI
      “Good” range (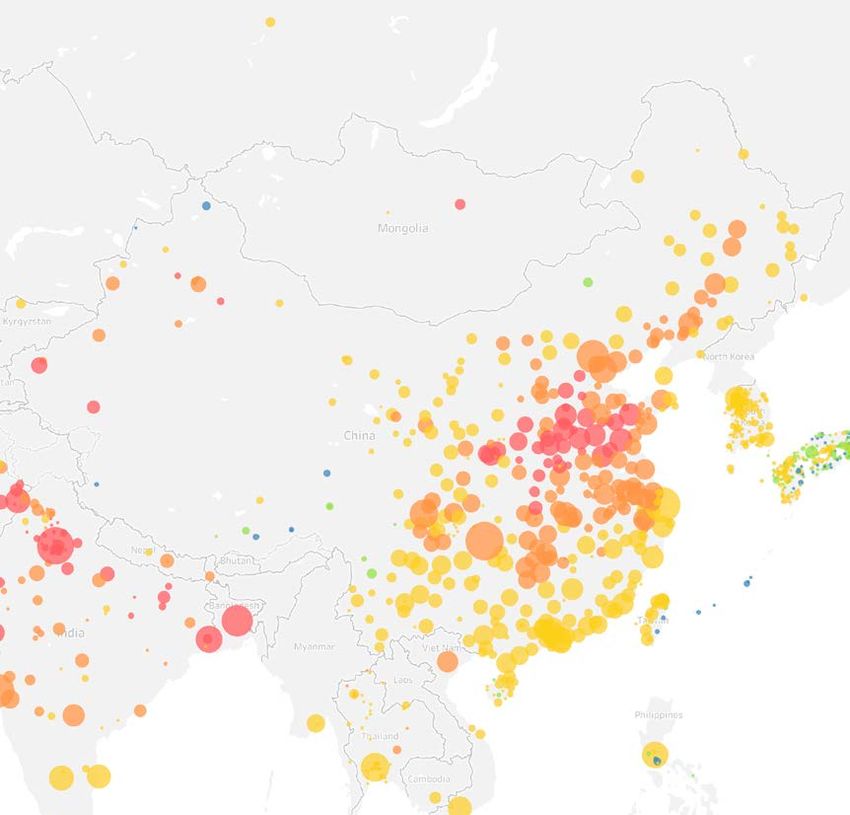
Global overview
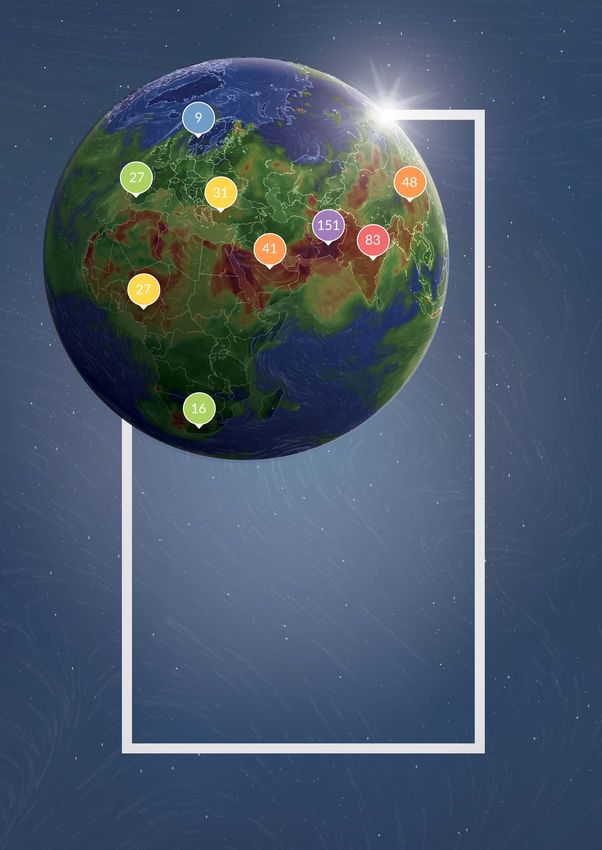
Global Country/Region PM2.5 Exposure
This map presents average PM2.5 exposure by country, as calculated from available city data and weighted by
population. Grey countries and regions indicate that these locations had insufficient PM2.5 data available for 2019.
PM2.5
(µg/m³)
250.4
150.4
55.0
45.0
35.4
20.0
12.0
10.0
WHO
guideline
Global map of estimated PM2.5 exposure by country/region in 2019
Countries and regions in East Asia, Southeast Asia and South Asia suffer from the highest annual average PM2.5
concentration weighted by population.
7 |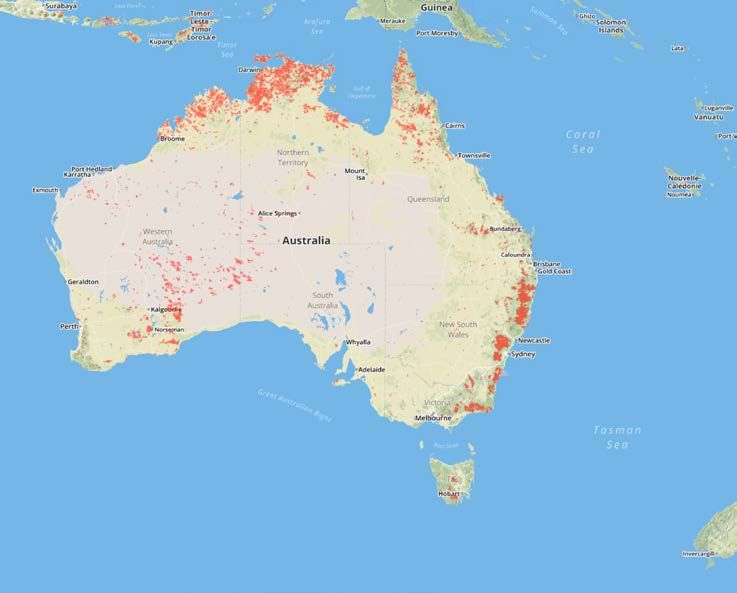
World country/region ranking
      Arranged by average PM2.5 concentration (µg/m³), weighted by population based on the available data

       1    Bangladesh             83.3      34   Laos                 23.1          67   Lithuania             14.5
       2    Pakistan               65.8      35   Chile                22.6          68   Czech Republic        14.5
       3    Mongolia               62.0      36   Greece               22.5          69   Latvia                13.3
       4    Afghanistan            58.8      37   Saudi Arabia         22.1          70   Belgium               12.5
       5    India                  58.1      38   South Africa         21.6          71   France                12.3
       6    Indonesia              51.7      39   Nigeria              21.4          72   Austria               12.2
       7    Bahrain                46.8      40   Algeria              21.2          73   Japan                 11.4
       8    Nepal                  44.5      41   Cambodia             21.1          74   Germany               11.0
       9    Uzbekistan             41.2      42   Israel               20.8          75   Netherlands           10.9
      10    Iraq                   39.6      43   Turkey               20.6          76   Switzerland           10.9
      11    China Mainland         39.1      44   Hong Kong SAR        20.3          77   Ireland               10.6
      12    United Arab Emirates   38.9      45   Guatemala            20.2          78   United Kingdom        10.5
      13    Kuwait                 38.3      46   Ethiopia             20.1          79   Costa Rica            10.4
      14    Bosnia & Herzegovina   34.6      47   Georgia              20.1          80   Puerto Rico           10.2
      15    Vietnam                34.1      48   Mexico               20.0          81   Russia                 9.9
      16    Kyrgyzstan             33.2      49   Cyprus               19.7          82   Spain                  9.7
      17    North Macedonia        32.4      50   Malaysia             19.4          83   Luxembourg             9.6
      18    Syria                  32.2      51   Croatia              19.1          84   Denmark                9.6
      19    DR Congo               32.1      52   Singapore            19.0          85   Malta                  9.4
      20    Myanmar                31.0      53   Poland               18.7          86   Portugal               9.3
      21    Ghana                  30.3      54   Romania              18.3          87   USA                    9.0
      22    Uganda                 29.1      55   Jordan               18.3          88   Ecuador                8.6
      23    Armenia                25.5      56   Egypt                18.0          89   Australia              8.0
      24    Bulgaria               25.5      57   Philippines          17.6          90   Canada                 7.7
      25    Sri Lanka              25.2      58   Taiwan               17.2          91   New Zealand            7.5
      26    South Korea            24.8      59   Italy                17.1          92   Norway                 6.9
      27    Iran                   24.3      60   Ukraine              16.6          93   Sweden                 6.6
      28    Thailand               24.3      61   Slovakia             16.1          94   Estonia                6.2
      29    Kazakhstan             23.6      62   Angola               15.9          95   Finland                5.6
      30    Kosovo                 23.5      63   Brazil               15.8          96   Iceland                5.6
      31    Macao SAR              23.5      64   Colombia             14.6          97   U.S. Virgin Islands    3.5
      32    Serbia                 23.3      65   Argentina            14.6          98   Bahamas                3.3
      33    Peru                   23.3      66   Hungary              14.6

8 |
World regional capital city ranking
      Arranged by average annual PM2.5 concentration (µg/m³)

                                            1. Delhi, India (98.6)
                                                                                               [Continued]
                         2. Dhaka, Bangladesh (83.3)                                       44. Singapore, Singapore (19.0)
                                              3. Ulaanbaatar, Mongolia (62.0)              45. Bucharest, Romania (18.4)
                                              4. Kabul, Afghanistan (58.8)                 46. Ankara, Turkey (18.4)
                                       5. Jakarta, Indonesia (49.4)                        47. Manila, Philippines (18.2)
                                       6. Kathmandu, Nepal (48.0)                         48. Warsaw, Poland (17.3)
                                      7. Hanoi, Vietnam (46.9)                            49. Kyiv, Ukraine (16.6)
                                      8. Manama, Bahrain (46.8)                           50. Luanda, Angola (15.9)
                                   9. Beijing, China (42.1)                               51. Vilnius, Lithuania (15.8)
                                 10. Tashkent, Uzbekistan (41.2)                         52. Canberra, Australia (15.0)
                                 11. Baghdad, Iraq (39.6)                                53. Paris, France (14.7)
                                12. Abu Dhabi, United Arab Emirates (38.4)              54. Brussels, Belgium (14.1)
                                13. Kuwait City, Kuwait (38.3)                          55. Budapest, Hungary (14.0)
                              14. Islamabad, Pakistan (35.2)                           56. Taipei, Taiwan (13.9)
                              15. Sarajevo, Bosnia & Herzegovina (34.1)                57. Bratislava, Slovakia (13.6)
                             16. Bishkek, Kyrgzstan (33.2)                             58. Riga, Latvia (13.3)
                            17. Skopje, North Macedonia (32.4)                         59. Bogota, Colombia (13.1)
                            18. Kinshasa, DR Congo (32.1)                              60. Rome, Italy (12.9)
                           19. Yangon, Myanmar (31.0)                                 61. Buenos Aires, Argentina (12.4)
                           20. Accra, Ghana (30.3)                                    62. Vienna, Austria (12.3)
                           21. Kampala, Uganda (29.1)                                 63. Tokyo, Japan (11.7)
                          22. Santiago, Chile (27.7)                                  64. Prague, Czech Republic (11.5)
                         23. Sofia, Bulgaria (26.8)                                   65. London, United Kingdom (11.4)
                        24. Tehran, Iran (25.9)                                       66. Cape Town, South Africa (11.2)
                        25. Yerevan, Armenia (25.5)                                   67. Bern, Switzerland (10.9)
                        26. Colombo, Sri Lanka (25.2)                                 68. Amsterdam, Netherlands (10.7)
                       27. Seoul, South Korea (24.8)                                  69. Dublin, Ireland (10.6)
                       28. Lima, Peru (23.7)                                          70. Moscow, Russia (10.0)
                      29. Nur-Sultan, Kazakhstan (23.6)                               71. Luxembourg, Luxembourg (9.9)
                      30. Pristina, Kosovo (23.5)                                     72. Berlin, Germany (9.7)
                      31. Belgrade, Serbia (23.3)                                     73. Copenhagen, Denmark (9.6)
                      32. Vientiane, Laos (23.1)                                      74. Lisbon, Portugal (9.4)
                      33. Bangkok, Thailand (22.8)                                    75. Madrid, Spain (9.2)
                      34. Athens, Greece (22.3)                                       76. Quito, Ecuador (8.6)
                     35. Riyadh, Saudi Arabia (22.1)                                  77. Oslo, Norway (7.5)
                     36. Tel Aviv-Yafo, Israel (21.8)                                 78. Ottawa, Canada (7.3)
                     37. Kuala Lumpur, Malaysia (21.6)                                79. Wellington City, New Zealand (6.7)
                     38. Algiers, Algeria (21.2)                                      80. Stockholm, Sweden (6.1)
                     39. Phnom Penh, Cambodia (21.1)                                  81. Helsinki, Finland (6.0)
                     40. Mexico City, Mexico (20.5)                                   82. Tallinn, Estonia (5.5)
                    41. Addis Ababa, Ethiopia (20.1)                                  83. Reykjavik, Iceland (5.5)
                    42. Tbilisi, Georgia (20.1)                                       84. Charlotte Amalie, U.S. Virgin Islands (3.6)
                    43. Nicosia, Cyprus (19.2)                                        85. Nassau, Bahamas (3.3)
         0   10   20   30    40    50    60    70    80    90 100 110           0   10    20     30     40      50     60      70
        WHO PM2.5 Target                                                        WHO PM2.5 Target

      The capital city ranking compares annual PM2.5 averages in 2019 among capital cities available in the report’s
      dataset. Countries within Asia and the Western Asia populate the top of the regional capital city ranking. Delhi
      tops this ranking for the second consecutive year, with its annual PM2.5 level nearly 10 times the WHO target.

9 |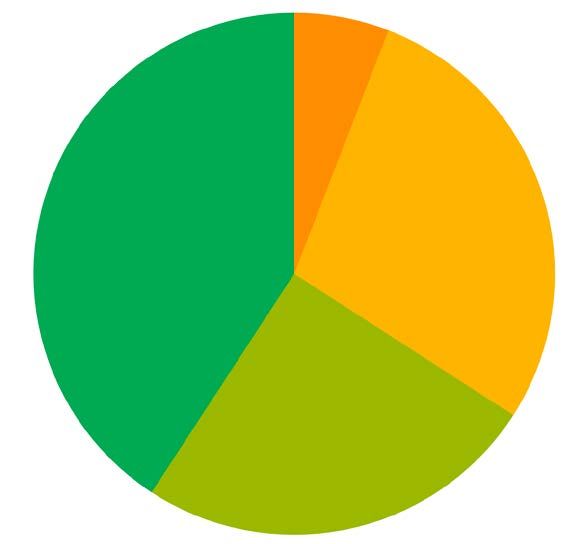
Overview of public monitoring status
       Public air quality monitoring varies considerably between countries and regions. Mainland China, Japan and the
       United States have the world’s largest governmental monitoring networks that publish air quality data continu-
       ously in real-time. The below map illustrates the unequal global distribution of PM2.5 air quality monitors, which
       met the availability criteria for the year 2019.

                             Global distribution of PM2.5 air quality monitoring stations included in this report.
                 Red dots indicate government stations. Blue dots indicate data from independently operated air monitors.

       The map indicates a lack of monitoring data in numerous populated areas, particularly within the African and
       South American continents.

       Developed countries tend to have more data availability and public access, than developing countries.

       Locations which lack governmental, real-time monitoring networks can benefit from low-cost air quality sensors,
       which can be installed and managed with fewer resources, and provide an opportunity to accelerate access to
       air quality information. Data collected from low-cost monitoring stations and validated by the IQAir AirVisual
       platform’s artificial intelligence, is also included in this report. These monitors provide the only real-time publicly
       available air quality data for Algeria, Andorra, Angola, Armenia, the Bahamas, Cambodia, Costa Rica, DR Congo,
       Egypt, Ghana, Iraq, Jordan, Kyrgyzstan, Laos, Latvia, Myanmar, Nigeria, Saudi Arabia, Syria and Serbia.

10 |
EAST ASIA
China Mainland | Hong Kong SAR | Japan | Macau SAR | Mongolia | South Korea | Taiwan
PM2.5 Country/Region Ranking
(µg/m³)
1. Mongolia (62.0)
250.4
2. China Mainland (39.1)
3. South Korea (24.8)
150.4
4. Macau SAR (23.5)
55.4
5. Hong Kong SAR (20.3)
35.4
6. Taiwan (17.2)
12.0
10.0 7. Japan (11.4)
0 10 20 30 40 50 60 70 80 90 100
Available cities with real time monitoring in 2019 PM2.5 annual mean (µg/m³)
SUMMARY
16.9%
Regional cities which met the
Data collected in 2015 revealed that 35% of global premature
deaths from air pollution occurred in East Asia, followed closely
by South Asia (33%) (Clean Air Coalition, 2019). Overall the re-
gion has taken significant steps to mitigate the problem, from
WHO PM2.5 target in 2019 establishing national monitoring networks and regulating emis-
sion sources.
Whilst pollution sources vary across the region, common con-
5.9 110.1 tributors of airborne particulates include a dependence on coal
Obihiro, Japan Hotan, China Mainland for energy production, a lack of regulations and enforcement
of industrial emissions, oil-based road transportations and do-
mestic heating. Transboundary pollution is a concern for Hong
WHO target Good Moderate Unhealthy for Sensitive Groups Unhealthy Very Unhealthy Hazardous Kong, Taiwan and South Korea, as seasonal dust storms and
Range of annual mean PM2.5 (µg/m³) across regional cities industry emissions can travel great distances, and affect much
of the region (TAQMN, 2019).
Most Polluted Regional Cities Cleanest Regional Cities
MONITORING STATUS
Rank City 2019 AVG
2018 Rank City 2019 AVG
2018
Obihiro, Japan
All the countries and regions within East Asia included in this re-
1 Hotan, China Mainland 110.1 1 5.9
port have public, real-time governmental monitoring networks.
2 Kashgar, China Mainland 87.1 2 Okinawa, Japan 6.2 Overall, the region has some of the best data availability and
3 Shangqiu, China Mainland 72.6 3 Hakuba, Japan 6.3
coverage globally.
4 Anyang, China Mainland 70.3 4 Linzhi, China Mainland 6.5 Among the countries included in this report, mainland China’s
5 Handan, China Mainland 64.3 5 Kitami, Japan 6.5 national air monitoring network is the most numerous with
nearly 2,200 stations, while Japan’s is the densest in terms of
6 Shijiazhuang, China 64.0 6 6.7
Mainland Ebina, Japan monitors per area, with a station for every 210 km2, roughly 400
7 Xianyang, China Mainland 63.7 7 Ngari, China Mainland 6.9 stations shy of mainland China.
8 Xingtai, China Mainland 63.5 8 Minamiashigara, Japan 7.5
During 2019, Mongolia’s national monitoring coverage expand-
9 Puyang, China Mainland 63.4 9 Gero, Japan 7.5 ed beyond Ulaanbaatar for the first time, thanks to the addi-
tional deployment of sensors by a NGO. Still, while monitoring
10 Shihezi, China Mainland 63.3 10 Gojo, Japan 7.6
stations grew from eight in 2018 to 37 in 2019, monitoring data
11 Laiwu, China Mainland 63.1 11 Suzu, Japan 7.7 is still sparse throughout the country.
12 Luoyang, China Mainland 62.4 12 Hadano, Japan 7.7
13 Hebi, China Mainland 62.1 13 Minami, Japan 7.8
14 Ulaanbaatar, Mongolia 62.0 14 Otofuke, Japan 7.9
15 Linfen, China Mainland 61.7 15 Naha, Japan 8.0
11 |CHINA MAINLAND
PM2.5 Beijing Guangzhou Chengdu
(µg/m³)
Shanghai Shenzhen Chongqing
100
250.4
90
80
70
150.4 60
50
55.4
40
30
35.4
20
10
12.0
10.0 0
2015 2016 2017 2018 2019
Available cities with real time monitoring in 2019 PM2.5 annual mean (µg/m³) over 5 years
PM2.5: µg/m³ 2019
Annual JAN FEB MAR APR MAY JUN JUL AUG SEP OCT NOV DEC
AVG
Beijing 42.1 54.1 53.1 51.4 47.6 36.8 38.4 35.8 22.1 35.2 39.8 45.4 46.0
Shanghai 35.4 49.3 41.6 50.9 40.0 33.0 29.3 26.1 24.5 21.7 31.1 27.4 49.2
Guangzhou 28.9 45.5 24.8 27.9 23.2 20.3 15.6 18.0 22.4 28.4 37.6 41.5 41.2
Shenzhen 23.4 35.6 18.7 21.2 18.7 15.8 9.6 13.7 16.4 23.8 32.6 36.1 37.4
Chengdu 42.4 76.6 55.7 44.0 39.6 32.7 24.0 22.5 28.2 29.5 31.0 47.9 77.1
Chongqing 37.1 74.6 47.5 46.5 29.7 30.4 22.6 19.7 23.0 29.0 23.3 36.3 62.3
PROGRESS BEIJING, CHINA
Whilst 48 Chinese cities feature among the top 100 most polluted cities, the quantity of cities
covered also indicates the country’s strong commitment to air quality monitoring, with what now
constitutes one of the world’s leading national monitoring networks. Since implementing its Air Pol- 2009 17.8% 11.6% 44.9% 15.7% 5.5
%
lution Prevention and Control Action Plan in 2013 (Huang, Pan, Guo, & Li, 2018), China has achieved
remarkable reductions in PM2.5 levels in numerous major cities, notably Beijing [see below]. 6.8
2010 20.3% 12.3% 38.1% 17.3% %
CHALLENGES 23.6% 11.5% 35.1% 13.9% 8.4%
2011
Whilst air quality in many key Chinese cities is improving, significant challenges remain. These
include substantial reliance on coal as part of China’s energy mix1 (BP, 2019), which is a principal 2012
6.5
%
22.1% 11.3% 37.3% 14.4% 5.1
%
contributor to ambient PM2.5 emissions, and pollutants that form PM2.5 in the atmosphere (SO2
and NOx). Although China is achieving the largest growth of any country in renewable energies, 2013 5.2 19.6% 12.8% 37.9% 13.3% 8.5%
%
it still accounts for approximately half the world’s coal consumption, and plans to continue ex-
pansion of new coal power plants (Chung, 2019). Diesel emissions from transport also remain an
2014 7.0% 19.3% 12.0% 38.7% 12.3% 7.7%
important contributor (International Council on Clean Transportation, 2019). In 2019, only 2% of
the 400 cities in this report achieved the WHO’s annual PM2.5 target ofSOUTH KOREA
PM2.5 Seoul Incheon Daejeon
(µg/m³)
Busan Daegu Ulsan
26
250.4
25
24
23
150.4 22
21
55.4
20
19
35.4
18
17
12.0
10.0 16
2017 2018 2019
Available cities with real time monitoring in 2019 PM2.5 annual mean (µg/m³) over 3 years
PM2.5: µg/m³ 2019
Annual JAN FEB MAR APR MAY JUN JUL AUG SEP OCT NOV DEC
AVG
Seoul 24.8 37.6 35.5 45.5 20.3 28.8 19.4 18.8 16.2 11.9 15.4 20.3 28.9
Busan 21.0 28.0 27.8 29.6 19.3 24.8 21.0 18.1 19.0 13.0 12.6 16.4 22.5
Incheon 22.8 32.3 30.7 40.9 19.1 25.4 17.0 18.2 17.8 13.4 15.3 18.4 24.9
Daegu 22.1 33.3 31.9 32.2 17.8 22.8 19.7 16.1 15.9 12.0 13.8 21.8 29.0
Daejeon 21.8 33.7 34.4 38.4 16.3 21.9 18.4 13.7 15.0 11.4 14.3 20.5 24.5
Ulsan 20.1 25.7 26.2 28.8 18.1 25.4 21.8 18.0 17.9 12.3 10.4 15.4 21.0
PROGRESS SEOUL, SOUTH KOREA
South Korea has a dense air quality monitoring network, highlighting a strong commitment to tracking
and improving air quality. From 2018 to 2019, the national monitoring network grew its urban pollution 2016 2017 2018 2019
monitoring, including more PM2.5 monitoring. Much of Korea’s particulate pollution is seasonal, with 100%
4.1% 5.2% 6.0% 6.5%
many cities experiencing nearly double the amount of PM2.5 during winter months than in summer
months, as indicated by 2019’s data.
90%
15.9% 15.8% 12.4% 11.4%
Following a pollution peak in March 2019, the government legislated to categorize the nation’s air pollution a
“social disaster”. This enabled access to emergency funds, and a range of measures to tackle seasonal emis-
80%
sions were introduced, effective from December to March (Chung, 2019). These include closing up to a quar-
ter of its coal-fired power plants, capping operations at other coal-fired power plants at 80%, and restrictions
on emission grade 5 vehicles in metropolitan areas (Regan, 2019). Since these new rules were introduced 70%
towards the end of the 2019 winter pollution peak, their impacts on pollution levels remain to be seen in 2020.
CHALLENGES 60%
51.2%
Not a single city in South Korea met the WHO’s annual PM2.5 guideline of 10μg/m3 in 2019. South Korea 58.3% 58.4%
50%
had the highest average PM2.5 level during 2019 of any OECD country. Air pollution remains a problem 66.0%
shared by both urban and rural areas, with South Korea’s most polluted and cleanest locations only varying
by 15 μg/m3 in annual PM2.5 concentration. While trans-boundary air pollution can contribute additional 40%
PM2.5 from neighboring countries, it is estimated that approximately half the country’s PM2.5 is generated
domestically [1]. The South Korean government’s policies for air pollution are mostly focused on temporary
30%
measures and emission reduction policies. This may be the reason that air quality improvements in South 5.8%
Korea have stagnated for the past several years.
20% 6.7%
26.7%
HIGHLIGHT: 2019 LEGISLATURE 6.2%
24.6%
10% 4.8%
South Korea ranks highest among OECD countries for average annual PM2.5 exposure. On a city level, 61 17.0%
14.5%
of the top 100 most polluted cities in OECD countries are located in South Korea. This is a considerable 9.2%
increase from 44 ranked cities in 2018. Coal plants contribute to more than 40% of Korea’s energy mix 0%
(Regan, 2019). Whilst these emissions are now being limited during the winter months of December to
March under new governmental measures, a shift away from fossil fuel usage in industry, power genera- Annual hours spent in different PM2.5 pollution levels
tion and transportation is needed to more effectively tackle particulate pollution in the long-term.
13 |SOUTHEAST ASIA
Cambodia | Indonesia | Laos | Malaysia | Myanmar | Philippines | Singapore | Thailand | Vietnam
PM2.5 Country/Region Ranking
(µg/m³)
1. Indonesia (51.7)
250.4
2. Vietnam (34.1)
3. Myanmar (31.0)
4. Thailand (24.3)
150.4
5. Laos (23.1)
55.4
6. Cambodia (21.1)
35.4 7. Malaysia (19.4)
8. Singapore (19.0)
12.0
10.0
9. Philippines (17.6)
0 10 20 30 40 50 60 70 80 90 100
Available cities with real time monitoring in 2019 PM2.5 annual mean (µg/m³)
SUMMARY
3.2%
Regional cities which met the
Southeast Asia’s emission sources include vehicle exhaust,
biomass burning, industry and coal-based energy production.
Rapid growth and development often exacerbates air quality
conditions in metropolitan areas, as construction and increased
WHO PM2.5 target in 2019 energy consumption result in increased ambient PM2.5. Jakarta
is the most polluted capital city for PM2.5 pollution in this re-
gion, closely followed by Hanoi. Jakarta’s annual PM2.5 level is
almost 20% higher than that of Beijing during 2019.
4.0 81.3
Calamba, Philippines South Tangerang, Indonesia The region is also susceptible to strong seasonal variations.
Open burning, the agricultural practice of quickly clearing land
for cultivation of future crops, commonly influences air quality
WHO target Good Moderate Unhealthy for Sensitive Groups Unhealthy Very Unhealthy Hazardous across borders from July to November, whilst the region’s wet
Range of annual mean PM2.5 (µg/m³) across regional cities season brings lower PM2.5 levels as monsoon rains wash out
airborne particulates and contribute to cleaner skies (Walton,
2019).
Most Polluted Regional Cities Cleanest Regional Cities
Rank City 2019 AVG Rank City 2019 AVG MONITORING STATUS
1 South Tangerang, Indonesia 81.3 1 Calamba, Philippines 4.0
Apart from Thailand and Malaysia which have substantial
2 Bekasi, Indonesia 62.6 2 Tawau, Malaysia 8.6 monitoring networks, public governmental PM2.5 monitoring in
3 Pekanbaru, Indonesia 52.8 3 Carmona, Philippines 9.1 Southeast Asia is relatively sparse, with stations primarily locat-
ed in major cities. Within the region, 159 cities have PM2.5 data.
4 Pontianak, Indonesia 49.7 4 Kapit, Malaysia 9.5 Efforts from non-governmental data contributors have provided
5 Jakarta, Indonesia 49.4 5 Limbang, Malaysia 9.7
about three quarters of the region’s data coverage. Non-gov-
ernmental monitors provide the only real-time data available in
6 Hanoi, Vietnam 46.9 6 Bongawan, Malaysia 10.1 Cambodia and Laos.
7 Talawi, Indonesia 42.7 7 Sandakan, Malaysia 10.4
Bangkok, Thailand has the highest density of PM2.5 stations out
8 Nakhon Ratchasima, 42.2 8 Tanjong Malim, Malaysia 11.3 of any city included in this report, with 160 stations in the city
Thailand
alone.
9 Saraphi, Thailand 41.3 9 Mukah, Malaysia 11.3
10 Surabaya, Indonesia 40.6 10 Legazpi, Philippines 11.3
11 Pai, Thailand 38.9 11 Balanga, Philippines 11.4
12 Hang Dong, Thailand 38.0 12 Phuket, Thailand 11.4
13 Chiang Rai, Thailand 37.0 13 Labuan, Malaysia 11.5
14 Mae Rim, Thailand 36.9 14 Keningau, Malaysia 11.5
15 Mueang Lamphun, Thailand 36.9 15 Putatan, Malaysia 11.6
14 |INDONESIA
PM2.5 Jakarta Pekanbaru Ubud
(µg/m³)
Surabaya South Tangerang Bekasi
100
250.4
90
80
70
150.4 60
50
55.4
40
30
35.4
20
10
12.0
10.0 0
2016 2017 2018 2019
Available cities with real time monitoring in 2019 PM2.5 annual mean (µg/m³) over 4 years
PM2.5: µg/m³ 2019
Annual JAN FEB MAR APR MAY JUN JUL AUG SEP OCT NOV DEC
AVG
Jakarta 49.4 24.2 34.5 31.2 46.2 58.3 67.2 63.4 53.4 57.1 60.4 53.3 43.2
Surabaya 40.6 -- -- -- -- 33.3 46.9 49.3 34.5 33.8 36.2 37.5 47.8
Pekanbaru 52.8 -- 29.2 35.5 20.7 21.8 23.5 46.6 71.6 214.9 47.5 34.9 21.5
South Tangerang 81.3 44.1 61.4 48.9 60.9 87.2 107.6 102.9 90.5 100.7 104.4 88.6 76.1
Ubud 27.9 20.6 13.0 19.3 25.0 21.3 32.4 33.5 30.0 32.0 32.5 27.9 28.3
Bekasi 62.6 52.1 65.7 56.4 66.1 74.6 81.2 -- 63.3 62.9 65.2 60.9 55.9
PROGRESS JAKARTA, INDONESIA
During 2019, Indonesia experienced both a substantial increase in its live air monitoring coverage, as
2016 2017 2018 2019
well as numerous high-profile air pollution events. The government’s live PM2.5 monitoring network
100%
grew from 6 to 42 stations, while individuals and non-governmental organizations also contributed
8.6%
significantly, by more than doubling the number of low-cost community sensors deployed nationwide.
90% 22.1%
Grassroots efforts have further escalated the national pollution conversation. In July 2019, residents
united under the Clean Air Coalition Initiative Movement sought legal action against the government 32.2%
for breaching citizens’ rights to a clean and healthy environment (Smith, 2019). The final verdict of the 80% 22.9% 38.2%
lawsuit is still pending.
70%
CHALLENGES
32.4%
Seasonal agricultural burning practices, especially seasonal forest fires, rapid urban development, open 60%
burning of household waste, and a reliance on coal-based energy present primary sources of particulate 28.2%
pollution in Indonesia. Key cities such as Jakarta, Badung and Denpasar all experienced worse air quality in
50%
2019 than the year prior, largely as a result of escalated open burning in July through October (BBC, 2019). 29.8%
53.4%
40%
HIGHLIGHT: JAKARTA
Jakarta ranks as the most polluted capital city in Southeast Asia in 2019, and the 5th most polluted 30%
capital city in this global report (up from its 10th position in 2018). 29.3%
42.7%
The Jakarta metropolitan area is home to more than 30 million residents and growing. In the next decade, 20%
26.7%
it is estimated that Jakarta will become the world’s biggest megacity (Kutty, 2018), with a population of
35.6 million. The city’s rapid growth has coincided with heightened PM2.5 levels, as the growing popu- 4.2%
10%
lation adds to its notorious traffic congestion, and coal-based energy demand. Since 2017, PM2.5 levels
in the city have increased by 66%. In 2019, residents were exposed to more than 3 times the amount of 10.9% 7.9%
hours in the “Unhealthy” range (US AQI 150+) than two years prior. Currently plans are underway to build 0% 3.4%
4 more coal-fired power plants encircling the capital region, which may add significant extra exposure risk
for the capital’s residents (Coca, 2019). Annual hours spent in different PM2.5 pollution levels
15 |THAILAND
PM2.5 Bangkok Nakhon Ratchasima Mae Hong Son
(µg/m³)
Nonthaburi Chiang Mai Khon Kaen
250.4
40
35
150.4
55.4
30
35.4
25
12.0
10.0
2017 2018 2019
Available cities with real time monitoring in 2019 PM2.5 annual mean (µg/m³) over 3 years
PM2.5: µg/m³ 2019
Annual JAN FEB MAR APR MAY JUN JUL AUG SEP OCT NOV DEC
AVG
Bangkok 22.8 47.4 24.1 27.7 19.0 19.6 9.4 10.2 7.6 20.4 23.2 30.2 34.2
Nonthaburi 23.2 70.6 29.4 29.4 19.1 19.2 9.5 10.1 7.6 21.2 25.1 32.9 38.9
Nakhon Ratchasima 42.2 42.1 67.9 68.0 41.4 28.3 17.1 15.7 -- -- -- -- 32.6
Chiang Mai 32.3 24.4 47.2 98.7 74.1 33.6 7.8 6.8 7.9 15.8 16.8 23.0 33.1
Mae Hong Son 35.3 29.4 46.8 116.1 99.7 21.3 11.5 5.9 4.7 10.1 9.5 13.1 24.6
Khon Kaen 36.4 51.6 67.2 68.6 41.5 29.2 17.4 16.9 15.8 29.6 26.3 31.4 42.6
PROGRESS
The Thai government has established a substantial network of air quality monitoring stations, adding 15
new stations in 2019. Non-governmental data contributors however, supply the majority (76%) of monitor-
ing stations nationally. Outside of the US this is the largest network of community-contributed, lower-cost
monitors. The publication and engagement around this data has helped raise a national dialogue around air
quality and increase public awareness on the issue.
Bangkok is the city with the most public PM2.5 stations, globally. At the same time, the city’s annual PM2.5
average has gradually improved over the last 3 years. Despite improvements, Bangkok’s annual PM2.5
average remains more than four times the WHO target.
CHALLENGES
Much of Thailand’s air pollution is seasonal, with pollution peaking during the dry season from Decem-
ber to April. Major sources of emissions in metropolitan areas such as Bangkok include inefficient,
diesel-fueled transportation, factories and construction (UNEP, 2019) and seasonal trans-boundary
impacts from neighboring provinces and countries, while agricultural regions are more exposed to
pollution from open agricultural and waste burning. Thailand experienced several high-profile air pol-
lution episodes during 2019. In January, hundreds of schools were closed in Bangkok to limit exposure
to polluted air. March and April saw intense air pollution across the northern region, including Chiang
Mai (Kuhakan, 2019).
HIGHLIGHT: OPEN BURNING PRACTICES
The annual practice of open burning is commonly used in agricultural areas to clear land for the
following season’s cultivation. Whilst the practice is beneficial to farmers as it requires few resources
and quickly eliminates agricultural waste, open burning can cause far-reaching air pollution, some-
times lasting for weeks or months at a time. The top five most polluted cities here are all located in
Thailand’s Northern agricultural areas, commonly affected by open burning from February to April
(Pasukphun, 2018). Map of acreage burned in 2019
16 |VIETNAM
PM2.5 Hanoi Ho Chi Minh City
(µg/m³)
Hue Da Nang
60
250.4
50
150.4
40
55.4
35.4 30
12.0
10.0 20
2016 2017 2018 2019
Available cities with real time monitoring in 2019 PM2.5 annual mean (µg/m³) over 4 years
PM2.5: µg/m³ 2019
Annual JAN FEB MAR APR MAY JUN JUL AUG SEP OCT NOV DEC
AVG
Hanoi 46.9 59.3 36.0 50.2 40.3 45.8 36.5 30.4 33.1 48.3 43.2 66.3 72.7
Ho Chi Minh City 25.3 34.1 17.5 22.5 18.1 23.9 18.6 18.9 17.3 26.7 29.8 39.0 37.0
Hue 28.6 -- 41.8 53.5 45.2 25.9 12.2 11.1 12.6 25.0 27.0 36.9 37.3
Da Nang 25.9 40.5 28.3 36.0 -- -- 22.6 30.0 29.9 18.2 12.0 28.1 26.4
PROGRESS HANOI, VIETNAM
Whilst Vietnam has a relatively small governmental air quality monitoring network, covering only Hanoi 2016 2017 2018 2019
and Ho Chi Minh City, numerous independently operated PM2.5 sensors have been brought online by indi-
100%
viduals and local organizations in 2019. These contributions currently outnumber governmental monitor- 2.6%
ing stations, tripling the number of live PM2.5 monitoring stations within the country. With the publication
of real-time data, air quality has become a national talking point. The government has responded with
90% 20.3%
positive efforts, including the first Vietnamese public advisory on air pollution, which outlined a 14-step 20.2% 24.8%
guideline for reducing exposure (Anh, 2019), expanding their monitoring network (Truong, 2020) and an 31.4%
update to the Vietnam Environment Administration Technical guidance on calculation and publication of 80%
Vietnam’s air quality index (Bai, 2019).
70%
CHALLENGES 17.4% 25.6%
Vietnam’s rapid development and urbanization poses severe challenges to managing its PM2.5 pollution. 60%
In 2019, Hanoi overtook Beijing in the ranking of global capital cities. Hanoi was also 2019’s most polluted 33.0%
city in Southeast Asia for PM2.5 pollution, outside of Indonesia. Research done by Vietnamese experts 26.9%
showed that Vietnam suffers between 10.8 – 13.2 billion USD worth of economic losses associated with 50%
ambient air pollution each year, equivalent to about 5% of the country’s GDP (VNA, 2020).
Rapid development coupled with weak emission standards for power plants, vehicles and industries and a 40%
high and rising share of coal in power generation contribute to high air pollution levels in bigger cities. Viet- 45.5%
nam’s coal consumption doubled and oil consumption increased by 30% over the past five years (BP, 2019).
30% 45.9%
HIGHLIGHT: HEAVY SMOG SPARKS ENVIRONMENTAL LAW 34.0%
40.2%
20%
Following several high-pollution episodes in Hanoi during 2019, during which the government issued
public advisories to stay indoors and limit outdoor exercise (Samuel, 2019), Vietnam’s Ministry of
Natural Resources and the Environment (MONRE) have pledged to revise the country’s Environmental 10% 4.7%
Protection Law, established in 2014. The updated legislation is due for submission in 2020 (Ecologic 2.8%
8.5%
Institute, 2019), and should require stronger action on air quality management and more stringent 4.1% 4.6%
0%
emission control from heavy industrial sources and energy production, such as coal-fired power
plants. Less than 1% of hours spent in Hanoi in 2019 met the WHO target for annual average PM2.5 Annual hours spent in different PM2.5 pollution levels
exposure.
17 |CENTRAL & SOUTH ASIA
Afghanistan | Bangladesh | India | Iran | Kazakhstan | Kyrgyzstan | Nepal | Pakistan | Sri Lanka | Uzbekistan
PM2.5 Country/Region Ranking
(µg/m³)
1. Bangladesh (83.3)
250.4
2. Pakistan (65.8)
3. Afghanistan (58.8)
4. India (58.1)
150.4
5. Nepal (44.5)
6. Uzbekistan (41.2)
55.4
7. Kyrgyzstan (33.2)
35.4
8. Sri Lanka (25.2)
9. Iran (24.3)
12.0
10.0
10. Kazakhstan (23.6)
0 10 20 30 40 50 60 70 80 90 100
Available cities with real time monitoring in 2019 PM2.5 annual mean (µg/m³)
SUMMARY
0.7%
Regional cities which met the
The majority of the most polluted cities and countries included
in this report are located in the South Asia region. The region in-
cludes 30 of the top 40 most polluted cities and four of the five
most polluted countries. Only one city in this region (Sanandaj,
WHO PM2.5 target in 2019 Iran), out of 147 cities with monitoring data in 2019, met WHO
targets for PM2.5 levels.
Whilst pollution sources across the region vary, common con-
6.5 110.2 tributors include transportation emissions, biomass burning for
Sanandaj, Iran Ghaziabad, India household cooking, open agricultural burning, industry and coal
combustion.
WHO target Good Moderate Unhealthy for Sensitive Groups Unhealthy Very Unhealthy Hazardous
Numerous cities within the region, particularly in Pakistan and
Range of annual mean PM2.5 (µg/m³) across regional cities India, saw improvements in PM2.5 levels from 2018 to 2019.
This resulted in an overall decrease in PM2.5 levels by 14.8%
across the region, among cities with comparable PM2.5 data
in 2018 and 2019. Much of this can be attributed to increased
Most Polluted Regional Cities Cleanest Regional Cities
monitoring data, economic slowdown, favorable meteorological
Rank City 2019 AVG Rank City 2019 AVG conditions and government action. 2019 marked the start of
1 Ghaziabad, India 110.2 1 Sanandaj, Iran 6.5 India’s National Clean Air Program, which set ambitious PM2.5
targets and outlined new strategies for meeting these goals.
2 Gujranwala, Pakistan 105.3 2 Borazjan, Iran 11.6
3 Faisalabad, Pakistan 104.6 3 Kabudrahang, Iran 12.7
4 Delhi, India 98.6 4 Tabriz, Iran 13.2 MONITORING STATUS
5 Noida, India 97.7 5 Qorveh, Iran 13.7 India, Iran and Nepal are the only countries within the South
6 Gurugram, India 93.1 6 Yazd, Iran 13.7 and Central Asia region which have live public, national PM2.5
monitoring networks. In 2019, India nearly doubled its govern-
Raiwind, Pakistan 92.2 15.1
7 7 Zanjan, Iran mental monitoring network, growing the number of stations to
8 Greater Noida, India 91.3 8 Nahavand, Iran 15.4 283, whilst individual contributors provided an additional 31
stations. Pakistan also doubled its monitoring stations, with
9 Bandhwari, India 90.5 9 Satna, India 15.5
more than 90% owing to individual data contributors. While
10 Lucknow, India 90.3 10 Saqqez, Iran 15.7 major cities within the region tend to have several stations,
much of the region still lacks air quality data, leaving large
11 Lahore, Pakistan 89.5 11 Darreh Shahr, Iran 16.6
populations without information regarding the air they are
12 Bulandshahr, India 89.4 12 Pardis, Iran 16.9 breathing.
13 Muzaffarnagar, India 89.1 13 Pokhara, Nepal 17.1
14 Bagpat, India 88.6 14 Eslamshahr, Iran 19.7
15 Jind, India 85.4 15 Saveh, Iran 19.8
18 |INDIA
PM2.5 Delhi Bengaluru Chennai
(µg/m³)
Mumbai Hyderabad Kolkata
120
250.4
110
100
90
150.4 80
70
55.4
60
50
35.4
40
30
12.0
10.0 20
2015 2016 2017 2018 2019
Available cities with real time monitoring in 2019 PM2.5 annual mean (µg/m³) over 5 years
PM2.5: µg/m³ 2019
Annual JAN FEB MAR APR MAY JUN JUL AUG SEP OCT NOV DEC
AVG
Delhi 98.6 191.7 84.8 75.3 71.4 76.6 56.7 43.2 31.9 37.2 116.7 200.7 194.8
Mumbai 45.3 104.5 71.0 59.0 41.0 31.8 25.3 18.1 15.8 12.6 31.5 57.7 81.1
Bengaluru 32.6 57.8 44.6 43.4 39.6 35.2 20.1 17.3 15.6 17.5 24.7 40.3 35.5
Chennai 34.6 74.9 35.8 30.4 23.0 39.1 34.0 28.5 21.1 22.3 20.5 48.0 40.2
Hyderabad 39.0 70.5 32.7 45.0 35.6 42.6 23.2 15.5 16.5 19.9 34.6 67.0 63.6
Kolkata 59.8 176.1 50.3 66.1 36.8 37.3 29.5 25.6 22.6 19.7 63.3 92.6 102.1
PROGRESS Key Cities in India
2019 marked the launch of India’s first National Clean Air Programme (NCAP), marking a shift in Delhi Mumbai Bengaluru Chennai Hyderabad Kolkata
India’s commitment to tackling air pollution. The NCAP aims to reduce PM2.5 and PM10 air pollu-
100%
tion in 102 cities by 20-30% by 2024 compared to 2017 levels, by working directly with local gov- 7.8% 9.7% 4.8%
ernments to create more customized regulations and targets (Government of India, 2019). In July 13.4%
2019, India additionally joined the UN’s Climate & Clean Air Coalition (CCAC) as the 65th member 90%
23.1%
to collaborate with global leaders on air pollution solutions. While the long-term impacts of these 10.3%
28.8%
activities are yet to be seen, India saw widespread improvements in PM2.5 levels in 2019, compared 80%
to the year prior as a result of economic slowdown, favorable meteorological conditions, as well as 30.5%
more dedicated efforts towards cleaning the air. 29.6% 20.5%
70%
CHALLENGES 42.4%
23.8%
60% 19.1%
Despite improvements, India still faces serious air pollution challenges. India again heads this
report’s ranking of annual PM2.5 levels by city with half of the 50 most polluted cities being in 19.0%
50%
India. No Indian cities included in this report met the WHO target for annual pollution exposure
(10ug/m3) during 2019. Additionally, the country still has a relatively limited air quality monitoring
network given its population size, with many communities and highly populated cities without 40%
access to real-time information.
51.8% 56.6% 42.9%
30% 20.9%
43.5%
HIGHLIGHT: NATIONAL AIR QUALITY IMPROVEMENTS 37.2%
20%
Every city in India with PM2.5 data in 2018 and 2019, except for Nagpur1, saw a decrease in PM2.5
levels in 2019. As a weighted average based on the available data, national air pollution decreased
by a remarkable 20% from 2018 to 2019. Unfortunately these improvements may not be fully 10% 17.5%
4.2% 4.5% 4.1%
representative of the very recent but promising National Clean Air Programme and cleaner fuel 3.6% 2.4%
Bharat VI introduction, but are rather more indicative of a slowing of the marketplace. 3.4% 4.7% 4.4% 6.0% 4.4%
0%
Annual hours spent in different PM2.5 pollution levels
1 Nagpur saw a slight increase in average PM2.5 level, of +1.3%.
19 |PAKISTAN
PM2.5 Karachi Faisalabad Peshawar
(µg/m³)
Lahore Gujranwala Islamabad
130
250.4
120
110
100
150.4 90
80
55.4
70
60
35.4
50
40
12.0
10.0 30
2017 2018 2019
Available cities with real time monitoring in 2019 PM2.5 annual mean (µg/m³) over 3 years
PM2.5: µg/m³ 2019
Annual JAN FEB MAR APR MAY JUN JUL AUG SEP OCT NOV DEC
AVG
Karachi 40.2 86.7 42.1 32.4 18.2 16.1 18.1 23.3 22.2 28.5 44.9 67.1 75.9
Lahore 89.5 199.1 110.3 73.6 62.5 53.7 44.5 39.9 40.9 54.7 104.6 134.9 182.7
Faisalabad 104.6 223.0 128.3 82.0 59.1 56.5 46.3 54.2 58.4 66.5 92.0 148.5 226.2
Gujranwala 105.3 220.4 127.4 86.4 70.9 65.8 53.3 59.2 48.8 67.4 107.6 144.9 217.3
Peshawar 63.9 81.2 44.3 28.6 53.7 44.4 56.4 52.8 41.4 60.9 75.2 77.9 113.5
Islamabad 35.2 37.0 24.9 18.6 17.2 14.6 20.5 31.7 29.8 42.9 40.0 48.8 96.3
PROGRESS Key Cities in Pakistan
Globally, Pakistan ranks as the second highest country for annual PM2.5 levels, weighted
Karachi Lahore Faisalabad Gujranwala Peshawar Islamabad
by city population. Until recently, there was no government monitoring in Pakistan. The data
provided in this report comes from low-cost sensors operated by engaged individuals and 100%
4.5% 4.5%
non-governmental organizations. New Prime Minister Imran Khan has cited air pollution as 8.2% 7.9%
14.5%
a key priority for his administration, and recently reinstated the monitoring infrastructure in 90%
21.8% 13.0%
Lahore, a program previously abandoned by the last government (Khan, 2019). Current an- 12.5% 14.3%
ti-smog measures include stricter emission standards on factories, as well as fining heavily
80% 4.2%
polluting vehicles and farmers burning crop stubble. Much more must be done however, to
tackle emissions at the source, and shift to cleaner energy sources. 40.9% 17.6%
70% 13.2%
CHALLENGES
37.4%
Air pollution is responsible for nearly 22% of premature deaths in Pakistan (Shaikh, 2018). 60% 41.3% 38.9%
Several cities in Pakistan rank prominently among the most polluted cities globally. Gujran-
wala and Faisalabad, which rank third and fourth respectively, both experience annual aver- 50%
age PM2.5 levels that are more than 10 times the WHO target for annual PM2.5 exposure.
These cities observe ten times more annual hours in the highest US AQI bracket (250.4μg/ 53.6%
25.2%
m3) than in the US AQI bracket which meets the WHO annual target (WESTERN ASIA
Armenia | Bahrain | Georgia | Iraq | Israel | Jordan | Kuwait | Saudi Arabia | Syria | United Arab Emirates
PM2.5 Country/Region Ranking *
(µg/m³)
1. Bahrain (46.8)
250.4
2. Iraq (39.6)
3. United Arab Emirates (38.9)
4. Kuwait (38.3)
150.4 5. Syria (32.2)
6. Armenia (25.5)
55.4
7. Saudi Arabia (22.1)
35.4
8. Israel (20.8)
9. Georgia (20.1)
12.0
10.0
10. Jordan (18.3)
0 10 20 30 40 50 60 70 80 90 100
Available cities with real time monitoring in 2019 PM2.5 annual mean (µg/m³)
SUMMARY
0%
Regional cities which met the
Sources for PM2.5 air pollution in the Western Asia include a
mix of both natural sources, such as dust storms, and man-
made sources, including energy production, transport exhaust
and construction (UNEP, 2016).
WHO PM2.5 target in 2019 *
Whilst sandstorms contribute to elevated PM2.5 levels year-
round, their effect is noticeably seasonal, impacting air quality
more severely in May through August. During these months,
15.2 46.8 strong winds, thunderstorm activity and convective low-pres-
Ein Tamar, Israel Manama, Bahrain sure systems, as a result of the intense heat, kick up signifi-
cant amounts of dust. Dust particles have been found to be
comprised of hydrocarbons, trace elements, heavy metals, sul-
WHO target Good Moderate Unhealthy for Sensitive Groups Unhealthy Very Unhealthy Hazardous phates and nitrates (UNEP, 2016).
Range of annual mean PM2.5 (µg/m³) across regional cities The top five most polluted cities in this region, Manama, Dubai,
Baghdad, Abu Dhabi, and Kuwait City are all heavily affected by
sandstorms in the summer months. These months can experi-
ence nearly twice the PM2.5 levels as winter months.
Most Polluted Regional Cities * Cleanest Regional Cities *
Rank City 2019 AVG Rank City 2019 AVG
1 Manama, Bahrain 46.8 1 Ein Tamar, Israel 15.2
Dubai, UAE Kutaisi, Georgia 16.3
MONITORING STATUS
2 40.9 2
3 Baghdad, Iraq 39.6 3 Nesher, Israel 16.8
4 Abu Dhabi, UAE 38.4 4 Haifa, Israel 18.0 Among the countries in this region, only Israel and UAE have
national PM2.5 air quality monitoring networks. The US State
5 Kuwait City, Kuwait 38.3 5 Kiryat Yam, Israel 18.1 Department has established PM2.5 monitoring stations at
18.2
consulates and embassies in the capital cities of Bahrain, Ku-
6 Sharjah, UAE 34.6 6 Gvar’am, Israel
wait, Iraq, Jordan, Saudi Arabia and the United Arab Emirates.
7 Salwa, Kuwait 32.2 7 Al Quwayrah, Jordan 18.3 The US-owned stations in Jordan, Iraq, and Saudi Arabia are
all new within 2019. Additional data has been provided by in-
Fiq, Syria 32.2 Kiryat Tiv’on, Israel 18.4
8 8
dividual data contributors. These contributions have added 26
9 Yeghegnavan, Armenia 31.8 9 Afula, Israel 18.5 stations within the region, and are the first to cover the nation
of Syria and Salwa, Kuwait.
10 Musalerr, Armenia 30.2 10 Gan Yavne, Israel 18.8
11 Prroshyan, Armenia 25.5 11 Ashkelon, Israel 18.8
12 Gan Raveh, Israel 24.5 12 Nir Yisrael, Israel 18.8
13 Rishon LeTsiyon, Israel 22.9 13 Arad, Israel 19.1
14 Bnei Brak, Israel 22.9 14 Kiryat Gat, Israel 19.1
15 Ramat Gan, Israel 22.6 15 Be’er Sheva, Israel 19.2
* Based on available data.
21 |EUROPE
Austria | Belgium | Bosnia and Herzegovina | Bulgaria | Croatia | Cyprus | Czech Republic | Denmark | Estonia | Finland | France | Germany
Greece | Hungary | Iceland | Ireland | Italy | Kosovo | Latvia | Lithuania | Luxembourg | Macedonia | Malta | Netherlands | Norway
Poland | Portugal | Romania | Russia | Serbia | Slovakia | Spain | Sweden | Switzerland | Turkey | Ukraine | United Kingdom
PM2.5 Country/Region Ranking
(µg/m³) 1. Bosnia & Herzegovina (34.6)
2. North Macedonia (32.4)
3. Bulgaria (25.5)
4. Kosovo (23.5)
5. Serbia (23.3)
250.4 6. Greece (22.5)
7. Turkey (20.6)
8. Cyprus (19.7)
9. Croatia (19.1)
10. Poland (18.7)
11. Romania (18.3)
12. Italy (17.1)
13. Ukraine (16.6)
14. Slovakia (16.1)
15. Hungary (14.6)
16. Lithuania (14.5)
150.4 17. Czech Republic (14.5)
18. Latvia (13.3)
19. Belgium (12.5)
20. France (12.3)
21. Austria (12.2)
55.4 22. Germany (11.0)
23. Netherlands (10.9)
24. Switzerland (10.9)
25. Ireland (10.6)
26. United Kingdom (10.5)
27. Russia (9.9)
35.4 28. Spain (9.7)
29. Luxembourg (9.6)
30. Denmark (9.6)
31. Malta (9.4)
32. Portugal (9.3)
33. Norway (6.9)
12.0 34. Sweden (6.6)
10.0 35. Estonia (6.2)
36. Iceland (5.6)
37. Finland (5.6)
0 10 20 30 40 50 60 70 80 90 100
Available cities with real time monitoring in 2019 PM2.5 annual mean (µg/m³)
SUMMARY
36.4%
Regional cities which met the
Air pollution continues to present varied challenges across
different parts of Europe, as only 36% of European cities with
PM2.5 monitoring in place met the WHO’s annual target for
PM2.5. Within Europe, 2019’s PM2.5 levels were generally found
WHO PM2.5 target in 2019 to be highest in Eastern and Southern Europe, with the cleanest
cities and regions mostly found in Northern and Western Eu-
rope. While PM2.5 emission sources vary considerably across
the continent, common sources include energy production and
3.8 53.8 use, industry, agriculture and livestock, road transport, and
households and commercial buildings (EEA, 2019).
Villalba de Guardo, Spain Lalapaşa, Turkey
As countries across Europe continue to face challenges with un-
WHO target Good Moderate Unhealthy for Sensitive Groups Unhealthy Very Unhealthy Hazardous
safe levels of PM2.5, many European cities are also focused on
combating high levels of other pollutants, such as NOx, which is
Range of annual mean PM2.5 (µg/m³) across regional cities frequently found to exceed EU limits and has led to numerous
legal actions in 2019, as well as NH3 (European Commission,
2019). Since NO2 and NH3 can react as precursors to form
PM2.5 in the atmosphere, efforts to manage these pollutants
Most Polluted Regional Cities Cleanest Regional Cities should also help reduce PM2.5 levels.
Rank City 2019 AVG Rank City 2019 AVG
MONITORING STATUS
1 Lalapaşa, Turkey 53.8 1 Bodo, Norway 3.8
2 Düzce, Turkey 46.0 2 Salao, Portugal 3.8
3 Sindirgi, Turkey 45.8 3 Villalba de Guardo, Spain 3.8 North and Western European cities had more dense moni-
Lukavac,
toring coverage than Eastern and Southern European cities.
4 39.9 4 Mosfellsbaer, Iceland 3.9
Bosnia & Herzegovina Western Europe has the most cities with monitoring coverage
5 Valjevo, Serbia 37.9 5 Husavik, Iceland 4.0 during 2019 (428), of which 61% of these cities failed to meet
Horozluhan Osb,
the WHO annual PM2.5 target (NORTHERN AMERICA
United States | Canada
PM2.5 Country/Region Ranking
(µg/m³)
250.4
1. United States (9.0)
150.4
55.4
2. Canada (7.7)
35.4
12.0
10.0
0 10 20 30 40 50 60 70 80 90 100
Available cities with real time monitoring in 2019 PM2.5 annual mean (µg/m³)
SUMMARY
80.5%
Regional cities which met the
Over the past several decades, the United States and Canada
have managed to continue growing gross domestic product
(GDP) while reducing emissions of all 6 criteria pollutants, in-
cluding PM2.5. The success has been the result of pollution
WHO PM2.5 target in 2019 emission controls across numerous industries and sectors.
Whilst the Trump administration has rolled back 16 air pollution
regulations, with another 9 in process (Popovich, Albeck-Ripka, &
Pierre-Louis, 2019), Northern America remains one of the regions
1.9 19.4 * with the lowest overall PM2.5 levels worldwide. Still, nearly 20%
Kailua-Kona, Kitwanga, Canada of regional cities fail to meet WHO air quality guidelines for an-
USA nual exposure, contributing to 30,000 premature deaths from air
pollution annually (Carnegie Mellon University, 2019), indicating
WHO target Good Moderate Unhealthy for Sensitive Groups Unhealthy Very Unhealthy Hazardous an ongoing severe national health risk.
Range of annual mean PM2.5 (µg/m³) across regional cities Primary PM2.5 emission sources include transport, a continued
dependence on fossil fuel-driven energy production and wild-
fires as the dominant natural cause.
Most Polluted Regional Cities * Cleanest Regional Cities
While 2019 saw fewer wildfires and acreages burned than in
Rank City 2019 AVG Rank City 2019 AVG the past 5 years (NOAA, 2020), these events still contributed to
19.4
elevated PM2.5 levels in the region’s most polluted cities, which
1 Kitwanga, Canada 1 Kailua-Kona, USA 1.9
are predominantly located in California (9 out of the top 10, or
2 Portola, USA 16.9 2 Captin Cook, USA 1.9 25 out of the top 30). As environments become warmer and dri-
er with climate change, the frequency and intensity of wildfires
3 Maywood, USA 16.5 3 Waimea, USA 2.0
is expected to grow.
4 Walnut Park, USA 16.3 4 Oak Harbor, USA 2.6
5 Eastvale, USA 16.2 5 Oro Valley, USA 2.8
6 Colton, USA 16.1 6 Yellowstone National 2.8
MONITORING STATUS
Park, USA
7 Florence-Graham, USA 16.1 7 Mesa County, USA 2.9
The United States has one of the world’s most established
8 Diamond Bar, USA 16.0 8 Naalehu, USA 2.9 air monitoring networks with more than 1,000 governmental
PM2.5 stations and nearly 4,000 PM2.5 stations contributed
9 McCloud, USA 16.0 9 Cedaredge, USA 3.0
by local organizations and individuals. Of the non-govern-
10 Ontario, USA 16.0 10 Ocean View, USA 3.0 mental monitoring stations, over 2,500 stations were added
in 2019. Whilst Canada’s air quality monitoring network is
11 North Bend, USA 16.0 11 Lander, USA 3.0 considerably smaller than its US neighbor, its metropolitan
12 Compton, USA 15.7 12 Labrador City, USA 3.1 areas, which represent locations more affected by air pollu-
tion are also well represented, with 433 stations included in
13 Burbank, USA 15.5 13 Kapolei, USA 3.2 this report.
14 Huntington Park, USA 15.4 14 Thompson, Canada 3.3
15 El Monte, USA 15.2 15 Palisade, USA 3.3
*Last update: 3/18/20
23 |You can also read