FINAL SACRAMENTO VALLEY AIR BASIN 2010 SMOKE MANAGEMENT PROGRAM - California Air ...
←
→
Page content transcription
If your browser does not render page correctly, please read the page content below
FINAL
                   SACRAMENTO VALLEY AIR BASIN
                 2010 SMOKE MANAGEMENT PROGRAM

                                   Prepared by

          The Sacramento Valley Basinwide Air Pollution Control Council
                    and the Technical Advisory Committee

Sacramento Valley Basinwide Air Pollution Control Council   Adopted: June 4, 2010

                           California Air Resources Board   Approved: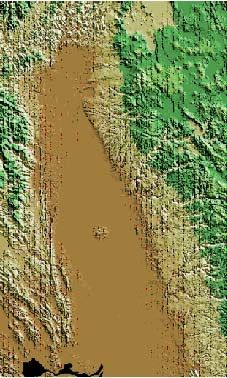
TABLE OF CONTENTS

1.    BACKGROUND ……………………………………………………………………………………………………..                    Pg 6

2.    AUTHORITY …………………………………………………………………………………………………………                     Pg 14

3.    APPLICABILITY AND EFFECTIVE DATES OF PROGRAM ………………………………………………….      Pg 14

4.    PROGRAM GOALS …………………………………………………………………………………………………                     Pg 14

5.    PROGRAM ELEMENTS ……………………………………………………………………………………………                   Pg 14

6.    PROGRAM PARTICIPANTS ………………………………………………………………………………………                 Pg 16

7.    PROCEDURES FOR ALLOCATION AND ADJUSTMENTS OF ACREAGE ………………………………..     Pg 16

      �        Daily acreage allocation and distribution considerations

      �        Definitions of BMF and BAQF

      �        Determining burn day status above 3000 feet mean sea level

      �        Standard allocation equations

      �        Spring increase to standard allocation equation

      �        Air quality reduction factors

      �        North wind days

      �        Rainfall effects

      �        Special circumstances - Adverse air quality conditions

      �        Special circumstances - Superior ventilation conditions

      �        Communication procedures on early pre-storm days

8. PROCEDURES FOR DISTRIBUTION AND ADJUSTMENTS OF ACREAGE …………………………………..   Pg 19

      �        Fall burn season acreage distribution equation

      �        Spring, summer, and winter acreage distribution system

      �        North/South acreage shifts

      �        Spatial management of burning

9. ALLOCATION TYPES AND UPDATES ……………………………………………………………………………..             Pg 22

10. DATA MANAGEMENT FOR THE INTENSIVE FALL BURN SEASON ………………………………………...   Pg 23

11. COMPUTER FILES AND DATA RETRIEVAL TIMETABLE ……………………………………………………..      Pg 23

12. BURNING AUTHORIZATION AND RETURNING ACRES ……………………………………………………….        Pg 24
SVAB SMP2010                                            Page 2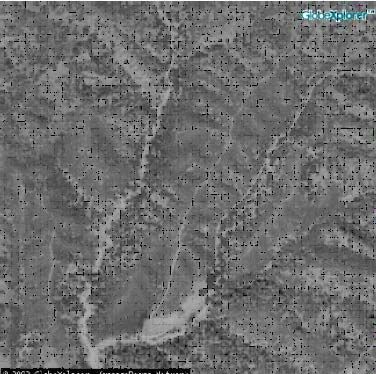
�     Daily acreage distribution and burn authorization

     �     Personnel on duty and holiday and weekend staffing

     �     Responsibility to return unburned acreage-

13. TYPES OF DAYS ………………………………………………………………………………………………..…...           Pg 25

     �     No-burn days

     �     Prunings only days

     �     Restricted field days

     �     Regular days

14. BURN HOURS …………………………………………………………………………………………………………                Pg 26

15. SMP COORDINATOR DATA COLLECTION AND ANALYSIS …………………………………………………   Pg 26

16. COMPLAINT HANDLING …………………………………………………………………………………………….            Pg 26

17. BURNING MANAGEMENT POLICIES AND PROCEDURES …………………………………………………… Pg 27

     �     Conservative burn management

     �     Burn placement and timing

     �     District communications with growers

18. PROGRAM OVERSIGHT, REVIEW AND TRAINING ……………………………………………………………. Pg 29

19. GENERAL BURNING REQUIREMENTS FOR GROWERS …………………………………………………….. Pg 29

     �     Drying times

     �     Ready to burn list

     �     Burn authorization and acreage allocation

     �     Ignition patterns

     �     Harvest date

     �     Return unused burn acreage

      �    Chopped rice fields

20. PRESCRIBED BURNING ……………………………………………………………………………………………             Pg 30

21. AEROMETRIC MONITORING ………………………………………………………………………………………            Pg 31

     �     AMOS weather stations

     �     Airports
SVAB SMP2010                                        Page 3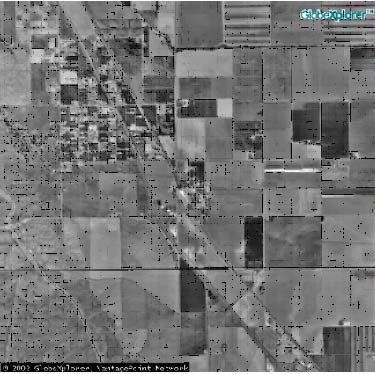
�     Air quality monitoring stations

     �     BAM PM2.5 monitoring sites

      �    BAM PM10 monitoring sites

     �     TEOM PM10 monitoring sites

22. ADMINISTRATIVE POLICIES ……………………………………………………………………………………….          Pg 32

      �    Guidelines for Revising the Smoke Management Program

     �     Testing policy

      �        Spare-The-Air no burn days

      �        Public meetings, workshops, and hearings

      �        Daily air quality and agricultural burning information

      �        Wildland fire use fires

      �        Emission factors for rice equivalency

      �        Adjustments for burned acreage

      �        Trading of acres

      �        Conditions for special burn permits

      �        Required report for special burn permits

      �    Updates

23. RICE STRAW BURNING REDUCTION ACT OF 1991 ………………………………………………………….    Pg 37

      �        Start of program

      �        Rice straw burning

      �        Conditional rice straw burn permit

      �        Allocation and updates

      �        Exemptions

      �        Complaints

      �        Fees

      �        Penalties

      �        Records and accounting

24. ENFORCEMENT AND EDUCATION ……………………………………………………………………………..           Pg 38

SVAB SMP2010                                              Page 4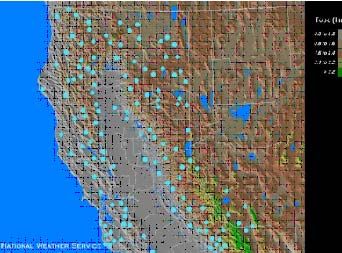
�      Penalties

     �      Enforcement actions

     �      Consistent and proportional enforcement

     �      Enforcement reports

     �      Education

     �      Compliance confirmation

     �      Agricultural burning management and enforcement plans

     �      Aerial surveillance

25. APPENDICES ………………………………………………………………………………………………………..            Pg 39

     Sacramento Valley Smoke Management Plan

     Northeast Air Alliance Smoke Management Plan

     Conditional Rice Straw Burning Permit Program

SVAB SMP2010                                          Page 5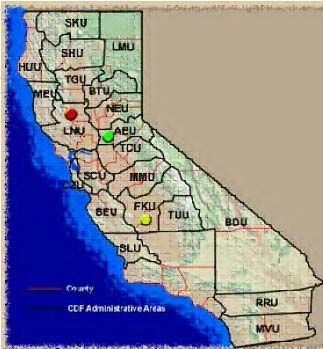
1. BACKGROUND{tc "BACKGROUND"}
The “Sacramento Valley Smoke Management Program” is prepared by the Sacramento Valley Basinwide Air Pollution
Control Council (BCC) and its Technical Advisory Committee (TAC). The BCC and TAC are comprised of the elected district
board member and air pollution control officer (APCO), respectively, from each air district in the Basin: Butte, Colusa, Glenn,
Placer, Sacramento, Shasta, Tehama, Yolo/Solano, and Feather River. The BCC reviews and amends the Program in
cooperation with the staff of the California Air Resources Board (CARB or ARB) Meteorology and Compliance Program
Review sections, the affected industry, environmental groups and other interested parties.
The purpose of the Program is to describe the policies and procedures used with hourly and daily measurements of air
quality and meteorology to determine how much open biomass burning can be allowed in the Sacramento Valley Air Basin.
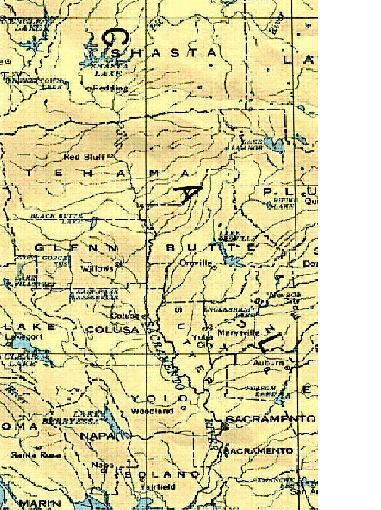
The area covered by the Smoke Management Program plan is referred to as the Sacramento Valley Air Basin (SVAB), and
includes all or parts of the following counties: Butte, Colusa, Glenn, Placer (portion), Sacramento, Shasta, Solano (portion),
Sutter, Tehama, Yolo and Yuba (Map 1). The dimensions of the Basin are approximately 216 miles from north to south and
95 miles east to west at the widest part. The SVAB is bounded on the north and west by the Coastal Mountain Range and
on the east by the southern portion of the Cascade Mountain Range and the northern portion of the Sierra Nevada
Mountains. Within the SVAB the elevations reach heights of approximately 3,500 feet in the southwest, 8,500 feet in the
northwest, 1,700 feet in the southeast and 10,500 feet in the northeast. The mountain ranges provide a significant physical
barrier to trap locally created pollution as well as pollution transported into the Valley from elsewhere. Another prominent
landmark within the Sacramento Valley is the Sutter Buttes which have a top elevation of 2,117 feet and are situated in the
central part of the Valley floor. However, in contrast, the elevation in Sacramento County near the San Francisco Bay delta
is barely above sea level. The topographic map (Map 2) shows elevations within the Basin.
Due to the large geographic area of the Basin the weather varies from north to south and east to west. The meteorological
parameters of wind direction and speed, high and low temperatures, and precipitation are measured at several locations
around the Basin. These factors have a major effect on air quality and the daily management of biomass burning. Data
presented below describe annual climatological conditions (Table 1).
TABLE 1
ELEVATIONS AND CLIMATOLOGY OF THE SACRAMENTO VALLEY AIR BASIN
COUNTY CITIES ELEVATION WINDS 1st2nd TEMPERATURE RAINFALL
NAME OF CITY - Ft AVERAGE AVERAGE - oF AVERAGE - In
BUTTE CHICO 240 SE-9 NW-5 74.69 47.20 25.24
COLUSA COLUSA 50 ESE-5 NNW-9 75.05 47.15 15.96
GLENN WILLOWS 140 NW-10 SE-10 74.74 47.52 17.57
PLACER 1 AUBURN 1,520 SE-10 NW-10 75.10 47.31 35.22
SACRAMENTO SACRAMENTO 20 SE-10 NW-10 73.58 48.07 17.52
SHASTA REDDING 600 76.56 50.03 40.16
SOLANO 2 VACAVILLE 110 74.86 46.32 24.35
SUTTER YUBA CITY 60 SE-9 NW-10 75.38 49.41 21.01
TEHAMA RED BLUFF 350 75.51 50.46 22.55
YOLO WOODLAND 100 NNW-13 SE-5 75.10 47.31 19.53
YUBA MARYSVILLE 60 SE-11 WNW-9 75.38 49.41 21.01
SUTTER BUTTES 2,117 SSE-13 N-16
SVAB SMP2010 Page 61) Only the Valley portion of Placer County to and including Auburn are part of the Sacramento Valley Air Basin
2) Only the northern and eastern portions of Solano County are part of the Sacramento Valley Air Basin
MAP 1 MAP 2
49g
G LF
Orville
RAKE COLUSA'S
SACRAMENTO
NAPA
SACRAMENTO
PLANQT
MARIN
SVAB SMP2010 Page 7Climatological data in Table 1 are annual averages over a four or five year period depending on the specific parameter.
Wind maxima data were measured at the following sites: Butte (Chico State), Colusa (Arbuckle), Glenn (Artois), Placer
(Lincoln), Sacramento (Natomas), Sutter (Kirkville), Yolo (Esparto) and Yuba (North Yuba). The primary wind is the direction
observed with the greatest frequency, that is the direction with the highest overall percentage of occurrence. The secondary
direction is usually but not always the direction with the second highest percentage of occurrence. The main deviation in
winds from the typical north-south direction, are on the west side of the Valley where primarily north winds are seen.
Temperature differences between the cities of Redding, Red Bluff, and Vacaville and the other cities in the Valley are
evident. At Redding and Red Bluff the average low temperatures are a little warmer possibly due to more cloud cover at the
north end of the Valley. The lower average minimum temperature at Vacaville is probably due to the marine influence
during the summer months.
The northern and eastern parts of the Basin have higher precipitation totals due to the higher latitude and the orographic
lifting of the Sierra Nevada mountain range producing more rainfall. On the west side of the Valley rainfall is generally less
due to the rainshadow effect on the lee side of the Coastal Range.
Shown below is a monthly table of 30year averages for the Chico State University farm (Table 2). Normal variations in
temperature and rainfall by season (e.g. summer to winter) are shown in the table. The same general weather pattern
would be applicable to all counties in the Sacramento Valley.
TABLE 2
CLIMATOLOGICAL DATA FOR CHICO STATE FARM
MONTH AVERAGE TEMPERATURES - OF RAINFALL - INCHES
JANUARY 54 - 36 5.09
FEBRUARY 60 -39 3.83
MARCH 65 - 41 3.81
APRIL 72 - 44 1.63
MAY 81 - 51 0.53
JUNE 90 - 57 0.32
JULY 95 - 60 0.03
AUGUST 94 - 59 0.20
SEPTEMBER 88 - 55 0.51
OCTOBER 78 - 48 1.60
NOVEMBER 63 - 41 3.95
DECEMBER 54 - 35 3.74
SVAB SMP2010 Page 8Although much of the land area of the SVAB is above 1000 feet mean sea level, the vast majority of the populace reside
below that elevation. The region is perceived as an excellent place to live and work and is growing rapidly. With the
burgeoning population comes greater pollution created by human activities. The Valley is often subject to temperature
inversions that, coupled with topographic barriers and hot summer temperatures, create a high potential for air pollution
problems. The following table provides recent demographic data by county and city for the Basin with a percentage growth
for each county in the last decade (Table 3).
TABLE 3
DEMOGRAPHICS OF THE SACRAMENTO VALLEY AIR BASIN
COUNTY NAME POPULATION 2000 CITIES POPULATION 2000 % GROWTH 1990-2000
BUTTE 203,171 CHICO 59,954 11.6
OROVILLE 13,004
COLUSA 18,804 COLUSA 5,402 15.5
GLENN 26,453 WILLOWS 6,220 6.7
PLACER 1 248,399 AUBURN 12,462 43.8
ROCKLIN 36,330
SACRAMENTO 1,223,499 SACRAMENTO 407,018 17.5
SHASTA 163,256 REDDING 80,865 11.0
ANDERSON 9,022
SOLANO 2 394,542 VACAVILLE 88,625 15.9
SUTTER 78,930 YUBA CITY 36,758 22.5
TEHAMA 56,039 RED BLUFF 13,147 12.9
YOLO 168,660 WOODLAND 49,151 19.5
DAVIS 60,308
YUBA 60,219 MARYSVILLE 12,268 3.4
BASIN TOTAL 2,641,972 BASIN AVERAGE 16.4
1) Only the Valley portion of Placer County to and including Auburn are part of the Sacramento Valley Air Basin
2) Only the northern and eastern portions of Solano County are part of the Sacramento Valley Air Basin
The Sacramento Valley Air Basin developed the first regional, coordinated burning management program in California in
1981. The program was tested for a two-year period before being adopted into regulation in 1983. The program included
goals, policies and procedures organized into an agricultural burning management plan. The program has been reviewed
every year by SVAB district staff, Air Resources Board (ARB) meteorology and compliance staff, and Basin consultants.
Workshops and public hearings held by the Basin Technical Advisory Committee and the Basinwide Control Council have
resulted in other changes suggested by the public and the agricultural industry. Many amendments to the program and plan
have been made in the last twenty years. The types of changes have encompassed modifications to the ARB equations to
expanded descriptions of all program elements.
During the fall burn season data are reviewed daily including air quality levels, meteorological conditions, and the amount of
agricultural burning conducted by burning management zone and type of crop residue. Fall data are archived annually to
assist in the evaluation of the program results and support proposed changes. The program has achieved its goals of
improving air quality and allowing necessary agricultural burning.
SVAB SMP2010 Page 9Recent policy changes at federal and state agencies (Maps 3 and 4) regarding the need for more forest and wildland burning
to improve land management have increased the amount of “prescribed burning” on public and private lands. This shift
towards more prescribed burning has demanded a review of burning management programs to address the unique issues
presented by this type of burning. The national forests have plans for significant increases in burning. The US Forest
Service does have access to remote automatic weather stations (Map 5) and the assistance of weather forecasters to help in
planning and safely conducting burning.
The following table contains recent data on agricultural and prescribed burning (Table 4).
TABLE 4
BURNING DATA FOR THE SACRAMENTO VALLEY AIR BASIN
COUNTY FARM ACRES RICE ACRES RICE ACRES AGRICULTURAL PRESCRIBED
1997 PLANTED 2001 BURNED 2001 BURNING 2001 BURNING 2001
BUTTE 404,166 88,102 15,490 34,957 945
COLUSA 430,958 127,000 22,905 35,288 807
GLENN 482,583 84,330 14,909 35,886 1,378
PLACER 139,597 15,700 1,444 1,735 0
SACRAMENTO 308,035 9,765 2,585 7,439 200
SHASTA 316,743 0 0 601 3,151
SOLANO 362,102 0 0 7,918 226
SUTTER 348,349 104,722 12,646 36,313 0
TEHAMA 885,426 1,250 0 10,074 120
YOLO 536,595 35,546 2,233 5,525 102
YUBA 208,462 35,233 4,965 7,409 771
BASIN TOTALS 4,423,016 501,648 77,177 391,928 7,700
SVAB SMP2010 Page 10MAP 3
USDA Ferest Service
The Sacramento Valley is surrounded by national forests
Pacifle southwest Region
forert Supere ber's office
LANES Mendocino
Mational Forst
National Parks Shasta –Trinity
Cledura do &
Lassen
Plumas
Slerra
Tahoe
UAS
MAP 4
SHU Department of Forestry and Fire Protection Administrative Units
SHU LMU
SHU - Shasta Trinity Unit
Tay
MELL
TGU - Tehama Glenn Unit
TOU BTU - Butte Unit
Imu
LNU - Lake Napa Unit
BEU FKLIC
NEU - Nevada Yuba Placer Unit
HAT
AEU - Amador El Dorado Unit
Coaty
BRU
COF Administrative Areas
MVU
MAP 5
Northern California Interactive RAWS Map
Each dot represents the location of an automatic weather station.
SVAB SMP2010 Page 11Agricultural burning has been managed effectively in the SVAB for many years. Through the early involvement of the rice
industry, frequent communication with air district staff and numerous meetings the growers have become very
knowledgeable about the burning management program. The local air districts have computerized databases of growers’
fields that are to be burned. Information included in the databases are the location of fields, amount of acres and type of
crop residue. Management of the burning on a daily basis involves the temporal and spatial distribution of the fires and a
limitation on the amount of acres burned commensurate with air quality and meteorological conditions.
From the air district burn records it is possible to display burning on any day and over a period of time. The graphic below
shows burning for Colusa County for the month of October 2000. The burning is shown by sections of the County (i.e.
Section, Township, and Range) and by the amount of burning in a given section related to PM10 emissions. The graphic
helps in visualizing the spatial management of the burning. It also shows the relative location of the fields throughout the
County that were burned in October.
COLUSA
SU
54760 -7004
The next page is an aerial photograph of farmlands adjacent to and east of the Dunnigan Hills in Yolo County. The photo is
a patchwork of rectangular fields with definitive boundaries. Locations of fields are easy to discern by the landmarks
indicated on the photo. The SVAB districts have years of experience managing agricultural burning on the Valley floor with
precise field locations and acreage and abundant data on baseline air quality and meteorological parameters. The situation
with prescribed burning is different.
The bottom half of that page is another aerial photograph of Yolo County to the west of the Dunnigan Hills that shows
mountainous terrain where prescribed burning takes place. The canyons and ridges of the mountains cause wind flow
patterns to be very complex. Confining burning to a fixed number of acres in such terrain is more difficult. Also, prescribed
burning in such areas involves heterogeneous fuels such as grasses, shrubs, and trees that burn at different rates and may
even smolder overnight. Drainage winds in early morning hours can carry smoke from higher elevations down into the
Valley.
In 1999 there were six consecutive no-burn days from October 17th through October 22nd. Wildfires had been burning
around the perimeter of the Basin for several days and the weather conditions with north winds and strong atmospheric
stability resulted in very poor air quality. Some of the fires were:
PENDOLA, Tahoe National Forest. This fire was near Bullards Bar Reservoir west of Camptonville and burning in mixed
conifer and manzanita.
SIXTEEN, Sonoma-Lake-Napa Ranger Unit. This fire was on the west side of Rumsey Canyon.
BIG BAR COMPLEX, Shasta-Trinity National Forest. The complex was 28 miles northwest of Weaverville. The complex
consisted of the Megram and Onion fires.
SVAB SMP2010 Page 12The particulate air quality data pattern during this period, from all types of particulate monitors, showed higher concentrations on the east side of the Valley. This was probably due to the proximity of the PENDOLA fire. Although these were uncontrolled wildfires, prescribed burning with high fuel loading factors have the potential to adversely impact air quality. Good management of all biomass burning is the ultimate goal of the Sacramento Valley Air Basin Smoke Management Program. Dunnigan, Interstate Highway 5 and agricultural fields in the Sacramento Valley. Coast Range Mountains west of Dunnigan with tree and brush covered ridges and ravines. SVAB SMP2010 Page 13
2.      AUTHORITY{tc "AUTHORITY"}

The Program was prepared pursuant to Section 41863 of the Health and Safety Code (HSC) and Subchapter 2. Smoke
Management Guidelines for Agricultural and Prescribed Burning of Title 17 of the California Code of Regulations (CCR).
Section 80155 of the latter directs the BCC to develop and submit a smoke management program to ARB for their review
and approval. In accordance with the California Code of Regulations, Title 17, Subchapter 2, Article 2, Section 80140(c) the
smoke management program of the Sacramento Valley is designated as a regional smoke management program.

3.   APPLICABILITY AND EFFECTIVE DATES OF PROGRAM{tc "APPLICABILITY AND EFFECTIVE DATES OF
PROGRAM"}

The Program applies to agricultural and other burning operations, as defined by Section 80101 of Title 17 of the CCR, that is
conducted at all elevations in the Sacramento Valley Air Basin. Policies and procedures apply throughout the year unless
otherwise specified in the Program. Many specific computer data gathering and analysis requirements apply only during the
fall burning season. The Program took effect on October 30, 2001. Any future amendments to the program do not take
effect until approved by the Air Resources Board.

4.      PROGRAM GOALS{tc "PROGRAM GOALS"}

The Program goals are the following:

        �       Protection of air quality in the Sacramento Valley.
        �       Protection of public health and safety.
        �       Effective management of daily burning operations.

5.      PROGRAM ELEMENTS{tc "PROGRAM ELEMENTS"}

The basic Program elements include the following:

        �       Local authority. The Program places responsibility and authority on local air districts for implementation.
                Current air quality and meteorological information is provided to enable districts to make informed decisions.

        �       Daily variable acreage allocation system. The Program contains a formula to allocate burn acreage to
                the Sacramento Valley Air Basin. The burning management program matches the daily basinwide acreage
                allocation to each day’s expected air quality and meteorological dispersion conditions. The system is
                designed to minimize air quality impacts.

        �       Basinwide acreage distribution system. The Program contains a formula to distribute the basinwide
                acreage allocation to local air districts. This computerized formula is based upon need (prorated acres), air
                quality (particulate matter levels), and meteorological conditions (zone ventilation ratings).

        �       Conservative management. The Sacramento Valley Smoke Management Program will be administered
                by a conservative approach with acreage updates, as warranted. Daily management will be consistent with
                prevailing air quality, meteorological, and burn data. Information used as feedback for decisions include
                hourly data on air quality levels, meteorological conditions, airport visibilities, and district field observation
                reports and smoke complaints. Program procedures will reflect the goals to protect air quality and public
                health, and to carefully monitor agricultural burning operations.

        �       Minimum daily burning allocation. The purpose of the minimum daily burn allocation is to minimize
                backlogs of ready-to-burn acres. No allocation is given on no-burn days.

        �       Timing and review of burn allocation decisions and acreage updates. Acreage allocation decisions are
                made close to the actual burning times in order to improve forecast reliability. The Program also requires
SVAB SMP2010                                                   Page 14
routine review of burning, meteorology, and air quality conditions throughout the day. If warranted, acreage
updates can be requested or burning curtailed.
� Established burn hours. Burn hours are set in accordance with proven meteorological and air quality
principles. These considerations include avoiding early morning and late afternoon surface inversions that
entrap smoke at ground level and avoiding high fuel moisture levels.
� Spatial and temporal burn placement. Optimal distribution of burning throughout the air basin and over
time minimizes air quality impacts. These management procedures reduce smoke concentrations. Burning
management zones are established within each air district and help to geographically manage the burning.
� Acreage shift. A meteorological formula containing wind speeds, wind directions, and inversion heights
allows a variable percentage of the total basin acreage allocation to be shifted north or south. The acreage
shift formula is designed to better manage burning, respond to unusual meteorological conditions, and to
protect downwind populated areas.
� Strengthened enforcement. The Program strengthens enforcement of the agricultural burning
requirements through aerial and ground surveillance to ensure compliance.
� Collection and dissemination of meteorological data. Local air districts receive reliable real-time data on
wind speeds, directions, inversion heights, and overall dispersion capacity throughout the region. Hourly
data are provided from the automatic meteorological observation stations (AMOS) sites and Valley airports
with operating control towers. Inversion and mixing height information is available from the Sutter Buttes
AMOS, pibals, aircraft flights and profilers.
� Collection and dissemination of air quality data. Local air districts also receive information on how
agricultural burning is impacting air quality. This information feed-back is available through airport visibility
observations, PM10 and PM2.5 data and smoke complaints.
� Collection and dissemination of burn data. Air pollution control agencies compile their information on the
amount of acres ready to burn, burned yesterday, burned by zone, and burned by crop category. This
information is collected, summarized, totaled, and provided on a county-by-county, zone-by-zone, and crop-
by-crop basis through the Smoke Management Program Coordinator (SMPC).
� Computerization and centralization of data and communications. The Program centralizes and
computerizes burn data storage and communications. Daily, during the fall burn season, the SMPC collects
and transmits information to the local air districts and the ARB via a website. The SMPC also stores and
analyzes these data. The SMPC will conduct at least one workshop with air district burn staff to discuss
SMP policies and procedures prior to the start of the fall burn season on September 15. The workshop(s)
may be held in the north, central and south areas of the Air Basin. Testing of computer file transfers and
website data communications will also be performed prior to the start of the fall burn season.
� Public information. The Program encourages the dissemination of information to the public on Sacramento
Valley air quality levels. The availability of the CARB web pages and air quality database helps
communicate information to the public. CARB and the Sacramento Metropolitan Air Quality Management
District also provide information to the public, via the media on no- burn/high pollution days to request public
cooperation in reducing emissions.
� Permit fees. The Program facilitates the establishment of permit fees based on acreage within each district
for the purpose of funding.
� Rice Straw Burning Reduction Act of 1991and Amendments. This law requires a phase-down of rice
straw burning in the Sacramento Valley Air Basin over a period of years. The law also allows growers to
obtain emission reduction credits for phased-down acres.
The Program provides a mechanism to assist local air districts in ensuring that rice growers comply with the
SVAB SMP2010 Page 15requirements of the phase-down law. The intent of the Program is to monitor the phase-down process and
ensure a balanced phase-down throughout the year. Districts will encourage growers to select fields to meet
the phase-down that are located in sensitive areas such as near airports, major roadways, and urban areas.
6. PROGRAM PARTICIPANTS{tc "PROGRAM PARTICIPANTS"}
Program participants include: The Agricultural Burning Subcommittee (ABS) that consists of APCOs, or their representatives
from the Butte, Colusa, Glenn, and Feather River districts. The ABS chair shall be appointed by the chair of the Technical
Advisory Committee at the July meeting.
Program participants include:
The Sacramento Valley Basinwide Air Pollution Control Council (BCC)
The Sacramento Valley Air Basin Technical Advisory Committee (TAC)
The Sacramento Valley Air Basin air districts, agricultural departments and fire districts
Air Resources Board Meteorology and Stationary Source Enforcement Sections
Smoke Management Program Coordinator under contract to the BCC
Meteorological services consultant under contract to the BCC
7. PROCEDURES FOR ALLOCATION AND ADJUSTMENTS OF ACREAGE{tc "PROCEDURES FOR
ALLOCATION AND ADJUSTMENTS OF ACREAGE"}
Daily acreage allocation and distribution considerations{tc "Daily acreage allocation and distribution
considerations"}
The allocation and distribution methods will use the following information:
1) Atmospheric stability, inversion heights, and depth of the mixing layer
2) Wind speeds and directions (upper level and surface)
3) Relative humidity, fuel moisture and cloud cover
4) Baseline air quality PM10 and PM2.5 data and airport visibilities
5) Quantity and location of agricultural residue to be burned
6) Consideration of downwind populated areas
7) Presence of prescribed burning and nearby wildfires
Emphasis shall be placed on the consideration of expected mixing depths during the burn hours in making burning
management decisions. The meteorological services consultant and the ARB will comment on atmospheric mixing in their
computer files and this will also be discussed each morning between the ARB duty meteorologist and the SMPC in
determining the initial acreage allocation. The Smoke Management Program Coordinator may, if conditions warrant, reduce
the acres allocated by ARB to the Air Basin.
Definitions of BMF and BAQF{tc "Definitions of BMF and BAQF"}
The BMF is the basinwide meteorological factor determined from Tables 4 and 5 of Section 80320, of the CCR. These tables
reflect average basinwide AM stability, and wind speed respectively. The average AM stability number comes from morning
aircraft flights and temperature reports in the north (Red Bluff or Chico) and south (Sacramento) parts of the Valley and from
surface temperature observations. The north and south numbers are averaged to determine the basinwide AM stability or
the temperature difference from 3,000 feet to the Valley floor. The basinwide average windspeed is an average of north
(Chico) and south (Sacramento) PIBAL wind measurements. Also used are observed winds, profiler data, pressure gradient
nomograms, and ETA and AVN prognostic models. ARB meteorologists consult with the meteorological services consultant
meteorologists and use their own experience and judgment.
The surface stations used to determine the AM stability number are: the AMOS stations CSF, AMO, ORO, BCC, BGG, NYU,
WET, LCN, NAT, ORS, ATS, CDA, MAX, ABK, KRK, EPO, WOO and airports or air bases including BAB, SMF, SAC, CIC
SVAB SMP2010 Page 16and RBL. To assure a prudent determination of morning stability, the emphasis would be placed on choosing the coolest of
these locations that is representative of rice growing locations. The coolest of the morning temperatures in the north and
south valley would be selected from the early morning hours of 12Z to 15Z. The ARB duty forecaster could choose not to
use the coolest site if it was considered to be unusually cold and possibly in error. The temperature at three thousand feet,
from morning aircraft flights, may be modified if a dry adiabat followed from the warmest temperature of the sounding below
three thousand feet intersected the three thousand foot level at a temperature warmer than the temperature reported from
the flights. The duty meteorologist could choose to use the temperature at the intersection of the dry adiabat and the line
representing three thousand feet.
The BAQF is the basinwide air quality factor that equals the average of one hour readings of PM2.5 from midnight to 6:00 a.m.
The ARB generates the air quality factor from data collected from the basinwide network of BAM samplers.
Other factors may be developed and approved to be used as air quality and meteorological criteria for determining burn days
and allocations. These factors shall be based on scientific and technologically sound data to insure that air quality is
protected. Factors will first be proven in a test equation situation.
Determining burn day status above 3000 feet mean sea level {tc "Determining burn day status above 3000 feet mean
sea level " \l 2}
Burn day status above 3000 feet msl is determined by ARB 500 mb pressure elevations. The 500 mb charts show large
scale regional features (atmospheric pressure at 18,000 feet) that can be used to identify subsidence and stagnation causing
poor dispersion. The Sacramento Valley uses 1 dekameter higher (other values may be selected) than the decision point for
burning above 3000 feet. In place of the standard 3000 feet msl level the elevation may be specified in increments of 500
feet on a day-by-day basis as determined from vertical temperature soundings. Alternate criteria for determining burn day
status may be approved by the BCC and implemented.
Standard allocation equation{tc "Standard allocation equations"}
The standard CARB acreage allocation equation is used throughout the year. The equation calculates a “theoretical
maximum allocation” for the day.
The following “theoretical maximum acreage allocation” equation may be altered in the future as recommended by the
Sacramento Valley Air Basin Technical Advisory Committee and the Air Resources Board.
Allocation = (-1/0.006) * (-170 + (1 * amstab) + (0.2049159 * 500mb12) - (0.3579679 * WS) + (1 * PM2.5 0-6))
Amstab = morning temperature difference between 3,000 feet and the surface
500mb12 = 500 millibar heights at 4a.m. from National Weather Service models
WS =average wind speed forecasted by the ARB through the mixing layer
PM22.5 0- 6 = PM2.5 basinwide average from midnight to 6a.m.
Spring increase to standard allocation equation{tc "Spring increase to standard allocation equations"}
During the months of March, April and, if needed, May, the acreage allocations may be increased, due to improved
atmospheric dispersion, by a factor of 1.5.
Air quality reduction factors
Local air quality problems are determined on the basis of the average midnight to 6a.m. PM2.5 readings for one or more
stations in or near the APCD. The AQ reduction factors (0-1) used in the distribution equation are found in the ARB
allocation page.
The following table lists the PM2.5 air monitoring station(s) associated with each county or air district for purposes of
calculating the air quality reduction factor.
SVAB SMP2010 Page 17Corresponding PM2.5 Monitoring Station(s)
for Air Quality Reduction Factors
COUNTY MONITORING STATIONS
Butte Chico and Gridley
Colusa Colusa
Glenn Willows
Placer Roseville
Sacramento T Street
Shasta Anderson
Sutter Yuba City
Tehama Anderson
Yolo-Solano Davis and Woodland
Yuba Yuba City
When any district’s midnight to 6:00 a.m. average PM2.5 is >= 27 micrograms per cubic meter (ug/m3) increasing
concentrations will result in increasing reductions in allocated acres (e.g., 27-28 is 20%, 29-30 is 40%, 31-32 is 60% and 33-
34 is 80%).
When any district’s midnight to 6:00 a.m. average PM2.5 is >= 35 ug/m3 a no burn day will be declared in that district.
North wind days{tc "North wind days"}
The ARB will reduce basinwide allocations on north wind days, if necessary, to a maximum of 8,000 acres to avoid air quality
impacts on urban areas in the southern part of the Sacramento Valley. On north wind days when the basinwide average
wind speed exceeds ten (10) MPH the Basin Met Factor (BMF) would be set to zero (0). In the allocation file, the ARB
provides notification language such as “Due to anticipated extensive air flow from north to south, the Air Resources Board
has curtailed the basinwide allocation to 2500 acres.”. The criteria for determining “extensive airflow from north to south”
are: widespread measured or forecast north winds and a north to south pressure gradient.
Rainfall effects{tc "Rainfall effects"}
The ARB allocations will be reduced to 2000 acres after a daily (as noted on the 12Z station reports or other available
information) rainfall amount that exceeds an average of 0.05 inches in the Valley. The BCC policy is to reduce large ARB
acreage allocations whenever wet conditions exist in the Valley and then increase acreage allocations on subsequent days
as the fields dry out. The wet day calculation is as follows:
Highest RI
RI today Previous 3 days Day is
0.00 - 0.00 1.51 or > Wet
0.01 - 0.05 0.81 or > Wet
0.06 - 0.11 0.51 or > Wet
0.12 - 0.17 0.25 or > Wet
SVAB SMP2010 Page 180.18 or > none required Wet
District staff, or their agents, shall perform crackle tests, as appropriate, on rice straw following 0.15 inches (or more)
average rainfall. Districts, or their agents, shall also advise growers of their responsibility to conduct a crackle test before
burning.
Special circumstances - Adverse air quality conditions{tc "Special circumstances - Adverse air quality conditions"}
A 'no-burn' day may be declared or the calculated acreage allocation reduced by the Air Resources Board if the burning of
that acreage may cause or contribute to a smoke episode. For this purpose a smoke episode may be defined as an area
characterized by either citizen complaints, restricted airport visibilities due to smoke, wildfires, or high PM2.5 levels. In
making these decisions the complaints must be verifiable and the visibility reductions must be evaluated for the effects of
relative humidity above 70%.
Special circumstances - Superior ventilation conditions{tc "Special circumstances - Superior ventilation
conditions"}
The ARB may, after consultation and concurrence with the SMPC, ABS chair, or delegated representative, increase the
acreage allocation amount and recommend extension of the burning hours, if the meteorological conditions are favorable
and current air quality readings indicate no air quality problems. The updated allocation may be selectively distributed by
the ARB or SMPC around the air basin to avoid potential problems or satisfy a request for more acres. The ARB duty
meteorologist has the authority to issue more than the minimum acres and extend burn hours prior to the regular ARB
acreage allocation time. ARB meteorologists will be available during the lunch hour to provide updates and likewise districts
will have staff available during the lunch hour to discuss updates. Also the ARB meteorologists must re-evaluate the
allocation numbers and contact the SMPC or districts to discuss the re-evaluation prior to the lunch hour, as appropriate.
For this purpose an exceptionally favorable meteorological condition may be defined as vigorous southerly air circulation,
and an originally calculated meteorological factor greater than 0.50. In this event the meteorological factor may be set to a
higher number (e.g., 0.6 to 1.0) based on an updated forecast and/or hourly PM10, PM2.5 or favorable field observation reports
may be used to calculate a new allocation. On many days air quality improves during the middle of the day because heating
has increased the volume of the mixed layer into which emissions are dispersed. As cooling occurs later in the day the
volume of air in the mixed layer again diminishes and particulate concentrations increase. The ARB will make the air quality
data available throughout the day on their web pages. The ABS chair or a delegated representative may initiate a request
that the ARB review the program data for a possible acreage increase. The update or updates may be issued at 9:30 AM,
10:30 AM, 11:30 AM and later as needed. ARB staff will review and share the written guidelines for update procedures with
the BCC to provide more consistency and efficiency in the allocation of acreage on good burn days. The ARB will provide
acreage updates directly to the districts, outside the fall burning period, as meteorological and air quality conditions warrant.
Communication procedures on early pre-storm days{tc "Communication procedures on early pre-storm days"}
The communication procedures for afternoons, evenings, and mornings on potential pre-storm, early-burn days are as
follows:
The meteorological services consultant will initiate the discussion on pre-storm forecasts and messages to districts. The
ARB, ABS chair, SMPC, and the meteorological services consultant will confer before deciding on the content of the
messages to be provided. The districts are expected to access the web pages to pick up the messages.
The SMPC and the meteorological services consultant will provide an initial message on the FB11AM file to advise of later
messages:
Message at 4:00PM on the meteorological services consultant web pages
Message at 9:30PM on the meteorological services consultant web pages
Message at 5:00AM on the meteorological services consultant web pages
SVAB SMP2010 Page 198. PROCEDURES FOR DISTRIBUTION AND ADJUSTMENTS OF ACREAGE{tc "8. PROCEDURES FOR
DISTRIBUTION AND ADJUSTMENTS OF ACREAGE"}
During the intensive fall burn season, the SMPC distributes acreage to the districts using the distribution equation described
below. The fall burn season is from September 1st through December 31st of each year. If significant rainfall shortens the
fall burn season, the SMPC will stop operations prior to December 31st. The Agricultural Burning Subcommittee, ARB, and
the SMPC will review harvest data and current and forecast rainfall amounts to determine when the intensive fall burn
season (i.e. SMPC operations) should be activated and deactivated.
The allocation of acreage to the growers should be managed by either the APCD/AQMD or the county Agricultural
Department whichever has the assigned responsibility. This would ensure that the allocation decisions are made by the
agency that has direct access to the air quality and meteorological files and is based upon the best, current data available. If
fire districts issue burn authorizations they shall report in a timely manner and on a daily basis to the district all allocations
made to growers in order to ensure that inspectors are aware of permissive burns as they occur.
Fall burn season acreage distribution equation{tc "Fall burn season acreage distribution equation"}
The SMPC uses the distribution equation during the intensive fall burn season. The distribution equation is used to distribute
acreage to the districts and uses the ARB initial basinwide acreage allocation or a lesser allocation as jointly determined by
the ABS and ARB.
The distribution equation does not apply to Shasta and Tehama counties. Those counties will receive 200 acres per day,
unless they request additional acres from the SMPC. Those counties will receive no acres if a no-burn day is declared.
The distribution equation is:
County Acreage Allocation = CP * BA
The variables of the equation are:
VARIABLE VALUE OF VARIABLE
Basin Allocation (BA) BA from initial CARB allocation
County Proportion (CP) CW / sum of all CW
County Weighting Factor (CW) AQ * VR *(CF/BF+CR/BR+BS/CS)
Air Quality Factor (AQ) 0-1
Ventilation Rating Factor (VR) 1-5
County Fall Total Acres (CF) Total burned to date
Basin Fall Total Acres (BF) Sum of all CF
County Ready Acres (CR) As reported by each county
Basin Ready Acres (BR) Sum of all CR
County Success Ratio (CS) 0-1
Basin Success Ratio (BS) 0-1
Definitions of Ventilation Rating Factor and Success Ratios:
The ventilation rating factors are provided by the meteorological services consultant and are the average of the total zone
SVAB SMP2010 Page 20rating factors of each district (e.g. Glenn has four zones and thus four zone rating factors). The factors are a composite
number based upon available meteorological data and have been assigned values, from one to five, and the corresponding
qualitative judgments by the meteorological services consultant:
1) Considerable impact in region regardless of placement of fires
2) Considerable impact in region if caution in placement of fires not used
3) Some impact in region but impact is acceptable
4) Minor localized impact within region
5) Minimal or no impact in region
The ventilation rating is a subjective number produced by professional meteorologists trained specifically in smoke
management practices. The meteorologist takes into account surface and upper level wind strength and direction,
atmospheric stability, field moisture, major roadways, urban areas, and approaching frontal systems. Prior to assigning the
rating for specific regions the duty meteorologist reviews all relevant weather information that may have an impact on the
movement and dispersion of smoke from burning agricultural field waste. The meteorologist reviews satellite and radar
images and surface and upper air prognostic charts to gain a complete understanding of the current and future weather
pattern within the Air Basin during the burning period (generally 11am to 3pm). After reviewing all relevant documents and
preparing the forecast, the final task prior to disseminating the information is to assign the rating for each designated region.
The Success Ratio for each county is derived from basin totals divided by county totals for ready acres and the 2000
historical planting acreage of rice, corn, wheat and safflower.
2000 acreage information
District/County 100% rice 50% corn 100% wheat 100% safflower County Totals
Butte 98,000 7,106 2,500 600 108,206
Colusa 147,270 3,660 18,900 11,600 181,430
Glenn 87,383 16,285 17,127 1,195 121,990
Placer 15,799 653 441 32 16,925
Sacramento 7,606 37,225 15,018 7,349 67,198
Sutter 118,157 6,992 9,500 16,078 150,727
Yolo/Sol 36,229 50,839 79,195 31,845 198,108
Yuba 36,620 1,053 538 210 38,421
Shasta 2,677 0 500 0 3,177
Tehama 1,000 1,300 2,000 250 4,550
Basin Totals 550,741 125,113 145,719 69,159 890,732
Success Ratio =
IF (((Basin ready/Basin 00 subtotal)/(county ready/county total))>2,2 ((Basin ready/Basin 00 subtotal)/(county ready/county
total)))
Spring, summer, and winter acreage distribution system{tc "Spring, summer, and winter acreage distribution
system"}
During times outside of the intensive fall burn season the ARB will distribute the allocated acreage directly to the counties.
The SMPC is not in operation during this time.
SVAB SMP2010 Page 21The ARB will distribute acres to the counties during this time based upon the following table. The percentages or minimums
in the following table represent the approximate total county to total basin burning acreage for the winter, spring, and
summer seasons. The primary crop residues burning during these time periods are from rice, wheat, corn, safflower, and
orchards.
Notwithstanding these percentages, the ARB may adjust the distribution based upon current burning, meteorological, and air
quality factors.
SPRING, SUMMER AND WINTER ACREAGE DISTRIBUTION SYSTEM
COUNTY ACREAGE DISTRIBUTION
Butte 17 %
Colusa 17 %
Glenn 13 %
Placer 5%
Sacramento 9%
Shasta 200 acres minimum, unless county requests an update.
Sutter 17 %
Tehama 200 acres minimum, unless county requests an update.
Yolo/Solano 15 %
Yuba 7%
North/South acreage shifts{tc "North/South acreage shifts"}
The north/south acreage shift will occur only on those days with the meteorological conditions described below or when the
ARB declares a north wind day. The decision to shift must be based upon current meteorological conditions and a prediction
that the conditions will persist for the time needed to complete burns and disperse the smoke. Data from all AMOS and
airport stations basinwide must meet the criteria for a shift. The range of shifting can vary from 10% to 50% of the basinwide
allocation.
Wind direction (WD): consistent, basinwide northerly/southerly flow surface and aloft (WD 0 or 1)
Duration time (DT): more than 2 hours measured/predicted to continue several hours (DT 0 or 1)
Wind speed (WS): =>5 or =>8 or =>11 MPH (WS 10-30%)
Mixing depth (MD): =>2000 or =>3000 Feet (MD 10-20%)
Shift%: = WD * DT * (WS%) + (MD%)
The North shift goes to: Glenn, Butte, and Sacramento and Yolo/Solano's south zones and Colusa's north zones.
The South shift goes to: Colusa, Sutter, Yuba, Placer, and Sacramento's and Yolo/Solano's north zones only.
The meteorological differences north and south of the Sutter Buttes will be taken into account.
Spatial management of burning{tc "Spatial management of burning"}
SVAB SMP2010 Page 22When meteorology and/or air quality is more favorable in one or more areas, additional acreage will be placed in those areas
or directly to a zone(s) within a district around the valley but such re-distribution shall never over-concentrate the acreage in
any part of the valley. The re-distribution of acreage by the SMPC will take into account weather and air quality differences
between the north and south sections of the Valley. Prescribed burning will be incorporated into the spatial management of
the burning, by the district, in order to minimize air quality impacts. Project size, elevation and location will be factors
considered in the management of prescribed burning.
9. ALLOCATION TYPES AND UPDATES{tc "9. ALLOCATION TYPES AND UPDATES"}
Initial allocation: During the fall burning season the ARB and SMPC will consult on daily meteorological and air quality
conditions, prior to the ARB allocation decision, to determine the appropriate initial basinwide acreage allocation for the day.
Interim allocation: After the initial basinwide acreage allocation is determined for regular burn days, the SMPC may issue
acreage updates to districts, at their request, up to the next, interim basinwide allocation limit of 4,000, 7,500, or 10,000
acres. Coordination is required between the ARB and SMPC to exceed the interim limits. At the 4,000 and 7,500 acre
thresholds the Meteorology Section makes the decisions so that a prompt response is given to the SMPC.
Maximum theoretical allocation: The acreage allocation permitted by the applicable equation that can only be exceeded if
an updated allocation is given by CARB.
Updated acreage distribution: The SMPC may update the distribution of acres to districts, if warranted, between the initial
and interim allocations and up to the maximum allocation limit for days with an initial allocation of greater than 4000 acres.
Districts must provide field observation information, the latest meteorological data (remember data polling times), and air
quality reports when requesting updates from the SMPC.
Updated ARB acreage allocation: The ARB and the SMPC may consult and jointly decide to update the initial, interim, or
maximum allocation after they have received new air quality and meteorological data and reports from district field
observations that represent conditions after morning burning. Allocation updates shall be available only when air quality and
meteorological data indicate.
Districts will provide information on the total acres burned and designated to be burned up to the hour of the request for
updates to the ARB. The information will include reports of district observations of burning conditions and local meteorology
and air quality. Report information to the ARB, via fax, on the reporting form provided by the ARB. This information will be
used to evaluate the air quality impacts of burning already underway or completed.
10. DATA MANAGEMENT FOR THE INTENSIVE FALL BURN SEASON{tc "DATA MANAGEMENT FOR THE
INTENSIVE FALL BURN SEASON"}
Districts shall keep track of ready and burned acreage using the software provided or a facsimile that produces the same file
structures and summary data. The purpose of this database software is to maintain files of each grower’s fields, total ready
acres and total burned acres. The software also produces a summary data file for the previous day. This file is sent to the
SMPC and entered into the basinwide data tracking system. In reporting “prorated acres” each district or county may add
up to 25% of their total planted rice acres with the fields added after they are harvested and meet drying times. Districts or
counties may also augment the rice number with any other crop burning acreage.
11. COMPUTER FILES AND DATA RETRIEVAL TIMETABLE{tc "COMPUTER FILES AND DATA RETRIEVAL
TIMETABLE"}
Computer files: The burn program relies on timely transmission, review, and analysis of pertinent air quality, meteorological,
and burning information. These data are critical to burning management decisions. Computers are used to transmit the
data. Computer files generated during the fall burn season are:
SVAB SMP2010 Page 23You can also read