The Beneficial Impacts of COVID-19 Lockdowns on Air Pollution: Evidence from Vietnam - IZA DP No. 13651 SEPTEMBER 2020
←
→
Page content transcription
If your browser does not render page correctly, please read the page content below
DISCUSSION PAPER SERIES

IZA DP No. 13651

The Beneficial Impacts of COVID-19
Lockdowns on Air Pollution:
Evidence from Vietnam

Hai-Anh H. Dang
Trong-Anh Trinh

SEPTEMBER 2020
DISCUSSION PAPER SERIES

IZA DP No. 13651

The Beneficial Impacts of COVID-19
Lockdowns on Air Pollution:
Evidence from Vietnam

Hai-Anh H. Dang
World Bank, IZA, Indiana University and Vietnam Academy of Social Sciences
Trong-Anh Trinh
World Bank

SEPTEMBER 2020

Any opinions expressed in this paper are those of the author(s) and not those of IZA. Research published in this series may
include views on policy, but IZA takes no institutional policy positions. The IZA research network is committed to the IZA
Guiding Principles of Research Integrity.
The IZA Institute of Labor Economics is an independent economic research institute that conducts research in labor economics
and offers evidence-based policy advice on labor market issues. Supported by the Deutsche Post Foundation, IZA runs the
world’s largest network of economists, whose research aims to provide answers to the global labor market challenges of our
time. Our key objective is to build bridges between academic research, policymakers and society.
IZA Discussion Papers often represent preliminary work and are circulated to encourage discussion. Citation of such a paper
should account for its provisional character. A revised version may be available directly from the author.

 ISSN: 2365-9793

 IZA – Institute of Labor Economics
Schaumburg-Lippe-Straße 5–9 Phone: +49-228-3894-0
53113 Bonn, Germany Email: publications@iza.org www.iza.org
IZA DP No. 13651 SEPTEMBER 2020

 ABSTRACT
 The Beneficial Impacts of COVID-19
 Lockdowns on Air Pollution:
 Evidence from Vietnam*
 Little evidence currently exists on the effects of COVID-19 on air quality in poorer countries,
 where most air pollution-linked deaths occur. We offer the first study that examines the
 pandemic’s impacts on improving air quality in Vietnam, a lower-middle income country
 with worsening air pollution. Employing the Regression Discontinuity Design method to
 analyze a rich database that we compile from satellite air pollution data and data from
 various other sources, we find the concentration of NO2 to decrease by 24 to 32 percent
 two weeks after the COVID-19 lockdown. While this finding is robust to different measures
 of air quality and model specifications, the positive effects of the lockdown appear to
 dissipate after ten weeks. We also find that mobility restrictions are a potential channel for
 improved air quality. Finally, our back-of-the-envelope calculations suggest that two weeks
 after the lockdown, the economic gains from better air quality are roughly $0.6 billion US
 dollars.

 JEL Classification: D00, H00, O13, Q50
 Keywords: COVID-19, air pollution, mobility restriction, RDD, Vietnam

 Corresponding author:
 Hai-Anh H. Dang
 Data Production & Methods Unit
 Development Data Group
 World Bank
 1818 H St. N.W.
 Washington, D.C. 20433
 USA
 E-mail: hdang@worldbank.org

 * We would like to thank Paolo Verme for helpful feedback on an earlier version. Dang would also like to thank the
 UK Department of International Development for additional funding assistance through a Knowledge for Change
 (KCP) grant for the World Development Report 2021 “Data for Better Lives”. Trinh acknowledges support from the
 World Bank Young Fellows Program in Forced Displacement.
1. Introduction

The COVID-19 pandemic has now been recognized as a global health catastrophe that resulted

in more than 800,000 deaths worldwide between late 2019 and August 2020. During the

pandemic, countries all over the world have implemented lockdowns to slow down its

infection. A wide range of policy responses such as stay-at-home orders, social distancing, and

closure of retail establishments and non-essential businesses were used to limit movements.

Against a considerable and growing body of literature on the negative economic consequences

of the pandemic (e.g. Akesson et al., 2020; Baker et al., 2020; Dang et al., 2020; Fairlie et al.,

2020),1 a handful of studies emerged that point to the unexpected beneficial impacts of

COVID-19 on global air quality (e.g. Dang and Trinh, 2020; Venter et al., 2020).

 Air pollution poses major challenges to human health such as heart and lung damage and

other diseases (Liu et al., 2019; WHO, 2006) and it is estimated to cause more than 4.6 million

annual deaths worldwide (Cohen et al., 2017). Human industrial and traffic activities represent

a significant contribution to reduced air quality (World Bank, 2016). Most recorded air

pollution-linked deaths occur in developing countries, where environment protection laws

regarding these activities are weak or do not even exist.2 But few studies currently exist that

can quantify the impacts of these activities on air quality in a low-income country context.

Furthermore, little evidence is available on key policy issues. In particular, does the COVID-

19-induced lockdown (and resulting cessation of activities) also have positive impacts on the

air quality of low-income countries as it does globally? If it does, how long do these impacts

last after the lockdown? What are the major channels of air pollution reduction? Could we

1
 See also Bloom et al. (2020) and Brodeur et al. (2020a) for recent reviews of the economics literature on COVID-
19.
2
 Recent estimates by WHO (2016, 2018) indicate that more than 90 percent of pollution-linked deaths occur in
low- and middle-income countries. Mannucci and Franchini (2017) observe that low- and middle-income
countries have experienced an intense process of urbanization and industrial development in a much shorter period
of time than high-income countries, which has resulted in the former group of countries having the largest air
pollution-related burdens in recent years.

 1
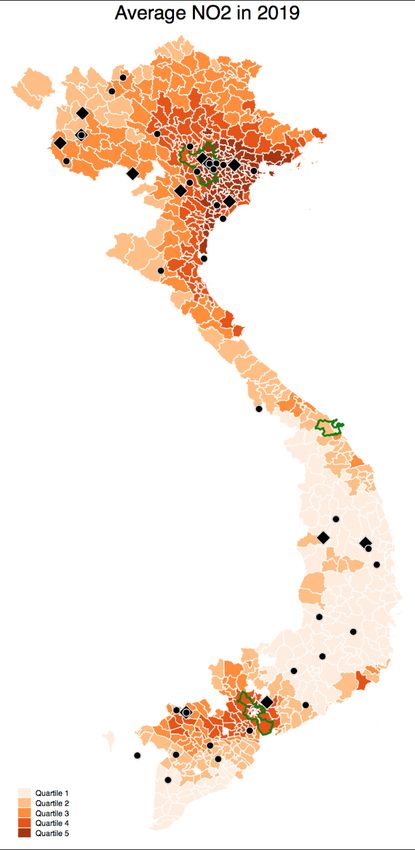
compare the costs and benefits on air quality of the complete cessation of activities induced by

the lockdown?

 We makes several new contributions to the literature in this study. We provide an

investigation into the key policy issues discussed above, some of which were examined

separately, but not together, in previous studies. Vietnam—a lower-middle income country—

offers an interesting case study to examine these questions. The country has been struggling

with alarming air pollution that has been steadily rising with economic growth. Economic

losses associated with ambient air pollution are estimated to cost Vietnam more than $25 billion

USD, which equals 5.5 percent of the country’s Gross Domestic Product (GDP) (World Bank,

2016). Figure 1 shows that Vietnam’s concentration of PM2.5 (fine particulate matter) is above

the global average for the past 20 years. It is comparable to that of China—a country with a

widely recognized high record of air pollution—and below countries currently with the most

polluted air levels such as Bangladesh and India. Indeed, the capital city Hanoi experienced

only eight days in 2019 during which air quality would be considered healthy by the national

standards (Do, 2020).3

 At the same time, Vietnam achieved early success against the COVID-19 pandemic with

few cases of infection and death.4 The government imposed a nationwide lockdown between

April 1 and April 14, 2020, which entailed tough controls on mobility and cessation of

economic activities. This setting provides a natural experiment to investigate whether the

lockdown helps reduce the existing air pollution levels. To our knowledge, we offer the first

study to examine the impacts of the COVID-19 lockdown on air quality for Vietnam.5

3
 The country’s national standard is 50 micrograms per cubic meter (µg/m3). The number of days with unhealthy
air quality would be even smaller if the World Health Organization’s annual safety threshold of 10 µg/m3 is
applied. Another estimate suggests that Vietnam’s concentration of PM2.5 increases by 33 percent between 1990
and 2013 (World Bank, 2016).
4
 From January 1 to July 1, 2020, the country reported more than 500 infection cases and zero death.
5
 In fact, hardly any academic study currently exists on the economic impacts of COVID-19 in Vietnam. For
example, an exception is a recent study by Dang and Giang (2020) that conduct a web-based assessment survey
and examine household finance and economic expectations during the pandemic.

 2
Finally, we obtain estimation results by applying a rigorous econometric technique on a

rich database that we compile from various reliable sources; this framework of analysis can

also be extended to other countries (as illustrated later in Section 5.2). In terms of econometric

modelling, a major challenge to estimating the causal impacts of COVID-19 on air quality is

endogeneity issues. There can be unobserved factors that simultaneously affect lockdown

policies and air quality. For example, low-income countries likely have implemented less

stringent policies during the pandemic and may also have weaker environment protection

programs in place that ensure better air quality. Furthermore, air pollution may be positively

associated with the number of infection cases (Cicala et al., 2020; Cole et al., 2020; Isphording

and Prestel, 2020). We overcome these issues by using the Regression Discontinuity Design

(RDD) approach, a quasi-experimental econometric technique that allows us to rigorously

compare the impacts of the lockdown on air quality in a time window around the lockdown

date.6 We also undertake a number of robustness exercises that further support our finding such

as employing different time bandwidths, functional forms, and estimation methods.

 We obtain daily data on air pollution at the district level from the satellite data provided

by the European Union’s Copernicus programme. We use nitrogen dioxide (NO2) as the main

indicator of air pollution, and other parameters such as Carbon Monoxide (CO), Sulphur

Dioxide (SO2), and Ozone (O3) as alternative measures. Our paper departs from the station-

based data used in a number of previous studies, which are likely not random and do not

provide representative data on an area’s air quality. We combine these satellite air quality data

with a variety of real-time data sources for richer analysis including daily weather data, real-

time human mobility data, government responses to COVID-19, and other sub-national

6
 Some previous studies carefully compare the level of air pollution over different time periods, for example in
previous years and the current year (e.g., Venter et al., 2020). However, this approach does not allow more detailed
within-year analysis of the duration of the impacts as we do in this study.

 3
characteristics. Incidentally, we also provide a new dataset on the official lockdown dates for

67 countries around the world.

 Our findings suggest that the lockdown imposed to combat COVID-19 improves air

quality in Vietnam. Specifically, the average concentration of NO2 drop by approximately 24-

32 percent two weeks after the lockdown date. While this result is consistent across measures

of air pollution and model specifications, we find that the effects tend to fade away ten weeks

after the lockdown. When further exploring the heterogeneous effects of lockdown policies,

our results show that the positive impacts of the lockdown on air quality are more pronounced

in areas without coal-fired stations and cement plants. We also find the lockdown to be

associated with less mobility in different categories except for residential mobility. Lastly, our

back-of-the-envelope calculations show that two weeks after the lockdown, the economic gains

from better air quality are roughly $0.6 billion US dollars.

 The remainder of the paper is organized as follows. We review recent studies on COVID-

19 and air pollution and present an overview of air pollution in Vietnam in the next section.

We subsequently describe the database that we construct for analysis in Section 3 before

discussing the empirical model in Section 4. In Section 5, we present the main findings together

with robustness checks and further extensions (Sections 5.1 and 5.2), discuss the potential

channels for improving air quality (Section 5.3), and offer some back-of-the-envelop cost-

benefit analysis (Section 5.4). We finally conclude in Section 6.

2. Literature Review and Air Pollution in Vietnam

2.1. Literature Review

Several studies investigate changes in air quality during the pandemic at the global scale. Using

an input-output model for 38 regions around the word, Lenzen et al. (2020) find the pandemic

to reduce greenhouse gas, PM2.5, and air pollutants by 4.6 percent, 3.8 percent and 2.9 percent

 4
of the global annual totals, respectively. Comparing air quality during the pandemic with that

in previous years, Venter et al. (2020) analyze station-based air quality data in 34 countries

and find concentration of NO2 and PM2.5 to decrease by approximately 60 percent and 31

percent, respectively. Most recently, using a sample of 174 countries, Dang and Trinh (2020)

find a 9.1 percent decrease in concentration of NO2 90 days after the lockdown. Given the

difficulty of identifying comparable lockdown dates across country, this study employs the

Oxford COVID-19 Government Response Tracker (OxCGRT) data and defines the lockdown

date as the first day on which the government response index becomes positive.

 Studies focusing on specific countries reach a similar finding of the unintended

consequence of COVID-19. Early studies investigate this relationship in Hubei, the province

at the center of the outbreak, and other regions in China (Almond et al., 2020; Chen et al.,

2020; He et al., 2020). For example, He et al. (2020) show that city lockdowns led to

considerable improvement in air quality as measured by Air Quality Index (AQI) and PM 2.5.

Similarly, Almond et al. (2020) show a significant decrease in concentration of NO2, but the

finding does not hold for other parameters of pollution such as SO2 and O3. Outside China,

Brodeur et al. (2020b) find the lockdown to result in reduced PM2.5 emissions in the United

States. Tobías et al. (2020) find that NO2 concentration decreased by half during the lockdown

in Spain, an early COVID-19 hotspot. Related research in environment studies also suggests

considerable declines in pollutant parameters during and after the lockdown (e.g. Berman and

Ebisu, 2020; Sharma et al., 2020).7

 In terms of identification strategy, a simple comparison of air quality before and after the

lockdown date can be problematic since it fails to account for unobservable factors and might

7
 Some studies investigate the related issue of how the outbreak-induced changes in air quality affect health
outcomes. For example, Cicala et al. (2020) use a sample of more than 3,100 counties in the United States and
show that reductions in emissions from travel and electricity usage reduce deaths by over 360 deaths per month.
Cole et al. (2020) indicate that an increase in PM2.5 concentrations of 1 /m3 is associated with an increase in
COVID-19 cases of between 9.4 and 15.1 in the Netherlands. These findings further point to the challenges of
identifying the causal effects of COVID-19 on air pollution.

 5
only capture the increasing (or decreasing) trend in air pollution over time. A number of studies

thus have employed a difference-in-differences model in order to infer causal relationships

(Almond et al., 2020; Brodeur et al., 2020b; Chang et al., 2020; He et al., 2020). In this paper,

we follow Dang and Trinh (2020) and employ a more rigorous RDD approach to estimate the

impact of lockdown on air pollution.8 We use the number of days from the lockdown date as

the running variable. As a robustness check, we also obtain the government response indexes

from OxCGRT data and conduct an alternative fuzzy RDD model (Section 4).

2.2. Air Pollution in Vietnam

Air pollution is one of the major environmental concerns in Vietnam, which has worsened

alongside the country’s steady economic growth in the recent decades. The country is ranked

as the fifth highest emitter of black carbon in the world during the period 2000 – 2008

(Kurokawa et al., 2013). Among Southeast Asian countries, Vietnam is expected to be most

affected by pollution due to coal plant emissions by 2030 (Koplitz et al., 2017). The country is

also exposed to a rising high concentration of PM2.5 as earlier discussed with Figure 1.

 Several key factors that can contribute to high air pollution levels in Vietnam include

power generation, industry, residential buildings, and transportation. Among those, coal-fired

power is the main source of air pollution which contributes to 4,300 premature deaths in 2011

(Koplitz et al., 2017). Still, coal consumption has increased remarkably over the past decade

and coal-fired power currently takes the lion’s share of power generation, accounting for more

than 40 percent of the country’s total generated power (Baker, 2018). The country expects to

build 26 additional coal power stations after 2020, despite its plans to generate more electricity

from renewable sources (Bich Ngoc, 2018). For illustrative purpose, Figure 2 shows

8
 The RDD approach has also been used to study the impacts of COVID-19 on well-being, employment, mobility
and traffic accidents (Barnes et al., 2020; Brodeur et al., 2020c; Chetty et al., 2020).

 6
concentration of NO2 across districts in Vietnam in 2019, as well as the distribution of coal-

fired power stations and cements plants. Most of these plants are located in the north of the

country, which may possibly contribute to higher levels of air pollution in this region compared

to the south of the country (Popovich et al. 2019; Nguyen Quy, 2020).

 Although air pollution has become an alarming issue in Vietnam, only a handful of health

studies have been conducted to examine its negative effects on human health. In particular,

Luong et al. (2017) find a strong relationship between air pollution and respiratory illnesses,

where an increase of 10 μg/m3 in PM2.5 is associated with a 2.2-percent higher risk of hospital

admission. Analyzing 57,851 hospital admissions over eight years in Hanoi, Nhung et al.

(2018) show that more concentration of NO2 is associated with pneumonia-related

hospitalizations. Examining a sample of the two largest hospitals in Ho Chi Minh City, Phung

et al. (2016) observe an increase in respiratory admissions of between 0.7% to 8% for a 10-

μg/m3 increase of each of the pollutants PM10, NO2, and SO2.

3. Data

We obtain air pollution measurements in Vietnam from January 1 to July 1, 2020, provided by

the Sentinel-5P/TROPOMI (S5P) instrument of the European Union’s Copernicus programme.

The S5P satellite uses spatial resolution of 5.5 km and provides a (near-)global coverage of air

pollution caused by NO2 and other pollutants such as O3, SO2, and CO. We use Google Earth

Engine to process and average air quality parameters at the district level and perform a cloud

masking exercise to address the issue of cloud cover. We use NO2 as the main measure of air

pollution for two reasons. First, NO2 is a highly reactive pollutant and considered highly lethal

to human health (Faustini et al., 2014). It is also the leading source of childhood asthma in

urban areas globally (Achakulwisut et al., 2019). Second, NO2 has a short lifetime which

 7
implies that its molecules stay fairly close to their sources and thus offer an appropriate measure

of changes in emissions.9

 Since concentrations of NO2 in the atmosphere are highly variable and sensitive to

changes in weather conditions, we collect global daily data on temperature and precipitation

from the National Center for Environmental Prediction (NCEP) at the National Oceanic and

Atmospheric Administration (NOAA) as control variables. We extract the weather data at the

district level using a similar process as with the air pollution data.

 To investigate the channels of impacts and heterogenous impacts, we further collect data

on various indicators. These variables are mostly available at the province level (except for the

nighlight data at the district level) and include i) the locations of coal-fired stations and cement

plants, ii) industrial production (including foreign direct investment and monthly nightlight

data), iii) public perceptions about environment, and iv) human mobility patterns. These data

come from different sources including the Statistical Yearbook published by the General

Statistical Office of Vietnam, the NOAA, the Provincial Governance and Public

Administration Performance Index provided by the Centre for Community Support

Development Studies (CECODES), the Fatherland Front, and the United Nations Development

Programmes (UNDP), the Google COVID-19 Community Mobility Reports, and the Apple

COVID-19 Mobility Trends Reports.

 To further check on the robustness of our findings, we obtain information on government

response indexes from the Oxford COVID-19 Government Response Tracker (OxCGRT). This

tracker implemented by the University of Oxford’s Blavatnik School of Government

systematically collects information on policy stringency taken by governments to tackle the

9
 NO2 is recommended by the European Union’s Copernicus programme as the most appropriate indicator of air
pollution. For more details, see: https://atmosphere.copernicus.eu/flawed-estimates-effects-lockdown-measures-
air-quality-derived-satellite-observations?q=flawed-estimates-effects-lockdown-measures-air-quality-satellite-
observations. We analyze the S5P satellite data since they are available around the lockdown date of April 2020
for Vietnam. We plot Figure 1 based on the historical data on PM2.5 that are available up to 2016.

 8
pandemic since February 2020 (Hale et al., 2020). We provide a more detailed discussion of

the various datasets and their sources in Appendix B.

4. Empirical Model

A naïve approach to estimate the effects of the COVID-19-induced lockdown on air pollution

is to perform Ordinary Least Squares (OLS) regressions with changes in air quality as the

dependent variable and the lockdown as the independent variable. However, this approach is

likely biased because there are often observable and unobservable characteristics correlated

with both variables, such as governance quality and public preferences for protecting the

environment. Furthermore, establishing causality is difficult in this context because air

pollution is positively associated with the number of COVID-19 cases (Cicala et al., 2020;

Cole et al., 2020; Isphording and Prestel, 2020), which can lead to governments implementing

more stringent lockdown. Failure to control for possible reverse causality would result in biased

estimates of the effects of the lockdown.

 To address these econometric concerns, our empirical strategy is to leverage the sharp

discontinuities of economic activities when the lockdown goes into effect and employ the

(sharp) Regression Discontinuity Design (RDD) model. The motivation of the RDD approach

is that within a relatively narrow window of time around the lockdown date, the unobserved

factors influencing air quality are likely similar so that observations before the lockdown

provide a counterfactual group that can be compared with observations after the lockdown.10

More formally, the treatment effect can be estimated as the changes in air quality ( ) in the

neighborhood of the lockdown date

 = lim [ | = 0 + ] − lim [Α| = 0 + ] (1)
 ↓0 ↑0

10
 See, for example, Cattaneo et al. (2020) for a textbook introduction to RDD methods.

 9
where is the number of days before and after the official lockdown dates. We subsequently

estimate the following reduced form equation

 = + ( ) + + + + (2)

 In Equation (2), the outcome of interest ( ) is changes in air quality on day t in district

i. The parameter of our interest is , the (local average treatment) impacts of the lockdown on

air pollution.The treatment variable ( ) is a dummy variable that equals 1 after the lockdown

and 0 otherwise. is the running variable which represents the number of days before and

after the official lockdown date. To provide robust analysis and for comparison purposes, we

let the function ( ) take different functional forms to flexibly control for variations in air

quality that would have occurred in the absence of the lockdown. They include (i) the linear

model ( ), (ii) the linear model with the interaction term of the running variable and the

 2
treatment variable ( * ), (iii) the quadratic model ( ), and (iv) the quadratic model with

 2
the interaction term of the running variable and the treatment variable ( * ). As the

lockdown in Vietnam was implemented between April 1 and April 14, 2020, we use a

bandwidth of two weeks before and after the lockdown date (April 1) as our preferred time

bandwidth. But we also present results for different bandwidths to investigate the duration of

the lockdown impacts.

 We include in Equation (2) , a vector of control variables that may affect air quality

such as daily temperature and daily precipitation. Finally, province fixed effects ( ) and time

fixed effects ( ) are also included to absorb the effects of unobservable time-invariant

province or time characteristics, and denotes the error term. We cluster the standard errors

at the district level.

 Equation (2) assumes a sharp RDD model where the lockdown is strictly implemented

in Vietnam. This model is consistent with the widely accepted views in both the academic

literature and the media about the country’s strict and successful implementation of the

 10
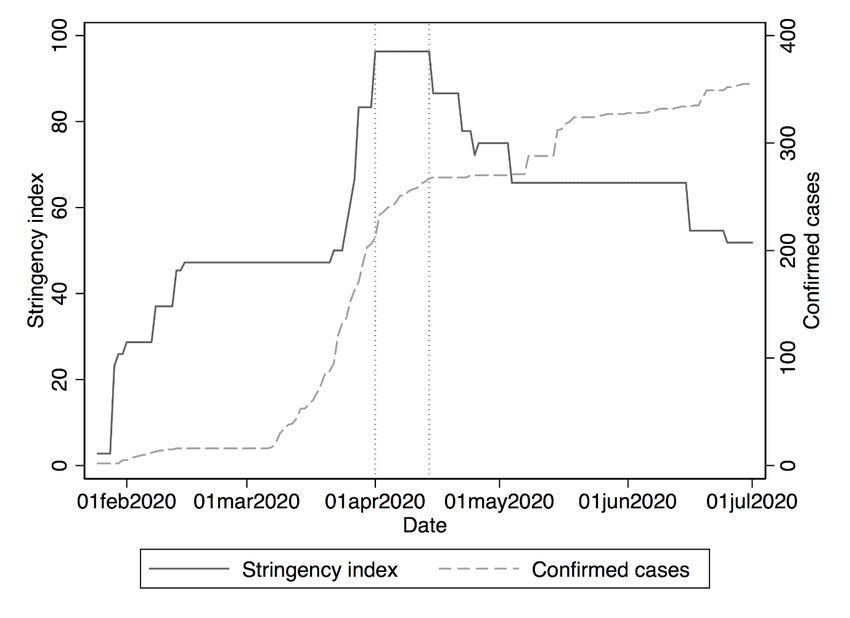
lockdown (Huynh, 2020; La et al., 2020; Mandhana and Le, 2020; Trevisan et al., 2020).11 But

as a robustness check for the (unlikely) case that not all business activities and travel cease

exactly by the time of the lockdown, we employ a fuzzy RDD model where the running variable

measures the degrees of strictness of the lockdown implementation. We obtain these running

variables (indexes) from the OxCGRT data, which range from 0 to 100, with higher scores

indicating more stringent policies. As illustrated in Figure A1 (Appendix A), the stringency

index increases significantly over time and reaches the highest value during the two weeks of

the lockdown. We create an instrument for the lockdown variable, which equals one when

the stringency (or response) index of government policies is positive ( > 0). We then

apply the Two-Stage Least Squares (2SLS) method to estimate the following equations

 = + ( ) + + + + (3)

 = + ℎ( ) + + + + (4)

We employ different indexes from the OxCGRT data including (i) the stringency index, (ii)

the government response index, and (iii) the containment and health index.12 Similar to

Equation (2), we control for weather conditions as well as the province and time fixed effects.

 We now discuss some potential threats to the validity of our RDD approach. First, we

implement the formal test proposed by McCrary (2008) to investigate whether there is any

discontinuity in the density of the running variable (i.e., the number of days from the lockdown

date) around the cut-off point. We follow the procedure implemented by Cattaneo et al. (2018)

and provide the estimation results in Table A1 (Appendix A), which suggest that the difference

11
 Vietnam has won praise for its early success in controlling the COVID-19 pandemic. For example, the spirit of
the country’s fight against the pandemic can perhaps be best epitomized in the words of the Prime Minister of
Vietnam Nguyen Xuan Phuc “Every business, every citizen, every residential area must be a fortress to prevent
the epidemic” (Pham, 2020). Protection measures such as social distancing, washing one’s hands, and staying at
home were portrayed as actions of patriotism, and these message were well received by the public (Le Thu, 2020;
M.Giao, 2020).
12
 The OxCGRT data also calculates economic support index. Our analysis does not use this measure as it only
includes income support programs and debt relief programs and does not fully capture the overall responsiveness
of the government to COVID-19.

 11
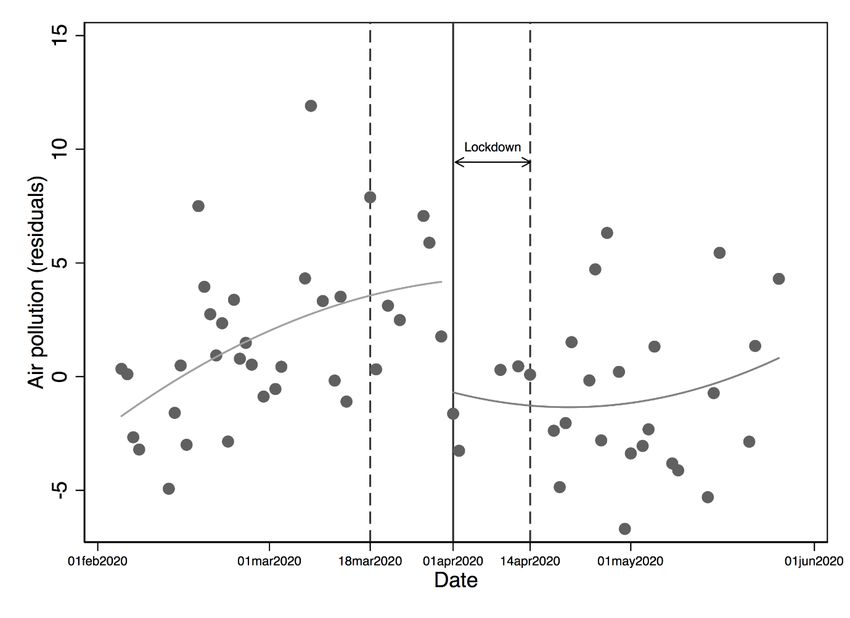
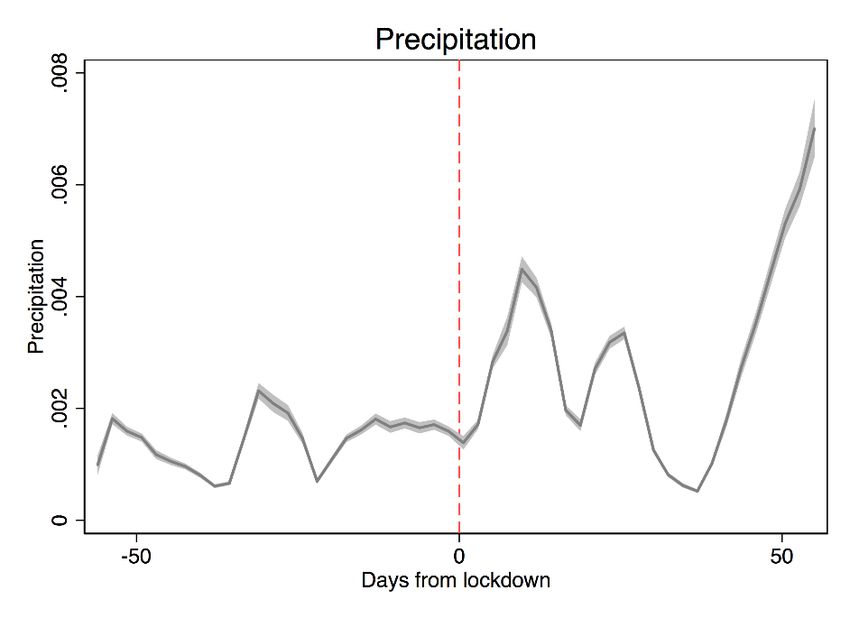
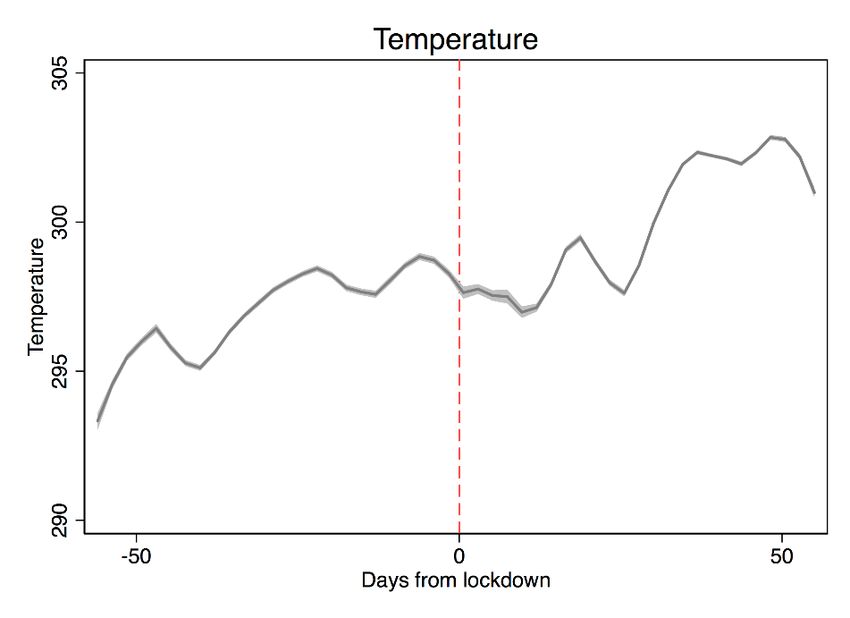
between the frequency to the right and to the left of the threshold is not statistically significant.

As such, we fail to reject the null hypothesis that the jump in the density of the running variable

at the cut-off is zero.

 Another concern is that the covariates should not jump around the cut-off (i.e., the official

lockdown date). In our analysis the key control variables are temperature and precipitation.

Following Lee and Lemieux (2010), we replace the dependent variable in Equation (2) by each

of the weather variables and estimate the coefficient on the treatment variable, while

controlling for province and time fixed effects. Figure A2 (Appendix A) shows that there is no

discontinuity at the cut-off point, which rules out this concern.

5. Estimation Results

5.1. Main Findings

As a first look at the impacts of the COVID-19-induced lockdown on air quality, we run a data-

driven RDD regression of the concentration of NO2 against the number of days around the

lockdown date, using the optimal (time) bandwidth proposed by Imbens and Kalyanaraman

(2012). We plot in Figure 3 the results, which show that air pollution sharply descreases two

weeks after the lockdown date. We also observe that the reduction of air pollution diminishes

over a larger bandwidth. This suggests that the impacts of the lockdown on air quality may

exist only in the short-term.

 We turn next to estimate the effects of the lockdown on air pollution using the sharp

RDD model presented in Equation (2). We report the estimation results in Table 1. Each of the

24 cells in this table represents the impacts of the lockdown estimated from a separate

regression, with the bandwidth shown in the column headings and the functional form of the

running variable shown in the row headings. We control for the province and time fixed effects

and cluster the standard errors at the district level in all the regressions. Our preferred models

 12
are presented in Columns (2), (4), and (6) which control for weather conditions (i.e.,

temperature and precipitation). But we also present the results without these control variables

in Columns (1), (3), and (5) for comparison and robustness checks.

 Overall, Table 1 suggests that the COVID-19-induced lockdown has strongly statistically

significant impacts on improving air quality at the 1 percent level. This result remains

qualitatively similar, regardless of inclusion of control variables, different functional forms of

the running variable, or time bandwidths around the lockdown date. We are particularly

interested in the bandwidth of two weeks as this is the duration of the official lockdown in

Vietnam. The estimation result suggests that the lockdown leads to a 5.808 (mol/km2) decrease

in the concentration of NO2 (Panel A, column 2), which equals a 24-percent reduction

(compared to an average value of NO2 of 24.441 mol/km2 before the lockdown). Using

different functional forms of the running variable (Panels B to D) results in similar estimates,

although the magnitude of impact is more pronounced when we account for non-linearity. For

example, the estimated impacts are larger at 32 percent for the model with the quadratic

interaction term (Panel D, column 2).

 These estimated impacts are stronger than that of Dang and Trinh (2020) who find a 9.1

percent decrease in air pollution using global data, but are more or less comparable to those in

country-specific studies. For example, Almond et al. (2020) show a decrease in concentration

of NO2 in Hubei and all regions in China by 43.6 percent and 31.4 percent, respectively.

Berman and Ebisu (2020) find a decline of 25.5 percent of NO2 in the United States, while

Sharma et al. (2020) find a smaller impact of 18 percent in India. It should be noted that most

of these studies use a larger window of time when comparing changes in air pollution during

the lockdown with those based on historical data (e.g., previous years).

 Table 1 also suggests that the negative impacts of the lockdown on NO2 diminish over

time, or when larger bandwidths are considered. Specifically, the reduction of NO2 hovers

 13
around 18 percent for four and eight weeks after the lockdown (Panel A, columns 4, 6). This

suggests that the reduction in air pollution may be short-lived once lockdown policies are eased

and economic activities return to normal. We further estimate the short-term impacts of the

lockdown on air pollution by using different bandwidths and applying the parametric RDD

model that includes the interactions of the running variable (linear and quadratic terms) with

the lockdown variable. We plot in Figure 4 the estimated coefficient and its 95 percent

confidence interval, which confirms that the impacts of the lockdown disappear 10 to 15 weeks

after the lockdown date.13

 Table 2 further illuminates the effect of lockdown on air pollution using alternative

measures of air quality. We use three parameters that are available for the country, including

CO, SO2, and O3.14 We find some evidence of reduced levels of SO2 (two or four weeks after

the lockdown) and CO (eight weeks after the lockdown). But the estimation results are mixed

for O3, which increases over two and four weeks after the lockdown, but decreases eight weeks

after the lockdown. Several studies also find ambiguous effects of lockdown policies on O3

(Tobías et al., 2020; Venter et al., 2020). A possible explanation for the increase in

concentration of O3 for the two week or four week periods after the lockdown is warmer

weather during these periods.

5.2. Robustness Checks and Further Extensions

Our results are robust to a number of sensitivity checks which we discuss next. First, our main

analysis employs the parametric RDD model to estimate Equation (2) and our main window of

time is two weeks before and after the lockdown. Alternatively, we supplement these estimates

by estimating a nonparametric RDD model using the local linear regressions (LLR) suggested

13
 To date, the satellite data on air pollution is only available for 15 weeks after the lockdown date. But we expect
these findings to remain consistent for a longer period of time.
14
 Our analysis does not use station-based data due to small number of stations recorded in the database.

 14
by Hahn et al. (2001). This method helps reduce the estimation bias that can result from

analyzing observations that are further away from the threshold (Calonico et al., 2019; Lee and

Lemieux, 2010). We use the optimal bandwidth suggested by Imbens and Kalyanaraman

(2009), which minimizes the sum of the squared bias and the variance of the estimates (MSE).

We report the estimation results in Table A2 (Appendix A), which are consistent across

different optimal bandwidths. The magnitudes of the estimated impacts are comparable to those

in our main specifications.

 Second, to account for (the remote) possibility that the economy may not completely

shutdown by the time of the lockdown, we employ a fuzzy RDD model to provide robustness

checks. As discussed earlier in section 4, the strictness of the implementation of the lockdown

can be measured by government responses indexes from the OxCGRT database.15 We estimate

the IV model in Equations (3) and (4), with our instrument being a dummy variable equal to

one for the response indexes being positive and the government responses indexes being the

running variable. We analyze the period of January 1 and July 1, 2020, when OxCGRT

provides these indexes. The estimation results of the fuzzy RDD model, shown in Table A3

(Appendix A), are consistent with our main findings in Table 1.

 Third, as an alternative to the changes in air pollution levels, we convert these changes

to the logarithmic form. The estimation results, shown in Table A4 (Appendix A), remain

qualitatively similar. Finally, one possible concern is that differences in province-specific

resources and policies may result in differential provincial time trends in air pollution. To

account for this, we include the interaction terms for the dummy variables for 63 provinces in

Vietnam with the linear time trends. The results, presented in Table A5 (Appendix A), are

generally consistent with our main findings.

15
 Table B2 (Appendix B) provides further details regarding components of OxCGRT indexes.

 15
We turn next to extend our analysis to examine heterogeneity of impacts. As discussed

earlier, the effects of COVID-19 lockdown on air pollution may vary according to province

and district characteristics. To shed more light on this issue, we first explore the question

whether the lockdown has differential effects on locations with and without coal-fired power

stations. Since coal-fired power generation is considered a major source of air pollution in

Vietnam as discussed earlier, it is plausible to assume that locations without coal stations would

record more reduced air pollution after the lockdown. The estimation results, shown in Table

3, Panel A, confirm our expectation.

 Similarly, we would expect that locations without cement plants would likely have more

decreased air pollution, which is supported by the estimation results in Table 3, Panel B.

Furthermore, locations with neither coal-powered stations nor cement stations have a stronger

reduced air pollution in the two-week period after the lockdown; but this result does not hold

for longer periods (Table 3, Panel C). Yet, one may argue that it is the capacity of these

stations—rather than their numbers—that determines the levels of pollution. Therefore, we

provide estimates using the capacities of coal-powered and cement stations instead in Table

A6 (Appendix A), which offers a qualitatively similar conclusion. But as a note of caveat, the

magnitudes of the estimated impacts in Table 3 should be interpreted with caution since we do

not have information on the extent that operations of these stations were affected by the

lockdown.

 We next examine a related question on whether the less industrialized locations have a

more reduced air pollution after the lockdown. To answer this question, we interact the

lockdown variable with indicators of industrial production. We start with an industrial

production index, followed by two alternative measures, FDI investment, and nightlight

intensity. Findings from previous studies on the relationship between FDI and air pollution are

inconclusive with some evidence of the deleterious consequences for the environment (e.g.

 16
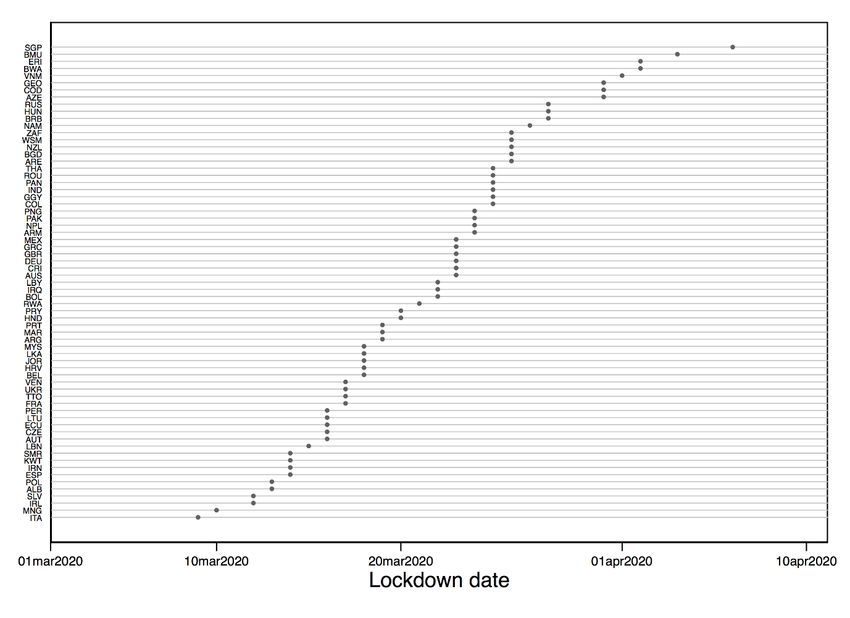
Shahbaz et al., 2015). On one hand, pollution-intensive industries likely move from richer to

poorer economies because the environmental rules and regulations in the latter are relatively

weaker. On the other hand, other studies indicate that FDI can contribute to a cleaner

environment, especially if it comes with green technologies (e.g. Demena and Afesorgbor,

2020). We also use nightlight intensity at the district level as a proxy for economic

development. The results presented in Table 4 show that locations with lower levels of

industrial production record more reduced air pollution after the lockdown.

 Lastly, we examine whether citizen perceptions about the environment in Vietnam affect

the impacts of the COVID-19-induced lockdown and air pollution. We obtain data from the

PAPI database which provides indicators of quality of local economic governance. We are

interested in two dimensions—that is, seriousness in environmental protection and quality of

air—both of which are available at the province level. The estimation results, shown in Table

5, provide evidence that locations where citizens have higher awareness about the environment

do not witness more improved air quality within up to four weeks after the lockdown date. The

improvements in air quality in these locations appear to occur only eight weeks after the

lockdown date.

 Does our analytical framework allow us to use a similar RRD model to estimate the

impacts of the lockdowns on air quality in other countries beyond Vietnam? One challenge

with cross-country analysis is that not all countries have a single official lockdown date, and if

they do, not all countries cleanly implement the lockdowns for the whole country (Dang and

Trinh, 2020). As such, we compile a list of 67 countries which we are able to identify the

national lockdown date from reliable sources (such as reputable media sources or local

government websites). These lockdown dates range from March 9, 2020 (Italy) to April 7, 2020

(Singapore) and are shown in Figure B1 and Table B3 (Appendix B) together with their

sources. We also put together a database on concentration of NO2 for these 67 countries for

 17
analysis as with Vietnam. The estimation results, shown in Table 6, point to similar negative

impacts of the lockdowns on reduced air pollution. While these global estimates are somewhat

stronger for wider time bandwidths, they are relatively smaller compared to those of Vietnam.

5.3. Potential Mechanisms for Improving Air Quality

We provide next some insights on the potential mechanisms that the COVID-19-induced

lockdown could result in improved air quality. Some previous studies have examined the

relationship between COVID-19 and mobility restrictions, in particular the role of traffic

activities in increasing air pollution. For example, analyzing global data from Google mobility

reports (GCMR), Dang and Trinh (2020) find significant reductions of traffic mobility during

the pandemic. Coibion et al. (2020) use the same database and show that lockdowns

substantially deterred social mobility in the United States.

 Our estimation results, shown in Table 7, reaffirm these findings for Vietnam. Table 7

shows that mobility activities have declined significantly after the lockdown, and the results

are consistent across bandwidths (shown in Panels A, B, and C). In particular, the lockdown

resulted in less mobility in categories such as “essential services” (e.g., grocery and pharma,

workplace) and “non-essential services” (retail and recreation, parks), but more mobility in the

“residential” category.

 For further comparison, we examine another source of mobility data that are provided by

Apple. Unlike the Google mobility data, the Apple dataset provides statistics of daily changes

in driving and walking direction requests from its users. The data for Vietnam are, however,

only available for the two largest cities in the country (i.e., Hanoi and Ho Chi Minh City) and

the number of data points significantly decreases to just more than 300. Therefore, we are

unable to apply the RDD model to analyze this dataset, but we employ instead a standard panel

data econometric model with fixed effects. The estimation results, shown in Table A7

 18
(Appendix A), suggest a qualitatively similar result that the lockdown has negative impacts on

driving and walking activities.

5.4. Back-of-the-envelope Cost-Benefit Analysis

While it is generally accepted that the economic costs of enforcing lockdown policies during

the pandemic are undoubtedly prohibitive, these measures could unintentionally result in

certain benefits coming from improved air quality. Put differently, since lockdown policies

significantly improve air quality, this would partially offset the costs of these counter-COVID-

19 measures. In this section, we perform some back-of-the-envelope calculations to examine

the extent of the benefits of higher air quality in Vietnam.

 Recall that our main finding shows a decrease in concentration of NO2 of between 24-32

percent in our main specification (Table 2, column 2). To estimate the health benefits of

reduced air pollution, we rely on two experimental studies in Vietnam which investigate how

changes in concentration of NO2 affect prevalence of hospital respiratory admissions,

cardiovascular admissions, and pneumonia hospitalization (Nhung et al., 2018; Phung et al.,

2016). For better interpretation, we convert the amount of NO2 concentration into percentange

changes using the mean values provided in those studies. Specifically, we find that a one-

percent decrease in concentration of NO2 will lead to 0.15 percent, 0.07 percent, and 0.14

percent decreases in hospital admissions of respiratory, cardiovascular, and pneumonia

diseases, respectively. Table 8 provides estimates of health benefits resulting from the COVID-

19 lockdown, which range from decreases of between 3.6 and 4.8 percent for respiratory

admissions to decreases of between 3.4 and 4.5 percent for pneumonia admissions for the two-

week to eight-week periods after the lockdown (Panel A).

 We provide next some cost-benefit analysis of reduced air pollution from the lockdown.

We use the World Bank’s pre-COVID-19 projection of economic growth rate of 6.5 percent in

 19
2020 (World Bank, 2020) and the 2019 GDP ($262 billion US dollars) for Vietnam to estimate

the hypothetical projected GDP in 2020 in the absence of the pandemic. As a rough

approximation, the economic losses during the two weeks of lockdown is estimated as its

proportionate share of the GDP for the whole year (i.e., 52 weeks). In terms of economic

benefits, we use estimates that the economic losses, represented by total welfare losses and

forgone labour output, caused by air pollution could be roughly 5.5 percent of the GDP (World

Bank, 2016) to calculate the proportion of GDP saved by reduced air pollution.

 Our estimates show that the losses of GDP during a two-week lockdown period is

roughly $10.7 billion US dollars (Table 8, Panel C). This is roughly 20 times larger than the

economic gains of approximately $0.6 billion US dollars coming from improved air quality

(Table 8, Panel B). Yet, the economic gains from improved air quality discussed above only

consider hospital admissions and do not take into account the general non-monetary health

benefits of a cleaner environment and better quality of life that all individuals can enjoy.

6. Discussion and Conclusion

Together with economic growth, Vietnam has witnessed rising high levels of air pollution,

which can lead to public health challenges. This underscores the importance of evaluating

policies that have the potential to improve air quality. The COVID-19 pandemic provides an

unprecedented opportunity for us to do just that, which is to investigate how air quality changes

in response to lockdown policies. In particular, in order to curb COVID-19 infection, the

government has put in place containment measures which have ranged from school closures

and cancellations of public gatherings to restrictions on mobility.

 Our empirical analysis reveals that the COVID-19-induced lockdown significantly

reduces air pollution in Vietnam. However, the impacts are short-lived and dissipate ten weeks

after the lockdown date. But we find that the lockdown effects are greater in districts without

 20
coal power stations and cement plants. This indicates that reduced reliance on coal power

generation and continued transition to renewable energy can help the country improve its air

quality and achieve a sustainable growth trajectory.

 We also investigate the mediating role of human mobility on the relationship between

lockdown policies and air pollution. A meaningful finding is that sharp reductions in human

mobility are strongly associated with the lockdown, which implies that these activities are

indeed important sources of air pollution. This also highlights the importance of better control

over the emissions from these sources when the economy returns to normal. As such, our

estimates can provide useful input parameters for the country’s future environmental

regulations. Finally, our back-of-the-envelope calculations suggest that while the economic

gains from improvements in air quality are just a small fraction compared to the economic

losses caused by the lockdown, these do not take into account non-monetary health benefits.

 21
References

Achakulwisut, P., Brauer, M., Hystad, P., & Anenberg, S. C. (2019). Global, national, and
 urban burdens of paediatric asthma incidence attributable to ambient NO2 pollution:
 estimates from global datasets. The Lancet Planetary Health, 3(4), e166-e178.

Akesson, J., Ashworth-Hayes, S., Hahn, R., Metcalfe, R. D., & Rasooly, I. (2020). Fatalism,
 Beliefs, and Behaviors During the COVID-19 Pandemic (No. w27245). National Bureau
 of Economic Research.

Almond, D., Du, X., & Zhang, S. (2020). Did COVID-19 Improve Air Quality Near Hubei?
 (No. w27086). National Bureau of Economic Research.

Baker, J. (2018, May 21). “This Clean Energy Champion Is Out To Break Vietnam's Coal
 Habit”. Forbes. Retrieved from https://www.forbes.com/sites/jillbaker/2018/05/21/this-
 clean-energy-champion-is-out-to-break-vietnams-coal-habit/#6e10ed0476b2

Baker, S. R., Farrokhnia, R. A., Meyer, S., Pagel, M., & Yannelis, C. (2020). How does
 household spending respond to an epidemic? Consumption during the 2020 covid-19
 pandemic (No. w26949). National Bureau of Economic Research.

Barnes, S. R., Beland, L. P., Huh, J., & Kim, D. (2020). The Effect of COVID-19 Lockdown
 on Mobility and Traffic Accidents: Evidence from Louisiana (No. 616). GLO Discussion
 Paper.

Berman, J. D., & Ebisu, K. (2020). Changes in US air pollution during the COVID-19
 pandemic. Science of the Total Environment, 139864.

Bich Ngoc. (2018, June 7). “Vietnam needs just one, not 26 coal power plants”. VnExpress.
 Retrieved from https://e.vnexpress.net/news/business/vietnam-needs-just-one-not-26-
 coal-power-plants-3759808.html

Bloom, D. E., Kuhn, M., & Prettner, K. (2020). Modern Infectious Diseases: Macroeconomic
 Impacts and Policy Responses. Journal of Economic Literature.

Brodeur, A., Gray, D., Islam, A., & Bhuiyan, S. J. (2020a). A Literature Review of the
 Economics of COVID-19 (No. 601). Global Labor Organization (GLO).

Brodeur, A., Cook, N., & Wright, T. (2020b). On the Effects of COVID-19 Safer-At-Home
 Policies on Social Distancing, Car Crashes and Pollution. (No. 13255). IZA Discussion
 Paper.

Brodeur, A., Clark, A. E., Fleche, S., & Powdthavee, N. (2020c). COVID-19, Lockdowns and
 Well-Being: Evidence from Google Trends (No. 552). GLO Discussion Paper.

Calonico, S., Cattaneo, M. D., Farrell, M. H., & Titiunik, R. (2019). Regression discontinuity
 designs using covariates. Review of Economics and Statistics, 101(3), 442-451.

Cattaneo, M. D., Jansson, M., & Ma, X. (2018). Manipulation testing based on density
 discontinuity. The Stata Journal, 18(1), 234-261.

 22
Cattaneo, M. D., Idrobo, N., & Titiunik R. (2020). A Practical Introduction to Regression
 Discontinuity Designs: Foundations. Cambridge University Press.

Cicala, S., Holland, S. P., Mansur, E. T., Muller, N. Z., & Yates, A. J. (2020). Expected Health
 Effects of Reduced Air Pollution from COVID-19 Social Distancing (No. w27135).
 National Bureau of Economic Research.

Chang, H-H., Meyerhoefer, C., & Yang, F-A. (2020). COVID-19 Prevention and Air Pollution
 in the Absence of a Lockdown (No. 27604). National Bureau of Economic Research.

Chen, K., Wang, M., Huang, C., Kinney, P. L., & Anastas, P. T. (2020). Air pollution reduction
 and mortality benefit during the COVID-19 outbreak in China. The Lancet Planetary
 Health, 4(6), e210-e212.

Chetty, R., Friedman, J. N., Hendren, N., & Stepner, M. (2020). How did covid-19 and
 stabilization policies affect spending and employment? a new real-time economic tracker
 based on private sector data (No. w27431). National Bureau of Economic Research.

Cohen, A. J., Brauer, M., Burnett, R., Anderson, H. R., Frostad, J., Estep, K., ... & Feigin, V.
 (2017). Estimates and 25-year trends of the global burden of disease attributable to
 ambient air pollution: an analysis of data from the Global Burden of Diseases Study 2015.
 The Lancet, 389(10082), 1907-1918.

Coibion, O., Gorodnichenko, Y., & Weber, M. (2020). The cost of the covid-19 crisis:
 Lockdowns, macroeconomic expectations, and consumer spending (No. w27141).
 National Bureau of Economic Research.

Cole, M., Ozgen, C., & Strobl, E. (2020). Air Pollution Exposure and COVID-19 (No. 13367).
 IZA Discussion Paper.

Dang, H. A. H., & Giang, L. T. (2020). Turning Vietnam’s COVID-19 Success into Economic
 Recovery: A Job-Focused Analysis of Individual Assessments on Their Finance and the
 Economy. (No. 13315). IZA Discussion Paper.

Dang, H. A. H., Huynh, T. L. D., & Nguyen, M. H. (2020). Does the COVID-19 Pandemic
 Disproportionately Affect the Poor? Evidence from a Six-Country Survey
 (No. 13352). IZA Discussion Paper.

Dang, H. A. H., & Trinh, T. A. (2020). Does the COVID-19 Pandemic Improve Global Air
 Quality? New Cross-national Evidence on Its Unintended Consequences (No. 13480).
 IZA Discussion Paper.

Demena, B. A., & Afesorgbor, S. K. (2020). The effect of FDI on environmental emissions:
 Evidence from a meta-analysis. Energy Policy, 138, 111192.

Do, Thang Nam. (2020, March 30). “Vietnam’s Big Air Pollution Challenge: Bold action is
 needed to address the country’s problem”. The Diplomat. Retrieved from
 https://thediplomat.com/2020/03/vietnams-big-air-pollution-
 challenge/#:~:text=Vietnam%20is%20struggling%20with%20alarming,Fine%20particu

 23
late%20matter%20(PM2.&text=In%202019%2C%20Hanoi%20had%20only%20eight
 %20days%20with%20PM2.

Fairlie, R. W., Couch, K., & Xu, H. (2020). The impacts of COVID-19 on minority
 unemployment: First evidence from April 2020 CPS microdata (No. w27246). National
 Bureau of Economic Research.

Faustini, A., Rapp, R., & Forastiere, F. (2014). Nitrogen dioxide and mortality: review and
 meta-analysis of long-term studies. European Respiratory Journal, 44(3), 744-753.

Hahn, J., Todd, P., & Van der Klaauw, W. (2001). Identification and estimation of treatment
 effects with a regression-discontinuity design. Econometrica, 69(1), 201-209.

Hale, T., Petherick, A., Phillips, T., & Webster, S. (2020). Variation in government responses
 to COVID-19. Blavatnik school of government working paper, 31.

He, G., Pan, Y. & Tanaka, T. (2020). The short-term impacts of COVID-19 lockdown on
 urban air pollution in China. Nature Sustainability. https://doi.org/10.1038/s41893-020-
 0581-y

Henderson, J. V., Storeygard, A., & Weil, D. N. (2012). Measuring economic growth from
 outer space. American Economic Review, 102(2), 994-1028.

Hodler, R., & Raschky, P. A. (2014). Regional favoritism. The Quarterly Journal of
 Economics, 129(2), 995-1033.

Huynh, T. L. D. (2020). "The COVID-19 containment in Vietnam: What are we
 doing?" Journal of Global Health, 10(1).

Imbens, G., & Kalyanaraman, K. (2012). Optimal bandwidth choice for the regression
 discontinuity estimator. Review of Economic Studies, 79(3), 933-959.

Isphording, I. E., & Pestel, N. (2020). Pandemic Meets Pollution: Poor Air Quality Increases
 Deaths by COVID-19. (No. 13418). IZA Discussion Paper.

Koplitz, S. N., Jacob, D. J., Sulprizio, M. P., Myllyvirta, L., & Reid, C. (2017). Burden of
 disease from rising coal-fired power plant emissions in Southeast Asia. Environmental
 Science & Technology, 51(3), 1467-1476.

Kurokawa, J., Ohara, T., Morikawa, T., Hanayama, S., Janssens-Maenhout, G., Fukui, T., ... &
 Akimoto, H. (2013). Emissions of air pollutants and greenhouse gases over Asian regions
 during 2000–2008: Regional Emission inventory in ASia (REAS) version 2. Atmospheric
 Chemistry and Physics, 13(21), 11019-11058.

La, V. P., Pham, T. H., Ho, M. T., Nguyen, M. H., P Nguyen, K. L., Vuong, T. T., Tran, T.
 Khuc, Q., Ho, M.-T., & Vuong, Q. H. (2020). Policy response, social media and science
 journalism for the sustainability of the public health system amid the COVID-19 outbreak:
 The Vietnam lessons. Sustainability, 12(7), 2931.

 24
Lee, D. S., & Lemieux, T. (2010). Regression discontinuity designs in economics. Journal of
 Economic Literature, 48(2), 281-355.

Lenzen, M., Li, M., Malik, A., Pomponi, F., Sun, Y. Y., Wiedmann, T., ... & Gómez-Paredes,
 J. (2020). Global socio-economic losses and environmental gains from the Coronavirus
 pandemic. PloS one, 15(7), e0235654.

Le Thu, Huong. (2020, August 15). “Vietnam’s successful battle against Covid-19”. Council
 of Foreign Relations. Retrieved from https://www.cfr.org/blog/vietnams-successful-
 battle-against-covid-19

Liu, C., Chen, R., Sera, F., Vicedo-Cabrera, A. M., Guo, Y., Tong, S., ... & Valdes Ortega, N.
 (2019). Ambient particulate air pollution and daily mortality in 652 cities. New England
 Journal of Medicine, 381(8), 705-715.

Luong, L. M., Phung, D., Sly, P. D., Morawska, L., & Thai, P. K. (2017). The association
 between particulate air pollution and respiratory admissions among young children in
 Hanoi, Vietnam. Science of the Total Environment, 578, 249-255.

Mandhana, N. & Le, L. (2020, April 27). “Some Countries Are Squashing the Coronavirus
 Curve. Vietnam Is One.” Wall Street Journal. Retrieved from
 https://www.wsj.com/articles/some-countries-are-squashing-the-coronavirus-curve-
 vietnam-is-one-11587989361

Mannucci, P. M., & Franchini, M. (2017). Health effects of ambient air pollution in developing
 countries. International Journal of Environmental Research and Public Health, 14(9),
 1048.

McCrary, J. (2008). Manipulation of the running variable in the regression discontinuity
 design: A density test. Journal of Econometrics, 142(2), 698-714.

M.Giao. (2020, August 15). “Mỗi người dân là một chiến sĩ phòng chống dịch bệnh” (Every
 citizen is a soldier in the fight against the pandemic). Thanh Nien. Retrieved from
 https://thanhnien.vn/thoi-su/moi-nguoi-dan-la-mot-chien-si-phong-chong-dich-benh-
 1200259.html

Nguyen Quy. (2020, August 15). Hanoi ranked world's seventh most polluted capital city in
 2019. Retrieved from https://e.vnexpress.net/news/news/hanoi-ranked-world-s-seventh-
 most-polluted-capital-city-in-2019-4061412.html

Nhung, N. T. T., Schindler, C., Dien, T. M., Probst-Hensch, N., Perez, L., & Künzli, N. (2018).
 Acute effects of ambient air pollution on lower respiratory infections in Hanoi children:
 an eight-year time series study. Environment International, 110, 139-148.

Pham, Linh. (2020, April 10). Why does Vietnam gain international praise for fight against
 Covid-19? Hanoi Times. Retrieved from http://hanoitimes.vn/why-does-vietnam-gain-
 international-praise-for-fight-against-covid-19-311680.html

 25
You can also read