Translating Fire Impacts in Southwestern Amazonia into Economic Costs - MDPI
←
→
Page content transcription
If your browser does not render page correctly, please read the page content below
remote sensing
Article
Translating Fire Impacts in Southwestern Amazonia
into Economic Costs
Wesley A. Campanharo 1, * , Aline P. Lopes 1 , Liana O. Anderson 2 , Thiago F. M. R. da Silva 3
and Luiz E. O. C. Aragão 1,4
 1    National Institute for Space Research, Remote Sensing Division, Av. dos Astronautas, n1758, São José dos
      Campos, SP CEP: 12227-010, Brazil; aline.lopes@inpe.br (A.P.L.); laragao@dsr.inpe.br (L.E.O.C.A.)
 2    National Center for Monitoring and Early Warning of Natural Disasters – Cemaden, Technological Park of
      São José dos Campos, Dr. Altino Bondensan Road, n500, São José dos Campos, SP CEP: 12247-016, Brazil;
      liana.anderson@cemaden.gov.br
 3    Federal University of ABC – Center for Engineering, Modeling, and Applied Social Sciences, Alameda da
      Universidade – Bairro Anchieta, São Bernardo do Campo, SP CEP: 09606-045, Brazil;
      fonseca.morello@ufabc.edu.br
 4    College of Life and Environmental Sciences Amory Building, University of Exeter, Rennes Drive,
      Exeter EX4 4RJ, UK
 *    Correspondence: wesley.campanharo@inpe.br

 Received: 2 March 2019; Accepted: 26 March 2019; Published: 29 March 2019

 Abstract: Between 1998 and 2017, climate-related disasters represented 91% of all occurrences
 worldwide, causing approximately US$ 2.245 billion of direct economic losses. In the Amazon region,
 fire is used as a widely spread technique for land clearing, agricultural management, hunting, and
 religious rituals. However, over the past 20 years, severe droughts caused a major amplification
 of fire occurrences, leading to several socioeconomic and environmental impacts. Particularly
 in Acre state, located in the southwestern Brazilian Amazon, the occurrence of extensive fires,
 associated with extreme climatic events, has been reported since 2005. However, fire dynamics,
 land tenure relationships, and associated impacts are poorly quantified. In this study, we aim to
 investigate the following: (1) The spatiotemporal variability of fire dynamics during anomalously
 dry and regular climate conditions; (2) the attribution of fire occurrence and land tenure relationship,
 and (3) the environmental, social, and economic impacts caused by fires and its consequences
 for Acre’s economy. We analyzed information on the spatial patterns of fire, its direct impacts
 on land use and land cover, carbon stocks, CO2 emissions, the indirect impact on human illness,
 and finally the costs of these impacts from 2008 to 2012. During the studied period, burned areas
 were concentrated around the major cities and roads, forming polygons up to 0.6 km2 . However,
 in 2010, an extremely dry year, fires spread to remote areas, impacting protected private areas and
 sustainable-use conservation areas. In 2010, the total area affected by forest fires was approximately
 16 times greater than in meteorologically normal years. The total economic loss estimated in 2010
 was around US$ 243.36 ± 85.05 million and for the entire period, US$ 307.46 ± 85.41 million. These
 values represent 7.03 ± 2.45% and 9.07 ± 2.46% of Acre’s gross domestic product (GDP), respectively.

 Keywords: economic cost; environmental valuation; wildfires

1. Introduction
     Fire-dependent ecosystems, such as the Brazilian Cerrado and the African Savannah, evolved
in the presence of periodic or episodic fires and depend on them for maintaining their ecological
processes [1]. However, in the Amazon, natural fires are rare in the absence of humans and fire’s
presence can be an indicator of human activity [2,3]. The use of fires in this region is a usual agricultural

Remote Sens. 2019, 11, 764; doi:10.3390/rs11070764                        www.mdpi.com/journal/remotesensing
Remote Sens. 2019, 11, 764                                                                            2 of 24

practice for farmers, for both clearing new areas and preparing productive lands [4,5], to increase the
soil fertility and the amount of organic carbon in a short period [6,7], and to prevent massive fires
by reducing fire fuels [8]. Additionally, fire is part of the culture of many indigenous and traditional
communities, and is used for hunting and religious rituals as well [9,10].
      Over the past 20 years, severe droughts were reported in the Amazon [11,12] and major wildfires
were associated with them [13–16]. Usually, the severe droughts are caused by one or a combination of
climatic phenomenon, such as the El Niño-Southern Oscillation (ENSO), the Atlantic Multidecadal
Oscillation (AMO), and warming of the Tropical North Atlantic (TNA), where the environmental
conditions, characterized by high temperatures and low air humidity, are more suitable for the rapid
spread of fires [11,12].
      Moreover, many studies suggest an increase in drought frequencies in the Amazon [17] with a
collateral increase of fires in forests adjacent to anthropic areas [18]. As a consequence, burnings can
escape and escalate into wildfires, causing several environmental and socioeconomic losses [12,19–23].
With that, this phenomena may have a greater environmental change potential than the drought event
itself [12–14].
      The State of Acre, located in the southwestern flank of the Brazilian Amazon, has suffered from
the high frequency of extreme climatic events since 2005 [11,24,25] and more recently in 2016 and
2017 [26]. In the first two decades of the 21st century, socioeconomic impacts, caused by such events,
have been particularly critical in Acre, especially in relation to the direct and indirect impacts of
wildfires [19,27,28]. Brown et al. [28], for instance, estimated that during the 2005 drought, more than
400 thousand people were affected by fire-related air pollution and over 300 thousand hectares of
forests burned, with direct losses surpassing US$ 50 million and approximately US$100 million in
economic, social, and environmental losses [27].
      As a consequence of the 2005 drought, Acre’s authorities created a temporary Situation Room to
effectively monitor forest fires and gather meteorological data for fire risk analysis, aiming to assist the
placement of fire-fighting crews in the field [27]. In 2013, after many extreme events such as floods,
droughts, and wildfires, the Situation Unit of Hydrometeorological Monitoring was permanently
established under the Secretariat of the Environment of Acre, for following purposes: Monitoring
critical hydrologic events, supporting prevention actions to cope with extreme events, gathering
information about critical events, and managing platforms for collecting and integrating pluvial and
fluviometric data [29].
      Additionally, in the last decade, Acre State established environmental policies for reducing
deforestation, designing mechanisms of payments for environmental services, and creating new
governmental and non-governmental sectors to directly deal with solutions for mitigating disasters
in the region. All these policies are aligned with the Sendai Framework, of which Brazil has been a
signatory country since 2015. This framework includes measures to reduce direct economic losses due
to disasters, as well as the establishment of techniques for assessing losses associated with economic,
social, environmental, and cultural heritage [30]. Nevertheless, information on economic losses from
disasters remains critically lacking for entities and governmental institutions, especially in countries
under development. The United Nations Office for Disaster Risk Reduction (UNISDR, 2018) [31]
showed that only 37% of all disasters cataloged between 1998 to 2017 had estimated economic losses,
suggesting that the direct costs of the majority of disasters (63%) worldwide are unknown or not
well documented.
      Techniques for valuing disaster-related environmental and socioeconomic costs have a great and
critical role in public policies. These techniques are essential for characterizing the magnitude of the
problem and for supporting regional development models [5]. Moreover, information on costs can
facilitate the communication of the value of nature or any affected good to different people using
a unique language that unites political and economic visions [32]. Finally, this type of analysis can
provide a legal basis for managing natural resources, assessing damage, and developing mechanisms
for environmental compensation [33].
Remote Sens. 2019, 11, 764                                                                          3 of 24

     It is clear that quantitative information about the impact of wildfires on ecosystems and humans
is mandatory for supporting the development of strategies and public policies for the prevention of
disasters and related impact assessment. Therefore, in this study, our objective is to investigate the
spatiotemporal pattern of fires, their attribution regarding fire occurrence and land tenure, and the
environmental, social, and economic impacts of fire in Acre state. More specifically, this study aims
to answer the following: (1) What are the spatiotemporal variabilities of fires during anomalously
dry years and years with regular climatic conditions? (2) Who are the actors, in terms of land
tenure, to which fire occurrence can be attributed to? and (3) What is the potential magnitude
of the environmental, social, and economic impact caused by fires and their consequences for
Acre’s economy?
     In this study, we go beyond the analysis of ecological impacts on natural resources to show that,
during droughts, the increase in fire events, in comparison to normal climatological years, raises
the annual estimated cost related to infrastructure damages, production losses, CO2 emissions, and
respiratory morbidities around 15-fold. This estimate represents 7.03 ± 2.45% of Acre’s gross domestic
product (GDP). The observed increment in costs was driven by the spatially extensive impact of fires
on forests, which enhanced gross carbon emission from biomass burning and its associated costs
to society.

2. Materials and Methods

2.1. Study Area
     Acre state has an area of approximately 164,124 km2 [34] and is located in the southwest flank of
the Brazilian Amazon, with borders with Peru and Bolivia (Figure A1). Approximately 68,000 km2
(41%) of its territory is covered by conservation units, including indigenous areas. Approximately
12% of its total area was deforested until 2010 [35], concentrated in Acre’s southeastern region, around
urban centers, and along the state’s road network, especially BR-364, BR-317, and AC-40. Although
deforestation rates decreased between 2004 and 2010, forest clearing and burning for agricultural
activities are still the major agents of regional landscape transformation [36].
     The climate in this region is characterized, under the Köppen system, as tropical (A) with 30% of
the state area in a tropical monsoon climate (Am), characterized by the compensation of the short dry
season by large amounts of precipitation throughout the year. The other 70% of the state is classified as
a tropical rainforest climate (Af), which is characterized by average precipitation of at least 60 mm in
every month [37]. The rainy season occurs from October to April and the dry season between June and
August, while May and September are characterized as transition months among these seasons [38].

2.2. Data
     This study integrates different spatial data products (Table A1) and non-spatial datasets (Table A2).
The spatially explicit information refers to georeferenced vector and raster data, while the non-spatial
datasets are composed of tables and numerical values. All the data and products were gathered
from open-source repositories and official government databases, journal articles, market research,
and web-pages from governmental and non-governmental organizations. Details of each dataset are
presented below.

2.2.1. Spatial Datasets
     Maps containing burned area information from 2008 to 2012 were provided by the Tropical
Ecosystems and Environmental Science Laboratory (TREES) at the Brazilian National Institute for Space
Research (INPE). This dataset was generated following a well-established methodology [15,39–41].
These maps are derived from MODIS surface reflectance products collection 5, which were resampled
to 250 m of spatial resolution and subsequently processed by applying a Spectral Mixture Analysis
(SMA) with vegetation, soil, and shade endmembers [42]. Based on the shade fraction image, a region
Remote Sens. 2019, 11, 764                                                                         4 of 24

growth segmentation procedure was applied, followed by a manual post-classification edition [15].
The final maps display information on the yearly burned area, corresponding to the cumulative burned
area occurring during the dry season of each year. The validation of this product at a significance level
of 5%, exhibited an overall accuracy of 99.20% with a lower and upper confidence interval of 97.67%
to 99.48%, respectively, for forest areas and an overall accuracy of 96.30%, with a lower and upper
confidence interval of 92.88% to 98.55%, respectively, for non-forest areas [39].
      For characterizing land use and land cover (LULC) in the region, we used maps provided by
the TerraClass project [43] for the years 2008, 2010, and 2012. TerraClass is a project for monitoring
LULC in the Brazilian Legal Amazon, providing 15 LULC types. To retrieve classes of LULC within
the TerraClass project, an analysis of Landsat-5/TM images using SMA is performed, followed by a
slicing procedure and visual interpretation. This analysis is supported by temporal information based
on the normalized difference vegetation index (NDVI) product from MODIS (Moderate Resolution
Imaging Spectroradiometer) and the mask of deforestation, forest, and hydrography from the PRODES
project [44,45].
      For this study, we aggregated the LULC thematic classes into the following three generalist
categories: Forests, agriculture, and pastures (Table 1). The land cover class “Forests” refers to
old-growth and secondary forests. The “Agriculture” class refers to annual crops, generally mechanized
agriculture, and the mosaic of uses, which is a mix of agriculture and pastures. Finally, the land use
class “Pastures” refers to areas where pastures dominate the landscape. Seven LULC thematic classes
were not used in this research because their contribution in terms of area coverage in the Acre state
territory was not representative (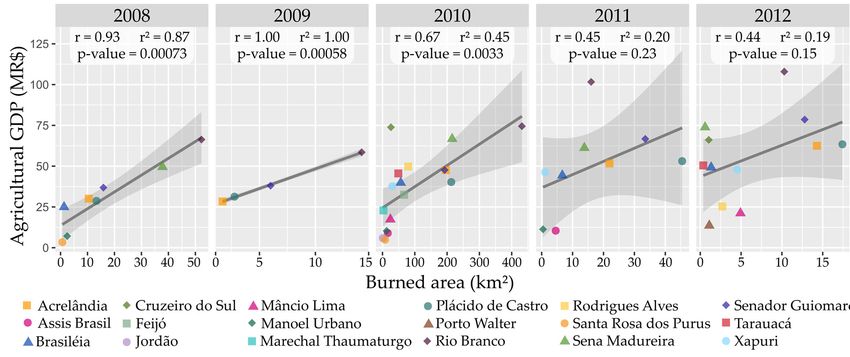
Remote Sens. 2019, 11, 764                                                                        5 of 24

     Finally, for the Pasture category, we used an average value of 38.61 MgC.ha−1 , with a standard
deviation of 16.54, based on the sum of the total alive pools of aboveground wood biomass, grasses
and herbaceous dicots, and the dead pools of fine litter and wood debris, found in three different
pasture areas in the Brazilian states of Rondônia and Pará [53].
     The final ACD map corresponds to the year 2008, with C values associated to each class, as follows:
Forest, agriculture, and pasture, at each spatial location, as mapped by the TerraClass product for this
same year.
     The territorial information about land tenure was based on official data provided by the Brazilian
government. We have integrated information from different databases, encompassing the following
data: Rural private property boundaries, rural module specifications, protected private areas (Areas
of Permanent Preservation, APPs, and Legal Reserves, LRs), and governmental protected areas
(Conservation Units, CUs, and Indigenous Lands, ILs).
     The boundaries of private rural properties and their respective APPs and LRs were obtained at
the Rural Environmental Registry System (SICAR). These two kinds of protected areas are mandatory
for all private property, according to the actual Brazilian Forest Code (FC, Federal Law no 12.651 of
2012) [54]. The LR is an area of native vegetation that must occupy at least 80% of the property area in
the Amazonian biome, excluding the environmentally sensitive areas (e.g. riparian and hilltop zones),
which are titled APPs [55].
     We classified each private property according to the rural module (r.m.) specifications of each
municipality. This classification was defined according to the Federal Law no 8.629 of 25 February
1993 [56], which classifies the properties in smallholdings (area ≤ 1 r.m.), small (1 < area ≤ 4 r.m.),
medium (4 < area ≤ 15 r.m.), and large properties (area > 15 r.m.). The rural module size for the Acre
State ranges from 70 to 100 ha per municipality and it was defined in 2013 by the National Institute for
Settlement and Agrarian Reform (INCRA) [57].

2.2.2. Non-Spatial Datasets
     Records of hospitalization cases caused by respiratory illness and the total cost of
treatments are provided by the Brazilian Unified Health System (SUS). In its information system
(Tabnet-DATASUS) [58], we searched for the number of hospitalization cases and the total economic
cost according to the place of residence, filtered for respiratory system diseases and distinguished by
municipality and year/month of occurrence.
     Among all the costs related to infrastructure, we computed only the impacts on the property
fences due to the unavailability of data on all other costs and, thus, the infrastructure damage costs
due to fires can be considered underestimated. This information was obtained from the National
Department of Transport Infrastructure (DNIT), which provides the reference costs to repair and
reconstruct different kinds of fences. Thus, we calculated the mean price of all the kinds of build and
repair, which were described by DNIT annual reports [59].
     We assume that the cost related to land recovery was US$ 813.62 ha−1 for agriculture and US$
883.27 ha−1 for pasture, both obtained by Townsend [60] for areas in the Brazilian Amazon region.
The costs of forest restoration were not considered because such practice is not usual in the region.
     The value of crop production was generated by multiplying the productivity values by their
market price in each year. For maize and cassava production (Table A2), we used the values provided
by the National Supply Company (CONAB) [61] and the Brazilian Institute of Geography and Statistics
(IBGE) [47] systems. The mean productivity for 2008 to 2012 was 2.01 t.ha−1 for maize and 19.08 t.ha−1
for cassava. The mean cattle weight gain for 2009 was 60.09 kg.ha−1 .y−1 , a value based on a technical
report of the Brazilian Agricultural Research Corporation (EMBRAPA) [62]. Market prices for those
products were provided at an annual time-scale by the Center for Advanced Studies in Applied
Economics (CEPEA) system [63]. These prices are presented in Table A2.
     For forest-related losses, we only considered commercial wood stocks, due to the data availability.
For this, we used the value of US$ 5 ha−1 , quantified by De Mendonça et al. [4], which denotes the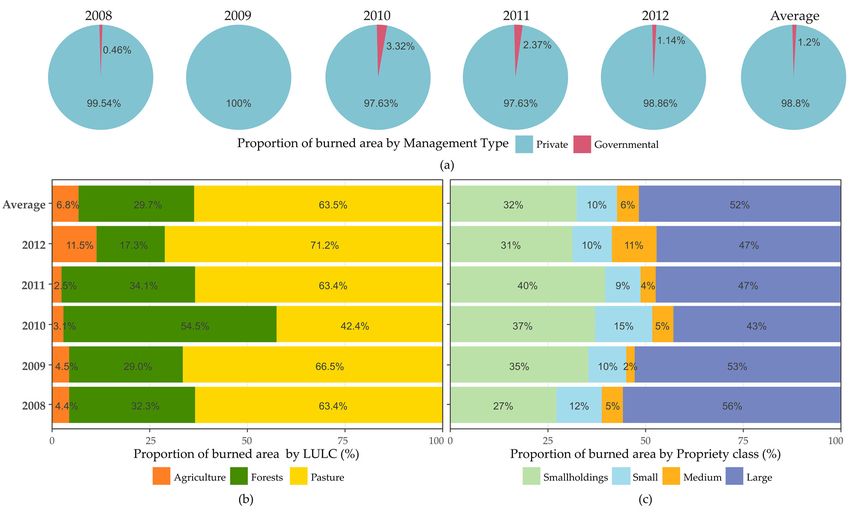
Remote Sens. 2019, 11, 764                                                                              6 of 24

mean price of marketable adult trees after a fire event that the lumber mill would be willing to pay to
the landowners in an exploited forest in Eastern Amazonia.
     Carbon emission values were accounted by using the market prices of carbon available at the
Carbon Emission Future system [64] between 2009 and 2012 (Table A2). As these prices were in Euros,
we converted these values into US dollars using the exchange rates available from the Brazil Central
Bank (BCB) system [65], shown in Table A2.

2.3. Data Analysis
     In the next sections, we describe all the procedures that were carried out to reach our three
research goals. We also present a section of assumptions and uncertainties of our data and analysis.

2.3.1. Quantifying the Spatiotemporal Variability of Fire Dynamics
      To analyze the spatial dynamics of the burned areas, first we quantified the total burned areas by
year, the wildfire frequency and recurrence, and the burned area anomalies. To understand how far
the fire could start inside Acre’s territory, excluding common anthropic ignitions such as roads and
urban centers, we built a grid of Euclidian distance from rivers and roads and then we determined the
mean distance and standard deviation of burned areas by intersecting the fire scars and the Euclidian
distance grid from these features.

2.3.2. Fire Occurrence and Land Tenure Relationship
     An intersection between burned area and the spatial data of land tenure and LULC was carried
out for determining the areas affected by fires. Then, the annual burned areas were stratified by each
LULC class, land tenure and protected areas inside and outside private properties. The year of 2010
was excluded from the time-series mean average due to the anomalous drought that occurred during
that year, leading to extensive fires [15].

2.3.3. Estimating the Environmental, Social, and Economic Impacts of Fires
      The environmental impact is represented here by biomass loss and gross carbon emission by fire.
It is quantified for each year, as shown in Figure 1. To determine the annual post-fire biomass loss,
we first used the 2008 biomass map and then applied the relationship of biomass loss developed by
Anderson et al. [15], which states that the remaining above-ground biomass after fire is a function of
the above-ground biomass prior the fire event. Then, for the areas mapped as Agriculture and Pastures,
the reference biomass values (1.71 and 38.61 MgC.ha−1 , respectively) were attributed to the remaining
biomass map in order to simulate their seasonal renewal, resulting in the following year biomass map.
For 2010 and 2012, we not only updated the biomass values but also dynamically revised the spatial
location of Agriculture and Pasture areas, according to the available LULC maps.
      Finally, to quantify the total annual gross carbon emissions, we applied the CO2 gross emission
model (Equation (1)) to the biomass loss maps (Figure 1b).

                                                     2
                             FCO2 = θ∗ (1 − α) ∗ ∑ λj ∗ ∑ ∑ Bi(x,y,j) ∗A(x,y)                              (1)
                                                    j=1      x   y

where FCO2 is the carbon dioxide gross emission (Mg CO2 ) in the year of interest (immediate flux
to the atmosphere); θ converts carbon to carbon dioxide (3.67); α is the slope of Anderson et al. [15]
equation’s (α = 0.7084 ± 0.034); λj is the release constant specific for forest (j = 1, λ = 50%) and non-forest
covers (j = 2, λ = 100%); Bi(x,y,j) is the pre-burn biomass (Mg C.ha−1 ) for the pixel at the location (x,y),
distinguished for forest and non-forest covers (j); and A(x,y) is the burned area (ha) at the pixel (x,y),
for which the value in our studies is 0.09 ha at burned pixels.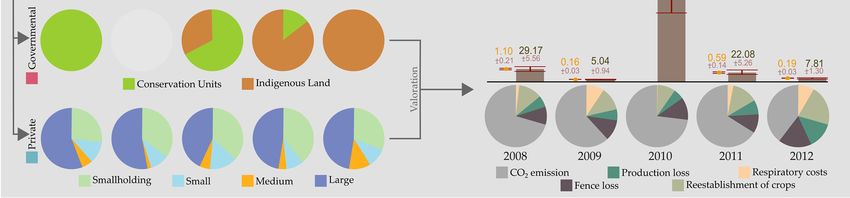
Remote Sens. 2019, 11, 764 7 of 24
Remote Sens. 2017, 9, x FOR PEER REVIEW 7 of 27
Figure 1. Workflow for generating the annual maps of remaining and loss of biomass. (a)The green
Figure 1. Workflow for generating the annual maps of remaining and loss of biomass. (a) The green
panel represents the 2008–2010 annual potential biomass maps, which were processed from the
panel represents theburned
annual 2008–2010 annual
area maps; potential
2008, 2010, and 2012biomass maps,
land use and which
land cover weremaps;
(LULC) processed from
and a table of the annual
reference
burned area maps; biomass
2008, values
2010, and for2012
each grouped
land useLULC classes.
and land(b)cover
The red panel represents
(LULC) maps; theand2008–2010
a table of reference
annual biomass loss maps, derived from an empirical relationship between pre and post-fire biomass
biomass values for each grouped LULC classes. (b) The red panel represents the 2008–2010 annual
applied to the potential biomass maps where a fire event was depicted by the burned area maps.
biomass loss maps, derived from an empirical relationship between pre and post-fire biomass applied
Finally,
to the potential to quantify
biomass mapsthe total annual
where gross carbon
a fire event emissions,by
was depicted we the
applied the CO
burned 2 gross emission
area maps.
model (Equation (1)) to the biomass loss maps (Figure 1b).
The health data, considered F = here
θ ∗ (1 − asα)social
∗ impact,
λ ∗ was
Bi( , ,determined
) ∗ A( , )
by building(1)a relationship
between fire and respiratory morbidity in Acre state. We computed a linear correlation between the
where FCO2 is the carbon dioxide gross emission (Mg CO2) in the year of interest (immediate flux to
total burned area and the total
the atmosphere); casescarbon
θ converts of hospitalization
to carbon dioxideby municipality
(3.67); α is the slopeand year. First,
of Anderson et al. we
[15] summarized
the total burned area (α
equation’s by= municipalities
0.7084 ± 0.034); λj isand aggregated
the release constant the number
specific for forestof(jcases
= 1, λ =grouped in last semester,
50%) and non-
forest covers (j = 2, λ=100%); Bi(x,y,j) is the pre-burn biomass (Mg C.ha-1) for the pixel at the location
which includes the peak of the fire occurrence, in September. The dry season period was extended for
(x,y), distinguished for forest and non-forest covers (j); and A(x,y) is the burned area (ha) at the pixel
three months(x,y),
in this analysis
for which because
the value not allis health
in our studies 0.09 ha atcase manifests
burned pixels. were registered at the same time as
the fires. The health data, considered here as social impact, was determined by building a relationship
between fire and respiratory morbidity in Acre state. We computed a linear correlation between the
We calculated five types of economic losses divided into two categories, directly and indirectly
total burned area and the total cases of hospitalization by municipality and year. First, we
fire-related. The first direct
summarized cost
the total is associated
burned with infrastructure
area by municipalities and aggregated damages,
the number offor which
cases groupedwein assume only
last semester,
fence losses. The secondwhich includes
and third the peak
direct of the
costs arefire
the occurrence,
production in September.
losses, Thefor dry
whichseason
weperiod
considered costs
was extended for three months in this analysis because not all health case manifests were registered
related to crop reestablishment and affected future production. Finally, the quantified indirect costs
at the same time as the fires.
were related to CO emissions
We2calculated five and
types respiratory
of economic losses morbidities.
divided into two categories, directly and indirectly
fire-related.
Fence losses were Thecalculated
first direct costusing
is associated
the with
landinfrastructure
property damages,
boundaries for which we assume
over burned only Pasture and
fence losses. The second and third direct costs are the production losses, for which we considered
Agricultural fields, then extracting these vector lengths. This analysis can be considered conservative
costs related to crop reestablishment and affected future production. Finally, the quantified indirect
since fences costs
are were
also related
usually to CO used to separate
2 emissions pasture
and respiratory from agriculture inside the same property.
morbidities.
The wildfire factor was applied and then the total cost of boundaries
Fence losses were calculated using the land property the fenceover burned Pasture and
reconstruction and repair was
Agricultural fields, then extracting these vector lengths. This analysis can be considered conservative
calculated using the respective prices for each year (Table A2).
since fences are also usually used to separate pasture from agriculture inside the same property. The
Production losses
wildfire factorwere
was estimated
applied and by thenmultiplying
the total cost the production
of the and reestablishment
fence reconstruction and repair was coefficients
calculated using the respective prices for each year (Table A2).
for each class and their market prices for each year. Just for the Agriculture class, we assume that there
Production losses were estimated by multiplying the production and reestablishment
was the samecoefficients
proportion of cassava and maize crops.
for each class and their market prices for each year. Just for the Agriculture class, we
Not all burned areas
assume that there was in rural
the sameproperties
proportion of are intentional,
cassava but the main losses are caused when
and maize crops.
Not all burned areas in rural properties
fires escape and accidentally spread to adjacent areas. For that are intentional, but thereason,
main losses weareconsidered
caused when the wildfire
fires escape and accidentally spread to adjacent areas. For that reason, we considered the wildfire
factor of 45%, estimated by De Mendonça et al. [4], to calculate the economic losses of infrastructure
damages, crop reestablishment, and affected future production. This factor was estimated using an
econometric model in the database from field research done by the Amazon Environmental Research
Institute (IPAM). The database is related to an information set, acquired between 1994 and 1995, of
202 properties spread over five municipalities in the “Arco do Desmatamento” region, specifically at
Paragominas, PA, Santana do Araguaia, PA, Alta Floresta, PA, Ariquemes, RO, and Rio Branco, AC.
To quantify the costs of CO2 , we multiplied the total CO2 emissions by the market prices and
exchange rates. So, we didn’t use the wildfire factor because the CO2 emission is independent of the
fire aim.
Remote Sens. 2019, 11, 764                                                                           8 of 24

     To evaluate the illness costs, we assumed that a factor of only 8% of respiratory morbidities can
be attributed to smoke from fires and wildfires, as shown by De Mendonça et al. [4], and then applied
the respiratory morbidity costs for June to December.
     Finally, we updated all values to the same year (2017), using the cumulative inflation rates
(Table A2), available at the Brazilian Central Bank (BCB) [65] website using Equation (A1). All the
economic costs in Brazilian currency (Reais) were converted to US dollars, using an average exchange
value of 0.31 ± 0.01, which referred to the 2017 quotation given by the BCB [65].

2.3.4. Assumptions and Uncertainties
     Assumptions were made in order to accommodate the limited data available with the method we
developed. First, we assumed that (1) the TerraClass Agriculture and Mosaic of Uses classes cover all
crops over the Acre state, ranging from mechanized to traditional agriculture; (2) the class Mosaic of
Uses from TerraClass are a mix of agriculture and pasture of traditional agriculture, but it is reclassified
in our analysis as Agriculture class as it is more representative of the landscape in these areas; (3) the
delimitation of properties, APP and LR from Rural Environmental Registry (acronym CAR) have no
remarkable spatial overlaps; and (4) the entire biomass loss is immediately combusted and released to
the atmosphere, being accounted only in the period of one year, thus no decay rate or emissions from
the decomposing pool were considered.
     The CAR dataset is not used as official territorial delimitation due to overlaps between different
properties, boundaries, and special areas, however, this dataset is the best spatially explicit public
information on land tenure from the Brazilian Amazon.
     The economic costs errors were estimated using the values and errors of the burned area, CO2
equivalent emission, asset prices, and dollar exchange, by applying the methods of uncertainty
propagation to compute each category uncertainty, and the total economic uncertainty, through the
multiplication method, according to Vuolo [52]. Details about the method are provided below.
     For the burned area error, we used the lower and upper values of the confidence interval of
each land cover class related to the TREES product to estimate the uncertainty of the burned area.
Thus, we propagated each burned class error to the total burned area error using the sum method
(Equation (A2)).
     The biomass error was first calculated using a multiplication method of uncertainty propagation
(Equation (A3)) to estimate the uncertainty of each class, and second, the sum method (Equation (A2))
quantified the total biomass loss uncertainty. We used the burned area, the burned area uncertainty,
the biomass value, and a standard deviation of each class. To the Agriculture and Pasture classes, we
used a standard deviation available in the consulted literature. For the Forest class, we calculated
the total standard deviation, based on the uncertainty map provided by Baccini. Therefore, the total
forest biomass uncertainty was the product of the uncertainty map and the biomass map, with a
subsequent numeric scale correction (dividing each pixel value by 1000) and a spatial scale correction
from unit per pixel to hectares (multiplying each pixel value by 0.09 ha). Finally, we used a sum
method of uncertainty propagation (Equation (A2)) to estimate the total standard deviation of the
Forest class biomass.
     The CO2 emissions error followed the same principle of biomass error estimation, where the
biomass total value, a biomass error, a CO2 equivalence conversion, and its error were used in a
multiplication method of uncertainty (Equation (A3)), achieving the class error. This value was then
applied to the sum method (Equation (A2)) to estimate the total CO2 equivalent emission error.

3. Results

3.1. Spatiotemporal Variability of Fire Dynamics
    During all the analyzed years, more than 2577 km2 were burned. Of these, approximately 12%
burned more than once and 3% occurred in following years, with a maximum three-year sequence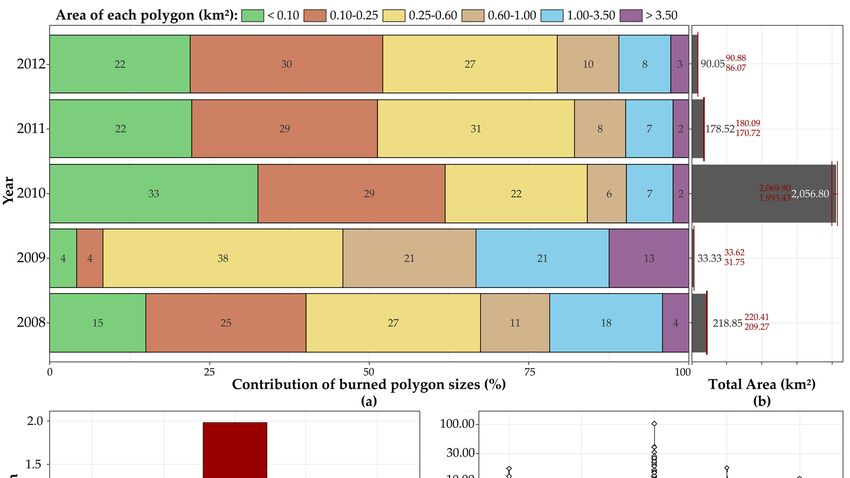
Remote Sens. 2017, 9, x FOR PEER REVIEW                                                              9 of 27

                multiplication method of uncertainty (Equation A3), achieving the class error. This value was then
                applied to the sum method (Equation A2) to estimate the total CO2 equivalent emission error.

                3. Results
Remote Sens. 2019, 11, 764                                                                                                     9 of 24
                3.1. Spatiotemporal Variability of Fire Dynamics
                     During all the analyzed years, more than 2577 km² were burned. Of these, approximately 12%
(Table A3). Burning
             burned moreevents   in Acre
                          than once  and 3%(Figure
                                             occurred 2)   were concentrated
                                                       in following                 near the
                                                                    years, with a maximum       majorsequence
                                                                                            three-year  urban centers (Rio
             (Table do
Branco, Cruzeiro    A3).Sul,
                         Burning
                             Senaevents  in Acre (Figure
                                    Madureira,           2) were concentrated
                                                     Tauaracá,    Feijó, andnear    the major highways
                                                                                Brasiléia),   urban centers (BR-364,
                                                                                                             (Rio    BR-317,
             Branco, Cruzeiro do Sul, Sena Madureira, Tauaracá, Feijó, and Brasiléia), highways (BR-364, BR-317,
AC-040, and AC-040,
              AC-075)    and waterways (Iaco, Muru, Acre, and Envira rivers).
                     and AC-075) and waterways (Iaco, Muru, Acre, and Envira rivers).

                     Figure 2. Burn scars in Acre state (Brazil), mapped with 250 m spatial resolution, for the regular
      Figure 2. Burn scars in Acre state (Brazil), mapped with 250 m spatial resolution, for the regular climate
                   climate years of 2008, 2009, 2011, and 2012 (a) and for the 2010 drought year (b).
      years of 2008, 2009, 2011, and 2012 (a) and for the 2010 drought year (b).
                     Every year new burn scars were mapped (Table A4). However, the number of polygons varied
              substantially
     Every year    new burn (24–3521).
                                  scarsTheir
                                          weresize mapped
                                                   also had a large annual
                                                                (Table      standard
                                                                         A4).          deviationthe
                                                                                 However,        (SD). The maximum
                                                                                                     number            SD
                                                                                                                 of polygons   varied
              reached 2.54 km² in 2010, while the minimum SD of 1.28 km² was recorded in 2011. In 2010 the
substantiallyhighest
               (24–3521).     Their size also had a large annual standard deviation (SD). The maximum SD
                      number of polygons were observed (3521) and the largest total burned area (2056.8 km²)
              km2 inall2010,
reached 2.54 among              while the
                         years analyzed   wasminimum         SD of 1.2819km
                                                expressed, respectively,
                                                                                 2
                                                                             timeswas
                                                                                    largerrecorded
                                                                                           and 16 timesin higher
                                                                                                          2011.than
                                                                                                                  In 2010
                                                                                                                      the the highest
              mean of thewere
number of polygons        other four  years. The(3521)
                                  observed        largest polygon
                                                           and the observed
                                                                      largest in our time-series
                                                                                 total   burned  hadarea
                                                                                                     more(2056.8      km2 ) among all
                                                                                                            than 100 km²,
              which occurred in 2010, while, in any other year the largest burned polygon had an area of 16.90 km².
years analyzed was       expressed, respectively, 19 times larger and 16 times higher than the mean of
                   Considering that Acre´s dry season (months with monthly rainfall < 100 mm) in 2010 extended
the other fourbyyears.    The largest
                  one month,              polygon
                                totaling four    monthsobserved       in the
                                                          in this year,  our3521time-series      had scars
                                                                                     observed burn     more(2056.8    100 km2 , which
                                                                                                               thankm²)
              corresponded
occurred in 2010,   while,toinaround     29 burning
                                  any other      yearevents    per day in
                                                         the largest       the dry polygon
                                                                        burned      season, with   an average
                                                                                                 had   an areaofof16.85 ± km2 .
                                                                                                                     16.90
     Considering that Acre’s dry season (months with monthly rainfall < 100 mm) in 2010 extended by
one month, totaling four months in this year, the 3521 observed burn scars (2056.8 km2 ) corresponded
to around 29 burning events per day in the dry season, with an average of 16.85 ± 0.52 km2 each.
During the three dry months of the regular climate year of 2012, conversely, only 146 burn scars
(90 km2 ) were detected, corresponding to about 2 burning events per day in the dry season, with an
average of 0.98 ± 0.04 km2 burned daily.
     Analyzing the distance to roads (Table A5), we found that, in 2010, burn scars reached longer
distances from the main highways (11.15 ± 9.67 km) than the average distance of other years
(7.27 ± 6.52 km). These burned scars also occurred closer to the waterways in 2010 (1.49 ± 1.15
km) than during the other years (1.66 ± 1.13 km).
     In all the analyzed years, there was a dominance of burned scars with areas up to 0.60 km2
(Figure 3a). However, in 2009 there was a significant change in the proportions of burned scar classes,
where the larger polygons (>0.25 km2 ) stood out over small polygons (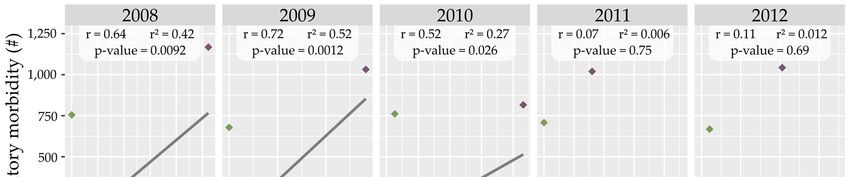
with an average of 0.98 ± 0.04 km² burned daily.
                        Analyzing the distance to roads (Table A5), we found that, in 2010, burn scars reached longer
                   distances from the main highways (11.15 ± 9.67 km) than the average distance of other years (7.27 ±
                   6.52 km). These burned scars also occurred closer to the waterways in 2010 (1.49 ± 1.15 km) than
                   during the other years (1.66 ± 1.13 km).
                        In all the analyzed years, there was a dominance of burned scars with areas up to 0.60 km²
Remote Sens. 2019, 11, 764 3a). However, in 2009 there was a significant change in the proportions of burned scar classes,
                   (Figure                                                                                                 10 of 24
                   where the larger polygons (>0.25 km²) stood out over small polygons (< 0.25 km²).
                        In 2010, we observed the largest burned area (2056.80 km²) among all years analyzed, making
                   this year anomalous in relation to the average burned area value (+2.39 SD, Table A4) and also to a
number of burned          scars (+1.99 SD, Figure 3b, and Table A4). Additionally, this year presented the
                   number of burned scars (+1.99 SD, Figure 3b, and Table A4). Additionally, this year presented the
larger number larger
                   of outliers
                          number ofcompared       to the
                                     outliers compared     other
                                                        to the otheryears   (Figure
                                                                     years (Figure     3cTable
                                                                                   3c and  andA4).
                                                                                                 Table A4).

                      Figure 3. Evaluation of the annual burned area time series from 2008 to 2012. (a) Contribution of each
      Figure 3. Evaluation      of the annual burned area time series from 2008 to 2012. (a) Contribution of each
                      burned polygon size to the total burned area; (b) total burned area (ha) with upper and lower limits;
      burned polygon(c)size
                          anomalythe
                               to        total burned
                                    of number   of burned area;    (b) total by
                                                           scars, normalized  burned     areadeviation
                                                                                its standard   (ha) with     upper
                                                                                                       (σ) for        and lower limits; (c)
                                                                                                               the 2008–2012
      anomaly of number
                      period;of(d)burned      scars,
                                   Distribution       normalized
                                                 of burn               bywhere
                                                          polygon sizes,   its standard
                                                                                the sides ofdeviation     (σ)
                                                                                             each violin is    for the
                                                                                                            a kernel    2008–2012 period;
                                                                                                                     density
                      function; the red dot represents the median; the white bar indicates the interquartile range; the
      (d) Distributionstraight
                        of burn      polygon sizes, where the sides of each violin is a kernel density function; the
                                vertical line represents the 95% confidence interval; and the white dots represent outlier
      red dot represents    the median; the white bar indicates the interquartile range; the straight vertical line
                      polygons.
      represents the 95% confidence interval; and the white dots represent outlier polygons.

3.2. Fire Occurrence and Land Tenure Relationship
                       Remote Sens. 2017, 9, x FOR PEER REVIEW                                                            11 of 27
    Usually, the extent of the fires’ impact was greatest for private areas (98.8%) than for public
                 3.2. Fire Occurrence and Land Tenure Relationship
governmental lands     (1.2%). Burned areas were not observed in governmental lands in 2009 and were
                       Usually, the extent of the fires’ impact was greatest for private areas (98.8%) than for public
lower than 1% ingovernmental
                   2008. However,           in 2010, fire occurrences increased by 2.86 percentage points (p.p)
                                 lands (1.2%). Burned areas were not observed in governmental lands in 2009 and were
within the areas managed
                 lower than 1%by      governmental
                                  in 2008.                 institutes
                                           However, in 2010,              (Figure
                                                             fire occurrences        4a).
                                                                              increased by 2.86 percentage points (p.p)
                       within the areas managed by governmental institutes (Figure 4a).

                            Figure 4. The proportion of burned area by (a) management types; (b) land use and land cover; (c)
      Figure 4. The proportion       of burned area by (a) management types; (b) land use and land cover; (c)
                       propriety class.
      propriety class.
                             The dominant LULC in Acre is the Forest class (Table A6), representing 91% of all territory in
                       the period studied. The area of Pasture and Agriculture corresponded to 8.3% and 0.7% of the
                       territory, respectively. The Pastures class was the LULC predominantly affected by fire during
                       regular years (63.5%). For the same period, the areas of Forests and Agriculture affected by fires
                       corresponded, respectively, to 29.7% and 6.8% of Acre’s territorial extent (Figure 4b). On the other
                       hand, during the 2010 drought, the burned area increased by almost 25 p.p. in forests (contributing
                       to 54.5% of the total area burned) and decreased in the other two classes (totaling 42.4% of Pasture
Remote Sens. 2019, 11, 764 11 of 24
The dominant LULC in Acre is the Forest class (Table A6), representing 91% of all territory in the
period studied. The area of Pasture and Agriculture corresponded to 8.3% and 0.7% of the territory,
respectively. The Pastures class was the LULC predominantly affected by fire during regular years
(63.5%). For the same period, the areas of Forests and Agriculture affected by fires corresponded,
respectively, to 29.7% and 6.8% of Acre’s territorial extent (Figure 4b). On the other hand, during
the 2010 drought, the burned area increased by almost 25 p.p. in forests (contributing to 54.5% of
the total area burned) and decreased in the other two classes (totaling 42.4% of Pasture and 3.1% of
Agriculture).
Acre registered, by 10 January 2018, 31901 proprieties with the Rural Environmental Registry
(acronym CAR). From this total, 78% were classified as smallholdings, 18.5% as small, 1.9% as
medium, and 1.5% as large properties. In regular years, around 38 large proprieties, 19 medium,
438 smallholdings, and 68 small proprieties were affected by fires. These numbers represent, for each
class area respectively, 8%, 3.2%, 1.8%, and 1.2%. This same pattern persisted during 2010, with a
change in the total amount of proprieties affected (Table A7). This pattern was not observed when we
analyzed the total of the burned area (Figure 4c). Interestingly, a new configuration emerged in all
regular climate and anomalous years, with large properties contributing to the largest affected areas,
followed by smallholdings, then small, and finally medium properties.When analyzing the occurrence
Remote Sens. 2017, 9, x FOR PEER REVIEW 12 of 27
of burned areas in governmentally protected areas (CU and IL), we found that the total burned area
was predominant
observed in the
2008 and number
highest 2012, respectively
of CUs affected,by CU and
reaching IL (Figure
a total of 45.63 km²5a).of In 2009,
area burned
burned. In areas did
addition, less than 1%
not occur in governmentally of the burnings
protected areas.occurred
InsideintheIntegral Protectionof
boundaries reserves
private (PARNA
areas,Serra do
common-use areas
Divisor), while about 99% occurred in sustainable-use reserves, such as the RESEX Chico Mendes
(AUC, 59.7%)(34.73
were more
km²), RESEX affected by fires than
Cazumbá-Iracema protected
(7.76 km²), FLONA areas (LR,
Santa Rosa dos26.1% andkm²),
Purus (1.87 APP, 14.2%)
and ARIE (Figure 5b).
Seringal Nova Esperança (1.26 km²).
Figure 5. The proportion of burned area by land use and land cover types (a) and by special areas (b),
Figure 5. Thethrough
proportion of burned area by land use and land cover types (a) and by special areas (b),
the years analyzed
through the years analyzed.
In relation to the 31 ILs existing in Acre, only eleven of them were affected by fires between 2008
and 2012
Five of the eleven (Table
CUs A9),
inwhich
Acre were
weretheaffected
following:byAlto Riobetween
fires Purus; Cabeceira
2008 anddo Rio Acre;(Table
2012 IgarapéA8).
do The RESEX
Caucho; Kampa do Rio Amonea; Kampa e Isolados do Rio Envira; Katukina/Kaxinawá; Kaxinawá
Chico Mendes wasVinte
Colônia the only
e Sete;one to burn
Kaxinawá do Rioevery time
Humaitá; that CUand
Mamoadate; was affected.
Poyanawa. TheDuring
Mamoadate2010,
landwe observed
the highest number of CUs
had the greatest affected,
burned extent in reaching a total
2010 (11.20 km²) of 45.63
and was one2 to
the onlykm ofburn
area burned. In addition, less
in 2011.
than 1% of the burnings occurred in Integral Protection reserves (PARNA Serra do Divisor), while
3.3. Environmental, Social, and Economic Impacts of Fire
about 99% occurred in sustainable-use reserves, such as the RESEX Chico Mendes (34.73 km2 ), RESEX
The average biomass2 loss during normal climate years was about 0.3 ± 0.5 Tg.y -1, however, this
Cazumbá-Iracema (7.76 km
value increased to 7.02),±FLONA Santa
0.55 Tg.y-1 in Rosa 6a).
2010 (Figure dosFires
Purus km2were
(1.87areas
in forested ), and ARIE for
responsible Seringal Nova
Esperança (1.26 km
almost 2
59% ). of biomass loss in Acre during all years, except for 2012 (Figure 6b)
Pastures contributed with approximately 58% of the total CO2 emissions in normal years (0.78 ±
In relation to the 31 ILs existing in Acre, only eleven of them were affected by fires between 2008
0.20 Tg.y-1) (Figure 6c). The Agriculture class, on the other hand, contributed less than 0.2% of
and 2012 (Table A9), on
emissions, which were
average. the2010,
During following:
however, Alto
forestsRio Purus;
alone Cabeceira
contributed to 69% ofdo theRio
totalAcre;
CO2 Igarapé do
Caucho; Kampa do from
emission Rio fires
Amonea; Kampa
in Acre (Figure 6c), ecorresponding
Isolados do Rio ±Envira;
to 15.31 2.10 Tg.y-1Katukina/Kaxinawá;
(Figure 6d). Kaxinawá
Colônia Vinte e Sete; Kaxinawá do Rio Humaitá; Mamoadate; and Poyanawa. The Mamoadate land
had the greatest burned extent in 2010 (11.20 km2 ) and was the only one to burn in 2011.through the years analyzed
In relation to the 31 ILs existing in Acre, only eleven of them were affected by fires between 2008
and 2012 (Table A9), which were the following: Alto Rio Purus; Cabeceira do Rio Acre; Igarapé do
Caucho; Kampa do Rio Amonea; Kampa e Isolados do Rio Envira; Katukina/Kaxinawá; Kaxinawá
Colônia Vinte e Sete; Kaxinawá do Rio Humaitá; Mamoadate; and Poyanawa. The Mamoadate land
had
Remote Sens. 2019, 11,the
764greatest burned extent in 2010 (11.20 km²) and was the only one to burn in 2011. 12 of 24
3.3. Environmental, Social, and Economic Impacts of Fire
The average biomass loss during normal climate years was about 0.3 ± 0.5 Tg.y -1, however, this
3.3. Environmental, Social, and Economic -1Impacts of Fire
value increased to 7.02 ± 0.55 Tg.y in 2010 (Figure 6a). Fires in forested areas were responsible for
almost 59% of biomass loss in Acre during all years, except for 2012 (Figure 6b)
The average biomass loss during normal climate years was about 0.3 ± 0.5 Tg.y−1 , however, this
Pastures contributed with approximately 58% of the total CO2 emissions in normal years (0.78 ±
value increased ± 0.55 −1 in 2010 (Figure 6a). Fires in forested areas were responsible for
0.20 to
Tg.y7.02
-1) (Figure 6c).Tg.y
The Agriculture class, on the other hand, contributed less than 0.2% of
almost 59% of biomass
emissions, on loss in Acre
average. Duringduring all years,
2010, however, except
forests alone for 2012 (Figure
contributed to 69% of6b).the total CO2
emission from fires in Acre (Figure 6c), corresponding to 15.31 ± 2.10 Tg.y-1 (Figure 6d).
Figure 6. TheFigure
proportion of biomass
6. The proportion lossloss
of biomass (b)(b)
and
andCO emissions
CO22emissions (c) by(c) byuse
land land use cover
and land and types
land cover types
and the total biomass loss (a) and total emissions(d) through the years analyzed
and the total biomass loss (a) and total emissions(d) through the years analyzed.
Pastures contributed with approximately 58% of the total CO2 emissions in normal years
(0.78 ± 0.20 Tg.y−1 ) (Figure 6c). The Agriculture class, on the other hand, contributed less than
0.2% of emissions, on average. During 2010, however, forests alone contributed to 69% of the total CO2
emission from fires in Acre (Figure 6c), corresponding to 15.31 ± 2.10 Tg.y−1 (Figure 6d).
By analyzing the social impacts, we observed up to 2500 respiratory morbidity cases during the
second semester of all the analyzed years. In the normal climate years (2008, 2009,
Remote Sens. 2017, 9, x FOR PEER REVIEW
2011, and 2012),
13 of 27
the mean cases of respiratory illness were around 2711. Surprisingly, the lowest record of respiratory
morbidity cases By analyzing the social impacts, we observed up to 2500 respiratory morbidity cases during the
(2545 cases in total) was found during 2010. Rio Branco, Cruzeiro do Sul, and Sena
second semester of all the analyzed years. In the normal climate years (2008, 2009, 2011, and 2012),
Madureira were
the mean cases of municipalities
the main in number
respiratory illness were of Surprisingly,
around 2711. respiratory theillness casesofin
lowest record all years.
respiratory
The relationship between respiratory morbidity cases and burned area duringSena
morbidity cases (2545 cases in total) was found during 2010. Rio Branco, Cruzeiro do Sul, and the extend dry
Madureira were the main municipalities in number of respiratory illness cases in all years.
season (Figure 7), suggests that Rio Branco is an outlier, with a higher amount of burned area and
The relationship between respiratory morbidity cases and burned area during the extend dry
a high number of (Figure
season hospitalizations
7), suggests thatinRiothe firstisthree
Branco years
an outlier, withanalyzed. Meanwhile,
a higher amount of burned areaPlácido
and a de Castro,
Senador Guiomard,
high number and of Acrelândia
hospitalizationshad
in thean increase
first inanalyzed.
three years burnedMeanwhile,
area through Plácidothe years, while their
de Castro,
Senador Guiomard, and Acrelândia had an increase in burned area through the years, while their
numbers of respiratory cases remained approximately the same. Contrarily, Cruzeiro do Sul persisted
numbers of respiratory cases remained approximately the same. Contrarily, Cruzeiro do Sul persisted
with almost the
withsame
almost number of hospitalizations
the same number of hospitalizationsand burned
and burned areaarea through
through all the
all the years years analyzed.
analyzed.
Figure 7. Correlation between respiratory morbidity and burned area by year analyzed, with the
Figure 7. Correlation between respiratory morbidity and burned area by year analyzed, with the
determination coefficient value (r 2 ), the correlation coefficient value (r), and the specific p-values.
determination coefficient value (r²), the correlation coefficient value (r), and the specific p-values.
After designing a linear regression where respiratory morbidity was the dependent variable and
After designing a linear regression where respiratory morbidity was the dependent variable
respiratory morbidity cases was the independent variable, modeled for each year (Figure 7), we
and respiratory
observed a positivecases
morbidity wascoefficient
correlation the independent variable,
(r > 0) more explicit modeled
for 2008 (r = 0.64,for
r² = each year (Figure
0.42, p-value = 7), we
observed a positive correlation coefficient (r > 0) more explicit for 2008 (r = 0.64, r = 0.42, p-value
0.0092), 2009 (r = 0.72, r² = 0.52, p-value = 0.0012), and 2010 (r = 0.52, r² = 0.27, p-value = 0.026) 2
years.
This result suggests that an increase in the burned area will lead to an increase in the number of
hospitalizations. However, the quality of those models described by the determination coefficient
(r²), indicates that 2009 exhibited a better model fit than the others years. The 2008, 2009, and 2010
year models indicate that the burned area is relevant to explaining the respiratory morbidity cases,
using a 5% significance level.
The fire-mediated economic losses in Acre between 2008 and 2012 are discriminated in Figure 8
and Table A10, where the values are specified by damage type, summarized with its total deviationRemote Sens. 2019, 11, 764 13 of 24
= 0.0092), 2009 (r = 0.72, r2 = 0.52, p-value = 0.0012), and 2010 (r = 0.52, r2 = 0.27, p-value = 0.026)
years. This result suggests that an increase in the burned area will lead to an increase in the number of
hospitalizations. However, the quality of those models described by the determination coefficient (r2 ),
indicates that 2009 exhibited a better model fit than the others years. The 2008, 2009, and 2010 year
models indicate that the burned area is relevant to explaining the respiratory morbidity cases, using a
5% significance level.
The fire-mediated economic losses in Acre between 2008 and 2012 are discriminated in Figure 8
and Table A10, where the values are specified by damage type, summarized with its total deviation
and GDP equivalence. CO2 emissions represented the greatest contribution to the total economic loss,
ranging from 40% to 73%. Respiratory illness costs had the smallest contribution, representing up to
9.4% of all costs in 2009. In 2010, there was an increase of 8 percentage points in the CO2 emission
contribution for the total economic loss, compared to the average of the normal climatic years. Losses
in propriety infrastructure (fences) represented 12% in 2010, the most representative year before 2012.
Remote Sens. 2017, 9, x FOR PEER REVIEW 14 of 27
Figure 8. Percentage of economic loss by type of damage (a), total economic loss (b), and GDP
Figure 8. Percentage of economic loss by type of damage (a), total economic loss (b), and GDP
equivalence (c) by year.
equivalence (c) by year.
As expected, 2010 had the highest economic loss, corresponding to a total of US$ 243.36 ± 85.05
4. Discussion
million, representing around 7 ± 2.45% of Acre’s GDP for that year. Nevertheless, during normal
4.1. Spatio-Temporal Variability of Fire Dynamics
climate years, the average loss was around US$ 16.03 ± 3.27 million, representing 0.51 ± 0.10% of the
The eastern flank of Acre was the region with the greatest extent of burned area. This region is
mean GDP. historically the epicenter for land use and land cover change, with up to 10% of forests burning twice
between 1999–2010 [66] and up to three times, when expanding the time-window from 1984 to 2016
4. Discussion[67], mostly occurring in Acre’s frontier with Pando (Bolivia), Amazonas (Brazil), and Pucallpa
(Peru).
4.1. Spatio-TemporalThe Variability
widespread occurrence of fires in 2010 is attributed to the severe drought that occurred in
of Fire Dynamics
Amazonia as a consequence of the El Niño-Southern Oscillation (ENSO) phenomenon, intensified by
the warming
The eastern flank of ofthe tropical
Acre was North
theAtlantic
regionOceanwith[24,25]. In 2010, theextent
the greatest total area
ofburned
burned increased
area.byThis region is
16 times in relation to the 2008–2012 average. Using the Burn Damage and Recovery (BDR) algorithm
historically the epicenter for land use and land cover change, with up to 10% of forests burning twice
applied to MODIS and LANDSAT images, Morton et al. [66] found that the total extent of burned
between 1999–2010
forests in[66]
2010and up to
was 9.14 three
times times,
greater whenAmazonia
in southern expanding thanthe time-window
during from Silva
the 2008–2009 mean. 1984 to 2016 [67],
et al. [67],
mostly occurring applyingfrontier
in Acre’s the Burn Scar
with Index
Pando(BSI) (Bolivia),
to LANDSATAmazonas
images in Acre state, found
(Brazil), andanPucallpa
increase (Peru).
of 166.9 times in the total burned forest area in 2010, when compared to the 2008–2012 mean. These
The widespread
increases were occurrence of the
associated with fires in 2010 isconditions
environmental attributed tosevere
during the severe
drought drought
years when that
fires occurred in
Amazonia asrapidly
a consequence of the
spread into forest ElaNiño-Southern
areas, fact that does not occurOscillation (ENSO)
during regular climatephenomenon,
years [12]. This intensified
by the warmingstatement
of the is supported
tropicalbyNorth
the exacerbation
AtlanticofOceanburn scars’ occurrence
[24,25]. in areasthe
In 2010, distant
totalfrom roads
area and
burned increased
rivers and the total affected forests areas in 2010.
by 16 times in relation to the 2008–2012 average. Using the Burn Damage and Recovery (BDR)
algorithm applied to MODIS
4.2. Fire Occurrence andTenure
and Land LANDSATRelationshipimages, Morton et al. [66] found that the total extent
of burned forests in 2010
Pasture was
was the first9.14
LULCtimes greater
type burned moreininsouthern Amazonia
all the regular than
climatic years. during
Usually, the 2008–2009
pasture
mean. Silva etmanagement with fire during
al. [67], applying the dry
the Burn season
Scar aims (BSI)
Index to eliminate accumulatedimages
to LANDSAT dead material
in Acreon the
state, found an
ground, which represents a physical barrier to the development of new plants, more palatability, and
increase of 166.9
with times
a higherinnutritive
the total burned
value [68,69]. forest area according
Furthermore, in 2010, to when
Costacompared
2008 [68], in to
thethe 2008–2012 mean.
northern
These increases werefire
Amazon, associated
is a widespreadwithpractice
the environmental conditions
for increasing pastures’ during severe drought years when
productivity.
fires rapidly spreadObserving at property
into forest scales,
areas, a 8%
factof that
the large rural
does properties
not occur presented 52% of theclimate
during regular burned areas
years [12]. This
while less than 2% of the small properties, where there is the prevalence of small producers and
statement is supported by the exacerbation of burn scars’ occurrence in areas distant
family farmers, accounted for 32% of the burnings. This indicates that fire is a widespread tool for from roads and
rivers and themanagement,
total affected forests of
independently areas in tenure.
the land 2010.
Despite this, Soares-Filho et al. [55] reported that, with the New Forest Code accession, the
vegetation management within private properties becomes increasingly essential to mitigate global
climate change effects, since about 53% of vegetation is located in these properties. In addition, withYou can also read