Touch and You're Trapp(ck)ed: Quantifying the Uniqueness of Touch Gestures for Tracking
←
→
Page content transcription
If your browser does not render page correctly, please read the page content below

Proceedings on Privacy Enhancing Technologies ; 2018 (2):122–142

Rahat Masood*, Benjamin Zi Hao Zhao, Hassan Jameel Asghar, and Mohamed Ali Kaafar

Touch and You’re Trapp(ck)ed: Quantifying the
Uniqueness of Touch Gestures for Tracking
Abstract: We argue that touch-based gestures on touch-
screen devices enable the threat of a form of persistent
                                                                  1 Introduction
and ubiquitous tracking which we call touch-based track-
                                                                  Touch gestures such as swipes, taps and keystrokes, are
ing. Touch-based tracking goes beyond the tracking of
                                                                  common modes of interaction with smart touchscreen-
virtual identities and has the potential for cross-device
                                                                  enabled devices, e.g., smartphones, smart watches and
tracking as well as identifying multiple users using the
                                                                  smart glasses. Major platforms including Android OS,
same device. We demonstrate the likelihood of touch-
                                                                  iOS, watchOS and Android Wear provide a variety of
based tracking by focusing on touch gestures widely
                                                                  APIs to help app developers detect gestures aiming to
used to interact with touch devices such as swipes and
                                                                  enhance the quality of experience of apps. Access to
taps.. Our objective is to quantify and measure the in-
                                                                  these APIs allows apps to collect raw gesture data from
formation carried by touch-based gestures which may
                                                                  different sensors available on the smart device. The fine-
lead to tracking users. For this purpose, we develop an
                                                                  grained nature of this data means that there is potential
information theoretic method that measures the amount
                                                                  of learning more about users than is perhaps necessary
of information about users leaked by gestures when
                                                                  for the proper functioning of an app. Indeed one area
modelled as feature vectors. Our methodology allows
                                                                  where touch gestures have been exploited is continuous
us to evaluate the information leaked by individual fea-
                                                                  authentication through which users are authenticated
tures of gestures, samples of gestures, as well as sam-
                                                                  by profiling their touch behaviour [1, 14].
ples of combinations of gestures. Through our purpose-
                                                                       In this paper, we argue and verify that touch ges-
built app, called TouchTrack, we gather gesture samples
                                                                  tures constitute a privacy threat as they enable a new
from 89 users, and demonstrate that touch gestures con-
                                                                  form of tracking of individuals, which we refer to as
tain sufficient information to uniquely identify and track
                                                                  “touch-based tracking,” which is the ability to continu-
users. Our results show that writing samples (on a touch
                                                                  ously and surreptitiously track and distinguish users via
pad) can reveal 73.7% of information (when measured
                                                                  their touch behaviour while they are interacting with
in bits), and left swipes can reveal up to 68.6% of infor-
                                                                  their devices. As compared to “regular” tracking mech-
mation. Combining different combinations of gestures
                                                                  anisms, e.g., based on cookies, browser fingerprints,
results in higher uniqueness, with the combination of
                                                                  browser user agents, logins and IP addresses, several
keystrokes, swipes and writing revealing up to 98.5% of
                                                                  factors make touch-based tracking potentially riskier.
information about users. We further show that, through
                                                                  First, while regular tracking tracks virtual identities
our methodology, we can correctly re-identify returning
                                                                  such as online profiles [13, 20, 25], touch-based tracking
users with a success rate of more than 90%.
                                                                  has the potential to track and identify the actual (phys-
Keywords: Implicit Tracking, Mobile Privacy, Touch                ical) person operating the device. It can distinguish and
Gestures, User Profiling, Risk Quantification                     track multiple users accessing the same device. Second,
DOI 10.1515/popets-2018-0016
                                                                  touch-based tracking possesses the capability to contin-
Received 2017-08-31; revised 2017-12-15; accepted 2017-12-16.     uously track users. Third, it also leads to cross-device
                                                                  tracking where the same user can potentially be traced
                                                                  on multiple mobile devices. Cross-device tracking intro-
                                                                  duces additional privacy and security risks, where user
                                                                  data can be collated and sent to advertising companies
                                                                  and third party entities to build user profiles based on
*Corresponding Author: Rahat Masood: CSIRO Data61
and University of New South Wales (UNSW), Sydney, Aus-
tralia, E-mail: rahat.masood@student.unsw.edu.au
Benjamin Zi Hao Zhao: CSIRO Data61, Sydney, Australia,            Mohamed Ali Kaafar: Macquarie University, Optus Mac-
E-mail: ben.zhao@data61.csiro.au                                  quarie University Cyber Security Hub, and CSIRO Data61,
Hassan Jameel Asghar: CSIRO Data61, Sydney, Australia,            Sydney, Australia, E-mail: dali.kaafar@mq.edu.au
E-mail: hassan.asghar@data61.csiro.au
Touch and You’re Trapp(ck)ed: Quantifying the Uniqueness of Touch Gestures for Tracking     123

their activities on smartphones, tablets, smart watches             levels of granularity. At the finest level, our frame-
and various IoT devices. However, demonstrating this                work quantifies the information carried by individ-
type of tracking requires a more generalized approach,              ual features, e.g., pressure on screen and area cov-
e.g. to validate the stability of features across devices,          ered by the gesture. At the second level, our frame-
which we leave as future work.                                      work quantifies the information carried by a ges-
     Not all use cases of touch-based tracking are neg-             ture sample, e.g., a single swipe. At the third level,
ative. It can also be beneficial to users and service               our framework calculates the amount of informa-
providers alike. For instance, the identification of mul-           tion carried by multiple samples of the same ges-
tiple users using the same device may help in provid-               ture, e.g., a collection of swipes. Lastly, we measure
ing content more suitable for each of them. A child us-             the information carried by a collection of samples
ing his/her parent’s smartphone can automatically have              from multiple gestures, e.g., swipes and taps. We ap-
parental control enabled. Touch-based tracking could                ply our framework on four widely used touch screen
also bring commercial benefits to the user (e.g. display-           gestures: i) swipes, ii) taps, iii) keystrokes, and iv)
ing discounts and sales on the product of interest to the           handwriting, and four sub-categories of swipe: i) up
user). The reader might notice a link between touch-                swipe, ii) down swipe, iii) left swipe, and iv) right
based tracking and touch-based continuous authentica-               swipe. The framework is generic enough to apply to
tion. There are major differences in the two notions. The           any behavioural biometric modality which can be
latter verifies a claimed identity based on prior knowl-            expressed as feature vectors.
edge of the identity and former tracks users even with-        –    We develop and deploy a game-like app called
out the knowledge of any disclosed identity. We elab-               “TouchTrack” for Android powered devices. It con-
orate on this and other differences between the two in              sists of three well known open source games: 2048
Section 5.                                                          (for swipes),1 Lexica (for taps),2 Logo Maniac (for
     The ubiquity of the touchscreen devices and the fact           keystrokes),3 and one custom built app for hand-
that most if not all data from touch events and/or other            writing. These games were selected to capture touch
sensors can be extracted by any mobile app without re-              gestures in a natural way. Through our TouchTrack
questing special permission makes touch-based tracking              app the user can check the uniqueness and tracking
a serious privacy threat for users. This not only repre-            potential of his/her gestures.
sents a valuable new source of information for analyt-         –    Using our TouchTrack app, we carried out a user
ics, tracking, and ad services but also for app developers          study comprised of 89 participants and gathered
who can (mis)use the information to track individuals               a total of 40,600 samples of touch gestures. For
on a single device or across multiple devices. The ob-              each touch gesture, we identified features that
jective of this paper is to quantify the amount of in-              contain high amount of identifying infor-
formation carried by user’s touch gestures and hence to             mation using the maximum-relevancy minimum-
evaluate their tracking capabilities. Our main contribu-            redundancy (mRMR) algorithm [26]. The algorithm
tions are summarised as follows.                                    attempts to constrain features to a subset which are
– We investigate the potential of using touch-based                 mutually dissimilar to each other, but similar to the
     gestures for tracking, which we call touch-based               classification variable, which in our case was the set
     tracking. We quantify the amount of information                of users. We give details in Section 4.2. We found
     contained in these gestures which could lead to user           that the most revealing features were the 80th per-
     tracking. To the best of our knowledge, this is the            centile of area from left swipes, the 20th percentile
     first study considering the potential of touch ges-            of area and the 50th percentile of pressure from
     tures to profile users. Our work complements re-               downward swipes which yielded 56.1%, 55.50% and
     search on other forms of tracking such as through              46.13% of information, respectively.
     web browsers, host devices, and online social profiles    –    With the same dataset, we measured the amount
     by fingerprinting browser features, device configura-          of information contained in samples from the
     tions, and user attributes [4, 7, 13, 18, 19, 24, 25,
     27, 38].
– We develop an analytical framework that mea-
     sures the amount of identifying information (in bits      1 https://github.com/gabrielecirulli/2048
     and relative mutual information) contained in touch       2 https://github.com/lexica/lexica
     gestures, represented as feature vectors, at different    3 https://github.com/Luze26/LogoManiac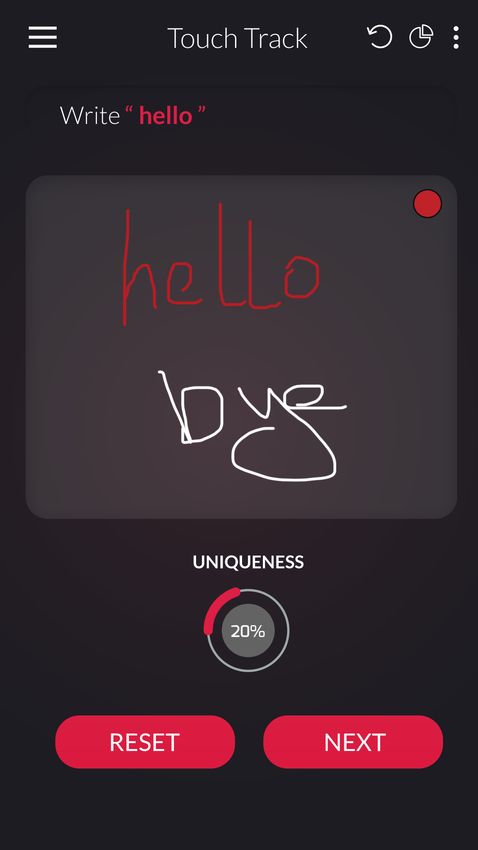
Touch and You’re Trapp(ck)ed: Quantifying the Uniqueness of Touch Gestures for Tracking    124

    same gesture and from multiple gestures.4                      of this work in Section 5. Finally, we describe related
    We found that 50 features in a single handwrit-                work in Section 6 and conclude in Section 7.
    ing sample contribute 68.71% of information about
    users, which increases to 73.7% with multiple sam-
    ples. We further identified that two or three dif-
    ferent gestures combined together reveal more in-
                                                                   2 Data Collection
    formation about users. For instance swipes, hand-
                                                                   To illustrate the potential of touch-based tracking, we
    writing, and keystrokes carry 98.5%, while hand-
                                                                   developed and launched a purpose-built app named
    writing, taps, and swipes disclose 95.1% of infor-
                                                                   TouchTrack to capture gesture samples. We first give
    mation. Among users who performed all the four
                                                                   an overview of the TouchTrack app, followed by our
    gestures, our framework revealed 98.89% of infor-
                                                                   data collection approach. We then briefly describe some
    mation about users.
                                                                   statistics about our dataset.
–   Finally, we also validated our framework in
    terms of correctly identifying a returning
    user. This is important since the same user might
                                                                   2.1 Selection of Gestures
    have two different samples from the same gesture
    that could be mutually dissimilar (thus showing                Our selection of gestures was based on how frequently
    high uniqueness) but will not result in identifying            they are performed by users of smartphones or other
    the user. We measure the true positive and false               touchscreen devices. We narrowed our selection to
    positive rates (TPR and FPR) of our method. We                 swipes (including left, right, upward and downwards
    define TPR as the rate at which a unique user (in              swipes, and the group of four taken together), taps,
    our set of users) is identified as the correct user given      keystrokes and handwriting. Swipes and taps are by
    a test sample (or set of samples). Likewise, FPR is            far the most frequent gestures on smartphone apps.
    defined as the rate at which the wrong user is iden-           Keystrokes are also frequently used for typing text
    tified as the target user or a set of more than one            messages or entering web addresses. Unlike tap, which
    users is identified as the set of possible users given a       could be performed at any point on the touch screen,
    test sample (or set of samples). We found that with            a keystroke is restricted to tapping on the mobile key-
    multiple samples, swipes and handwriting show a                board. We therefore separated the two. Writing on the
    TPR of 90.0% and 91.0%, respectively. For a com-               touchscreen using fingers is an important alternative in-
    bination of gestures we found that swipes and hand-            put method on a smartphone. We did not include other
    writing combined together had a TPR of 93.75%. In              less frequent gestures such as pinching (for zooming in
    terms of FPR, we found that swipes, handwriting,               or out).
    and keystrokes taken together had an FPR of only
    0.8%.
                                                                   2.2 The TouchTrack App
Overall our results demonstrate that touch gestures can
be used to uniquely identify (or fingerprint) users with           The purpose of TouchTrack is to collect gesture sam-
high accuracy. This illustrates the threat of tracking             ples as raw readings from the touch sensors, send them
based on touch gestures in general. The rest of the paper          to our server, and finally inform the users about the
is organized as follows: Section 2 covers our methodol-            uniqueness of their gestures by displaying the results
ogy of collecting data using TouchTrack app, and then              computed via our framework at the server. To keep the
presents the descriptive statistics about our dataset.             user interested in using our app, we decided to design
Section 3 outlines our proposed probabilistic analytical           it like a game. The app is made up of four games, three
framework in detail. In Section 4, we discuss the results          of them are based on popular open-source games and a
on the amount of information conveyed by the users of              fourth game was purposely developed by us. We selected
our dataset for different touch gestures and their combi-          these four games so as to capture the user gestures in
nations . We discuss the limitation and future directions          a most natural way. We briefly describe each game in
                                                                   Appendix A.1 along with the screenshots of the games.
                                                                        When a new user uses TouchTrack, he/she is re-
4 We use the relative mutual information as our metric for iden-   quired to sign up using a unique username. The user-
tifying information. For details, see Section 3.                   name together with the device ID is hashed and then
Touch and You’re Trapp(ck)ed: Quantifying the Uniqueness of Touch Gestures for Tracking 125
stored in our database. This is done to ensure that ges- Table 1 shows the list of raw touch features gath-
ture samples from different users are kept separate to ered from the touch sensors of the devices used by the
establish the ground truth. This also helps us to iden- users across all gestures. By default, these features can
tify returning users and devices. For matters of ease and be obtained from Android APIs without requiring any
privacy, we did not require the user to enter a password security permission. We used the MotionEvent Android
with the username. Even though our app sends data API to detect and collect touch data. We did not use
in HTTPs, we did not want to collect any additional motion features for our analysis because we observed
sensitive data, such as passwords, from users. Once the that certain motion sensors such as accelerometer, gy-
user has played one or more games, the uniqueness of roscope and rotation vector did not produce any raw
the corresponding gestures are computed through our data in many phones, and returned a null value to the
quantitative framework (described in Section 3) and are Android API.
shown to the user in both visual and tabular forms.
Screen shots of results are shown in Figure 7 of Ap-
pendix A.1. For user convenience, our app starts show- 2.4 Ethics Consideration
ing results after a single gesture. However, to get more
accurate results, the user is encouraged to perform more Prior to data collection, we underwent and obtained an
gestures. We would like to remark that our results may ethics approval from our organization’s ethics board.
still not be reflective of user touch behaviour in the real The users were informed about the purpose of Touch-
world, as displaying uniqueness results might encour- Track and what data is being collected. Throughout
age the user to change touch behaviour to avoid pri- data collection, we did not attempt to obtain the real
vacy leakage. Probable change in user behaviour due to identities of the participants via, for instance, a link-
feedback has been acknowledged before in the case of age study. The data collected was not released publicly.
browser-based tracking [13]. We have made the Touch- No identifying information other than the user selected
Track app available on Google Play Store as our objec- username and device ID was stored at our server side.
tive is to extend our work in the future to assess the Moreover, only the hash of the username and device
effectiveness of touch-based tracking as more users are ID were stored. The only other information stored at
added. the server were the raw data from gestures from each
username-device ID pair. A privacy disclaimer was dis-
played as soon as the app was launched by a participant
2.3 The Raw Dataset providing the above details. The participant was allowed
to opt-out. We informed users that their personal infor-
To collect gesture samples, we invited participants mation will remain anonymous and took their consent
through two means: via emails to targeted participants beforehand.
and via social networking platforms. At first we up-
loaded a closed testing version of TouchTrack on Google
Play Store and invited colleagues and acquaintances via 2.5 Data Statistics
email to install our app. A total of 25 participants re-
sponded to the first phase. In the second phase, we Table 2 shows the summary statistics of our data col-
published the first version on Google Play Store and lection. The numbers are broken down into number of
received a further 56 responses through our personal users, samples of gestures and features associated with
and social contacts. We received 8 responses from the each gesture. We collected a total of 40,600 gesture sam-
users who installed our app without invitation. We also ples. Among these samples, swipe and tap gestures had
included them in our analysis. The app was available the most number of samples. There were a total of 89
on Google Play Store for two months for data collec- users who downloaded and used our app; however, only
tion purposes. Once the data is collected, we start our 30 users used all four games and hence provided samples
analysis and results interpretation. The data collected for all gestures. Our app was installed on 49 different
from the 89 users served two purposes: to identify fea- smart phone models, with Google Nexus 5 being used
tures most effective in fingerprinting users and to train by 11 users and Samsung Galaxy S7 Edge by 8 users.
our analytical framework to evaluate the uniqueness of Nine of the 11 users of Google Nexus 5 used our test
gestures. smartphone to record gesture samples as they did not
have an Android powered device. We could distinguishTouch and You’re Trapp(ck)ed: Quantifying the Uniqueness of Touch Gestures for Tracking 126
Table 1. Raw Features
X-Coordinate, Y-Coordinate, Finger Pressure, Finger Area,
Raw Touch Features
Screen Orientation, Finger Orientation, Stroke Time, X-Tilt , Y-Tilt
Table 2. Touch Gesture Data Statistics gesture samples as instances of feature vectors, we then
proceed to find the uniqueness of the gestures at differ-
Number of Number of Number of ent levels. At the smallest level, we assess the uniqueness
Gesture
Users Samples Features of single features, by checking how many users exhibit
Swipes 81 16611 229 a given ‘test’ feature value among the total users in the
Up Swipes 78 3568 229 dataset. At the next level we assess the uniqueness of a
Down Swipes 71 4781 229
feature vector, i.e., a gesture sample, by checking how
Left Swipes 63 4252 229
Right Swipes 65 4010 229
many users in the dataset are likely to exhibit a given
Taps 89 16225 7 test feature vector. Likewise, we do this for a collection
Keystrokes 49 6473 8 of samples from the same gesture, and finally for the
Handwriting 36 1291 241 collection of samples from a set of different gestures. In
All Gestures: 30 25186 what follows, we define an abstract representation of our
Total: 89 40600
dataset, and how we compute the uniqueness of gestures
at multiple levels using this abstract dataset.
between users of the same device via their hashed user
ID.
3.2 Background and Notations
We denote the set of users by U, the set of gestures by G,
3 Methodology for Computing and the feature space by F. We denote our dataset by D
which is modelled as a multiset of rows. The columns of
the Uniqueness of User D are indexed by a u ∈ U, followed by a g ∈ G, a feature
Gestures vector f ∈ F, and finally by an average feature vector
f ∈ F. The average feature vector f is the average of all
In this section we describe our methodology behind feature vectors f under a gesture g ∈ G and a user u ∈ U.
computing uniqueness of gestures. We begin with an The ith feature under F is denoted by Fi . The dataset
overview, followed by notations and then the methodol- is illustrated in Table 3. We define a random variable U
ogy in detail. that takes on values from U, a random variable G that
takes on values of subsets of G, and a random variable
Fg that takes on values of subsets of feature vectors from
3.1 Overview the gesture g. When considering only a single gesture
g, we shall drop the subscript and denote the random
Recall that the purpose of calculating uniqueness is to variable as F . We use the notation {a} to indicate a
demonstrate touch-based tracking. For this, we need to set of cardinality more than 1, whose generic element
show (a) the uniqueness of gestures, (b) similarity of is denoted by a. For instance, {f } is a set of two or
gestures from the same user. To do this, we first obtain more feature vectors. The random variable F can take
gesture samples, i.e., series of raw data values captured feature values as well. Abusing notation, we will denote
from the sensors of the smart device from a set of users. this by F = fi , where fi is the value of the ith feature.
Once these samples are collected we extract a set of A predicate on a row from D denoted
salient features, thus representing each gesture by a fea-
ture vector. The set of selected features is the topic of (U = u, G = g, F1 = f1 , F2 = f2 , . . . , F = f ),
Section 4.1. For now we assume that each gesture is
is the conjunction of clauses (U = u), (G = g), and so
associated with a fixed set of features. Once we have
on. The predicate evaluates to 1 if a row satisfies each
populated our dataset with an initial list of users and
clause, and 0 otherwise. We can have possibly emptyTouch and You’re Trapp(ck)ed: Quantifying the Uniqueness of Touch Gestures for Tracking 127
clauses. When considering a feature vector, we may sim- The above measures the uniqueness of a realization of a
ply use F to represent the conjunction of its constituent random variable A through relative mutual information.
clauses. For example, the predicate To assess the uniqueness of all possible values the ran-
dom variable A can take, we make use of the conditional
(U = Alice, G = Swipe, F = (0.012, 0.567, ∗, ∗, . . . , ∗)), entropy
evaluates to 1 on the first row of Table 3, where ‘∗’ indi- H(U ∣ A) = − ∑ Pr(A = a)H(U ∣ A = a) (3)
cates that the corresponding feature values are not part a∈A
of the predicate. A fuzzy predicate is a function that
Here, Pr(A = a) is calculated from the probability distri-
evaluates to 1, if the feature vector of a row is similar to
bution of the random variable A. From this, the relative
the feature vector specified in the clauses according to
mutual information of the random variable A is
a similarity metric. Fuzzy predicates are distinguished
from predicates by replacing either the equality involv- H(U ∣ A)
IR (U ; A) = 1 − . (4)
ing F or F by ≈. For instance, the following is a fuzzy H(U )
predicate
Note that while mutual information should suffice as a
(U = Alice, G = Swipe, F ≈ (0.012, 0.567, . . . , 0.314)). measure to assess uniqueness, our choice of relative mu-
tual information is to account for the different number
We denote by #(⋅) the number of rows in D satisfying of users for different gestures, thus enabling us to com-
the predicate (or fuzzy predicate). The entropy of the pare results across gestures on the same scale. In what
random variable U is defined as follows, we shall assess the uniqueness based on different
realizations of the random variables G and F . This will
H(U ) = − ∑ Pr(U = u) log2 Pr(U = u) be done by first calculating the conditional probabilities
u∈U
1 1 in Eq. 1 which are determined by predicates or fuzzy
=−∑ log2 = log2 ∣U∣. predicates, then computing the conditional entropy in
u∈U ∣U∣ ∣U∣
Eq. 1, which then directly allows us to compute the rel-
This is the minimum number of bits of information re- ative mutual information in Eq. 2. A given realization is
quired to distinguish each user in U. The mutual infor- considered highly unique if the relative mutual informa-
mation or information gain between U and a realization tion is close to 1. We will use percentages to represent
a of the random variable A is defined as the value of relative mutual information in the range
[0, 1] in the natural way. To assess the uniqueness of
I(U ; A = a) = H(U ) − H(U ∣ A = a),
the random variables G and F in its entirety, we will
where H(U ∣ A = a) is the conditional entropy given as make use of the relative mutual information defined by
Eq. 4.
H(U ∣ A = a) = − ∑ Pr(U = u ∣ A = a)
u∈U
× log2 Pr(U = u ∣ A = a). (1) 3.3 Measuring Uniqueness
Finally, the relative mutual information between a real-
We measure uniqueness based on a single feature value
ization a of the random variable A is defined as
from a gesture sample, a single feature vector (i.e., a
I(U ; A = a) H(U ∣ A = a)
IR (U ; A = a) = =1− . (2) gesture sample), a set of feature vectors (i.e., a set of
H(U ) H(U ) gesture samples), and finally a set of feature vectors
corresponding to a set of gesture samples from multi-
Table 3. Structure of the Dataset D. ple gestures. To measure uniqueness based on a single
continuous feature, we first bin its values within dis-
F crete bins and then calculate the probability of a user
U G F
F1 F2 ⋯
producing the feature value within a bin. In contrast,
Alice Swipe 0.012 0.567 ⋯ (0.021, 0.770, ⋯)
0.019 0.599 ⋯
to evaluate uniqueness of features vector(s), we do not
⋮ ⋮ ⋮ ⋮ ⋮ bin the features, and instead rely on fuzzy predicates.
Bob Tap 0.023 0.608 ⋯ (0.010, 0.660, ⋯) Our procedure to bin continuous features (for evaluating
0.024 0.499 ⋯ uniqueness of single features) is described in Appendix
⋮ ⋮ ⋮ ⋮ ⋮ A.2.Touch and You’re Trapp(ck)ed: Quantifying the Uniqueness of Touch Gestures for Tracking 128
3.3.1 Uniqueness based on a Feature value 3.3.2 Uniqueness based on a Gesture Sample
Given a feature value fi corresponding to the ith fea- To measure uniqueness of a gesture sample, we use the
ture of a gesture g ∈ G, the uniqueness of the value is entire feature vector f corresponding to the gesture g,
computed as follows. We first calculate the probability and check against all feature vectors of the user u. Due
that a u ∈ U is likely to have produced this feature value. to high dimensionality of the feature vector, it is un-
This probability is calculated by Eq 5. likely that any two feature vectors from the same user
will be exactly the same. We therefore use the fuzzy
#(U = u, G = g, Fi = fi )
Pr(U = u ∣ G = g, F = fi ) = (5) predicate in this case, which relies on a similarity met-
#(G = g, Fi = fi )
ric. We postpone our choice of the similarity metric to
The conditional entropy in U given the feature value Section 3.4. The conditional probability is calculated as
fi of a sample of the gesture g is given by plugging #(U = u, G = g, F ≈ f )
Pr(U = u ∣ G = g, F = f ) = , (7)
the above conditional probability in Eq. 1 to obtain #(G = g, F ≈ f )
H(U ∣ G = g, F = fi ), from which the relative mutual
From this probability we can then compute the con-
information I(U ; G = g, F = fi ) can be obtained from
ditional entropy and relative mutual information as be-
Eq. 2.
fore. Due to space limit we omit how the relative mutual
information for the entire gesture is computed, which is
Example 1. Suppose our dataset has ∣U∣ = 128 users,
similar to the case of the relative mutual information
giving us H(U ) = log2 ∣U∣ = 7 bits. Suppose now we are
for a feature.
looking at the swipe gesture, and we are interested in
the first feature having value f1 = 0.012. Further suppose
that out of the 128 users, only Alice and Bob have exhib-
3.3.3 Uniqueness based on a Set of Gesture Samples
ited this value in the dataset, with Alice having exhib-
ited it twice (corresponding to two different samples of
If we are given a set of feature vectors {f } from a gesture
swipe), and Bob only once. We have #(G = Swipe, F1 =
g, we first obtain the average vector f from {f }. Then, we
0.012) = 3, #(U = Alice, G = Swipe, F1 = 0.012) = 2,
compare this average vector against the average vector
and #(U = Bob, G = Swipe, F1 = 0.012) = 1. Then
under F of the user u ∈ U (for the same gesture). Given
Pr(U = Alice ∣ G = Swipe, F = 0.012) = 32 and Pr(U =
this, the probability that the set of gesture samples is
Bob ∣ G = Swipe, F = 0.012) = 31 . From this we get
from the user u ∈ U is
H(U ∣ G = Swipe, F = 0.012) = − 32 log2 23 − 13 log2 13 ≈ 0.92
And finally, IR (U ; G = Swipe, F = 0.012) = 0.8688. We #(U = u, G = g, F ≈ f )
Pr(U = u ∣ G = g, F = {f }) = (8)
say that the feature value f1 = 0.012 for the swipe ges- #(G = g, F ≈ f )
ture reveals 87% of information. Notice the use of fuzzy predicates. Given this probabil-
ity, the conditional entropy and relative mutual infor-
To assess the uniqueness of the ith feature (and not just mation can be computed as before.
one particular feature value) we calculate the probabil-
ity that the random variable F corresponding to the ith
feature takes on the feature value fi as 3.3.4 Uniqueness based on Multiple Gestures
#(G = g, Fi = fi )
Pr(F = fi ∣ G = g) = . (6) Given a subset of gestures {g} and their corresponding
∑f ∈F #(G = g, Fi = f )
sets of feature vectors {fg }, we first obtain an average
That is we count all instances of the feature value fi and feature vector for each gesture, denoted f g , and then
divide it by the sum of all instances of feature values f in count the number of rows in D that satisfy the product
the range of F . By plugging this value and the result of of the fuzzy predicates generated by the average feature
conditional entropy of feature values in Eq. 3, we obtain vectors of the gestures involved. More specifically, the
the conditional entropy pertaining to F , from which we probability of the collection belonging to a user u ∈ U is
can compute the relative mutual information I(U ; F ) calculated as
from Eq. 4.
Pr(U = u ∣ G = {g}, {Fg = {fg }}) =
∏g (U = u, G = g, F ≈ f g )
(9)
∑u′ ∈U (∏g (U = u′ , G = g, F ≈ f g ))Touch and You’re Trapp(ck)ed: Quantifying the Uniqueness of Touch Gestures for Tracking 129
The symbol ∏ stands for product. In this case the prod- used to track users. For this, we need to show (a) that
uct is over all gestures in {g}. For instance, if we have they are highly unique and (b) their ability to iden-
{Swipe, Tap} as two gestures, then we are essentially tify returning users. We first identify a set of features
checking if the product predicate for each gesture.Then we rank the features in terms of
their distinguishing capacity and finally we apply our
(G = Swipe, F ≈ f Swipe ) × (G = Tap, F ≈ f Tap )
methodology on the selected features to show unique-
evaluates to 1, which is only possible if both the fuzzy ness results.
predicates evaluate to 1 for a given user in D. We di-
vide this by summing the same product predicate for all
users in D. The conditional entropy and relative mutual 4.1 Feature Identification and Extraction
information can be computed by plugging in the above
conditional probability. From the raw features described in Table 1 (cf. Sec-
tion 2.3), we derived more features to capture informa-
tion such as averages, standard deviations, minimums
3.4 Calculating Fuzzy Predicates and maximums. These derived features are called ex-
tracted features. A gesture sample generates a sequence
To demonstrate how fuzzy predicates are evaluated, we of raw data points. The length of this sequence depends
use a generic feature vector f belonging to a gesture on the duration of the gesture and the sampling rate
g ∈ G. This is tested against a feature vector f ′ belonging (usually around a millisecond), which is normally dif-
to a row in D under F or F (in case of the latter, we ferent across devices. This means that the sequences
have an average feature vector). As mentioned before, corresponding to two samples from the same gesture
evaluation of the fuzzy predicate is tied to a similarity may not be of the same length. We therefore performed
metric. We chose the cosine similarity metric. Assume spline polynomial interpolation [10] to ensure the same
the length of f is m, then the cosine of the angle between number of data points (length of sequence) across sam-
f and f ′ is defined as ples from the same gesture. Since the sequences from
m
∑i=1 fi fi different gestures are expected to be of different lengths,
′
cos(f , f ′ ) = √ √ , (10)
m m 2 we did a separate interpolation for each gesture.
∑i=1 fi2 ∑i=1 f ′ i
We identified a set of most commonly used fea-
which ranges between −1 and 1, the latter indicat- tures in literature (on gesture based authentication).
ing complete similarity. Together with a threshold τ ∈ We extracted 229 features for swipes, 7 for taps, 8 for
[−1, 1], the cosine similarity metric is then keystrokes, and 241 for handwriting. Out of these, only 7
⎧
⎪
features are common across all gesture categories. These
⎪1, if cos(f , f ) ≥ τ
′
scos (f , f ′ , τ ) = ⎨ (11) features are Inter-Stroke Time, Stroke Duration, Start
⎪
⎪
⎩0, otherwise X, Start Pressure, Start Y, Start Area, and Mid-Stroke
Finger Orientation. Table 9 in Appendix A.5 shows the
Example 2. Given a row (u′ , g ′ , f ′ , ⋅) of the dataset D list of these features. A few of the extracted features
(ignoring the last column under F), the fuzzy predicate are Median of First 5 Acceleration Points, 80-percentile
(U = u, G = g, F ≈ f ) evaluates to 1 if u′ = u, g ′ = g and of pairwise X-Tilt, Std. Dev. of Pairwise Change of
scos (f , f ′ , τ ) = 1. Area-Position, Direct End to End Direction, End to
End X Distance, Median of Last 3 Velocities Points,
The threshold τ is set by balancing the true positive rate
20-percentile pairwise Pressure etc.
(TPR) and the false positive rate (FPR), i.e., the value
that returns the best equal error rate (EER). Details on
this appear in Section 4.5.
4.2 Feature Subset Selection (FSS)
As a first step, we were interested in finding the unique-
4 Results ness of gestures as a function of increasing number of
features. To do this, we needed a ranking of features
In this section, we present and discuss the results of in terms of their distinguishing capacity.We use the
applying our framework to show the uniqueness of ges- maximum-relevance-minimal-redundancy (mRMR) al-
tures. Our goal is to show that touch gestures can be gorithm that attempts to constrain features to a sub-Touch and You’re Trapp(ck)ed: Quantifying the Uniqueness of Touch Gestures for Tracking 130
set which are mutually as dissimilar to each other as determined by the threshold τ of the cosine similarity
possible, but as similar to the classification variable as metric. For these results we set a universal threshold of
possible [26]. In our case, the classification variable is τ = 0.8, since we wanted to check the effect of mutual
the set U of users in our dataset. Given a set of m fea- information keeping everything else fixed. The outcome
tures F1 , . . . , Fm to find the highest rank feature, the of this analysis is depicted in Table 4. We note that for
mRMR algorithm finds the feature Fi that maximizes all gestures, the relative mutual information increases
I(U ; Fi ), where U takes on values from U, and minimizes with increasing number of features. Also, the unique-
I(Fi ; Fj ), where j ≠ i. The mutual information I(Fi ; Fj ) ness of a set of gesture samples is generally higher than
is calculated by using the joint distribution of features single samples, and in all cases surpasses the uniqueness
Fi and Fj through our dataset. Likewise, for more than of single samples as we increase the number of features.
one feature, the algorithm returns the subset of features The uniqueness of multiple swipe samples is the high-
that maximize, respectively minimize, the cumulative est, with 92.01% (highlighted green with *), followed by
mutual information. A more detailed description of the handwriting (85.93%) and downward swipes (77.52%).
algorithm is given in Appendix A.3. On the other hand, samples of taps and keystrokes ex-
hibit least uniqueness carrying 34.73% and 41.02% of
information. This may also be due to the low num-
4.3 Effect of Number of Features on ber of features identified for these gestures. We observe
Uniqueness that given a single gesture sample, handwriting provides
79.49% (highlighted green with *) of information about
In order to determine uniqueness of gestures as a func- the user and a keystroke gives the least amount of in-
tion of features, we used sets of top i features from each formation i.e. 28.76%.
gesture according to their mRMR rank, where i was in- The above analysis does not take into account the
cremented in discrete steps until m (the total number true positive rate (TPR) of the uniqueness measure-
of features). We then evaluated their relative mutual ment. Given a test sample from a user u ∈ U, we mark
information using our framework for the uniqueness of it as a true positive if the corresponding predicate only
a single gesture sample (cf. Section 3.3.2) and multiple evaluates to 1 on the user u. Otherwise, we mark it as a
samples from the same gesture (cf. Section 3.3.3). false positive. Note that this means that if the predicate
To do this we first partitioned the data from each evaluates to 1 for more than one user, then we consider
user-gesture pair into two random but mutually exclu- it as a false positive even if it evaluated to 1 on the user
sive sets. The first set had 80% of the gesture samples, u. The TPR and FPR are then evaluated over all possi-
and the second had the remaining 20% of the samples. ble test samples. Table 5 shows the TPRs and FPRs for
The larger set was labelled as our dataset D, and sam- different sets of features corresponding to a single sam-
ples from the 20% set were used for “testing.” We shall ple and multiple samples from a gesture. We found that
call this approach the 80-20 approach throughout the TPR decreases with the increase in number of features.
rest of this paper. We call the 20% set, the testing set. The most probable reason for this continual decrease is
Thus, to evaluate our methodology, we select a sample the variations in a user’s own touch behaviour as the
from the testing set (fixing a user and a gesture), and dimension of the feature space increases.
then check against the dataset D. With only 15 features, the TPR is 89% or above for
Now to check the effect of an increasing number of all gestures (with multiple samples). In terms of FPR
features on the uniqueness of gestures, we selected top i rates, we see that keystrokes and taps have relatively
features from the mRMR ranking for incremental values high FPR rates (43% and 37%, respectively, for multiple
of i and then used the above mentioned 80-20 partition- samples). The FPR decreases as we increase the num-
ing. We used an exhaustive approach, i.e., for testing ber of features. We selected first 50 features for hand-
single samples, we selected each sample in the the test- writing, 50 for swipes (all four types), 8 for keystrokes,
ing sets of all users, and then calculated the relative and 7 for taps (highlighted blue in Tables 4 & 5) for
mutual information using Eq. 4. For testing a set of ges- further analysis, as these presented a good balance be-
ture samples, we used the entire 20% testing set as one tween TPR and FPR. We also performed 10-fold cross-
set of gesture samples, and subsequently computed the validation and splits such as 30-70, 40-60 using Weka
relative mutual information. In our methodology, the to evaluate the relative mutual information, TPR and
relative mutual information for both these categories FPR of a single gesture sample and multiple samples
requires evaluating the fuzzy predicate, which in turn is from the same gesture. The results gathered from theseTouch and You’re Trapp(ck)ed: Quantifying the Uniqueness of Touch Gestures for Tracking 131
Table 4. Relative Mutual Information for a varying set of features. Green cells with * indicate highest relative mutual information for a
gesture sample and a set of gesture samples. Blue highlighted rows indicate our final selection of features.
# of Rel. Mutual Information of Gesture # of Rel. Mutual Information of
Gesture
Features Gesture Sample Set of Gesture Samples Features Gesture Sample Set of Gesture Samples
Swipe 15 43.23% 40.09% Left Swipe 15 47.71% 52.89%
(Expected 20 45.53% 41.91% (Expected 20 50.59% 55.59%
IS: 6.32 bits) 25 46.09% 45.40% IS: 5.97 bits) 25 50.71% 56.85%
30 48.18% 45.60% 30 52.38% 60.03%
50 57.79% 63.39% 50 53.96% 68.66%
75 61.39% 75.34% 75 57.96% 70.62%
100 61.87% 83.28% 100 59.82% 71.11%
150 62.88% 88.50% 150 62.64% 71.55%
200 63.13% 91.23% 200 65.52% 74.23%
229 64.10% 92.01%* 229 65.77% 74.68%
Up Swipe 15 45.93% 43.30% Right Swipe 15 48.29% 53.71%
(Expected 20 48.05% 46.39% (Expected 20 50.03% 54.14%
IS: 6.28 bits) 25 48.26% 46.59% IS:6.02 bits) 25 50.44% 56.00%
30 48.56% 47.43% 30 51.24% 56.19%
50 49.02% 50.23% 50 52.27% 57.48%
75 55.09% 63.81% 75 55.59% 62.62%
100 58.68% 68.79% 100 56.58% 65.35%
150 58.74% 69.22% 150 57.11% 65.88%
200 61.53% 71.94% 200 59.88% 67.48%
229 61.68% 73.11% 229 60.12% 67.65%
Down Swipe 15 48.46% 46.85% Handwriting 15 47.06% 52.24%
(Expected 20 51.44% 49.89% (Expected 20 49.35% 52.78%
IS: 6.14 bits) 25 51.53% 51.17% IS:5.16 bits) 25 52.93% 55.94%
30 51.60% 51.43% 30 55.57% 58.99%
50 52.22% 54.58% 50 68.71% 73.72%
75 58.33% 67.51% 75 72.09% 77.19%
100 60.55% 70.05% 100 74.75% 79.34%
150 62.33% 71.35% 150 78.08% 83.47%
200 65.25% 75.59% 200 78.16% 85.36%
229 65.51% 77.52% 241 79.49%* 85.93%
Keystroke 1 23.92% 17.83% Tap 1 24.80% 15.17%
(Expected 2 26.29% 20.00% Expected 2 26.25% 25.23%
IS:5.61 bits) 3 26.62% 29.97% IS:6.47 bits) 3 27.85% 26.94%
4 26.86% 30.49% 4 28.75% 33.25%
5 26.86% 30.49% 5 29.48% 34.25%
6 27.25% 36.70% 6 29.55% 34.44%
7 27.34% 37.63% 7 29.58% 34.73%
8 28.76% 41.02%
approaches were similar to 20-80 approach. We are thus mation about a user, followed by 20-percentile of area in
mentioning results from 20-80 approach only. down swipe 55.50%. Similarly, 50-percentile of pressure
yields 46.13% of information from down swipe. Among
features which are shared among all gestures,start area
4.4 Uniqueness of Individual Features contains 52.5% of information, followed by start pres-
sure yielding 45.4% of information. On the other ex-
Before assessing the uniqueness of features we binned treme, inter-stroke time for a keystroke reveals min-
any continuous features or features with a large domain. imum amount of user information, i.e,. 7%. We ob-
See Appendix A.2 for details. To assess the unique- serve no trend (in terms of dependency) among fea-
ness of features, we again divided our dataset using tures,except that relative information decreases in de-
the aforementioned 80-20 partition. Then, we exhaus- cending order of the features. We also computed the
tively computed the relative mutual information defined cumulative distribution function (CDF) of the relative
in Eq. 4 as a measure of uniqueness for each feature mutual information through Eq. 2 for a given feature.
value in the testing sets of all users. We found that 80- We present the CDF of top five features of every ges-
percentile of area in left swipe reveals 56.10% of infor- ture in figure 1. It is evident that features correspondingTouch and You’re Trapp(ck)ed: Quantifying the Uniqueness of Touch Gestures for Tracking 132
Table 5. TPR and FPR of Gesture for a varying number of features. Green cells with * indicate highest TPR and low FPR for a gesture
sample and a set of gesture samples. Blue highlighted rows indicates our final selection of features.
# of Gesture Sample Set of Gesture Samples Gesture # of Gesture Sample Set of Gesture Samples
Gesture
Features TPR FPR TPR FPR Features TPR FPR TPR FPR
Swipe 15 0.67 0.15 0.92 0.20 Left Swipe 15 0.55 0.07 0.91 0.14
20 0.67 0.14 0.94 0.20 20 0.53 0.07 0.90 0.12
25 0.62 0.11 0.94 0.17 25 0.51 0.06 0.86 0.12
30 0.57 0.11 0.92 0.16 30 0.46 0.04 0.86 0.11
50 0.23 0.02 0.89 0.07 50 0.34 0.02 0.83 0.07
75 0.14 0.009 0.89 0.03 75 0.33 0.02 0.81 0.07
100 0.11 0.007 0.89 0.02 100 0.31 0.02 0.77 0.07
150 0.10 0.007 0.84 0.01 150 0.30 0.02 0.78 0.07
200 0.10 0.007 0.76 0.009 200 0.29 0.02 0.77 0.06
229 0.10 0.006* 0.76 0.009* 229 0.29 0.02 0.75 0.06
Up Swipe 15 0.56 0.10 0.89 0.16 Right Swipe 15 0.55 0.08 0.93 0.13
20 0.54 0.10 0.89 0.14 20 0.54 0.06 0.88 0.12
25 0.52 0.09 0.88 0.14 25 0.53 0.06 0.86 0.12
30 0.52 0.09 0.88 0.14 30 0.51 0.06 0.86 0.11
50 0.51 0.08 0.85 0.13 50 0.51 0.05 0.85 0.10
75 0.40 0.05 0.82 0.07 75 0.41 0.03 0.85 0.09
100 0.37 0.05 0.79 0.05 100 0.41 0.03 0.85 0.08
150 0.37 0.04 0.79 0.05 150 0.41 0.03 0.85 0.08
200 0.35 0.04 0.77 0.05 200 0.39 0.03 0.83 0.08
229 0.34 0.04 0.74 0.04 229 0.39* 0.03 0.83 0.08
Down Swipe 15 0.57 0.11 0.92 0.17 Handwriting 15 0.67 0.11 0.97 0.16
20 0.53 0.09 0.90 0.14 20 0.64 0.10 0.94 0.16
25 0.53 0.08 0.88 0.14 25 0.47 0.05 0.92 0.14
30 0.53 0.08 0.87 0.14 30 0.47 0.04 0.89 0.13
50 0.49 0.08 0.85 0.12 50 0.29 0.01 0.88 0.06
75 0.40 0.04 0.85 0.07 75 0.24 0.01 0.82 0.05
100 0.38 0.04 0.84 0.06 100 0.21 0.009 0.79 0.05
150 0.34 0.03 0.84 0.05 150 0.15 0.006* 0.73 0.04
200 0.32 0.03 0.82 0.04 200 0.14 0.006* 0.64 0.03
229 0.32 0.03 0.77 0.04 241 0.13 0.006* 0.61 0.03
Keystroke 1 0.46 0.23 0.96 0.43 Tap 1 0.54 0.26 0.95 0.37
2 0.44 0.21 0.96 0.40 2 0.53 0.22 0.94 0.35
3 0.43 0.18 0.95 0.37 3 0.53 0.21 0.94 0.34
4 0.41 0.17 0.93 0.36 4 0.32 0.10 0.85 0.27
5 0.40 0.17 0.93 0.36 5 0.31 0.10 0.85 0.27
6 0.22 0.09 0.83 0.32 6 0.31 0.10 0.85 0.26
7 0.22 0.09 0.83 0.32 7 0.31 0.10 0.85 0.26
8 0.18 0.08 0.79 0.27
to different statistics of area and pressure, e.g., average, Table 6. Thresholds of the cosine similarity metric for a gesture
percentiles etc., reveal the most information about a sample. τ = Threshold, EER = Equal Error Rate.
user, i.e., more than 40% of information for half of the
Gesture τ EER Gesture τ EER
users in our database. As before, we notice that all types
Swipe 0.38 22% Up Swipe 0.55 27%
of swipes and handwriting reveal the most information
Down Swipe 0.52 28% Left Swipe 0.48 22%
about users, and taps and keystrokes have relatively less Right Swipe 0.58 22% Handwriting 0.40 19%
information leakage about users. Tap 0.29 35% Keystroke 0.13 39%
4.5 Uniqueness of a Gesture Sample
the set of features, and hence fixed the feature space,
Recall from Section 3.3.2 that for gesture sample, we we need to find the threshold τ of the cosine similarity
need to calculate the fuzzy predicate using the cosine metric that balances uniqueness of gesture samples and
similarity metric (cf. Section 3.4). Once we have fixed correctly (and uniquely) identifying a returning user. ToTouch and You’re Trapp(ck)ed: Quantifying the Uniqueness of Touch Gestures for Tracking 133
1.0 1.0 1.0 1.0
0.8 0.8 0.8 0.8 80-PCTL
Stop Area End Point of Raw Area
0.6 End Point of
Raw Area
0.6 Raw Area
Stop Area
0.6 20-PCTL
Raw Area 0.6 Average of
Raw Area
80-PCTL 80-PCTL Raw Average Area 50-PCTL
0.4 Raw Area 0.4 Pressure 0.4 End Point of 0.4 Raw Area
20-PCTL Mid-Stroke Raw Area Mid-Stroke
0.2 Raw Area 0.2 Pressure 0.2 Stop Area 0.2 Area
Average of 50-PCTL Raw 50-PCTL End Point of
Raw Area Pressure Raw Area Raw Area
0.00% 20% 40% 60% 80% 100% 0.00% 20% 40% 60% 80% 100% 0.00% 20% 40% 60% 80% 100% 0.00% 20% 40% 60% 80% 100%
(a) Swipes (b) Up Swipe (c) Down Swipe (d) Left Swipe
1.0 1.0 1.0 1.0
0.8 80-PCTL 0.8 0.8 0.8 80-PCTL Raw
Raw Area Pressure
0.6 Average of
Raw Area
0.6 0.6 0.6 Average
Pressure
50-PCTL Start Pressure Start Pressure 50-PCTL Raw
0.4 Raw Area 0.4 Start Area 0.4 Start Area 0.4 Pressure
Mid-Stroke Start Y Start Y Mid-Stroke
0.2 Area 0.2 Start X 0.2 Mid-Stroke Finger 0.2 Pressure
Start Point of Mid-Stroke Finger Orientation 20-PCTL Raw
Raw Area Orientation Start X Pressure
0.00% 20% 40% 60% 80% 100% 0.00% 20% 40% 60% 80% 100% 0.00% 20% 40% 60% 80% 100% 0.00% 20% 40% 60% 80% 100%
(e) Right Swipe (f) Tap (g) Keystroke (h) Handwriting
Fig. 1. Cumulative Distribution Function (CDF) of Features. Y-axes represents fraction of the participant population and X-axes are
Relative Mutual Information in percentage. The graph shows that Swipe, Left and Down Swipe reveals more than 50% of information
for half of the population, respectively.
do this, we once again split the data into an 80-20 par- and swipes carry highly identifiable information about
tition, and then evaluated the equal error rate (EER) users.
(i.e., the rate at which 1 − TPR equals FPR) by varying
the threshold. Table 6 shows the threshold that gave the 1.00
lowest EER against each gesture. We can see that our 0.75
methodology correctly re-identifies a returning user up
CDF
0.50
to 81% (19% EER) of the time if given a handwriting
sample. The worst performance is a TPR of 61% (39% 0.25
EER) when a sample of keystroke is provided. The ROC 0.000% 20% 40% 60% 80% 100%
of a gesture sample for all gesture types is given in Ap- Relative Mutual Information
Fig. 2. CDF of a Gesture Sample. Relative Information of
pendix A.5. Respective Categories are: -●- Swipe: 57.7%, -9- Up Swipe:
After fixing the threshold, we computed the unique- 48.5%, -◾- Down Swipe: 52.2%, -+- Left Swipe: 53.9%, -⋆- Right
ness through our relative mutual information metric, Swipe: 53.3%, -◆- Tap: 29.5%, -▴- Keystroke: 26.2%, -×-
i.e., Eq. 3. The results showed that a handwriting sam- Handwriting: 68.7%
ple reveals the highest amount of information (68.71%),
followed by swipes (57.77%). The four types of swipes,
i.e., left, up, down, and right swipes, yield 53.9%, 52.2%,
52.2%, and 48.5% of information, respectively. However,
4.6 Uniqueness of a Set of Gesture
taps and keystroke reveal only 29.5% and 26.2% of infor-
mation, respectively. Figure 2 shows the CDF of a ges- Samples
ture sample calculated for each of the gesture (through
We now consider the amount of information revealed by
the relative mutual information metric of Eq. 2). We
multiple samples of each gesture. We computed a dif-
observe a considerable difference in the range of infor-
ferent threshold of the cosine similarity metric for this
mation revealed by different gestures, with handwriting
category, and chose the one which resulted in the best
exposing more than 60% of information for half of the
EER. Table 7 shows the threshold and the correspond-
users in the database. Following this, the swipes also
ing EER values. Comparing this table to Table 6, we
show high uniqueness, revealing 30% to 65% of informa-
see that the rate of re-identifying a returning user is
tion about 75% of users. This suggests that handwriting
higher reaching up to 91% (9% EER) for handwriting.
This means that combining a few samples of the sameTouch and You’re Trapp(ck)ed: Quantifying the Uniqueness of Touch Gestures for Tracking 134
gesture may allow for more accurate tracking. The ROC veal a maximum of 98.89% of information about users,
of a set of gesture samples for all gesture types are given followed by the combination of swipes, handwriting &
in Appendix A.5. keystrokes that yield 98.5% of information. In contrast,
the combination of taps and keystroke reveals minimum
Table 7. Thresholds of the cosine similarity metric for a set of information, i.e., 33.5%. We would like to emphasise
gesture samples. τ = Threshold, EER = Equal Error Rate. here that information revealed by the combination of
various gestures is dependent on the number of users
Gesture τ EER Gesture τ EER who had performed all gestures in the combination. This
Swipe 0.75 10% Up Swipe 0.77 16% number was different for different gesture combinations.
Down Swipe 0.78 14% Left Swipe 0.75 12% For example, the total number of users who performed
Right Swipe 0.77 12% Handwriting 0.76 09%
taps was 89, whereas only 49 users submitted keystroke
Tap 0.85 20% Keystroke 0.85 23%
samples (cf. Table 2). Furthermore, the total number
of users who had performed both taps and keystrokes
were 45. This is one reason for our choice of the rela-
Based on the threshold values obtained, we then tive mutual information metric (as opposed to simple
apply the cosine similarity metric on the dataset and mutual information) which “normalises” the mutual in-
calculate relative mutual information through Eq. 4. formation.
Once again handwriting reveals 73.7% of information, Relative Mutual Information 100%
followed by left swipe which yields 68.6% of information
80%
of user gestures. In accordance with previous results,
taps and keystrokes reveal minimum amount of informa- 60%
tion about users, i.e., 34.71% and 41.0%, respectively. 40%
Looking at the CDF of relative mutual information in 20%
Figure 3, we can observe that swipes, its subtypes, and 0%
handwriting consistently perform better in revealing in-
Sw s, Ke HW
y es
Ta HW
T W*
ipe s
ipe W
Ke HW
ipe ps
Ta HW
s
Ta Keys
Sw Key
ey
Sw & H
ur
Sw & Ta
H
&K
Ta aps &
&
s&
&
est
ipe s &
&
s&
formation than taps and keystrokes. As discussed ear-
ipe ys
ps
ys
G
s
ps
ps
Ke
All
s,
lier, the less information from keystrokes and taps can
s,
s,
p
ipe
Sw
Sw
be due to the less number of features identified for these *HW - Handwriting Gesture Combinations
gestures. Fig. 4. Uniqueness of Combination of Gestures
1.00
We also tested these gesture combinations in terms
0.75 of re-identifying returning users. The thresholds for the
CDF
0.50 cosine similarity metric for each gesture were as reported
0.25 in the previous section (Table 7). Figure 5 shows the
0.000% 20% 40% 60% 80% 100%
TPR and FPR of the different combinations of gestures.
Relative Mutual Information Since the threshold for the cosine similarity metric for
Fig. 3. CDF of Set of Gesture Samples. Relative Information of each gesture was already set, the figure does not report
Respective Categories are: -●- Swipes: 63.3%, -9- Up Swipes:
EER as TPR and FPR are not balanced. For this reason,
50.23%, -◾- Down Swipes: 54.5%, -+- Left Swipes: 68.6%, -⋆-
Right Swipes: 57.4%, -◆- Taps: 34.7%, -▴- Keystrokes: 41.0%, -×- we also show the true negative and false negative rates.
Handwriting: 73.7% We see that as we increase the number of gestures in
our combination, the FPR drastically decreases, but so
does the TPR. For instance, all gestures together yield
4.7 Uniqueness of Gesture Categories 0.99% FPR but also a low TPR (just above 40%). The
Combination lowest FPR was recorded by the combination of swipes,
handwriting and keystrokes (0.85%). The main reason
Next we consider multiple gestures in different com- for a big drop in TPR as compared to the rate of sin-
binations and measure their uniqueness through our gle gestures, is mainly due to the rather strict metric of
methodology outlined in Section 3.3.4. Figure 4 shows only labelling a given combination as being from a user
the quantification results for different gesture combina- if the predicate for each gesture evaluates to 1 (cf. Sec-
tions. We found that a combination of all gestures re-Touch and You’re Trapp(ck)ed: Quantifying the Uniqueness of Touch Gestures for Tracking 135
True Positives True Negatives metric for an authentication system that evaluates
False Negatives False Positives
1.0 the system’s ability to correctly identify users. How-
0.9 ever, in case of tracking, a near 100% TPR is less
0.8
0.7 critical, e.g., it may be acceptable for an advertising
0.6
Scores
0.5 company to correctly track 90% of users and display
0.4 related ads, whilst showing unrelated ads to 10%.
0.3
0.2 This is indeed the case with our scheme, where 9%
0.1
0.0 of users will be incorrectly classified (receive irrel-
ipe ps
Sw Ke HW
All HW
ipe ys
ps *
Ta eys
Sw Taps HW
Sw , Tap eys
K HW
, K HW
res
evant ads). Still, our methodology would correctly
Ta HW
Sw & Ke
Sw & Ta
stu
&K
K
&
ipe s &
s&
&
ps &
s&
ipe &
Ge
ps
ipe ys
Ta eys
classify 91% of the users to display relevant ads.
ey
s
s
ipe
Sw
s,
s
s,
*HW - Handwriting In future, we plan to expand the framework to im-
Gesture Combinations prove the classification results, and hence minimise
Fig. 5. TPR and FPR for a Combination of Gestures the FPR.
5. Our data collection procedure did not impose any
tion 3.3.3). This can be changed by using, for instance, condition on how users needed to interact with their
a majority rule. smartphones such as sitting, standing, and walk-
We also investigate the impact of different users us- ing postures. Our results are still able to show high
ing the same device however, due to space limitation we uniqueness and accurate re-identification of return-
present our results in appendix A.4. ing users.
Touch-based Tracking vs. Continuous/Implicit
5 Discussion Authentication:
The reader might confuse the notion of touch-based
Our results reveal some important findings which we tracking with touch-based continuous or implicit au-
enlist below. thentication. Even though the main goal of this paper is
1. Multiple samples of a gesture taken together reveal to quantify the amount of information carried by touch
more accurate information about a user than a sin- gestures and hence to evaluate the tracking capabilities
gle sample of a gesture. This means that tracking using touch based features, in the following we would
based on collecting larger number of user samples is like to clarify some major differences between the two
likely to be more accurate. Having said that a single notions. Conceptually, the goal of authentication is to
gesture sample or a single feature of a gesture also verify a claimed identity which assumes prior knowl-
reveal enough information (upto 68% and 56%, re- edge of the identity. The aim of touch-based tracking
spectively) so as significantly narrow down the set is to track users with or without the knowledge of any
of possible users for tracking. disclosed identity. Here we highlight further technical
2. Swipes and handwriting carry more information as differences.
compared to taps and keystrokes. This is largely due 1. A typical continuous authentication scheme involves
to the rich set of information that can be derived as a classifier which is trained on the data of a tar-
features from swipes and handwriting. In contrast, get user.5 This training data is gathered during a
taps and keystrokes are simpler gestures from which preceding registration phase. The classifier knows
only a few characteristic features can be derived. which training model to target for classification
3. Features based on the area and pressure of the fin- given a claimed identity. Touch-based tracking on
ger performing the gesture are the most informative. the other hand is supposed to function without
This shows that there is significant inter-user vari- knowing the identity of the current user. This im-
ation in the area covered and the pressured exerted plies no registration phase and therefore the absence
on the screen. of training models for target users. Thus, classifica-
4. Overall, we show that tracking using touch gestures
is highly feasible and accurate. This is demonstrated
by the fact that we can correctly identify a return-
ing user with a true positive rate of up to 91% with 5 Or a set of users using the same device, in which case each
the handwriting samples. Though, TPR is a critical user has a separate training model. See for instance [37].You can also read