Lessons learned through project Älypysäkki (Smart TrafficHub)
←
→
Page content transcription
If your browser does not render page correctly, please read the page content below
Lessons learned through project Älypysäkki (Smart TrafficHub)
This document summarises the phases of Älypysäkki -project (Smart
TrafficHub, 2.3.2020 - 16.4.2021) funded by Council of Tampere Region with
European Regional Development Fund

The project was organised from Tampere University if close cooperation
with Tampere University of Applied Sciences and Business Tampere. This
report was written in cooperation with all stakeholders.

Tampere University Riku Viri
			Rodrigo Borges
			Jyrki Nummenmaa
			Kostas Stefanidis

Tampere University Jukka Pellinen
of Applied Sciences Jari Ruokolainen
			Ossi Nykänen

Business Tampere Markku Niemi
			Minna Kinnunen
			Jari Ikonen

Cover image by Jonne Renvall, Tampere University
Contents
1.         Background........................................................................................................................................... 1
1.1.       Present state.................................................................................................................................................................................. 1
1.2.       Stakeholders.................................................................................................................................................................................. 3
1.3.       Lessons learned from current concepts............................................................................................................................ 3
2.         Current data availability..................................................................................................................... 4
3.         Data based traffic forecasting test.................................................................................................. 8
4.         Concept co-development................................................................................................................10
4.1.       Stakeholder events....................................................................................................................................................................10
4.2.       Initial development....................................................................................................................................................................11
4.3.       The concept ................................................................................................................................................................................13
4.4.       Models and technologies.......................................................................................................................................................14
5.         Next steps to pilots...........................................................................................................................16
5.1.       Capacity information................................................................................................................................................................16
5.2.       Routing & guidance..................................................................................................................................................................17
5.3.       Stakeholder dashboards.........................................................................................................................................................19
6.         Conclusion and future topics.........................................................................................................21
           Appendix A: Workshops...................................................................................................................23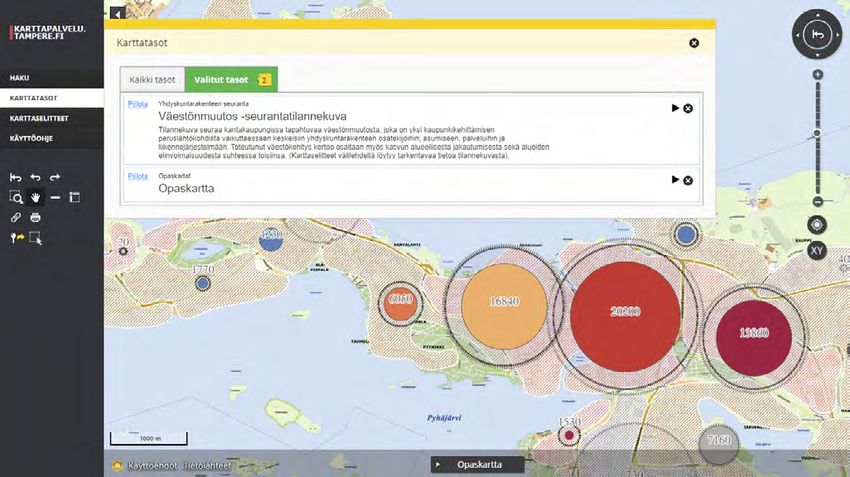
1.      Background
At first, the identified present state regarding smart
traffic hubs are discussed. In addition to present state,
this chapter depicts the different stakeholders and
other existing concepts of the topic.

1.1.    Present state

A smart traffic stop is a place where people start or
end their journeys, switch (public or private) transports,
pay for trips and other services, wait, and while at it,
access information about the journey and the nearby                        Figure 1 > Existing smart traffic stop in Paris, image
services. In Finland, simple traffic stops intuitively                     from Smart Cities Dive3
follow categorizations, ranging from terminal nodes
and busy stops, to unused traffic stops, and offer
various kinds of (informative) basic passenger
services1. Indeed, in general, a traffic stop might be
generalized into a traffic hub, a point integrating many
related services and access points, and located in a
central position in a city.

At a European level, local traffic services are part of a
larger network services and social needs. In the bigger
picture, the main challenges for the transport sector in
the EU include creating a well-functioning Single
European Transport Area, connecting Europe with                            Figure 2 > Existing smart traffic stop in Monaco,
modern, multi-modal and safe transport infrastructure                      Europe, image from Extended Monaco4
networks, and shifting towards low emission mobility,
which also involves reducing other negative externali-
ties of transport. From a social perspective, afforda-
bility, reliability and accessibility of transport are key.
However, this has not been achieved across the board.
Addressing these challenges will help pursue sustain-
able growth in the EU2.

                                                                           Figure 3 > An existing smart bus stop in Jurong East,
                                                                           Singapore, image from Japheth Lim5

                                                                           Smart traffic stops have been extensively studied in
                                                                           the past. In brief, the existing examples provide infor-
                                                                           mation and services related to buying tickets, renting
                                                                           bikes or ordering taxis, and charging smart phones.
                                                                           More advanced bus stops might aim better integration
                                                                           with the neighborhood and enjoying ones’ stay at the
                                                                           stop (buy a meal, listen to music, loan a book, acoustic
                                                                           design, etc.); see Figure 1, Figure 2 and Figure 3.

1       Airaksinen, S., Lehto, A., Oikarinen, I., & Kataja, A. (2015). Joukkoliikenteen palvelutason määrittely, Liikenneviraston ohjeita 31/2015,
        Liikennevirasto, Helsinki; Weiste, H., Mantila, A., & Seila, M. (2014). Valtakunnallinen pysäkkiselvitys-pysäkkiverkot ja pysäkkien palvelu-
        taso. Liikenneviraston tutkimuksia ja selvityksiä: 43/2014
2       EC 2018; EC (2018). Transport in the European Union: Current Trends and Issues. Available online
3       What if bus stops were designed as if bus stops really mattered? at Smart Cities Dive
4       Smart bus shelters: a clever combination of infrastructure and digital technology at Extended Monaco
5       Jurong East Smart Bus Stop – Redefining Bus Stop and Community Space Making at Japheth Lim.com

                                                                                                                                                  1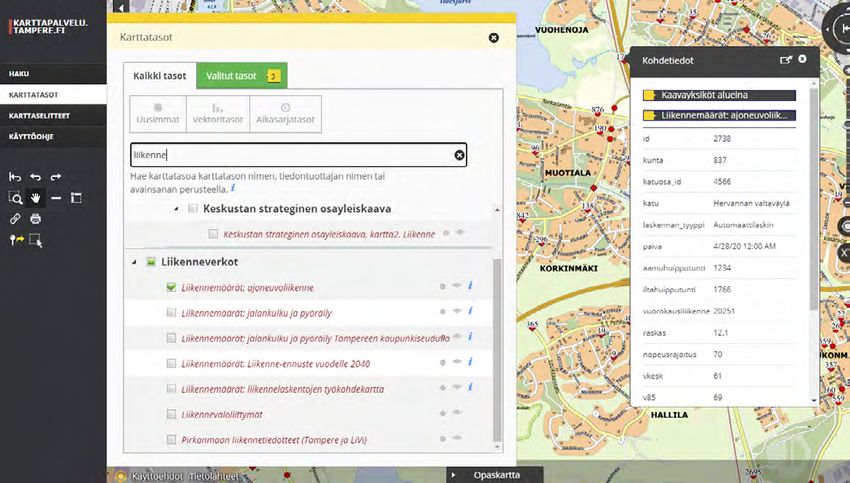
Further, at least conceptually, there is an increasing                      variables included age, profession, and home city.
trend in moving from traffic stops into social traffic                      Properties such as time of travel, alternative route,
hubs6.                                                                      gender, or education did not have a significant effect.

In the more abstract sense, this work might be seen as                      When additional transport data becomes available, it
a part of studying smart traffic in general, as seen e.g.                   also becomes possible to analyze large-scale
in Fiore et al. (2019)7.                                                    passenger behavior and make statistical predictions
                                                                            about traffic volumes and even individual passenger
When introducing mobile services into the picture,                          destinations9.
traffic stops and the related services may become
more virtual. Passenger information surveys indicate                        Ideally, bus transit boarding stop information using
that people seek traffic information from numerous                          smart card transaction data should be available10.
sources – notably at the traffic stops or from personal                     Unfortunately, this is not the case currently, e.g., in the
mobile devices. It is also possible to organize passen-                     Pirkanmaa region.
gers into meaningful groups or profiles, such as visitors
vs. locals, or young vs. elderly passengers, which then                     In general, it seems that traffic stop and traveling infor-
may indicate the main passenger behaviors and needs.                        mation design can have significant influence on
                                                                            passengers (by default people choose busiest line
                                                                            instead of the fastest line), but changes may take some
                                                                            time – for instance, in London, only 50% of the passen-
                                                                            gers have been reported to recognize new information
                                                                            screens after one year of operation. Transportation
                                                                            systems and the related information needs, however,
                                                                            are rather complicated, and a single stakeholder is
                                                                            typically unable to provide a uniform service to suit all
                                                                            the passenger needs.

Figure 4 > Use of different sources of passenger infor-
mation (URTPI means “Ubiquitous real-time passenger
information”); image from Md Faqhrul Islam et al.
(2020)8

It is important to note that de facto passenger informa-
tion sources are rather fragmented. Figure 4 above
depicts the use of different sources of passenger
information, as reported in the survey Md Faqhrul
Islam et al. (2020) considering Edinburgh area, UK8.

By analyzing passenger information, useful statistics
may be identified. According to Md Faqhrul Islam et al.
(2020)8, significant background variables indicating the
use of information services included length of the trip,
reason for travel, and familiarity of the trip. Considering
passengers themselves, meaningful background

6       c.f. Padrón Nápoles, V. M., Gachet Páez, D., Esteban Penelas, J. L., García Pérez, O., García Santacruz, M. J., & Martín de Pablos, F. (2020).
        Smart Bus Stops as Interconnected Public Spaces for Increasing Social Inclusiveness and Quality of Life of Elder Users. Smart Cities,
        3(2), 430-443; What if bus stops were designed as if bus stops really mattered? at Smart Cities Dive; Jurong East Smart Bus Stop –
        Redefining Bus Stop and Community Space Making at Japheth Lim.com
7       Ugo Fiore, Adrian Florea, and Gilberto Pérez Lechuga, 2019. An Interdisciplinary Review of Smart Vehicular Traffic and Its Applications
        and Challenges. Journal of Sensor and Actuator Networks, 8, 13; doi:10.3390/jsan8010013
8       Islam, M.F., Fonzone, A., MacIver, A., & Dickinson, K. (2020). Use of ubiquitous real-time bus passenger information. IET Intelligent
        Transport Systems, 2020-03, Vol.14 (3), 139-147.
9       Silva, Ricardo, Soong Moon Kang, and Edoardo M. Airoldi. 2015. “Predicting Traffic Volumes and Estimating the Effects of Shocks in
        Massive Transportation Systems.” Proceedings of the National Academy of Sciences 112 (18) (April 20): 5643–5648. doi:10.1073/
        pnas.1412908112.; Jaeyoung Jung, Keemin Sohn, 2017. Deep-learning architecture to forecast destinations of bus passengers from entry
        only smart-card data. ET Intelligent Transport Systems, ISSN 1751-956X, doi: 10.1049/iet-its.2016.0276
10      Zhen Chen, Wei Fan, 2018. Extracting bus transit boarding stop information using smart card transaction data. J. Mod. Transport. (2018)
        26(3):209–219, doi:10.1007/s40534-018-0165-y

                                                                                                                                                    2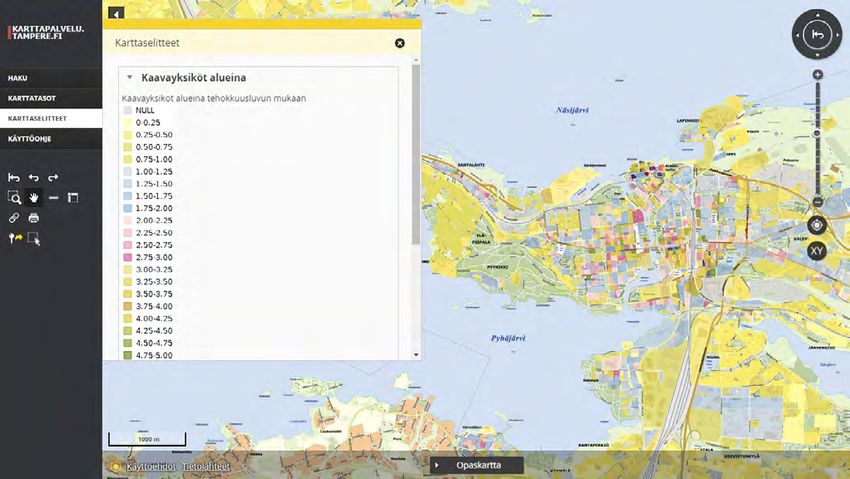
1.2.    Stakeholders                                                  without an explicit agreement of “ownership” of the
                                                                      various aspects or legs of a journey. This is notably the
When considering the context ITS services, the                        case when combining private and public services from
following stakeholders of may be identified (examples                 different operators or providers (including the travel-
of the Smart TrafficHub stakeholders in the Tampere                   lers’ own cars, bicycles, etc.).
sub region provided as an example):
                                                                      In the case of the Smart TraficHub project, the role of
1 > Main public ITS customer (city of Tampere);                       the traffic stop operators and new related services
2 > Main ITS service providers (tram and bus                          gets highlighted simply due to the focus area of the
    operators);                                                       project. In more general, the distinction between the
3 > Target (new) ITS service providers (traffic stop                  main, the target (new), and the auxiliary service
    operators with subcontractors);                                   providers is of course context dependent.
4 > Auxiliary service providers (coffee shops, taxi
    providers, and electric bike or scooter service                   1.3.     Lessons learned                   from       current
    companies);                                                                concepts
5 > End users (notably people using the main and
    the auxiliary services).                                          Due to its significance, the efforts for integrating smart
                                                                      transportation services have also been supported by
In a nutshell, the main public ITS customers decide the               the European Union. For instance, the project
public transportation system, eventually operated by                  “European Smart Mobility Resource Manager”11, or
bus companies and other service providers. Due to its                 MyWay for short, investigated, developed and validated
significancy, the transportation system not only directly             an integrated platform, the European Smart Mobility
serves the people living in the region as end users: The              Resource Manager, including cloud-based services
transportation system also interacts with the broader                 and facilities to support community supplied informa-
region development and city planning and may thus                     tion collection and processing.
indirectly influence peoples’ conceptions about certain
city regions, and hence have an impact on, e.g.,                      As a result, the MyWay project consortium identified
apartment pricing.                                                    the high-level conceptual architecture for MyWay and
                                                                      other services depicted in Figure 5. As such, the
Of course, from the end users’ point of view, the trans-              conceptual architecture is still valid today, and high-
portation landscape should ideally appear as a “single”               lights the generic need for orchestrated coordination
entity, intuitively fulfilling the need of journey planning           of different smart traffic activities – and a need for
and getting from one place to another, while benefit-                 common interfaces, shared infrastructure and high-
ting from various kinds of services along the way. From               level objectives, with aligned business models.
the city and the service providers perspective,
however, the big picture is more complicated, perhaps

Figure 5 > MyWay conceptual high-level architecture12

11      European Smart Mobility Resource Manager, 2013-2016, FP7-SMARTCITIES-2013
12      Fernández, J. & Bures, M. (2013) D2.1 Requirement specification and analysis of MyWay: European Smart Mobility Resource Manager

                                                                                                                                          3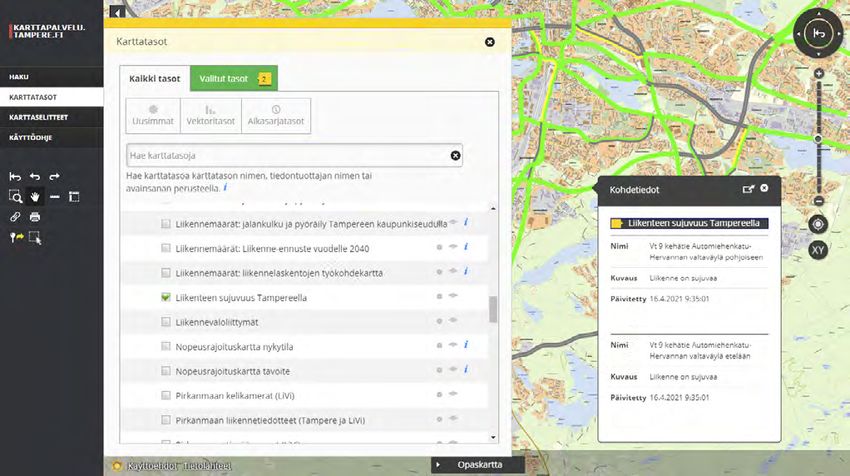
2. Current data availability
The city of Tampere and the nearby stakeholders
actively publish data and applications which can also
be exploited in ITS development13.
The data sources are organised in into the following
five categories related to the city of Tampere area:
Maps, activity data, position data, smart passenger
card data, and application data. Next, these will be
discussed each category in turn in the context of the
Smart TraficHub project. In order to provide mean-
ingful examples, first, the outline data sources from the
perspective of existing end user applications is
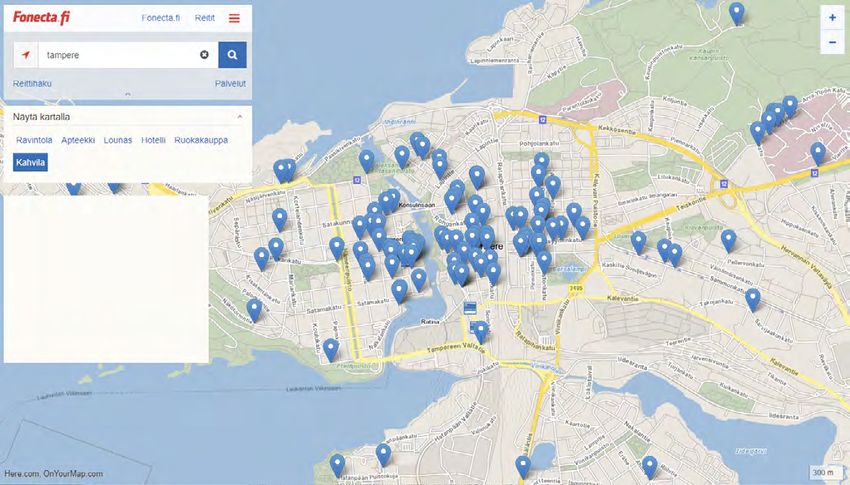
outlined. Figure 8 > Screenshot from commercial Fonecta.fi
service: Cafes on Tampere map
Maps
The maps category includes map resources with
several layers of information, including transportation
and other service information. Aerial photography map
views (etc.) are also available.
Figure 9 > Screenshot from commercial Google Maps
service: Cafes on Tampere map
The city of Tampere provides map browsing and anno-
tation service called Oskari, in accordance with the
INSPIRE directive (see Figure 6). Oskari service
provides access to a rich system of layered map infor-
Figure 6 > Screenshot from Tampere Oskari map mation. The service includes (all) public transportation,
service with some tramway stops highlighted speed limits, bicycle roads and bicycle parking areas,
administrative regions, schools, public healthcare and
sport services, and property and city planning infor-
mation, to name a few. Official city planning information
is also available, such as building efficiency ratios by
city block (see Figure 7). In practice, the map informa-
tion provided by the city of Tampere is very extensive,
and the essential content is available in machine-read-
able format at the city datasets portal13.
As suspected, the public information does not cover,
e.g., most services offered by private companies. Such
information may be available from commercial
Figure 7 > Screenshot from Tampere Oskari map providers, such as Google or Fonecta.fi. Figure 8 and
service with building efficiency ratios by city block Figure 9 illustrate the (incomplete) list of cafes in the
Tampere city center, as offered by Fonecta.fi and
Google Maps. Similar queries are available, e.g., for
grocery stores, (lunch) restaurants, etc.
13 For portal displaying open data from Tampere region, see data.tampere.fi
4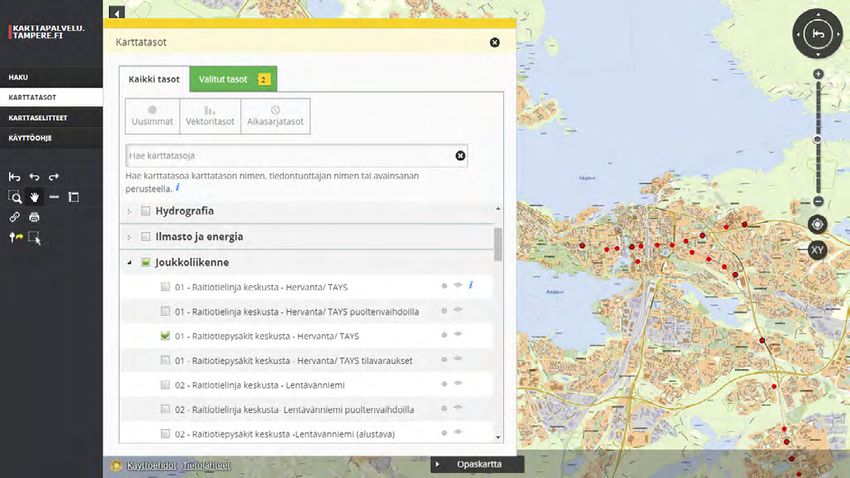
Activity data

The activity data category includes data, statistics, and
projections compiled from or for transport services.

Figure 10 > Screenshot from Tampere Oskari map              Figure 12 > Screenshot from tilannehuone.fi showing
service with vehicle volume data sensors and the            a traffic accident on Tampere Paasikiventie street
Hervannan valtaväylä street sensor (id 2738) selected       (information potentially updated in real-time)
(some data archived and not real-time)
                                                            There are also several additional activity information
                                                            sources, including traffic accidents, traffic jams, and
                                                            special incident reports. Figure 12 demonstrates an
                                                            example of a small, multiple collision accident informa-
                                                            tion at Tampere, as provided by commercial tilanne-
                                                            huone.fi.

Figure 11 > Screenshot from Tampere Oskari map
service with traffic indicator information and the Route
9, Tampere Ring Road motor highway selected (with
real-time slow traffic data)

The aforementioned Oskari service from the Tampere,
also provides activity and projection data. In the ITS
context, relevant information includes, e.g., vehicle,      Figure 13 > Screenshot from Tampere Oskari map
light traffic, and road construction information. Figure    service with demography projection, visualizing the
10 depicts location data of the various kinds of sensors    change of people living in certain city parts (change of
measuring road vehicle volumes. The data includes,          people vs. room for growth in terms of city planning)
e.g., numbers and types of vehicles, speed limit, and
average speed. Figure 11 depicts main road informa-         The city of Tampere also provides indirect, long-term
tion, associated with normal or slow traffic.               activity data in terms of projections. Figure 13 depicts
                                                            a visualisation of demography changes and planning
                                                            potential in different parts of the city. Such information
                                                            might be used in recognizing or planning city areas
                                                            where additional services are required in the future.
                                                            For instance, the visualization shows significant
                                                            increase in people living in the city center (large filled
                                                            circles with big numbers), and the fact that there is
                                                            little room left for additional growth (the outer circle
                                                            rims around each filled circle).

                                                                                                                    5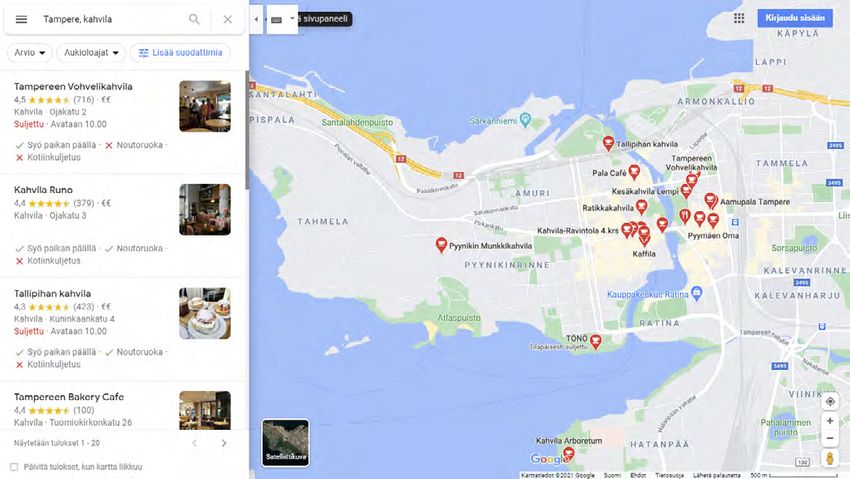
Position data                                                            Smart passenger card data

Some of the (public) transportation vehicles are                         An important special case of activity data is estab-
equipped with location sensors, and provide real-time                    lished by collecting by bus trip payment or smart
information about the positions14. The data consists of                  passenger card data. The city buses currently collect
every active bus separated by line number, vehicle and                   passenger hop-on information, but not hop-off infor-
direction and contains the latitude, longitude,                          mation. The daily passenger activity data is collected
timestamp and speed of the buses.                                        by each bus and uploaded overnight to the central
                                                                         data repository. Passenger data is not publicly
                                                                         available. By definition, however, smart card activity
                                                                         data would potentially enable tracking the entire
                                                                         journeys taken by passengers, and not just individual
                                                                         parts of a journey. In addition, buses may collect all
                                                                         sorts of other diagnostic data, including energy
                                                                         consumption, which is of special interest with respect
                                                                         to the new electronic bus(es).

Figure 14 > Screenshot from busse.fi showing real-
time Tampere city bus position information projected
on Tampere map

As an example, Figure 14 provides a visualization of
the real-time bus position information, as an aggrega-
tion service by Kimmo Brunfeldt, based on the public
data provided by the city of Tampere. In addition to bus
information, the city of Tampere also provides, e.g.,
position data of certain kinds of road maintenance
vehicles, such as snowplows.                                             Figure 16 > Screenshot from Tampere Reittiopas
                                                                         itinerary suggestions

                                                                         Application data. In some cases, data sources might
                                                                         be readily available to solve particular ITS application
                                                                         problems, notably journey planning (as an end-user
                                                                         application example, please see Figure 16 above).

                                                                         The city of Tampere offers access right to journey
                                                                         planner interface, when application or service supports
Figure 15 > Screenshot from public Sports Tracker                        public transportation usage and transportation infor-
information around Tampere                                               mation availability. Public Transport Journey Planner
                                                                         TRE API offers route, timetable and stop information
In addition to the publicly available information, other                 from Tampere Region15. At the time of writing, however,
position information might collected as well. For                        developer information was not accessible. A GTFS-feed
instance, taxi companies and emergency vehicles                          of public transport is also available, supporting devel-
include position sensors, but the related data is not by                 opment where machine readable timetable and route
default open to the public. Individual people may also                   data is needed16. The GTFS-feed itself also support
distribute their own data, e.g., related to sports activi-               some more static data that can support the develop-
ties, such as (cross-country) bicycling or orienteering;                 ment of routing, such as transfer connection abilities
see, e.g., Figure 15 with Sports Tracker information.                    withing two stops, wheelchair boarding abilities and
                                                                         fare classes and fare calculation17. However, not all
                                                                         supported data, such as the wheelchair access, are
                                                                         available in Tampere region within GTFS-feed.

14      Journeys API, information available at ITS Factory Wiki
15      Public transport journey planner API for the Tampere region available at data.tampere.fi
16      Tampere Public Transport GTFS feed, information available at ITS Factory Wiki
17      GTFS dataset reference available at Google Transit APIs

                                                                                                                               6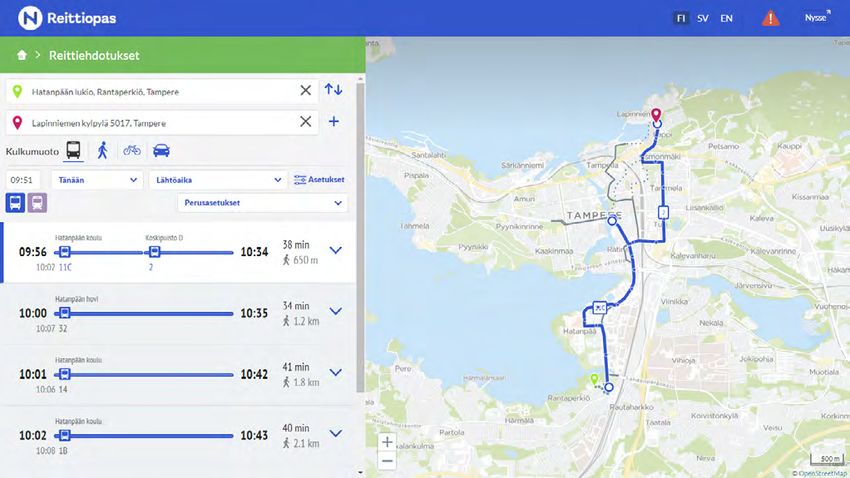
We will not consider this application further in this
article, but it is worth noticing that hybrid (AI) ITS appli-
cations might indeed directly access sophisticated ITS
services in their design. Thus, instead of only accessing
“raw” map, activity, and position and usage data, AI
applications might also have access to full-fledged
service components like journey planning.

Of course, having nice end-user applications (as
above) does not suffice for making actual data-driven
AI applications: In the abstract sense, the data needs
to be

1 > accessible (technical read access and permis-
    sive license);
2 > machine-readable;
3 > understandable (at least for the human
    developer but ideally machine-understandable,
    i.e., equipped with machine-readable metadata
    or semantic descriptions);
4 > reliable;
5 > properly scoped (coverage and resolution);
6 > up to date.

                                                                7
3. Data based traffic forecasting test
To test the hypothesis that buses’ activity presents The data was collected from Vehicle Activity, provided
patterns, both in space in time, and that if provided within the open public transport data14 in regular
with enough historical data, it would be possible to intervals of 1 minute, and this data was collected for
predict future traffic conditions, a prototype was imple- three consecutive days, resulting with 2,340,070 lines
mented. The prototype for predicting GPS coordinates of activity with values for date, time, line, vehicle,
of buses based on previous activities that can be direction, latitude, longitude, speed. These activities
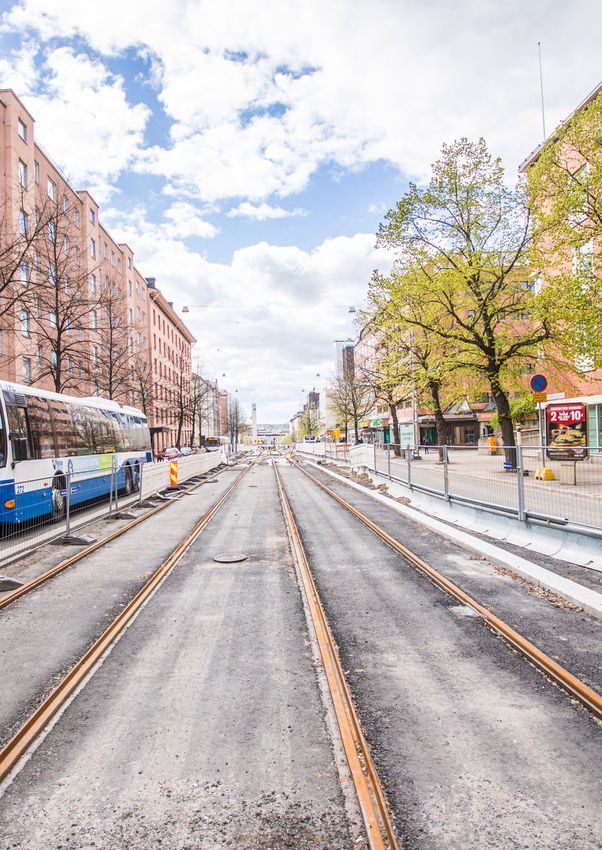
described in three main phases: (I) collected and were grouped in 5 minute intervals and one image in
pre-processed data from the publicly available API, (ii) which the colour of the points represents the speed
compiled data to build images containing the location registered for that specific point was produced. One
and speed of buses, and (iii) applying these images as image is generated for each 5 minutes as can be seen
the input for Spatiotemporal model based on on the top of Figure 17.
Convolution and Recurrent Neural Networks. Our
prototype18 was tested by predicting new images that Instead of considering the exact location of the GPS
were not used for training the model and it was coordinate (latitude and longitude), a regular grid was
detected that it can predict future traffic conditions. It defined, which was coloured each with the total speed
was also noticed that Neural Networks models require measure for its internal points. One example is
great amounts of data, and that if provided with more presented on the bottom side of Figure 17.
data, the model can improve the performance.
Figure 18 > Sequential grids are used as inputs in a
Spatiotemporal model capable of predicting future
traffic conditions, figure and method from Yu et al.
(2017)19
A model based on Convolution Neural Networks (CNN)
was then implemented. The methods are better
described in chapter 4.4. Normally it is used for the
computer vision domain for classifying images; and
Long Short-Term Memory (LSTM) usually applied in
temporal prediction tasks. The model is illustrated in
Figure 18 together with its bibliographic reference19.
The CNN is responsible for building a compact and
meaningful representation of the image presented as
Figure 17 > Data preparation phase: (Top) Tampere the input, and the LSTM is responsible for learning
map with GPS coordinates accumulated for 5 minutes temporal patterns in these representations. When
(bright colors indicate high speeds). (Bottom) the map trained together they can detect spatial and temporal
is divided in a regular grid, and the average speed is patterns in buses’ activities.
calculated for each square
18 The source code of the prototype is available from Rodrigo Borges’ GitHub repository
19 Yu, H., Wu, Z., Wang, S., Wang, Y., & Ma, X. (2017). Spatiotemporal recurrent convolutional networks for traffic prediction in transportation
networks. Sensors, 17(7), 1501
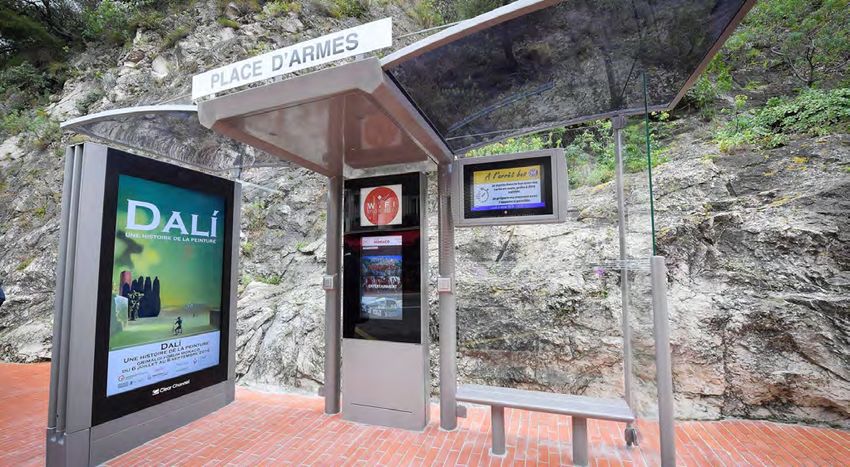
8measured for the time interval of 15 minutes. The
prediction results are expected to improve when more
data is applied for training the model.
INPUT
UT
FEATURES
COMBINED
CNN
FEATURE
+
CNN
+
CNN
Figure 21 > Combining several inputs into one single
Figure 19 > The average speed is predicted for each representation for increasing accuracy
region on the map for the next 5 minutes
One possible extension of the method includes
The model was trained with the data collected previ- combining several features in the input in order to
ously and instead of presenting the same grid structure increase the accuracy of the prediction task. As an
as the target for predictions, we decide for wider example, the same situation described previously can
squares, as the one in Figure 19. The idea is that a be imagined, but in addition to that also having an
higher resolution (smaller grid) is important for access to air pollution sensors and weather forecast. If
detecting nuances in the spatial patterns, but lower collected in the same format as the bus speed data
resolution (bigger grid) is more useful as target for (latitude, longitude), and in the same time interval, they
predictions. In the end, the model is trained with can be combined together in one feature, as in Figure
consecutive images of speed and location of buses 21. There is no limitation regarding the number of new
information, and after optimizations it is capable of inputs that can be combined, the only restriction refers
predicting the future average speed in each area in the to the fact that they must preserve the same format as
city. the first one describing bus speeds. The new inputs
are submitted to a similar CNN and the resulting
feature is learned by a new MLP network that will
1,2 5 layers (25min)
adjust its weights depending on the relevance of each
4 layers (20min)
1,1 input in the current prediction task.
3 layers (15min)
1,0 2 layers (10min)
1 layer (5min)
Error
0,9
0,8
0,7
0,6
0 2 4 6 8
Epochs
Figure 20 > The prediction error when considering
time intervals of 5, 10, 15, 20 and 25 minutes
To test the method, 80% of the activities were used to
train the model to predict the remaining 20% of values.
After several rounds of experiments with measured
error rate for different time intervals (5, 10, 15, 20 and
25 minutes) of activity combined in the images. These
errors measured are presented in Figure 20. As one
can see, some intervals provide more accurate predic-
tion than others, and the lowest error rates were
94. Concept co-development
In this section, the initial concept development of concepts were also discussed, such as food or
Smart TrafficHub is discussed. First, when specifying package delivery systems in stops or e-bike charging
the concept of the Smart TrafficHub, it is important to and transfer points.
note that the lessons learnt, e.g., already from the
MyWay project are directly applicable: Implementing The first steering group meeting was held after the
an intelligent transport system requires an active, workshop and they were presented with the summary
well-specified ecosystem of collaborating stake- and findings of the workshop for discussion. On the
holders, and when actually developing services, a discussion, it was noted that there have been pilots
technical roadmap and an architecture with well-docu- regarding the capacity information on buses, but
mented interfaces are eventually needed (c.f. Figure 5, nothing continuous. However, trams will be equipped
MyWay conceptual high-level architecture). with system that can provide the information. Based
on this, it was discussed whether available data, such
The development of the Smart TrafficHub project as smart card data could be used to build an AI-model
should thus be considered as a coordinated effort of to estimate the capacity where no direct measure-
adding a specific layer of knowledge from the ments are a possibility. Regarding stops, it was also
Pirkanmaa region to the bigger ITS picture, providing discussed whether sensors in co-operation of
insight on the particular needs and particular stake- AI-model could be used to track the status of different
holders w.r.t. to smart traffic stops and hubs in this stops to allow predictive maintenance.
region. Having said this, the underlying “hard” require-
ments remain similar from one region to another: Main points of the discussion in the 2nd workshop
Organizing a critical ecosystem of capable stake- hovered around several aspects, such as the responsi-
holders, aligning business objectives, agreeing which bility of the stakeholder to create an environment to
concrete smart services are provided to best serve establish long term services to businesses involved,
customers and the business needs, establishing the the different types of stops and how the services could
necessary technical infrastructure with open inter- differ, methods of providing information at stops to
faces and technical instructions, and providing opera- make it easy to use for everyone and how data is
tional base systems and applications for delivering, handled and error corrected, when needed. The
maintaining and continuously improving services. second steering group was held after the 2nd workshop
Therefore, the project consisted on workshops to gain and on the discussion it was noted that there are
stakeholder involvement from the design stage. The several other projects and also new interests that
stakeholder events are described on the next chapter, would be interested of the results and background of
followed by the summarized results of these events. the project, thus creating a strong need to not only
report the results but also the background studies and
4.1. Stakeholder events lessons learned.
The project hosted two workshops and two steering I addition to workshops and steering group meetings,
group meetings during the study phase to gather the within the project there has also been discussion with
demand of intelligent transport stop points and the other projects within the area that focus partly on
important aspects that should be further studied. The same aspects. Discussions between SmartRail-
focus points of the two workshops are described in project20 covered aspects on how different vulnerable
Appendix A: Workshops. This section describes to be excluded user groups should be notified as part
shortly the discussions, the actual outcomes of all of the guidance. The same aspects of easiness to use
conversations are presented in chapter 4.2. and understand the systems for users have also been
discussed with KITE-project21. Finally, also different
Main points of the conversation in 1st workshop were aspects of how both event and emergency guidance
related continuous guidance around the city, the could be included in Smart TrafficHub concept were
possibilities to measure or estimate the capacity of also discussed with SURE-project22.
buses and trams and whether stops could also serve
guidance in emergency needs. The stop operator’s
viewpoint was also discussed whether some services
could also create information of use of stops to support
operator’s business cases. Also, entirely new set of
20 SmartRail - Development and piloting of accessible public transportation services for user with special needs.
21 KITE - Human-Centered AI Solutions for the Smart City
22 SURE - Smart Urban Security and Event Resilience
10To support the dissemination of the project results, a and services should not disallow the stop to work as an
3rd workshop of the project aimed to briefly present the ad. However, different services hosted at stop could
results and allow conversation of new ideas and further also help the companies running the stops if it allows
project needs that could be discussed after the project, some data gathering or profiling of the users to allow
including the ones listed at the end of this report on better to target the displayed ads. However, for this
chapter 6. aspect GDPR and other rules relating personal data
use should be inspected and user consent would be
4.2. Initial development needed.
The initial concept is developed based on the conver- Passenger guidance
sations at both workshops, steering groups of the
project, the survey results and conversations with Large stops currently serve as a hubs for different
different projects and stakeholders having same types modes and lines of public transport. Since mobility
of themes. This chapter summarizes the different consists also from other modes transport, it would be
viewpoints of the conversation. important that all the guidance in stops should include
these other forms, such as e-scooters, city bikes, taxis
Table 1 > Summary of results from stakeholder events and other forms for true MaaS-support and the
guidance would work across these modes. Since
Area First steps Next steps
different screens and systems show guidance around
Organization Long term contracts Data is share among the city, it should be noted that the guiding in stops
and data to provide the stakeholders to
value for allow new innovation
should follow the same terms and visual identity as the
stakeholders other system to make it easier to understand.
Guidance Passenger guidance Personalised
available continu- guidance for user One aspect of the guidance systems are also different
ously to all transport needs and habits large events, such as concerts or sport matches that
modes can draw many tourists in the city. For different
Data use Open sources of data AI-based predictions guidance screens around the city, these events should
from different and error correction be made visible and in addition to regular timetables
sensors and data based on new and
providers already gathered and stop name information, it should be clearly marked,
date where the event is happening and how to get there.
Public Real-time information Network can adapt For example people arriving to train station can have
transport for users to better to the situation on-time information of which line to take to arrive to
use the network based on number of that location already at the station and the same type
passengers and
different events guidance throughout the trip could be given when
leaving the event as well. This could be also used to
Emergency Emergency use is Frameworks and
use noted and possible automation to allow vary the routes where people enter and exit the venue
to some extent fast reactions to to better control the people flow.
places where
needed
In addition to guidance around the city, different user
related aspects should be noted as well and the
Smart TrafficHub organization guidance should note if for example the user needs
ramps or seating to complete the journey and guide
One of the key enablers of the Smart TrafficHubs is them accordingly to both correct lines and directions.
their organization and how different agreements are This is crucial for making the different trip chains to
made. The contracts to provide the services should work for everyone and both the information and the
have longer timeframes to allow different companies stop spaces itself should support the easiness of line
to create new solutions and develop them with long and modal changes. One key aspect is to also inform
term on the stops. As data for different solutions can all the users regarding the interruptions within the
be both open or produced at the stop, long term network and how they affect the routing and
contracts are also important to allow other companies connections.
to develop solutions based on data provided by other
companies operating at the stop, thus allowing new
services to be created.
Funding of the stop constructions itself is an important
aspect as well. As the stops are majorly funded by
placed advertising, in general, these new solutions
11Data collection and use can also be used to estimate, whether the next bus
arriving the location can stop at the correct place and
There are already many open data sources and existing inform the passenger in advance on where to board.
frameworks that support the development of the
different services within the stop environment. Data can also be used as measuring and informing
However, there are still different new aspects of data user about modal choices and their effect. For example,
collection and use that would help generating new stops containing park and ride -services could share
services. information about the amount of parked cars not only
to inform its capacity but also to show the emissions
Stops are important parts of the journeys and their and modal share effects of these choices. Same modal
looks and feels affect directly on people waiting. choice emissions effect can be also informed as part
Different types of sensor could provide information of of guidance to indicate the effects of different transport
cleanliness and slipperiness of the stops to allow main- methods.
tenance at times when it is needed. In addition to
sensors, the different passenger involved apps and The data gathered would not only serve different users
short queries could also allow the actual users to of the stops by allowing use of better real-time informa-
report if maintenance is needed. Based on the sensor tion, but it could also allow different dashboards for
data and passenger reports, weather data and example to stop point maintenance and bus operators
forecasts could be used to create an AI solution to to allow them better track the status and plan the
estimate on what conditions for example anti-slip needed changes accordingly. The same data could
measures are needed to allow predictive also be later implemented as a part of digital twin and
maintenance. other solutions that provide real-time information to
support development and planning in general.
One main interest related to data needs is also the
ability to inform and predict the capacity status of For current public transport services, all the data could
incoming bus or tram. Currently, there is no solution be used to better develop and track the use of the
gather this type information but some pilots have tried services as well as to inform the passengers for a new
different data gathering methods. The information alternative routing based on the current status of
system of public transport would already allow this network. Fur future network having different autono-
type of information shared and the trams will include mous feeder systems, the information could also be
sensors to provide the capacity status in the future. used to allow real-time, AI-based decisions to be made
However, as the buses in the public transport system based on the current capacity and passenger informa-
do not have any technology to measure this, different tion. For example, on days with major evets, if a tram
solutions to allow their capacity tracking are seen line towards Hervanta has a larger than usual number
interesting as it would allow to track and inform user of passengers, more autonomous vehicles would be
on capacity status of the whole network. One possible deployed to carry all those passengers to their
solution to this in the future would be to use smart card destinations.
data to create an estimation model for given timeframe
and estimate the crowdedness based on previous Stops as part of network
data. This could be later enriched with data from the
stops, if some services gather for example beacon Stops are a key part of public transport. The main
based data of waiting times and number of people. aspect to note is the difference of these stops. They
serve different types of passengers, are some large
On more used and crowded stop points the buses stops are natural hubs (such as stops at city centre,
don’t necessarily have the space to stop at the specific major shopping malls or railway stations), some stops
location if other bus occupies the location directly are mostly used as only exit nodes of the network.
front of the stop. This may be challenging of the users There is also a difference on how the stops are
to know where the bus can be boarded and they may operated, as some of them are connected to electricity
wait at the wrong locations. The already available GPS and network, whereas others may only have a elec-
data form buses can be used to track down specific tricity connection to have a light, but nothing else. This
points where the buses tend to stop on a given area. affects on what can be provided in these.
This data in combination of GPS track of other lines
using the same stops would allow to better track and As already noted, the guidance within stops should
estimate the conditions of when the stops is usually follow the same guidelines in all different guiding
occupied by multiple buses and the locations differ to systems around the city. The same key concerns affect
note this in the guidance. Real-time data and AI-models the stop displays as well as any other displays; on
which extent the data can be show using icons and
12numbers that are not dependent of the language, what 4.3. The concept
languages are used when more information is show
and how the change of language can be made easy, The main concept of Smart TrafficHub can be summa-
even when the display at that point shows a language rized and described in information and interaction at
that is not familiar for the user. different parts of the journey; Planning, starting and
during the trip and approaching destination. One key
Also as not every stop should show the same informa- part of the concept is also the information that can be
tion, but information that is important to the connec- provided to other stakeholders. These parts and their
tions regarding that stop and services around that interactions with the data needs are presented below
area, it should also be noted that different user value at those different stages.
different information. One of the key questions
therefore is also how the information can be custom- Planning the journey
ised and those different users can be identified. Same
type of information could also served for user on A passenger wants to move from one location to
different screens, whether they are at stops, at buses, another using public transport as main transport
or at mobile. Many of users already use their mobile to mode. At first, the person should be given information
see this type of information and it also allows the easier of the different routes and modes that could be taken
personalisation of the information, but the same infor- towards the destination. This information should be
mation would also be provided on displays on stops for accessible on different devices, so the planning would
users without a suitable phone, dead battery or too take place for example on-the-go with a mobile phone,
cold weather to use a phone. The same information well in advance at home with computer or at a capable
from screen to mobile is also one key aspect to allow stop having interface to use the planner. The general
continuous guidance during the whole trip chain, information regarding the trip is already largely
which is seen important on all users, but especially of available, also noting different accessibility challenges.
the groups having special needs, like difficulties of However, a comprehensive system would also need to
hearing or seeing. include all 3rd party provided mobility systems as well,
thus allowing the passenger to book a e-scooter or taxi
It should be noted that people with limited eyesight for a last-mile solution in case that is the most suitable
typically struggle in 1) finding a proper stop, 2) stopping option.
the correct bus, and 3) getting out in a proper stop. The
first and third issues could be aided with virtual infor- In addition. the guidance should include the estimated
mation, but for the second, in addition to virtual infor- capacity forecast of the lines and segments the
mation, also existing physical bus markings should passenger is suggested to take. This could be also
also be improved. Different guidelines23 dictate the noted in the routing systems to guide people on less
targets of final design. congested lines when possible. With actual capacity
information and estimation, the information of both the
Stops could also serve as a location for entirely new availability and occupancy of special areas of the
developed services for the users, such as food or vehicles should be noted as well, such as available
package order collection points, to allow charging of wheelchair, bicycle, or trolley spaces. Another added
e-bikes, e-scooters or shuttle buses. The new network information would be event related guidance, allowing
would also allow new environment to run pilots that an event visitor to just select the event one’s attending
benefit from central data collection points and network to, to see the same rich information and alternatives on
having multiple mobility modes. how to go there, without any need to know the lines or
stops used through the journey.
Emergency aspects should be noted when developing
these new systems. In case of security cameras in the When the passenger is planning the route using the
stops, can AI be used to track and alert personnel if system on the stop itself, the passenger can also be
slipperiness or dangerous items are detected. Also, as asked some quick, optional questions regarding the
the stops host different screens to provide information status of the stop itself, such as the slipperiness of the
and ads, these screens should be included when stop floor or general cleanliness of the stop, which can
emergency guiding, or notices need to be given to the later be used to develop when and where maintenance
public. The screens and guidance can also help avoid should be focused.
emergency situations, as traffic can be guided before-
hand to avoid areas to get too congested.
23 Accessible Bus Stop Design Guidance by TfL and Guide to design accessible public transport by Finnish Federation of Visually Impaired
13Starting the journey The information collected from passengers on the
stops can be enriched with different sensor data and
When the passenger has information on what stop and AI-models to estimate and track the development of
route to take, the system can inform the passenger on different metrics. In addition to helping stop operators
the capacity of the arriving vehicle and in case all-door to focus maintenance where needed, it could also
boarding is possible, the information on what would be allow estimated proactive maintenance, when the
the best possible door to enter capacity-wise. When system, based on different sensors and forecasts,
multiple buses arrive the stop at the same time, the detects patterns that lead to slippery stop floor.
system can also inform the passenger if the correct
bus is arriving behind the first arriving bus, thus When capacity is collected and tracked, that informa-
informing the passenger that the bus should be tion can be used to better develop the network, as it
entered 15 meters to the guided direction. Also, when would allow better origin-destination tracking and
the system informs the passengers of arriving lines, therefore help decision making from the public
the information can also show, it the arriving bus transport designer viewpoint.
should be taken when going to a large event, thus
allowing the event visitor to board the bus only knowing At the same time, if the system knows how long people
the event one’s attending. wait generally at different stops and where they travel,
the information can also be used by the stop operator
During the journey to focus the advertising campaigns, thus creating a
better revenue from the system. It should however be
In case the journey requires a transfer, the passenger noted that while better tracking and identification of
is informed on what stop the transfer should be made passengers help to target the ads, the system should
and in case the connecting bus leaves from a different be build privacy-first and it should be thoroughly
platform, the system indicates the walking directions valuated on what information can be used for this
to that new stop. This information is given already purposes and what kind of consent to use would be
when the route is planned and in case a mobile system required.
is used, the same information also follows the
passenger during the trip. For larger events and main 4.4. Models and technologies
destinations, the same transfer information is also
given in the vehicle, when it approaches the stop. The In this section, the perspective of the system designer
transfer information also notes the capacity of the is considered, and potential data formats are described
upcoming vehicles as well as the accessibility chal- depending on the methods applied in the task. This
lenges the passenger may have. includes three categories of Deep Learning tech-
niques: Multi-Layer Perceptron (MLP), Convolutional
Approaching destination Neural Networks (CNN) and Recurrent Neural
Networks (RNN).
When the journey nears the destination stop, in the
vehicle is shown, how the large event or an important Multi-Layer Perceptron (MLP)
destination can be reached from that stop. The same
information can also be presented on mobile, enriched These were the first neural networks proposed in the
with information of last-mile solutions provided at the literature and have the simplest architecture possible24.
destination stop and how they can be used to reach MLPs consist of input, hidden and outputs layers, each
the destination. The system should also include infor- one of them constituted of units called perceptrons
mation on how to use them and with a payment (also referred to as neurons) as showed in Figure 22.
solution that can be combined in the public transport The number of hidden layers as well as the amount of
ticket from the viewpoint of the passenger. perceptrons per layer can vary depending on the
necessity and from layer to layer, perceptrons are all
Other stakeholders connected to each other. Non-linear activation
functions are usually applied between consecutive
During the operation, the system itself can collect and layers given them the power to approximate complex
analyse lot of information that can be used to help and non-linear functions if designed correctly. The
multiple stakeholders and should be provided via a training process is usually conducted with Gradient
personalised dashboards. Descent when each perceptron has its weights
adjusted according to the optimization cost function.
These networks are especially useful in situations
when the data available is composed of real numbers
24 Multilayer Perceptron at DeepAI
14and the task is to predict a categorical variable. As an
example, we can imagine the task of predicting the
average number of travels a passenger makes per
week (low, medium, high) when having demographic
characteristics (age, gender, nationality, etc.) in the
input.
Figure 23 > Convolutional Neural Networks (CNN)
classification architecture, figure from towards data
science26
Recurrent Neural Networks (RNN)
And finally, RNNs are networks designed for estimating
future events of a sequence, given its previous values.
The main difference here, if compared to standard
neural networks, is the RNN’s ability to store the
current state of each cell to be used in the following
Figure 22 > Multi-Layer Perceptron (MLP), figure from ones for detecting temporal patterns. In Figure 24 we
Tutorialspoint25 see the cell states indicated as h, inputs are indicated
as x and outputs as y. For each new value in the input
the RNN can inform the potential next element, as well
Convolutional Neural Networks (CNN) as its current state. The values of hidden states can
propagate through the next elements, as much as
CNNs are very popular artificial neural networks archi- necessary, depending on the phenomena under
tectures first proposed for classifying images in cate- analysis. These architectures are especially useful in
gories, as in the example of Figure 23, in which the situations when temporal patterns are observed, for
input picture is classified as containing cat or not. example for estimating the number of passengers
These can be applied not only to images but to any inside one vehicle given the occupation of this same
data that can be represented as such, and within which vehicle during the last 30 minutes.
there might exist spatial patterns that correlate with
the task in hand. Yet in the previous example, we can
think of cat nose or a tail as spatial patterns that be
detected and used during the identification process.
These networks share some features with the MLPs,
layers can be stacked as much as necessary and are
interleaved with non-linear activation function, but this
time internal layers are responsible for learning
convolving kernels that slide along the image and
pooling layers are applied for reducing their dimen-
sionality gradually. The training process is conducted
the same way as before. CNNs can be particularly
interesting, as mentioned before, when having
2-dimensional data in the input (as images are) and
with potential patterns that can be detected. In this Figure 24 > A Recurrent Neural Networks (RNN)
specific case, lets imagine an application where we typical architecture, figure from towards data science27
have maps of the city with any kind of events drawn on
the top of it according to geo coordinates, and the task
is to classify map images according to the level of
occurrence (low, medium, high) of traffic jams.
25 TensorFlow - Multi-Layer Perceptron Learning at Tutorialspoint
26 Convolutional Neural Network: A Step By Step Guide, by Shashikant at towards data science.
27 Recurrent Neural Networks, by Mahendran Venkatachalam at towards data science
155. Next steps to pilots
Based on the developed concept and prior research identifiers for users are needed to allow tracking within
on the subject, three different plans were created to different parts of the journey. In addition to the check-
describe how capacity information, routing & ins, static information about the fixed capacity of
guidance and stakeholder dashboards could be different bus types should be available as well as linked
piloted and what aspects should be covered. The to the real-time data, so it is possible to know what
results are divided between these three different type of vehicles are used in any of the routes.
cases. However, there are some internal links, where
outputs from other phases could be used in other In addition to data-based tracking, beacon collected
pilots as well. These are described within each topic. information and camera feeds could also serve as an
input for the calculation. This type of capacity predic-
5.1. Capacity information tion has also been done based on crowdsourced
information28.
How current capacity information could be tracked
and how the capacity could be estimated for future Methods
journeys?
Smart card data would allow an AI-model to estimate
Stakeholders the possible destinations for a data-based know origin
(validated check-in), based on the history of that unique
Main stakeholders that should be included consists of passenger and one’s other boarding locations and
public transport office and the provider(s) of informa- their timestamps. There are some studies available
tion systems that collect and share the data needed to that discuss the possibility of this and state that for at
collect capacity information. least peak time travel, the routes are trackable29. This
type of per person estimation would be possible with
In case of camera and beacon based collection of different multi-layer perceptron and recurrent neural
data, stop operators and public transport operators network systems. When capacity information would
would be important stakeholders as well as the sensor be acquired, recurrent neural network systems could
and system manufacturers. be used for time series prediction to estimate the
capacity for future journeys based on historical
For better estimation of the capacity, the stakeholders evidence. The actual model and its estimation can be
could also include different mobility related providers, enriched with the measured capacity information (for
such as long-haul buses and trains, parking facilities example provided by the tram) and some other data
and other stakeholders that could indicate amounts of layers that could include patterns to know if they are
visitors that could use public transport. differences in amount of visitors (such as event visitor
data) or any other location-based data source that
Available data could give indication on mobility needs. The system
would also develop itself, as more and more data is
Currently, no actual capacity data exist from the gained from smart card check-ins.
network in Tampere. The detailed smart card check-ins
are collected and hosted centrally, however due to In addition of the smart card data, camera feeds from
nature of the data, it is not open. When tram starts buses and public transport stops could also be used to
operating, it will have weight-sensors and vision based estimate the crowdedness based on computer vision
systems to estimate the current capacity and availa- and convolutional neural networks. A system by
bility of free space for wheelchairs and trolleys. Counterest30 has already been tested in a few buses in
Tampere during 2018-2019 regarding this topic.
New data needs
Main new data for building a capacity tracking and
estimation model would be the actual smart card
check-in data that would allow the pattern tracking.
The data itself can be anonymized, but some unique
28 Crowdsourced Transit predictions at Transit Partners Help, Google Support
29 Trépanier, M., Tranchant, N., & Chapleau, R. (2007). Individual trip destination estimation in a transit smart card automated fare collection
system. Journal of Intelligent Transportation Systems, 11(1), 1-14; Jánošíková, Ľ., Slavík, J., & Koháni, M. (2014). Estimation of a route choice
model for urban public transport using smart card data. Transportation planning and technology, 37(7), 638-648.
30 Counterest - Automatic people counter and customer analytics
16You can also read