Are Privacy Dashboards Good for End Users? Evaluating User Perceptions and Reactions to Google's My Activity - Mobile Security
←
→
Page content transcription
If your browser does not render page correctly, please read the page content below
Are Privacy Dashboards Good for End Users?
                 Evaluating User Perceptions and Reactions to Google’s My Activity

            Florian M. Farke†∗, David G. Balash§∗, Maximilian Golla‡ , Markus Dürmuth† , Adam J. Aviv§
        †    Ruhr University Bochum, § The George Washington University, ‡ Max Planck Institute for Security and Privacy

                                  Abstract                             We conducted an online survey with n = 153 participants
   Privacy dashboards and transparency tools help users re-         to explore how users’ concerns of and benefits from Google’s
view and manage the data collected about them online. Since         data collection are influenced by My Activity, as an exem-
2016, Google has offered such a tool, My Activity, which al-        plar privacy dashboard. Participants were first asked about
lows users to review and delete their activity data from Google     their concern regarding Google’s data collection and how
services. We conducted an online survey with n = 153 partic-        frequently they benefit from it, both on Likert scales and in
ipants to understand if Google’s My Activity, as an example         open-ended responses. They were then directed to the dash-
of a privacy transparency tool, increases or decreases end-         board to view their own, real, activities that Google collected
users’ concerns and benefits regarding data collection. While       about them, and then participants were again asked about their
most participants were aware of Google’s data collection, the       concerns/or benefits. These methods allowed us to answer the
volume and detail was surprising, but after exposure to My          following research questions:
Activity, participants were significantly more likely to be both    RQ1 [Awareness and Understanding] What are users’ aware-
less concerned about data collection and to view data collec-       ness and understanding of Google’s data collection?
tion more beneficially. Only 25 % indicated that they would            Participants are generally aware of and understand why
change any settings in the My Activity service or change any        Google collects activities, citing targeted advertising, person-
behaviors. This suggests that privacy transparency tools are        alization, and product improvements. However, while aware
quite beneficial for online services as they garner trust with      of the purposes, many express surprise with the volume and
their users and improve their perceptions without necessar-         detail of activities.
ily changing users’ behaviors. At the same time, though, it
remains unclear if such transparency tools actually improve         RQ2 [Impact on Benefit/Concern] How does the My Activity
end user privacy by sufficiently assisting or motivating users      dashboard affect users’ concern about and perceived benefit
to change or review data collection settings.                       of Google’s data collection?
                                                                       Concern about Google’s data collection significantly de-
1     Introduction                                                  creased, and perceived benefit increased post exposure to My
                                                                    Activity, despite participants’ qualitatively describing simi-
Privacy dashboards [11, 14, 22] allow users of online services      lar concerns and benefits before and after exposure. Ordinal
to review and control data collection. Google introduced            logistic regression indicated that those who showed higher
an activity dashboard called My Activity [18] in 2016 that          initial concern were much more likely to reduce their con-
allows users to view their activity history (such as searches,      cern. Across all initial benefit levels, participants were almost
videos, and location data), turn off activity collection, and       always likely to increase their perceived benefit.
(automatically) delete activities from their history.               RQ3 [Behavioral Change] What settings and behaviors
   While there has been research suggesting privacy dash-           would users change due to exposure to My Activity?
boards [57, 14, 44, 22] increase users’ understanding of data
                                                                       Most participants stated that they would not (37 %) or were
collection, particularly around online behavioral advertis-
                                                                    unsure if (26 %) they would change any activity settings. Only
ing [51, 40, 5, 55, 54] and interest inferences [50, 10, 41],
                                                                    25 % indicated that they plan to use Google products differ-
there is little research on the impact of privacy dashboards on
                                                                    ently. Logistic regression suggests that those with an increase
the perceived risks or benefits of the data collection itself.
                                                                    in concern and decrease in benefit were much more likely
    * The   first two authors contributed equally to the paper.     (11.3× and 2.1×, respectively) to use Google differently.
These results suggest that privacy dashboards and trans-           3   Related Work
parency tools are a net positive for online services. Google’s
My Activity both decreases concerns about and increases               Online Behavioral Advertising. Many services track on-
perceived benefit of data collection, but it is not clear that        line activities of their users to infer interests for targeted
these dashboards help end-users, broadly, to increase their           advertising [55]. There is much user-facing research on
privacy. Most participants indicated that they would not use          Online Behavioral Advertising (OBA), including target-
the features of the dashboard nor change their behavior.              ing and personalization [54, 21], fingerprinting and track-
   This may be because many users are already privacy re-             ing [3, 53, 9, 23], opting-out [27, 20, 19, 25], privacy-
signed, believing that data collection will occur regardless of       enhancing technologies [47, 34, 56, 8], usable privacy no-
their choices, or it may be that the burden of properly man-          tices [26, 46, 16], cookie banners and consent [52, 31, 37],
aging their privacy is too high despite the availability of the       and also awareness, behaviors, perceptions, and privacy ex-
transparency tool. As more and more transparency tools be-            pectations [29, 28, 43, 1, 10, 41].
come available, this burden will only increase, and so research          Ur et al. [51] conducted interviews to explore non-technical
into mechanisms to consolidate and automate management of             users’ attitudes about OBA, finding that participants were
data collection may greatly benefit users.                            surprised that browsing history can be used to tailor adver-
                                                                      tisements. Rader [40] studied users’ awareness of behav-
                                                                      ioral tracking on Facebook and Google, suggesting that in-
                                                                      creased awareness of consequences of data aggregation led
2     Background: Google My Activity                                  to increased concern. Chanchary and Chiasson [5] explored
                                                                      users’ understanding of OBA and tracking prevention tools,
Google introduced My Activity1 in June 2016 [38], and it              noting that participants expressed more willingness to share
enables users to manage their Google Web & App, Location,             data given control mechanism over collected data. We find
and YouTube history and other data collected from Chrome,             similarly in this study that My Activity is such a tool: Partici-
Android, etc. My Activity is designed as a transparency tool,         pants expressed decreased concern with data collection and
privacy dashboard, and data collection control mechanism              were unlikely to change collection settings.
and is the successor of Google’s Web History.                            Most recently, Wei et al. [54] studied the advertising
    The My Activity pages offers a number of user benefits            ecosystem of Twitter, exploring ad targeting criteria. Similar
to data collection. For example, “more personalized experi-           to our work, participants shared some of their Twitter data via
ences across all Google services,” and it offers users “faster        a browser extension. The authors suggested that transparency
searches, better recommendations,” “personalized maps, rec-           regulations should mandate that the “right of access” not only
ommendations based on places you’ve visited,” and “better             includes access to the raw data files, but also a clear descrip-
recommendations, remember where you left off, and more.” 2            tion and tools to visualize the data in a meaningful way. My
    My Activity lists activities such as, “Searched for USENIX        Activity provides such a meaningful way to visualize and
2021,” and activity details , such as type of activity, timestamp,    access this data, but unfortunately, it still may not sufficiently
and device. Viewed as a single event, bundle of events, or            motivate users to manage data collection.
filtered by date ranges and services, users can review or delete
activities, as well as enabled/disabled data collection and           Transparency and Privacy Dashboards. Transparency
ad personalization. Users receive a modal when disabling              tools and privacy dashboards, which allow users to explore
activity collection warning that this action will also disable        and manage data collection and privacy from online services,
personalization and not delete previously collected data. (See        have been extensively proposed and explored in the litera-
Explore My Activity section in Appendix A.2 for a visual.)            ture [24, 44, 34, 57, 42, 48, 50, 55, 22, 11]. With the Euro-
    In May 2019, Google added a setting to enable automatic           pean General Data Protection Regulations (GDPR) (and other
deletion of activities (after 3 or 18 months) [33], and in Au-        similar laws), data access requirements will likely lead to an
gust 2019, Google introduced an option to disable collecting          increase in transparency tools and dashboards. Below we
audio recordings [4]. In June 2020, Google updated their              outline some of the more related work.
policy to give the option for auto-deleting activities during            Rao et al. [42] suggested that dashboards were insufficient
account creation for newly created accounts after 18 months           in providing transparency in to the creation of user profiles
for Web & App and Location activities and after 36 months             in a study of ad profiles from BlueKai, Google, and Yahoo,
for YouTube activities. However, existing accounts will still         and as a result participants did not intend to change behaviors.
need to proactively enable the feature [35].                          This same lack of transparency in My Activity may explain
                                                                      why many participants do not intend to change behaviors or
    1 My
       Activity: https://myactivity.google.com, as of June 2, 2021.
                                                                      settings. Schnorf et al. [48] found that offering more control
    2 Google’sactivity controls: https://myactivity.google.com/       does not lead to less trust when exploring inferred interest
activitycontrols, as of June 2, 2021.                                 transparency tools, and we find similarly with My Activity.
Angulo et al. [2] and Fischer-Hübner et al. [14] developed Screening Survey. We used the following inclusion criteria
Data Track, a transparency tool for disclosing users data to screen participants for the main study: (i) the participant
for different online services. Tschantz et al. [50] compared has an active Google account, (ii) the participant has used their
inferred values displayed in Google’s Ad Settings [17] to Google account for more than three years, (iii) the participant
self-reported values, finding that logged in users were sig- currently uses Google Search, Google Maps, and YouTube.
nificantly more accurate. Weinshel et al. [55] developed an In the screening survey we also asked participants if they
extension that visualizes information that trackers could infer have a Gmail account (as surrogate for a Google account), the
from browsing habits, surprising users about the extent and age of the account, and what other Google products (besides
prevalence of data collection. Our participants were aware of Gmail) they use and their frequency of use and overall impor-
Google’s data collection but also surprised by its scope. tance. Participants also answered the Internet users’ informa-
Recently, Rader et al. [41] investigated users’ reactions to tion privacy concerns (IUIPC) questionnaire, as described by
Google’s and Facebook’s profile inferences, and while many Malhotra et al. [30], to gain insights into participants’ privacy
participants understood inferences to be a description of past concerns.
activities, they were challenged to understand them as pre-
dictive of future interests and actions. Rader et al. argued
Main Study. If participants qualified they were invited to
for better transparency mechanisms, by adding explanations
complete the main study which is divided into three stages:
of how inferences might get used, and restricting inferences
(i) a pre-exposure stage, in which participants install the sur-
to only include the ones that can be explained by users, and
vey browser extension that aided in administering the sur-
thus, are not based on aggregation or inaccurate assumptions.
vey and answer questions about their perceptions of Google;
Meanwhile, Herder and van Maaren [22] also found that re-
(ii) an intervention stage consisting of two steps; (a) an explo-
moving derived and inferred data has a positive effect on trust
ration phase step and (b) an activity presentation step (iii) a
and perceived risk. Note that My Activity shows raw data, not
post-exposure stage. To facilitate the study, we designed a
inferred data, and it may be the case that better connecting spe-
custom browser extension that locally analyzes My Activity
cific inferences to data collection could improve transparency
to collect aggregated information about the number of activi-
and better inform user choices.
ties of users and also to fill-in survey questions. Participants
Most related to our work, Earp and Staddon [11] con-
are given detailed instructions to both install and uninstall the
ducted a pilot study with about 100 undergraduate students on
extension. Below, we describe each part of the study in detail
Google Ad Settings and Google Web History that—somewhat
(see Figure 1 for a visual).
unfortunately—was rebuilt and became Google My Activity
during their data collection in 2016. For the participants that 1. Informed Consent: Participant consented to the study; the
had “sufficient” data accessible, they found no evidence that consent included that participants would be asked to install
the tools were harmful to user trust and privacy. Our work a web browser extension and answer questions about their
confirms this finding, and goes further by showing that My experience with Google’s My Activity page.
Activity can be helpful in reducing concerns and increasing 2. Install Extension: Participants installed the browser ex-
perceived benefits for end users. Additionally, as My Activity tension that assisted in administering the survey. The
has been active for 4–5 years at the time of our study, our extension also recorded aggregate information about the
work is able to explore the impact of this transparency tool. survey participants’ number of activities per month for
each activity category (e. g., Google Search, YouTube) and
4 Method the date of the oldest activity, as a proxy for account age.
3. Pre-Exposure Perceptions of Google: Participants were
We designed our study for participants to directly interact with asked about their awareness of Google’s data collection
their own activity history on My Activity, following a pre-post- practices, their level of concern, and how often they benefit
study design. First, participants answered questions regarding from Google’s collection of their online activities, both
their concern for and benefit from Google’s data collection, on a Likert scale and in open-ended responses. We also
and after exposure to My Activty, they answered the same set asked participants if they employed any strategies to limit
of questions. In the rest of this section, we outline our study the amount of data that Google may collect about them.
protocol, recruitment, limitations, and ethical considerations. The questions about perceived level of concern and ben-
efit serve as a pre-exposure baseline and are asked again
after exposure to the Google My Activity page and re-
4.1 Study Procedure
cent/historical Google activities. Questions: Q1–Q4.
To ensure that participants had active Google accounts, we 4. Visit My Activity: We provided participants with a brief
used a two-part structure with a screening survey where qual- descriptive introduction to the My Activity service and
ified participants were asked to participate in the main study. the term “activities” as used by Google. Participants were
The full survey can be found in the Appendix A. presented with a “Sign in with Google” button and werePre-Exposure Intervention Post-Exposure
Screening: Account Usage 4. Visit My Activity 7. Reflection and Trust
Screening: IUIPC Explored their My Activity page 8. Change Behavior
5. My Activity Questions
1. Informed Consent 9. Perception of Google
Immediate Reactions
2. Install Extension 6. Activity Presentation 10. Demographics
3. Perception of Google 9x activities (Search, YT, Maps) 11. Uninstall Extension
Required to locally extract and display their activities.
Figure 1: Main Study: The study was divided into three parts. During the intervention part, participants visited their own My
Activity page and were questioned about nine of their activities (three per category) from Google Search, YouTube, and Maps.
instructed to login to their primary Google account. Then 4.2 Recruitment and Demographics
participants explored their My Activity for two minutes,
We recruited 669 participants via Prolific3 for the screening
managed by the browser extension with an overlay banner
survey. After applying our inclusion criteria, 447 participants
and restricting navigation away from My Activity. After
qualified for the main study. Of those, 153 completed the
two minutes, participants were directed back to the survey.
main study; unfortunately, rates of return to the main study
5. My Activity Questions: Participants were asked to pro-
fell below 50%. On average, it took 4 minutes for the screen-
vide their immediate reactions to My Activity and their
ing survey and 26 minutes for the main study. Participants
reasoning for why Google is collecting this data. Partici-
who completed the screening survey received $0.50 USD and
pants were also asked if they perceive the data collection
$3.75 USD for completing the main study.
to be beneficial or harmful, if they have any concerns,
We sought a balanced recruitment between gender and
and whether this data collection improves their experience
five age ranges (18–24, 25–34, 35–44, 45–54, 55+) with a
using Google services. Questions: Q5–Q9.
median participant age of 38. Purposive sampling was per-
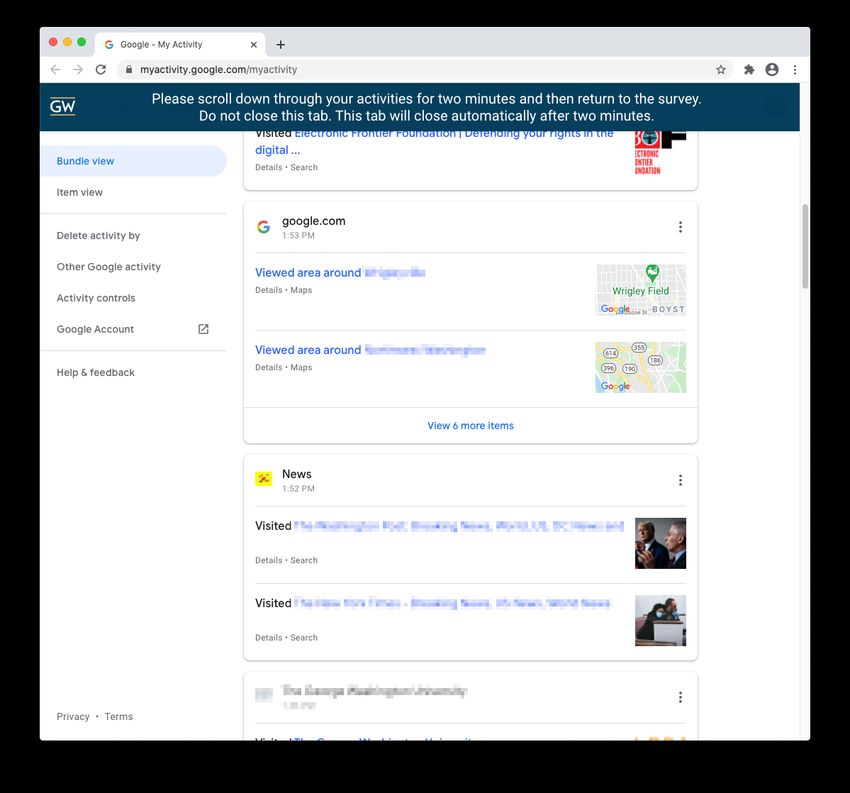
6. Activity Presentation: Next the browser extension locally
formed using Prolific’s built in study inclusion criteria which
displayed three recent activities (randomly selected from 2
allows researchers to specify availability based on Prolific’s
to 12 days old), three three-month-old activities (randomly
pre-screened demographics. The identified gender distribu-
selected from 90 to 100 days old), and three 18-month-old
tion for the main study was 52 % men, 46 % women, and
activities (randomly selected from 540 to 550 days old).
2 % non-binary or did not disclose gender. Participant demo-
The participants reported their awareness and recall of each
graphics are presented in Table 1 (for additional demographic
of the nine activities, which were selected with an even
information see the extended version of our paper [13]).
distribution from the services Google Search, YouTube,
and Google Maps. Questions: Q10–Q14.
7. Reflection and Trust: We then asked the participants to 4.3 Analysis Methods and Metrics
reflect on their post-exposure feelings and on the appropri-
Qualitative Coding. We conducted qualitative open cod-
ateness of the data collection. Questions: Q15–Q19.
ing to analyze 19 free-response questions. A primary coder
8. Change Behavior: Participants were asked what behav-
from the research team crafted a codebook and identified de-
ioral change they would likely implement after learning
scriptive themes by coding each question. A secondary coder
about My Activity, if they planned to change how long
coded a 20 % sub-sample from each of the free-response ques-
Google stores their activities, or if they would like to delete
tions over several rounds, providing feedback on the codebook
their activities. Participants were also asked if they plan
and iterating with the primary coder until inter-coder agree-
to change their My Activity settings and if they would
ment was reached (Cohen’s κ > 0.7). We report the number
interact differently with Google products in the future.
of responses receiving a code and percentage of responses
Questions: Q20–Q25.
assigned that code. Note that responses may be assigned
9. Post-Exposure Perception of Google: We again asked par-
multiple codes.
ticipants about their concern for and benefit from Google’s
data collection. Questions Q26, Q27.
10. Demographics: Participants were asked to provide de- Statistical Tests and Regression Analysis. We performed
mographic information, such as age, identified gender, two Wilcoxon signed-rank tests for repeated measurements
education, and technical background. Questions: D1–D4. on the Likert responses to the pre and post-exposure ques-
11. Uninstall Extension: Upon completing the survey partici- tions on concern (Q2, Q26) and benefit (Q3, Q27). The same
pants were instructed to remove the browser extension. tests were used to find differences between the responses
Q11–Q14 for the presented activities, and then post-hoc,
pairwise analysis using again Wilcoxon signed-rank tests
3 Prolific service: https://www.prolific.co, as of June 2, 2021.Table 1: Demographic data of the participants. Age and 4.5 Limitations
gender data for our screening survey was provided by Prolific.
The IUIPC data was collected at the end of the screening Our study is limited in its recruitment, particularly to Pro-
survey. Note: Prolific only provides binary gender data. To lific users residing in the U.S. We attempted to compensate
get more precise data, we asked for gender and age. by performing purposive sampling on Prolific to balance de-
mographic factors like age and gender, but we cannot claim
Screening Main Study full generalizability of the results. Despite this limitation,
(n = 669) (n = 153)
prior work [45] suggests that online studies about privacy and
n % n %
security behavior can approximate behaviors of populations.
Gender
Woman 317 47 71 46 Social desirability and response bias may lead to partici-
Man 344 51 79 52
Non-binary – – 2 1 pants over describing their awareness of Google data collec-
No answer 8 1 1 1 tion as they may believe that this is the expectation of the
18–24 126 19 29 19 researchers. Such biases may be most present when partici-
25–34 152 23 35 23
pants indicate if they intend to change a setting or behavior.
Age
35–44 144 22 31 20
45–54 128 19 29 19 Our regression analysis is, unfortunately, under-powered
55+ 116 17 28 18
No answer 3 0 1 1 to identify small effects as we only have 153 examples. How-
Avg. SD Avg. SD ever, the pseudo R2 > 0.5 for the ordinal-logistic regression,
suggesting excellent fit; the logistic regressions have pseudo
IUIPC
Control 5.8 1.0 5.9 1.0
Awareness 6.3 0.8 6.4 0.8 0.25 < R2 < 0.68, also suggesting good fits. As a result, we
Collection 5.3 1.2 5.6 1.1 have confidence that the models are describing meaningful
IUIPC Combined 5.9 0.8 5.7 0.9 covariants, but small effects may not be captured.
Finally, as a pre-post-study we attribute changes in concern
and benefit to the intervention, namely exposure to My Ac-
between categories, with Holm correction for overlapping tivity, but we cannot rule out other factors impacting changes
measures. in concern and benefit. A randomized control trial would be
We also performed two proportional odds logistic regres- needed to completely rule out other factors, but using such
sions to analyze which factors, in addition to the intervention, a methodology here is unclear because there is limited con-
that may have influenced the Likert responses moving up or trol of the display of activities and behaviors of our online
down the scales for concern (Q26) and benefit (Q27). participants outside of the study.
Finally, we performed three binomial logistic regressions
on behavior change questions: Google settings Q23, re-
view/delete activities Q24, and use Google products differ- 5 Results
ently in the future Q25. Since we were interested whether
participants planned to take action, we binned the unsure and This section is structured along our research questions. We
no responses. first present our findings concerning the participants’ aware-
ness and understanding of Google’s data collection practices.
Secondly, we show the impact of Google’s My Activity on
4.4 Ethical Considerations the perceived concern and benefit of the participants. Finally,
The study protocol was approved by our Institutional Re- we discuss what actions participants plan to take as a result
view Board (IRB) with approval number NCR202596, and of interacting with My Activity.
throughout the process, we considered the sensitivity of par-
ticipants’ My Activity data at every step. At no point did (do) 5.1 RQ1: Awareness and Understanding
the researchers have access to participants’ precise Google
activities. All aspects of the survey requiring access to ac- As part of RQ1, we seek to understand if participants are
tual Google activity was administered locally on the partic- aware of Google’s My Activity, understand the scope of
ipant’s machine using the browser extension. We did not Google’s data collection and how that data is used.
collect information about individual activities to protect par-
ticipants privacy, and only report information in aggregate, Prior Awareness of My Activity. Even though Google in-
e. g., the number of activities per month. All participants troduced My Activity in 2016, only a third (n = 55; 36 %)
were informed about the nature of the study prior to partic- of the participants indicate that they have visited their My
ipating and consented to participating in both the screening Activity page prior to our study. We also asked the partici-
and main study. At no time did the extension nor the re- pants to assess how aware they were of Google’s practice to
searchers have access the participants’ Google password or collect data on individuals’ use of their services. This first
to any other Google account data, and all collected data is question served—together with the Questions Q2 and Q3
associated with random identifiers. (see Appendix A.2)—to get a first impression of participants’Prior to seeing this activity, have you been aware
Do you recall this activity?
that Google stored this activity?
(Missing) No Unsure Yes (Missing) No Unsure Yes
Search 52 8 93 Search 11 141
recent
recent
YouTube 10 50 10 83 YouTube 10 13 127
Maps 10 55 10 78 Maps 10 38 99
Search 64 79 Search 34 109
3 mon.
3 mon.
YouTube 13 63 70 YouTube 13 22 115
Maps 12 65 70 Maps 12 56 79
18 mon.
18 mon.
Search 63 10 76 Search 54 14 81
YouTube 12 63 11 67 YouTube 12 44 12 85
Maps 11 68 68 Maps 11 65 12 65
0% 25% 50% 75% 100% 0% 25% 50% 75% 100%
Figure 2: When presented with activities from their own Figure 3: The ability of participants to recall activities (Q10)
My Activity feed, participants’ awareness (Q11) seems to decreases over time independent of activity type. Google
be similar regardless of the service. The age of the activity Maps activities in general seem to be harder to recall (Search
however has small effect on the awareness (recent against 18 / Maps: W = 3 480; p < 0.001; r = 0.25; YouTube / Maps:
months). W = 3 609; p < 0.001; r = 0.31).
attitudes towards data collection and privacy. Most partici- Scope of Data Collection. We asked a set of free-response
pants (n = 115; 75 %) indicated they were at least somewhat questions after the participants visited their My Activity page
aware (n = 42; 28 %), moderately aware (n = 54; 35 %), or to gauge immediate reactions (Q5). One-third (n = 51; 33 %)
even extremely aware (n = 19; 12 %). Only 6 (4 %) partici- of study participants’ immediate reaction was that of surprise,
pants stated they were not at all aware. e. g., “I am surprised at how much of my browsing activity is
saved and is identifiable” (P72), and “It’s an awful lot of my
life on that page” (P11). Furthermore, 54 (35 %) participants
Privacy Management Strategies. Qualitative coding of stated that the amount of data collected on the My Activity
Q4 indicates a divide between the participants who attempt page was more than they expected. For example:
to apply a specific privacy management strategy and those
I’m surprised at how much data google collects beside
who appear to be privacy resigned or unconcerned, and thus
it’s own sites. I did not know it saved the links you clicked
do not have a management strategy. For instance:
on after a google search, for instance. (P23)
No strategies. I just use Chrome and whatever informa- Others were not surprised (n = 34; 22 %) and stated the
tion Google gets they get. I signed up and accepted that amount of data collection was as expected (n = 30; 20 %).
they would take my data and information. (P61) For instance:
No, I don’t. I don’t mind that they collect data about my It didn’t surprise me to see a tracking of all of my activity.
usage and statistics. (P21) Perhaps it gives me a way to control the information
tracking in the future. (P89)
Half of the participants (n = 78; 51 %) claimed not to have Some participants found the My Activity page helpful
strategies for managing the kind of information Google may (n = 16; 11 %) and were interested (n = 9; 6 %), while a
collect about them, while 38 (25 %) participants explained few participants reacted with concern (n = 6; 4 %), felt un-
that they employed web browser based strategies such as open- comfortable (n = 4; 4 %), or thought it creepy (n = 4; 3 %).
ing private or incognito windows (n = 17; 11 %), installing ad- This is in line with closed responses to awareness of data
blocking or tracking prevention browser extensions (n = 10; collection types for individual activities (Q11); as Figure 2
7 %), and clearing their browser history or cookies (n = 9; shows, for recent search activities 61 % of the participants
6 %). Others indicated that they limit the information that they indicated awareness. For 18-month-old YouTube activities,
provide (n = 25; 16 %), limit their usage of Google products only 44 % of the participants responded with yes. Comparing
or refrain from logging into their Google accounts (n = 7; across services and activity ages, we find that there is a signif-
5 %), provide false information (n = 6; 4 %), or delete infor- icant difference between awareness of recent and 18-month
mation (n = 3; 2 %). old activities (W = 1 511; p = 0.004; r = 0.17).Do you think My Activity helps you to better
understand what data Google collects about you? Web activities 17 18 38 45 19
YouTube activities 17 15 32 48 30
15 18 88 28
Maps activities 15 19 45 29 24
0% 25% 50% 75% 100%
Strongly disagree Disagree Neither agree n... 0% 25% 50% 75% 100%
Agree Strongly agree Absolutely ina... Inappropriate Slightly inapp...
Figure 4: Roughly 75 % of the participants stated that My Neutral Slightly appro... Appropriate
Activity helps them to better understand what data Google Absolutely app...
is collecting about them. Only around 12 % do not think My Figure 5: The majority of participants found the explanations
Activity aids their understanding. Google gives as to why they collect activity data appropriate
(Web: 67 %; YouTube: 72 %; Maps: 64 %).
Note that not all participants had activities for each com-
bination of services and time frames (see missing data in Asked whether My Activity helps to better understand
Figure 2 and 3). For 24 participants, we could not obtain a what data Google collects, most participants (n = 116; 76 %)
full set of nine activities, 14 participants saw six activities agreed. Only 12 % (n = 19) indicated that it did not help. Fig-
during the survey, and six participant had seven activities. ure 4 shows the full results of this question. And when asked
One participant saw only one activity and the remaining three to explain why they think My Activity helps them to better
participants saw two, three, or eight activities. understand what data Google collects (Q23_A), 61 (40 %)
Figure 3 shows the results of Q10. The participants report participants reported that My Activity provides transparency
higher recall for recent activities compared to older ones (re- about the collected data, e. g., “I didn’t realize some of this
cent / 3 months: W = 1 711; p < 0.001; r = 0.26; recent / info was collected” (P4), and
18 months: W = 1 862; p < 0.001; r = 0.48; 3 months / 18
I see what they are collecting. I feel like I always knew
months: W = 3 062; p < 0.001; r = 0.29). Around half of
they were watching every site I visited but to quantify it
the participants were able to recall their 18-month-old Search
gives me a better understanding. (P66)
(n = 81; 53 %) or YouTube activities (n = 85; 56 %). For
Maps activities the fraction was even lower (n = 65; 42 %). Still other participants (n = 31; 20 %) were skeptical and
In contrast, 92 % (n = 141) of the participants could remem- felt the My Activity page did not show all the data Google
ber their recent Google Search activities. However, even collects, e. g., “I see the data that they are retaining, but I’m
recent Google Maps activities were harder to recall for the concerned that there is more data being saved that they’re not
participants (n = 99; 65 % could recall them). Compared sharing with me” (P148), and
with recent Google Search activities, there is a significant
difference with a large effect size (W = 2 643.5; p < 0.001; I think it gives me a better understanding, but I don’t
r = 0.65). believe Google is being completely transparent on their
end with what they keep or use. It is just what I can
We assume this difference is due to the fact that some
control on my end. (P69)
of the Google Maps activities were generated without the
participants actively interacting with the service while Search For some participants (n = 13; 8 %) My Activity did not
activities are basically queries made via Google Search. help them better understand what data Google collects. For
Note that not all participants had activities for all services example:
and time periods. In total 76 (of 1 377) records for the activity
presentation of 24 participants were missing. It shows me what I have done but not how they are using
it or what they are collecting from this data. Like are they
collecting what I do in the app, what I engage with, how
Understanding of Data Collection. We also recorded the long I’m there what keeps my interest. (P17)
mouse movements of the participants during their visit of the
My Activity page to get an idea of whether and how they Purpose of Data Collection. We asked the participants to
interacted with the page. We recorded an average participant think of three purposes for which Google might collect this
scroll depth of 20 553 pixels (SD = 22 285, min = 657, max = data (Q7). Most participants (n = 123; 80 %) stated that
252 735). A single activity height is approximately 200 pix- the purpose for the collection was targeted advertising. For
els, which suggests that the average participant scrolled past example: “Make advertisements more targeted and effec-
approximately 100 activities during their exploration. tive” (P22), and “To target advertisements at me from myHow concerned are you with the amount of How often do you benefit from the amount of
information Google is collecting about your information that Google collects about your
activities online? activities online?
Pre−Exposure Pre−Exposure
19 44 40 40 15 37 78 21
Concern Benefit
Post−Exposure Post−Exposure
15 36 39 42 21 33 74 32
Concern Benefit
0% 25% 50% 75% 100% 0% 25% 50% 75% 100%
Extremely Moderately Somewhat
Never Rarely Sometimes Often Always
Slightly Not at all
(a) Level of concern before and after visiting My Activity. (b) Frequency of benefit before and after visiting My Activity.
Figure 6: Proportions of the participants’ assessment of (a) the level of concern (Q2 & Q26) and (b) the frequency of benefit
(Q3 & Q27) before and after visiting the My Activity dashboard.
search history” (P29). The next largest group identified expe- “I feel like Google is taking way too much of my data” (P128),
rience improvements that include personalization (n = 109; sensitivity of the information (n = 14), e. g., “I’m concerned
71 %) as the purpose, e. g., “Customize my search results that the data collected can be very specific and in turn, identi-
based on interest” (P39), and product improvements (n = 42; fying” (P103), and feeling uncomfortable sharing information
25 %), e. g., “Usage data for company research for products (n = 12), e. g., “My information is private and should be
and programs” (P149). Some participants (n = 59; 39 %) shared with no one” (P54). For some participants (n = 29;
thought that Google’s purpose was to sell their usage data. 19 %) the unknowns were concerning, such as how the infor-
P10 said, “Sell my data to third parties for profit,” and P31 mation is used (n = 19), and who has access to the information
said, “To sell to other companies.” collected (n = 5). For example P95 said, “I don’t know what
The purposes provided are mostly in line with what Google is being done with my personal information that Google col-
describes on its help pages, where they indicate the fol- lects and who is capable of gaining access to it.” Security was
lowing reasons to collect activity data: (i) product im- also a concern for some participants (n = 22; 14 %), specifi-
provements, (ii) recommendations, (iii) personalizations, and cally concerns about data misuse (n = 18) and personal data
(iv) browser/search/location history. However, knowing the being released (n = 8). This quote from P138 is an example:
purpose for the data does not imply agreement with the use, “I am concerned about any platform, application or website
and so we also presented participants with Google’s explana- wrongfully accessing my data or having a breach of the data
tions for data collection, asking participants to gauge appropri- I provide.” Still others (n = 16; 11 %) responded that there
ateness of the explanation (Q17-Q19). For all three activity existed a trade-off between privacy and free services, such as
categories, Figure 5 shows that 64 % think the reasons to P115 who said: “I don’t like that my privacy is being compro-
collect activity data are at least slightly appropriate. mised, but overall I enjoy the convenience of the services and
feel its worth it.”
5.2 RQ2: Impact on Benefit & Concern Initial Perceptions of Benefits. When explaining the ben-
efit (Q3_A), participants described the benefits of improved
Google’s My Activity dashboard provides extensive insights suggestions (n = 46; 30 %), personalized advertisements
into data collection, and in this research question we seek to (n = 24; 16 %), and the availability of usage history (n = 15;
understand if exposure to My Activity affects concerns about 10 %). For example, P11 said, “I’m given information and
or beliefs in benefits of Google’s data collection. We evaluate predictions about what I’m looking for in a more precise and
two Likert questions, one about concern (Q2, Q24) and one efficient manner, because my data has clued Google in.” Par-
about benefit (Q3, Q25), before and after exposure to My Ac- ticipant P39 who found personalized advertisements useful
tivity, as well as open-response explanations in answering this said, “I receive ads that I have interest in and do not see ‘an-
research question. The responses are visualized in Figure 6. noying’ ads as a result.” Participant P26 had this to say about
the benefits data collection for usage history: “Use of My
Initial Perceptions Concerns. When participants were Activity helps me retrace my steps and find information that I
asked to explain their concern (Q2_A) with the amount of may need at a later date.” Other participants (n = 26; 17 %)
information Google is collecting, more than half of the par- said they perceived no benefit, such as participant P17, who
ticipants (n = 79; 52 %) said they had privacy concerns, such said “All they do is bombard me with more ads and it doesn’t
as concerns about the amount of information (n = 15), e. g., help me to do anything.”150 150
Not at all Often
Often
Slightly
Participants
Participants
Slightly
100 100
Sometimes
Somewhat Sometimes
Somewhat
50 50
Moderately
Moderately Rarely
Rarely
Extremely
0 0
Pre−Exposure Post−Exposure Pre−Exposure Post−Exposure
Concern Concern Benefit Benefit
(a) Level of concern alluvium plot. (b) Frequency of benefit alluvium plot.
Figure 7: Detailed visualization of how the participants change their assessments of (a) the level of concern (Q2 & Q26) and
(b) the frequency of benefit (Q3 & Q27) after interacting with the My Activity dashboard.
Other Concerns. We additionally asked if participants had We included binary variables for initial concern, benefit in-
other concerns (Q8) prior to exposure, and many participants creased, high IUIPC factors, gender, age, education level, IT
reported privacy concerns (n = 58; 38 %), security concerns background, and number of activities stored in the Google
(n = 31; 20 %), and too many unknowns (n = 22; 14 %). account, and the final model had a Aldrich-Nelson pseudo-
Among the privacy concerns were concerns about selling R2 = 0.63. (see the extended version of the paper [13] for the
information (n = 14) and third parties (n = 12); for instance, complete model) We find that those who had extremely (η =
participant 19 had this to say: 5.71, OR = 303, p < 0.001), moderately (η = 4.56, OR =
96, p < 0.001), and somewhat (η = 2.77, OR = 16, p < 0.001)
Google sells my information as a product. I am not concern initially were significantly likely to reduce their con-
really a customer. I am like a piece of corn that is sold on cern after exposure. Participants who were extremely con-
the commodities market. The farmer, Google, feeds my
cerned were 303× more likely to reduce their concern, and
information and I respond. I am then sold to the highest
those moderately concerned were 96× more likely. All other
bidder several times. (P19)
factors seem to have no or little effect, except perhaps for the
There were also privacy concerns about the amount of age range 35 to 54 (η = 0.91, OR = 2.5, p = 0.052).
information (n = 12), e. g., “It’s just an odd feeling, knowing The alluvium plot in Figure 7a shows in more detail how
they collect every bit of information about me and keep it the level of concern changes among the participants based on
probably forever.” (P108) their initial concern. In total, 61 (40 %) participants moved
Participants’ security concerns were about data breach (n = down the scale, 69 (45 %) stayed the same, and only 23 (15 %)
29), e. g., “It does worry me if they ever had a data breach increased their concern.
because it seems like they do have a lot of information about
their users” (P143), and potential data misuse (n = 18) e. g.,
“I also worry about hacking and unsavory entities using my Changing Perceptions of Benefits. We find that there is a
information in ways I don’t even understand” (P89), and “I significant increase in perceived benefit (Wilcoxon signed-
am confident that given the opportunity, some human with rank test, W = 435, p < 0.001) with a moderate effect
any access to the data will use it for selfish reasons, possibly (r = 0.32). Using the same factors as before, we constructed
to the detriment of others” (P127). an ordinal logistic regression model to identify potential co-
variants that led to the increase in benefit (see Table 3). The
Changing Level of Concern. To determine if there are extended version of our paper [13] contains the full model.
significant changes in perceived concerns, we performed a Across all initial benefit responses (never, rarely, some-
Wilcoxon signed-rank test on the Likert responses before (Q3) times, often, and always), the regression exposes significant
and after (Q24) exposure to My Activity. We find that con- likelihood of keeping the same benefit or increasing bene-
cern significantly decreases (W = 2 519.5, p < 0.001) with fits with odds ratio > 106 , suggesting that participants across
an effect size of r = 0.32, suggesting that this decrease in the spectrum recognized benefits to Google’s data collection.
concern is moderate in size. We observed that participants identified as male also were
To explore what factors may have influenced the decline significantly more likely to increase their benefit perceptions
in concern, we performed an ordinal logistic regression with (η = 0.92, OR = 2.5, p = 0.014), but other factors were not
outcome variable of the Likert concern scale (see Table 2). meaningfully significant.Table 2: Ordinal regression model to describe the level of Table 3: Ordinal regression model to describe the frequency
concern after visiting the My Activity dashboard. The model of benefit after after visiting the My Activity dashboard. In
uses a descending concern scale (i. e., from extremely to not at the model a ascending frequency scale (i. e., from never to
all concerned). The Aldrich-Nelson pseudo R2 of the model always) is used. The Aldrich-Nelson pseudo R2 of the model
is 0.63. is 0.68.
Factor Est. OR Pr(>|z|) Factor Est. OR Pr(>|z|)
Pre-Exp. concern = Extremely 5.71 302.84 3.5 0.41 1.50 0.473
Gender = Male −0.24 0.79 0.481 Gender = Male 0.92 2.51 0.014 *
Age ∈ {18 − 34, 25 − 34} 0.39 1.47 0.417 Age ∈ {18 − 34, 25 − 34} 0.76 2.14 0.126
Age ∈ {35 − 44, 45 − 54} 0.91 2.50 0.052 · Age ∈ {35 − 44, 45 − 54} 0.58 1.79 0.256
Edu. ∈ {No sch.g, (Sm.) HS} 0.19 1.21 0.734 Edu. ∈ {No sch.g, (Sm.) HS} −0.16 8.50×10⁻¹ 0.782
Edu. ∈ {Sm. col., Assoc., Prof.} 0.07 1.07 0.844 Edu. ∈ {Sm. col., Assoc., Prof.} −0.16 8.51×10⁻¹ 0.671
Has IT background 0.64 1.90 0.105 Has IT background −0.07 9.30×10⁻¹ 0.864
# of activities > median −0.47 0.63 0.146 # of activities > median 0.30 1.36 0.373
Intercepts Intercepts
Not at all | Slightly 0.58 1.79 0.773 Always | Often 15.61 6.00×10619 (12 %) versus 26 (17 %), like P86 who said, “How and After completing this survey, do you see yourself changing
why would I benefit from it when I didn’t even know they are any setting in your My Activity page?
collecting information about my activities.”
56 40 57
5.3 RQ3: Behavioral Change In a month, do you see yourself reviewing and/or deleting
activities in your My Activity?
To answer our third research question RQ3, we surveyed par-
ticipants about their willingness to take action after they have 49 48 56
learned about Google’s data collection practices. We asked
three closed-ended (Q23, Q24, and Q25) and three open- Now that you have explored My Activity, do you plan using
Google products differently in the future?
ended questions (Q23_A, Q24_A, and Q25_A) to gauge par-
ticipants’ intentions to take action or change their behavior 76 38 39
as a result of the exposure to My Activity. The results of the
three closed-ended questions are summarized in Figure 8. 0% 25% 50% 75% 100%
No Unsure Yes
Change Account Settings. We asked the participants to Figure 8: Willingness to take action after visiting the My
indicate whether they plan to adjust some of the (privacy) Activity dashboard.
settings after seeing their My Activity page (Q23). The results
were almost the same for yes (n = 57; 37 %) and no (n = 56;
37 %) while 26 % (n = 40) of the participants were unsure. see just how much is collected, with using my account across
We constructed a logistic regression model to identify fac- all devices, and how far back my activity goes” (P22).
tors that predict the outcome of being willing to change set-
tings. We included covariants for change in concern, change
Review or Delete Activities. When asked whether they
in benefit, IUIPC responses, demographics, and total number
plan to use My Activity again after the survey for review-
of activities over the lifetime of an account. The model did
ing or deleting activities (Q24), only 37 % of the participants
not expose any significant factors (see extended version [13]).
responded with yes. The remaining 63 % (n = 56) were either
We also qualitatively explored participants views about
unsure (n = 48; 31 %) or said no (n = 49; 32 %).
their privacy settings by asking them which settings, if any,
We performed logistic regression to determine factors
would they change (Q23_A). More participants (n = 75;
that would lead to reviewing activities (see Table 4 or the
49 %) in their qualitative answer responded with a privacy
extended paper [13] for the full model). We found a sig-
setting that they would change. We recognize that many of
nificant correlation with IUIPC collection scale questions
these participants do not plan to actually change settings given
(β = 1.43, OR = 4.19, p = 0.042), where participants with
their prior quantitative responses. We found that changing
high privacy concerns regarding data collection were 4.19×
delete frequency (n = 16), or stopping data collection (n =
more likely to review activities later. This finding suggests
17), or changing how long information is stored for specific
that individuals predisposed to have concerns about data col-
things (n = 27) are the most popular reasons to revise the
lection are likely to benefit the most from My Activity.
settings. For example P22 said, “I would update when they
delete my data so it stays current, relevant, and up-to-date.” We also qualitatively coded participants’ explanations for
P75 said, “I would have my settings changed so that it no why they would or would not review their activities (Q24_A).
longer stores any data,” and P120 said, “Probably auto delete The main reason participants gave for continuing to use My
since I don’t remember to go delete it often enough.” Activity was to delete activities (n = 90; 59 %). The most
common activities participants said they would delete were
Other participants (n = 52; 34 %) reported that they would
Search (n = 31), Maps (n = 23), and YouTube (n = 19). For
not change their settings. One reason for not changing the
others (n = 12) it was activities of a sensitive nature that they
settings was that the participant likes the current settings. For
would return to delete. For example, participant P89 said:
instance P13 said, “I have no complaints so see no reason to
fix something that isn’t broken.” Another reason was that they Personal activities. Like I noticed that there were medi-
had already configured the settings. For example P133 said, cal searches in my activities. It makes me uncomfortable
“I’ve already used this page and configured it the way I want.” that information is taken about me.
Participants who were undecided (n = 21; 14 %) about
changing the settings stated they wanted to review the set- Other participants (n = 41; 27 %) reported that they do
tings. Like participant P45 who said, “I need to look more not plan to use My Activity in the future. Reasons included
into the settings to see something I may change.” Undecided making changes would be too time consuming (n = 7), e. g.,
participants also reported that they wanted to review the data “I have better things to do with my time, frankly, than to be
collection, e. g., “I’d at least want to actually take a look and reviewing this” (P92), or that they would easily forget to doTable 4: Binomial logistic model to describe which other fac- Table 5: Binomial logistic model to describe which other
tors (beside visiting My Activity) influenced the participants factors influenced the participants plan to use Google products
plan to review/delete activities (yes responses to Question differently in the future (yes responses to Question Q25). The
Q24). The Aldrich-Nelson pseudo R2 = 0.25. Aldrich-Nelson pseudo R2 = 0.42.
Factor Est. OR Pr(>|z|) Factor Est. OR Pr(>|z|)
(Intercept) 13.77 9.53×10⁵ 0.988 (Intercept) −16.23 8.93×10⁻⁸ 0.997
Increasing concern 0.90 2.45 0.068 · Increasing concern 2.50 1.22×101 3.5 0.63 1.88 0.613 IUIPC cont. > 3.5 18.42 1.00×10⁸ 0.989
IUIPC awar. > 3.5 −16.69 5.63×10⁻⁸ 0.985 IUIPC awar. > 3.5 −4.82 8.06×10⁻³ 0.999
IUIPC coll. > 3.5 1.43 4.19 0.042 * IUIPC coll. > 3.5 1.40 4.07 0.109
Gender = Male 0.45 1.56 0.255 Gender = Male −0.73 4.80×10⁻¹ 0.146
Age ∈ {18 − 34, 25 − 34} −0.07 9.32×10⁻¹ 0.893 Age ∈ {18 − 34, 25 − 34} 0.97 2.63 0.198
Age ∈ {35 − 44, 45 − 54} 0.24 1.27 0.652 Age ∈ {35 − 44, 45 − 54} 1.21 3.36 0.109
Edu. ∈ {No sch.g, (Sm.) HS} 0.85 2.34 0.179 Edu. ∈ {No sch.g, (sm) HS} 0.45 1.57 0.562
Edu. ∈ {Sm. col., Assoc., Prof.} −0.04 9.64×10⁻¹ 0.928 Edu. ∈ {Sm col. Assoc., Prof.} −0.16 8.56×10⁻¹ 0.757
Has IT background 0.34 1.40 0.441 Has IT background 0.86 2.37 0.114
# of activities > median −0.35 7.02×10⁻¹ 0.330 # of activities > median −1.25 2.86×10⁻¹ 0.006 **
Signif. codes: *** =
b < 0.001; ** = b < 0.05; · =
b < 0.01; * = b < 0.1 Signif. codes: *** =
b < 0.001; ** = b < 0.05; · =
b < 0.01; * = b < 0.1
so (n = 3), e. g., “Honestly, I’ll probably forget about it, so more careful when using them, e. g., “I’d certainly be aware
I’m unlikely to delete things a month from now” (P129). of what was being collected and modify my searches accord-
Still others were (n = 12; 8 %) undecided. For instance ingly” (P148). Some participants would start to limit their
participant P36 said, “I’m not sure, I would have to weigh usage of Google products and services (n = 9; 6 %), e. g., “I
convenience for me vs. the feeling of too much information would use less of Google and more of other services” (P96).
being collected.” Of those participants who were unsure if they would change
using Google products, some (n = 10; 7 %) stated that change
Use Google Differently. Nearly 50 % (n = 76) of the par- would be difficult because of the importance of Google prod-
ticipants did not plan to use Google products differently in ucts; for instance P6 said:
the future in response to Q24. The remaining responses split
evenly between yes (n = 39; 26 %) and unsure (n = 38; 25 %). I realize Google products are necessary to my lifestyle
We performed a logistic regression to determine factors and work, but I also like to be in control of my data. I’m
not sure what the best course of action is at this point.
that may influence reported changes in behavior (see Table 5
or the extended paper [13] for the full model). Unsurprisingly,
Of the participants who would not change the way they
we found two significant factors. Those who had an increase
use Google products, many (n = 37; 24 %) claimed they were
in concern (β = 2.50, OR = 12.2, p < 0.001) and a decrease
happy with the status quo, like participant P139 who said,
in (or same) benefit (β = −1.31, OR = 0.27, p = 0.027) were
“I am happy with the current setup and will continue as I
significantly more likely to use Google products differently.
always have.” Some participants (n = 25; 16 %) were simply
This represents a small fraction of participants in our study:
unconcerned, e. g., “I just don’t care enough from what I saw
23 (15 %) participants noted an increase in concern, 15 (10 %)
to change how I use Google” (P122). Others (n = 6; 4 %) are
reported a decrease in benefit.
simply privacy resigned, e. g., “I’ve accepted the fact that they
In addition, we found a third significant factor. Participants
work this way whether I view it as right or not” (P120).
whose accounts contained a high number of activities (i. e.,
more than the median number of activities) were significantly
more likely to report to use Google products differently (β = Willingness to Pay for Google’s Services. We asked par-
−1.25, OR = 0.29, p = 0.006). ticipants if they were willing to pay for Google services if
Looking at the qualitative results shows that of those who activity data were not collected (Q16), and those results are
planned to use Google products differently some would presented in Figure 9. Nearly half of the responses (n = 74;
change settings (n = 14; 9 %), such as limiting data collection 48 %) would not pay, which is in line with previous work [5],
or deleting their activities more often, e. g., “I am definitely but 70 (46 %) say they would pay at least $1 USD per-month,
going to be turning off history for YouTube while working” with large clusters at $10 USD, $5 USD, and $1 USD per-
(P147). Others would change the way they use Google prod- month. Only 10 (7 %) described a willingness to pay more
ucts and services more generally (n = 12; 8 %), such as being than $10 USD per month.You can also read