D1.2 ANALYSIS OF BUSINESS VALUE CREATION ENABLED BY 5G FOR MANUFACTURING INDUSTRIES - 5gsmart.eu - SMART MANUFACTURING
←
→
Page content transcription
If your browser does not render page correctly, please read the page content below

D1.2
ANALYSIS OF BUSINESS VALUE CREATION ENABLED BY 5G FOR
MANUFACTURING INDUSTRIES

The 5G-SMART project has received funding from the European
Union’s Horizon 2020 research and innovation programme under
grant agreement no 857008.
D1.2 - Analysis of business value creation enabled by 5G for
manufacturing industries

Grant agreement number: 857008
Project title: 5G Smart Manufacturing
Project acronym: 5G-SMART
Project website: www.5Gsmart.eu
Programme: H2020-ICT-2018-3

Deliverable type: R: Document, report
Deliverable reference number: D2
Contributing workpackages: WP1
Dissemination level: Public
Due date: 31.05.2021
Actual submission date: 31.05.2021

Responsible organization: Fraunhofer Institute for Production Technology IPT
Editor(s): Raphael Kiesel
Version number: V1.0
Status: Final

Short abstract: The report covers an assessment framework created to quantify
 the business value of 5G implementation for industrial actors.
 The development of this model is described, as well as its
 implementation into a model. Finally, the model is applied to an
 AGV use case to show its usability.

Keywords: Economic analysis framework; production companies; economic
 evaluation; technological analysis

Contributor(s): Krister Landernäs (ABB)
 Davit Harutyunyan (Bosch)
 Dhruvin Patel (Ericsson)
 John Sandberg (Ericsson)
 Leefke Grosjean (Ericsson)
 Mats O Pettersson (Ericsson)
 Niels König (IPT)
 Raphael Kiesel (IPT)
 Roberto Padovani (Marposs)
 Dirk Lange (MMS)
 Fanny Parsysz (Orange)
Document: D1.2
Version: v1.0 Dissemination level: Public
Date: 28.05.2021 Status: Final

 Disclaimer
 This work has been performed in the framework of the H2020 project 5G-SMART co-funded by the
 EU. This information reflects the consortium’s view, but the consortium is not liable for any use that
 may be made of any of the information contained therein.

 This deliverable has been submitted to the EU commission, but it has not been reviewed and it has
 not been accepted by the EU commission yet.

 857008 5G-SMART 1
Document: D1.2
Version: v1.0 Dissemination level: Public
Date: 28.05.2021 Status: Final

 Executive summary
 Within the activities of 5G-SMART, an assessment framework was created to quantify the business
 value of 5G implementation for industrial actors.

 This report presents a 4-step model supporting the economic evaluation of 5G implementation for
 applications in production. Step 1 (Requirement Check) includes use case selection as well as the
 network requirement selection from the end-user point of view. In step 2 (Goal Definition), technical
 and economic goals are determined. Seven technical goals and two economic goals can be selected.
 It is possible to select more than one goal at a time. Selected goals decide on which data is required
 to evaluate the process. In step 3 (Data Acquisition) model user has to provide the data of the use case
 to be analyzed. Technical and economic potential of 5G for user’s application is given in step 4 (Process
 Evaluation). The framework is implemented in an excel tool and applied on an Automated Guided
 Vehicle (AGV) use case. It is emphasized that this framework focuses on the improvements coming
 from the implementation of 5G without any claim to completeness. All selected technical and
 economic data is 5G-related. This means that the framework does not provide a full techno-economic
 analysis of a typical production application. Presented changes through 5G are based on literature
 only.

 857008 5G-SMART 2
Document: D1.2
Version: v1.0 Dissemination level: Public
Date: 28.05.2021 Status: Final

 Contents
 Disclaimer................................................................................................................................................ 1
 Executive summary ................................................................................................................................. 2
 Introduction .................................................................................................................................... 5
 1.1 Motivation ................................................................................................................................. 5
 1.2 Objective .................................................................................................................................... 6
 1.3 Relation to other documents in 5G-SMART............................................................................... 6
 1.4 Structure of the document ........................................................................................................ 6
 Definition of terms & frame of references ..................................................................................... 7
 2.1 Definition of terms ..................................................................................................................... 7
 2.1.1 Technical evaluation.......................................................................................................... 7
 2.1.2 Key performance indicators .............................................................................................. 7
 2.1.3 Economic evaluation ......................................................................................................... 8
 2.2 Application area of framework .................................................................................................. 9
 Development of model to evaluate 5G technology in manufacturing companies ....................... 10
 3.1 Purpose, requirements and limitations of evaluation model .................................................. 10
 3.1.1 Purpose and methodology of the evaluation model ...................................................... 10
 3.1.2 Capabilities of evaluation model ..................................................................................... 11
 3.1.3 Limitations of evaluation model ..................................................................................... 11
 3.2 Evaluation model architecture ................................................................................................ 11
 3.3 Use Case Requirement Check .................................................................................................. 12
 3.4 Goal Definition ......................................................................................................................... 15
 3.4.1 Technical Goals and Manufacturing-KPIs ........................................................................ 15
 3.4.2 Economic Goals ............................................................................................................... 21
 3.5 Data Acquisition ....................................................................................................................... 21
 3.5.1 Product Data ................................................................................................................... 22
 3.5.2 Process Data .................................................................................................................... 23
 3.5.3 Failure Data ..................................................................................................................... 24
 3.5.4 Facility Data ..................................................................................................................... 26
 Quantification of 5G impact on data, KPI and Goals .................................................................... 27
 4.1 Direct 5G technology impact ................................................................................................... 27
 4.2 Impact of 5G-enabled technologies......................................................................................... 29

 857008 5G-SMART 3
Document: D1.2
Version: v1.0 Dissemination level: Public
Date: 28.05.2021 Status: Final

 4.2.1 5G-enabled technology 1: condition-based monitoring ................................................. 29
 4.2.2 5G-enabled technology 2: Artificial intelligence and machine learning ......................... 32
 Model implementation ................................................................................................................. 36
 Application of evaluation model ................................................................................................... 42
 Conclusion and outlook ................................................................................................................ 53
 References .................................................................................................................................... 55
 Appendix ............................................................................................................................................... 60
 A1: List of abbreviations ................................................................................................................... 60
 A2: Mathematical equations............................................................................................................. 64

 857008 5G-SMART 4
Document: D1.2
Version: v1.0 Dissemination level: Public
Date: 28.05.2021 Status: Final

 Introduction
 1.1 Motivation
 Between 2021 and 2025, Industry 4.0 technologies are expected to increase gross margins of the
 production industry by up to 13 % [Abi19]. An increase in output quality and a decrease in both
 wasteful output and downtime will increase productivity [ALB+18; TMK19]. Essential enablers for this
 improvement are applications such as closed-loop control, predictive maintenance, digital twins,
 augmented reality, and automated guided vehicles. For all these applications, suitable industrial
 communication systems play a decisive role. Communication systems have to be reliable, scalable,
 decentralized, and transmit data in near real-time [Abi19]. The 5G mobile communication standard
 appears to be an effective way to achieve a communication system for networked, adaptive
 production. As wireless communication technology, 5G technology can substantially reduce
 installation and maintenance costs while easily connecting mobile or inaccessible devices and
 simplifying line layout. 5G technology is therefore expected to increase worldwide production industry
 gross domestic product (GDP) by up to $740 billion until 2030 [Adi19].

 These 5G-enabled opportunities are reflected in a survey conducted among 505 production
 companies in Germany in 2019. 84 % endorse the predictions on massive benefits from 5G for
 productivity, 93 % expect a supporting role to Industry 4.0, and 70 % see 5G technology as an essential
 future technology. However, 55 % of the participating companies state that 5G technology
 deployment is currently not a subject of matter for them; more than half of those cite a lack of
 knowledge on benefits as a reason. One in three companies reports not having budgeted any 5G
 investment yet. [Bit19]

 From these findings, it becomes clear that uncertainty is inhibiting investment so far. The main reason
 for this is that an economic evaluation of 5G-enabled benefits for specific production use cases from
 an end-user perspective is not widely established yet. The end-user, in this case, is the person in the
 production company being responsible for implementing 5G for, e.g., process control, automated
 guided vehicles (AGVs), or augmented reality. The improvement potential for production processes
 needs to be quantified. Thus, the monetary benefits from these potentials provide decision-makers
 with a sound base for proceeding with the investment. Therefore, in 5G-SMART an assessment
 framework was created to quantify the business value of 5G implementation for industrial actors.

 857008 5G-SMART 5
Document: D1.2
Version: v1.0 Dissemination level: Public
Date: 28.05.2021 Status: Final

 1.2 Objective
 The objective of this document is to describe the assessment framework that has been developed to
 quantify the business value of 5G for industry applications. Relevant input and output parameters are
 explained, and it is shown in what way the framework provides decision support to manufacturing
 owners, production planners, and technology developers. The framework focuses on brownfield
 investment, which means that it can only be applied to applications that a company already operates
 and therefore has access to data to. By setting relevant goals and Key Performance Indicator (KPIs)
 and entering relevant data, the model user can determine both the technical and economic potential
 of 5G. The framework is designed to be applicable for any company size with relation to production.
 No assumptions are made regarding revenue, number of employees, or gross profit of company. By
 requesting all relevant data from the model user, the model also allows guidance for small-sized
 companies to assess the evaluation of their potential of implementing 5G. It is important to note that
 the model can only be used for assessing one application at a time although it is possible to include
 up to three additional specific production technologies that are enabled by 5G.

 1.3 Relation to other documents in 5G-SMART
 This deliverable takes input from the discussions on use cases, requirements and KPIs described in
 Deliverable D1.1 [5GS20-D110], as well as architecture structures discussed in Deliverable D5.2
 [5GS20-D520]. It has a close relation to the upcoming deliverable D1.3, which, in contrast to this
 deliverable, dives deeper into a business analysis of different deployment options.

 1.4 Structure of the document
 This deliverable is divided into seven chapters. After introducing and defining the most important
 terms for the further course of this deliverable (chapter 2), chapter 3 describes in detail how the model
 was developed. In chapter 4, the effects of 5G on production are derived according to the framework.
 In chapter 5, the implementation of the framework into an Excel tool is described. Chapter 6 applies
 the framework exemplary to an AGV use case. Finally, chapter 7 summarizes the results and gives an
 outlook for future research to improve the framework and the economic evaluation of the 5G-enabled
 potential for end users in production.

 857008 5G-SMART 6
Document: D1.2
Version: v1.0 Dissemination level: Public
Date: 28.05.2021 Status: Final

 Definition of terms & frame of references
 2.1 Definition of terms
 2.1.1 Technical evaluation
 Justification of investments in new technologies requires convincing arguments as well as a defined
 goal. [SSW12] analyzed the evolution of performance measures in the manufacturing industry. Until
 1990, companies focused on pursuing a single goal: decreasing cost, increasing productivity, or
 enhancing quality. Since the 90s, multi-dimensional performance measures evolved to cope with the
 increasing complexity of manufacturing systems. Overall goals of Industry 4.0 are increasing
 operational productivity and efficiency through automation and connection of the physical and virtual
 world [AC19]. Further goals are improving flexibility, versatility, and usability of smart factories
 [5GACIA1]. Costs and revenues are important measures to determine the profitability of an
 application. In this framework, they are not part of technical but economic evaluation (see definition
 in chapter 2.1.3).

 Each goal is assessed on basis of individual technical key performance indicators (KPI), which are
 defined in chapter 2.1.2.

 2.1.2 Key performance indicators
 Key performance indicators (KPIs) are a widely used instrument to detect changes in production
 system performance [SEL+17; HWA+17]. KPIs are critical for assessing the manufacturing operation
 management and continuous improvement. In modern manufacturing systems, KPIs are defined as a
 set of metrics to reflect operation performance, such as efficiency, throughput, availability, which are
 regarded from productivity, quality and maintenance perspectives [KAN+16; AFM+18]. They quantify
 the level of achieving a critical objective [ISO22400], and are a widespread method for communicating
 goals throughout the organization, which is the production company in the course of this
 report [PH14; FRA+07]. KPIs are used on all levels, be it strategic, tactical or operational [TGJ+16], and
 may even be used for predictive production control [MS17]. For automation systems and integration,
 ISO22400 specifies several criteria for a KPI to be a “good KPI”, such as validity, quantifiability, and
 accuracy [ISO14a; ISO14b]. ISO22400 is therefore the basis for the chosen KPI set presented in this
 report.

 857008 5G-SMART 7
Document: D1.2
Version: v1.0 Dissemination level: Public
Date: 28.05.2021 Status: Final

 2.1.3 Economic evaluation
 Traditional investment decisions are often evaluated based on discounted cash flows [DA92].
 Discounted cash flows determine future cash flows generated by technology corrected for their risk
 [VV07]. Economic key figures based on this principle are net present value (NPV), return on investment
 (RoI), and internal rate of return (IRR) [DA92]. NPV method is based on the time value of money where
 the future value of money equals the present value of money invested at a specific interest
 rate [SD97]. NPV is calculated by Equation (1) [SSW12]:

 = ∑ (1)
 (1 + )
 =0

 with:
 • = today’s value
 • = cash flow in period t
 • = applied interest rate
 • = time

 IRR determines the discount rate, leading to a net present value of future cash flows equal to 0 [SD97].
 IRR is applicable when investments with flexible cash flows are compared. In this framework, it is
 assumed that constant cash flows are generated over the application's lifetime, so IRR is not
 considered an economic key figure. To calculate the cash flows of investments, capital expenditure
 (CAPEX) and operational expenditure (OPEX) are common measures to determine the application
 costs. CAPEX determines initial investment in a technology, product, or service, including all
 acquisition costs for new equipment [BKK+18]. OPEX determines cash flows over an asset's lifetime,
 including maintenance, operation, or power consumption costs [BKK+18]. Cash flow (CF) in
 period t = 0 is calculated by Equation (2):

 =0 = − (2)

 Equation (3) shows the calculation of CF in periods t > 0.

 >0 = − (3)

 RoI, expressed in percentage, includes initial investment, and estimations of net annual revenues and
 annual project cost [SD97]. RoI, in addition, determines operational cost savings that can be used to
 either improve gross profit margin, expand working capital, or enhance production capacity [BOS20+].
 RoI is calculated by Equation (4):
 −
 = = (4)

 857008 5G-SMART 8
Document: D1.2
Version: v1.0 Dissemination level: Public
Date: 28.05.2021 Status: Final

 2.2 Application area of framework
 In the 5G ecosystem of a manufacturing company, several stakeholders are interrelated. D5.2 [5GS20-
 D520] of 5G-SMART defines mobile network operator (MNO), industrial party and 3rd party. The roles
 of the stakeholders depend on the operation model. This means, for example, that the industrial party
 can be both provider and consumer of the non-public 5G network. Nevertheless, the “original” value
 creation at the industrial party is always the improvement of the production process itself. The
 manufacturer creates value and revenues by improving its production, especially through
 digitalization. This created revenue defines at the same time the maximum price the manufacturer is
 willing to pay for the 5G network and additional cost towards related devices, automation, application,
 5G network competence development. In order to be clear within this deliverable (D1.2), Figure 2.1
 shows the focus of the report at hand.

 Figure 2.1: Value creation within the manufacturing ecosystem enabled by 5G implementation

 D1.2 focuses on the described revenues manufacturers can create by implementing 5G technology
 in production and thus defines the maximum price production companies are willing to pay for
 5G technology. Due to this focus, the results are independent from the operation model. Thus,
 operation models are not further differentiated in the further course of this report but are instead
 discussed in 5G-SMART’s deliverable D1.3 due in July 2021.

 857008 5G-SMART 9
Document: D1.2
Version: v1.0 Dissemination level: Public
Date: 28.05.2021 Status: Final

 Development of model to evaluate 5G technology in
 manufacturing companies
 This chapter describes how the framework for the quantification of 5G-business value for industrial
 actors was developed. Chapter 3.1 summarizes purpose as well as main requirements of the
 evaluation framework. Chapter 3.2 describes the overall architecture of the evaluation model.
 Chapter 3.3, 3.4 and 3.5 describe the contents of the four modules of the evaluation model.

 3.1 Purpose, requirements and limitations of evaluation model
 3.1.1 Purpose and methodology of the evaluation model
 Motivation for this framework is providing decision support to manufacturing owners, production
 planners, and technology developers. In this framework, the brownfield investment strategy is
 focused, which means that a company already operates the production process and considers the
 implementation of 5G technology to improve the process.

 The framework aims to empower production planners to evaluate the potential of 5G technology on
 their own. Therefore, the production planner, or rather a model user, is asked to provide data
 regarding the status quo of his or her application. Status quo refers to the application using wired
 communication. The status quo is analyzed both from technical and economic perspectives. In the
 next step, expected changes through implementing 5G use cases and their economic effects are
 analyzed and applied to the status quo. Finally, the user gets results on how 5G might impact his or
 her production application.

 The framework is designed to be applicable for any company size with relation to production. In
 contrast to Ericsson's use case analysis [EHL20], no assumptions are made regarding revenue, the
 number of employees, or the company's gross profit. Instead, this framework aims to enquire about
 all relevant numbers from the user. In this way, even small-sized companies can benefit from this
 framework and evaluate their potential benefit of implementing 5G. Note that the model can only be
 applied to one application at a time.

 857008 5G-SMART 10
Document: D1.2
Version: v1.0 Dissemination level: Public
Date: 28.05.2021 Status: Final

 3.1.2 Capabilities of evaluation model
 When developing the model, certain capabilities were defined by both literature and through
 interviews with potential model users [KS20]. These are summarized in the following.

 • Target group: manufacturing use case owners in the planning phase
 The model addresses responsibles and owners of manufacturing use cases which are in the
 5G planning phase (no 5G implemented yet).
 • Evaluation object: production use case
 The object is a single use case in production
 • Evaluation approach: data-based quantification
 The use case should be evaluated based on product and process data from the currently
 implemented use case.
 • Evaluation dimension: technical and economic evaluation
 The model should calculate both the technical and economic benefits of the 5G
 implementation as defined in chapter 2.1.
 • Decision support: user-specific individualization
 The model should allow users to choose the goals individually based on his or her
 preferences.

 3.1.3 Limitations of evaluation model
 It is emphasized that this framework focuses on the improvements coming from the implementation
 of 5G without any claim to completeness. All selected technical and economic data is 5G-related. This
 means that the framework does not provide a full techno-economic analysis of a typical production
 application. Presented changes through 5G are based on literature only.

 3.2 Evaluation model architecture
 The evaluation model includes four steps. Figure 3.1 summarizes the four steps.

 Figure 3.1: Structure of the developed evaluation model within A1.2 of 5G-SMART

 Step 1 (Requirement Check) includes use case selection and the network requirement selection from
 the end-user point of view. In step 2 (Goal Definition), technical and economic goals are determined.
 Seven technical goals and two economic goals can be selected. It is possible to select more than one

 857008 5G-SMART 11
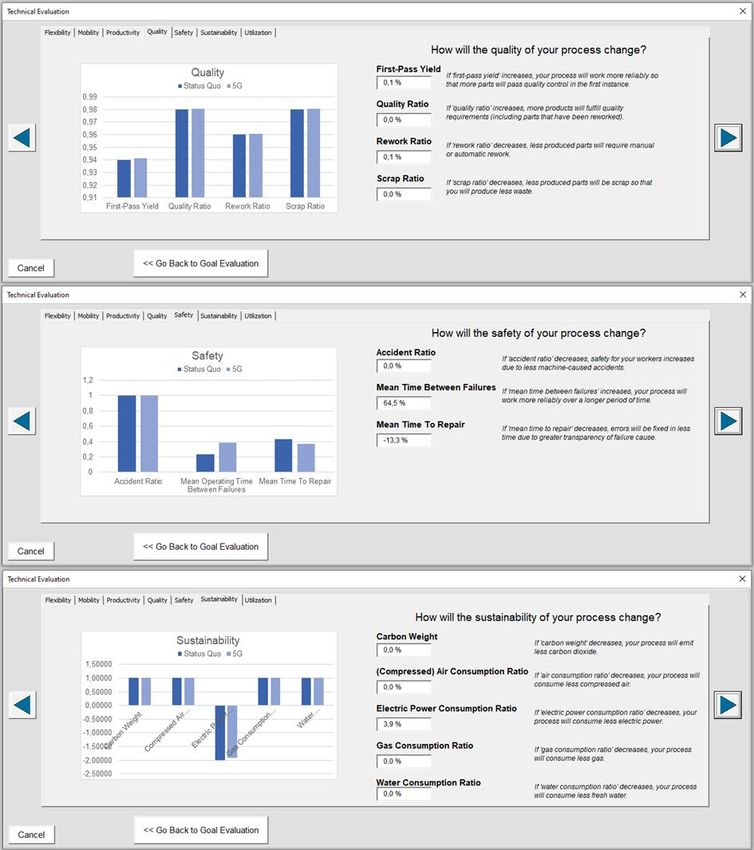
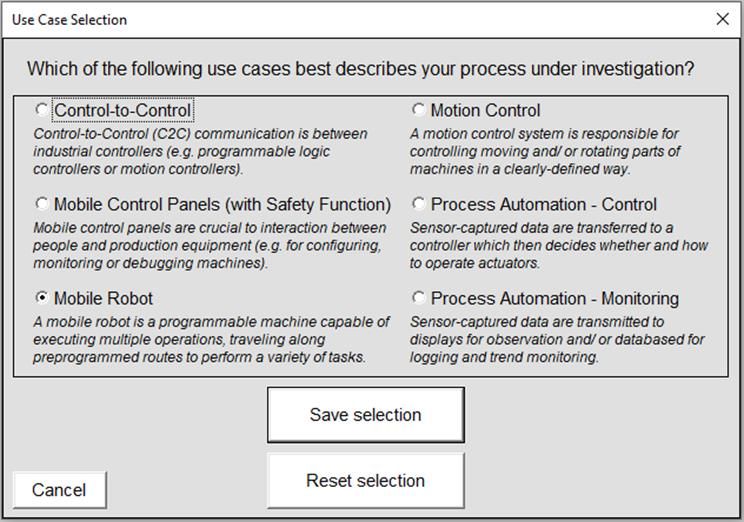
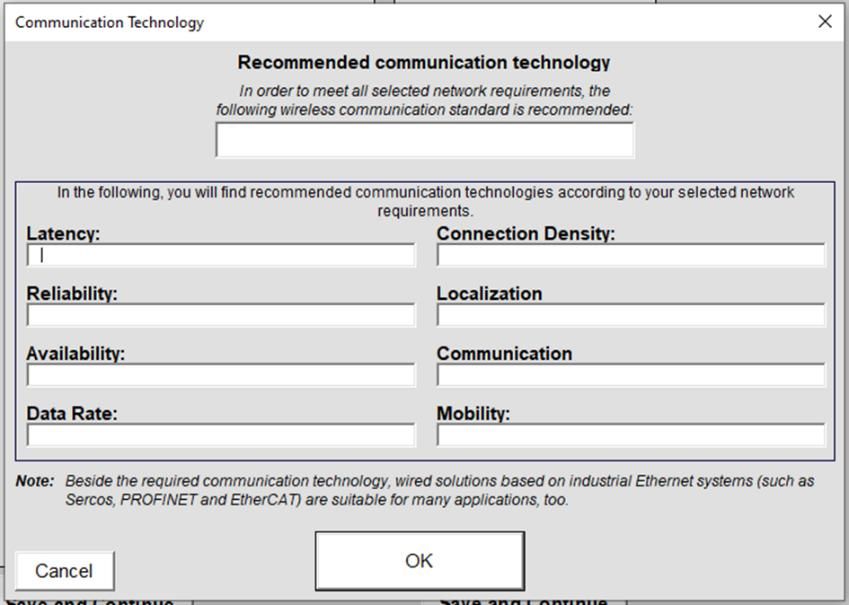
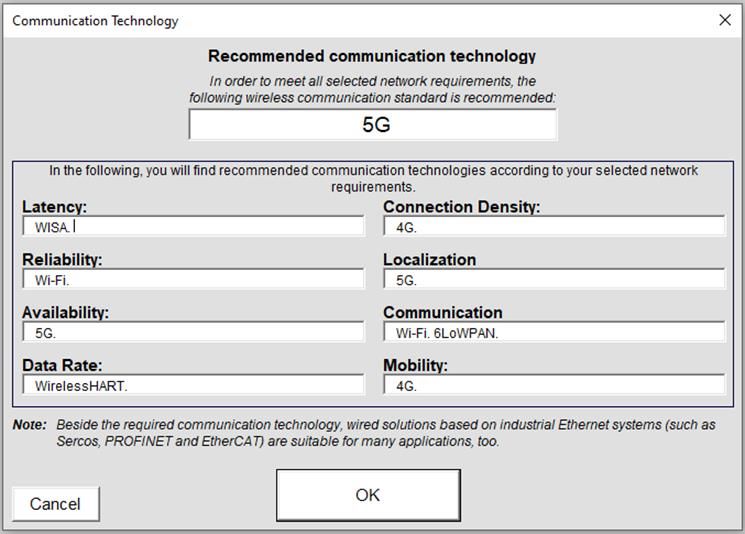
Document: D1.2
Version: v1.0 Dissemination level: Public
Date: 28.05.2021 Status: Final

 goal at a time. Selected goals decide on which data is required to evaluate the process. In step 3 (Data
 Acquisition), the model user has to provide the data of the use case to be analyzed. Finally, the
 technical and economic potential of 5G for the user's process is given in step 4.

 3.3 Use Case Requirement Check
 The first step of the model is the requirement check. This helps the user to figure out at an early
 evaluation stage whether the 5G capabilities really support the use case. Therefore, the model
 includes several use cases. The model user can select one of the following use cases, being interrelated
 to the technical goals.

 • Control-to-control
 Control-to-control (C2C) communication is between industrial controllers (e.g. programmable
 logic controllers or motion controllers).
 • Mobile control panels (with safety function)
 Mobile control panels are crucial for the interaction between workers and production
 equipment (e.g., for configuring, monitoring, or debugging machines).
 • Motion control
 A motion control system is responsible for controlling moving and/or rotating parts of
 machines in a clearly defined way.
 • Factory automation – control
 Sensor-captured data is transferred to a controller which then decides whether and how to
 operate actuators.
 • Factory automation – monitoring
 Sensor-captured data is transmitted to displays for observation and/or database for logging
 and trend monitoring.

 Step 1 also includes the definition of network requirements for the application. The user is asked to
 set the values for the required latency, reliability, availability, data rate, connection density,
 localization precision, communication range, and mobility of the application. The morphology in
 Figure 3.2 was developed to determine which communication network is suitable for each
 requirement. On basis of the morphology, ten different communication technologies (CT) are
 compared, namely LoRaWAN, 6LoWPAN, Bluetooth, WISA, ISA 100.11, WirelessHART, ZigBee, Wi-Fi,
 4G, and 5G. Based on the inserted network requirements, a recommendation is given which
 communication technologies meet the requirements. The ten CTs are classified in Figure 3.3.

 857008 5G-SMART 12
Document: D1.2
Version: v1.0 Dissemination level: Public
Date: 28.05.2021 Status: Final

 Figure 3.2: Morphological box to pre-evaluate the use case

 Below the parameters of the morphological box are listed together with their definitions as provided
 in 5G-SMART’s deliverable D1.1 [5GS20-D110].

 Latency - ms
 (End-to-end) Latency is the time that it takes to transfer application data of a given size from a source
 to a destination, from the moment it is transmitted by the source to the moment it is successfully
 received at the destination (one-way latency).

 Reliability - %
 The communication service reliability relates to the ability to continuously operate as required by the
 application, without failure, for a given time interval and under given conditions (e.g. mode of
 operation, stress levels, and environment). It can be quantified using metrics such as mean time
 between failures (MTBF) or the probability of no failure within a specified period of time. MTBF is the
 mean value of how long the communication service is available before it becomes unavailable.

 Availability - %
 The communication service availability relates to the ability to allow correct operation of the
 application. It is defined as the “percentage value of the amount of time the end-to-end
 communication service is delivered according to an agreed QoS, divided by the amount of time the
 system is expected to deliver the end-to-end service according to the specification in a specific area”.
 The service is unavailable if the messages received at the target are impaired and/or untimely (e.g.
 latency > stipulated maximum), resulting in survival time being exceeded.

 User Data Rate - Mbps
 The user data rate is defined as the value of the number of bits transmitted or received over time,
 typically expressed in Mbit/s, which is expected to be measured at the CSI. This definition excludes
 scenarios for broadcast-like services, where the given value is the maximum that is needed.

 857008 5G-SMART 13
Document: D1.2
Version: v1.0 Dissemination level: Public
Date: 28.05.2021 Status: Final

 Connection Density - Dev./m²
 The required connection density is typically measured in devices/m². It is defined as the number of
 devices performing on a certain area unit. The characteristic can be specified regarding the maximum,
 minimum or average value. It can also be defined per volume, depending on the given application and
 use case. Because of the CT’s variety in this characteristic, for certain use cases special requirements
 are given. Hence, only some of the possible CTs are appropriate and cost efficient.

 Localization Precision - m [MTA+18]
 Positioning is vital to ensure accurate tracking of devices, guarantee safety standards, and enable
 factory and process automation applications. For some use cases, accuracy within a few centimeters
 (cm) is required, whereas other applications need a positioning of some meters (m). For most control
 and automation systems, positioning precision in sub-meter accuracy is efficient. The related
 localization/positioning error, also typically given in meter, is defined as "the value of the difference
 between the estimated position of an object and its real location, according to a reference coordinate
 system".

 Communication Range - m
 The communication range in meter indicates the possible range a communication technology can
 enable the transfer of data and information between sender and receiver. Different applications
 require ranges from 'less than 1 m' while others need ranges up to 'more than 1000m'.

 Mobility – km/h
 Industrial use cases with requirements regarding communication technology can be ranked regarding
 mobility. Some applications are characterized by higher mobility, such as transportation or logistics,
 whereas others are more local and with low mobility. Configurations range from 'less than 5km/h' to
 '500km/h'.

 857008 5G-SMART 14
Document: D1.2
Version: v1.0 Dissemination level: Public
Date: 28.05.2021 Status: Final

 Figure 3.3: Classification of CTs in the morphology (maximum values)

 3.4 Goal Definition
 This section comprises technical and economic goal criteria. Goal criteria are selected based on
 literature and expert knowledge. Setting goals is essential to align a company's focus. A company can
 only manage what it can measure, and it can only improve upon something that it appropriately
 manages. Regarding the implementation of 5G, setting goals helps a company figure out what it
 expects from 5G. In this case, the framework can support a company in deciding whether
 5G technology is an appropriate instrument to improve upon its goals.

 3.4.1 Technical Goals and Manufacturing-KPIs

 In order to determine technical goals, a literature review of evaluating manufacturing technologies
 has been performed (Figure 3.4).

 857008 5G-SMART 15
Document: D1.2
Version: v1.0 Dissemination level: Public
Date: 28.05.2021 Status: Final

 Figure 3.4: Literature review of production goals

 857008 5G-SMART 16
Document: D1.2
Version: v1.0 Dissemination level: Public
Date: 28.05.2021 Status: Final

 As Figure 3.4 shows, the most frequently used technical goals are quality (12 citations),
 flexibility (10 citations), cost (8 citations), maintenance (5 citations), reliability (5 citations), and
 time (4 citations). Further frequently used goals include mobility (3 citations), production (3 citations),
 productivity (3 citations), safety (3 citations), sustainability (3 citations), and utilization (3 citations).
 Based on both literature and workshops that were held with industry partners, seven top-level
 objectives are selected to evaluate the technical potential of 5G, as Figure 3.5 shows.

 Figure 3.5: Technical goal criteria for the use case analysis

 857008 5G-SMART 17
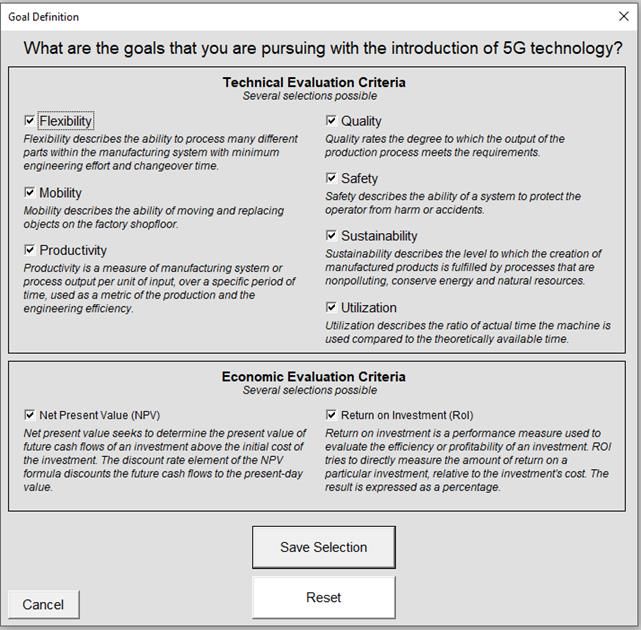
Document: D1.2
Version: v1.0 Dissemination level: Public
Date: 28.05.2021 Status: Final

 The goals are defined in the following:

 • Flexibility describes the ability to process many different parts within the manufacturing
 system with minimum engineering effort and changeover time [Lap14].
 • Mobility describes the ability of moving objects on the factory shopfloor [ISO14a, Lap14].
 • Productivity measures the output per unit of input over a specific period of time and therefore
 denotes the production efficiency [Lap14].
 • Quality rates the degree to which the output of the production process meets the
 requirements [ISO14a].
 • Safety is the ability of a system to protect itself and the operator from harm or accidents
 [ISO14b].
 • Sustainability describes the level to which the creation of manufactured products is fulfilled
 by processes that are nonpolluting, conserve energy and natural resources [Lap14].
 • Utilization is the ratio of actual used machining time compared to the theoretically available
 time [Lap14].

 As chapter 2.1.2 describes, many KPIs are existing in literature which are partially redundant or difficult
 to measure. To have a meaningful set of KPIs that reflects the goals of 5G technology implementation,
 but is still manageable, we derived a compact, but complete set of KPIs. In order to achieve this, we
 compared KPIs on the level of their formulas and elements to make sure, that important elements are
 covered, but not repeating. Figure 3.6 exemplary shows the KPI derivation for the goal Quality.

 Figure 3.6: Relation of KPI-formula-elements of the goal “quality”.

 Quality is often measured based on the produced quantity. Figure 3.6 shows the elements that are
 related to produced quantity. Based on our literature research, twenty different KPIs were found
 which are only using the shown ten elements.

 857008 5G-SMART 18
Document: D1.2
Version: v1.0 Dissemination level: Public
Date: 28.05.2021 Status: Final

 We first operationalized all KPIs. Second, we eliminated those, whose elements are not clearly
 defined (e.g. other loss) or difficult to measure. Third, based on simulations with data sets, we
 eliminated redundant KPIs. Thus, four KPIs were chosen to express Quality:

 • First Pass Yield (FPY) expresses the amount of goods meeting quality requirements in the first
 production cycle.
 • Quality Ratio (QR) calculates total amount of goods meeting quality requirements compared
 to total amount of produced goods.
 • Rework Ratio (RR) expresses the ratio of parts needing rework compared to total amount of
 produced goods.
 • Scrap Ratio (SR) expresses the ratio of destroyed parts compared to total amount of produced
 goods.

 These KPIs are assigned to their optimum max or min. Max means, that the KPI has to be increased to
 improve the goal (e.g. higher quality ratio = higher quality). Min on the other hand means, that a
 decreased KPI improves the goal (e.g. lower scrap ratio = higher quality). This trend is relevant, once
 the change of KPIs after 5G technology implementation is traced back to the goal. As all goals have a
 positive trend, the max-KPIs are added with a positive sign, the min-KPIs with a negative sign. For the
 goal Quality, this relation is expressed in Equation (5).
 ∆ + ∆ − ∆ − ∆ (5)
 Δ =
 4

 Table 3.1 summarizes the developed KPI-set. Thereby, KPIs are assigned to their respective goal,
 operationalized with a formula and assigned to an optimum.

 Goal KPI Formula & Elements Optimum

 Flexibility

 Machine Flexibility (MF) Max
 ℎ

 Setup Ratio (SUR)
 Min

 ℎ
 Material Handling Mobility (MHM) ℎ
 Max
 Mobility

 −
 On-Time Delivery (OTD) Max

 . − . − . − .
 Space Productivity (SP) Max
 .

 ∙
 Effectiveness (E)
 Max
 Productivity

 Throughput Ratio (TR)
 Max

 Worker Efficiency (WE) Max

 857008 5G-SMART 19
Document: D1.2
Version: v1.0 Dissemination level: Public
Date: 28.05.2021 Status: Final

 First Pass Yield (FPY)
 Max

 Quality Ratio (QR) Max
 Quality

 Rework Ratio (RR)
 Min

 Scrap Ratio (SR)
 Min

 Accident Ratio (ACCR) Min

 Safety

 Mean Operating Time
 + 1
 Max
 between Failures (MTBF)

 Mean Time to Repair (MTTR) + 1
 Min

 Carbon Weight (CW) ∙ ( ℎ→ 2 ) Min

 Compressed Air
 Min
 Sustainability

 Consumption Ratio (ACR)

 Electric Power

 Min
 Consumption Ratio (ECR)

 Gas Consumption Ratio (GCR)
 Min

 Water Consumption Ratio (WCR)
 Min

 Allocation
 Max
 Efficiency (AE)

 Utilization

 Availability (A)
 Max

 Technical
 . . + . .
 Max
 Efficiency (TE)
 Utilization

 Max
 Efficiency (UE)

 Table 3.1 KPI-set to quantify production process performance by implementing 5G technology

 857008 5G-SMART 20
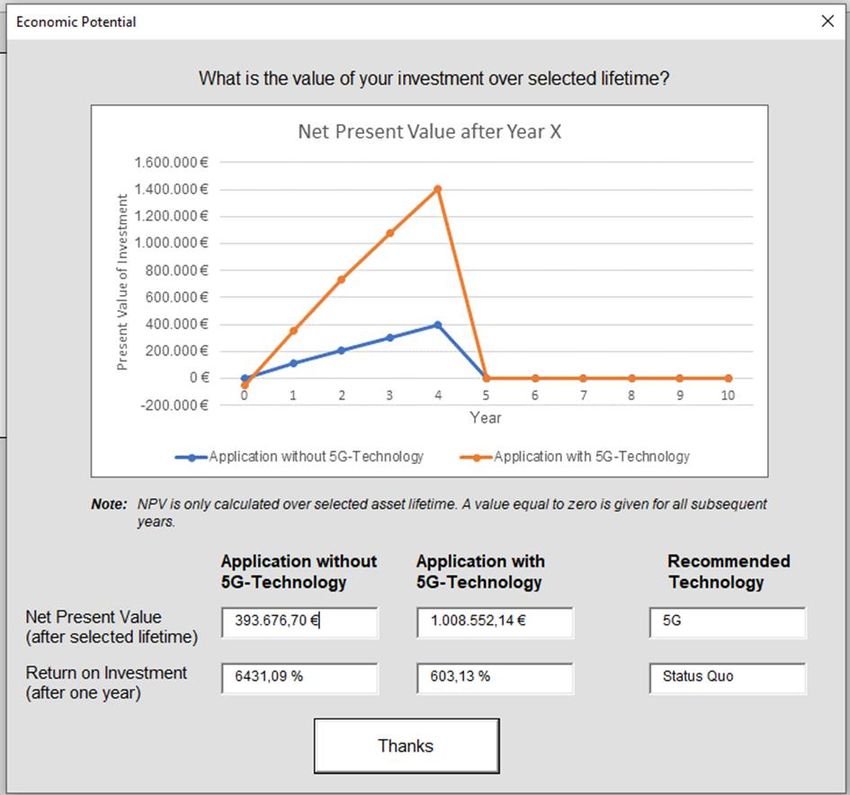
Document: D1.2
Version: v1.0 Dissemination level: Public
Date: 28.05.2021 Status: Final

 3.4.2 Economic Goals
 Net present value and return on investment are selected as economic indicators in this framework.
 The economic evaluation is complemented by technical evaluation measures to compensate for
 disadvantages of traditional economic key figures such as neglection of intangible benefits (Equations
 are given in chapter 2.1.3).

 3.5 Data Acquisition
 To realize the requirements for the data-based evaluation approach (see chapter 0), data to be
 acquired has to be defined. To clarify the definition of the word ’data’, it is defined as follows:

 • Data can be determined by a numeric value larger than or equal to zero
 • Unit of data is given and unique
 • Data is not redundant
 • Data has a direct or indirect effect on KPIs. The effect is direct when data represents a
 KPI element (e.g. produced quantity). The effect is indirect when data impacts a KPI element
 (e.g. time for repair, which impacts the KPI element rework quantity).

 Five data categories are distinguished, namely:

 • Product data (Chapter 0)
 • Process data (Chapter3.5.2)
 • Failure data (Chapter 3.5.3)
 • Facility data (Chapter 3.5.4)

 Data is collected to gain production use case-specific information. Each category is further separated
 into technical data and economic data to evaluate both the technical and economic potential of 5G.

 Chapter 0 to Chapter 3.5.4 summarize and explain the data which directly has to be acquired by the
 user of the model. The mathematical relations and equations between this data and the goals and
 KPIs are given in the appendix (see A2: Mathematical equations).

 857008 5G-SMART 21
Document: D1.2
Version: v1.0 Dissemination level: Public
Date: 28.05.2021 Status: Final

 3.5.1 Product Data
 Product data describe the quantity, quality and type of products that are produced by the application.
 Table 3.2 summarizes the necessary technical and economic product data to be acquired (sorted in
 alphabetic order).

 Necessary Product Data Explanation Unit

 In the event of individualized product variants, how
 Additional expected profit by
 much is the expected additional net profit for each Euro/part
 individualization
 sold product?
 Average material cost for Average cost spent on material to perform (manual
 Euro/part
 rework or automatic) rework of a single part
 Additional cost spent on disposal in the event of
 Disposal cost per part Euro/part
 scrap
 Number of parts that pass quality control in the first
 First time good quantity Parts/day
 instance
 Hourly wage of a worker, technician, or engineer who
 Hourly wage of rework staff Euro/hour
 is responsible for manual rework

 Inspected quantity Number of parts that undergo quality control Parts/day

 Material cost per part Average material cost to manufacture one part Euro/part

 Number of product variants per Number of product variants that same the
 Variants
 application application is able to produce
 Number of parts that application produces within
 Produced quantity Parts/day
 one day

 Quality control cost per part Average cost to control the quality of one part Euro/part

 Number of parts that require (manual or automatic)
 Rework quantity Parts/day
 rework
 Average price that a customer pays to acquire one
 Selling price per part Euro/part
 part
 Number of parts that get lost during storage or
 Storage and transportation loss Parts/day
 transportation within one day
 Time required to perform (manual or automatic)
 Time to rework Hours/part
 rework of a single rework part
 Total number of product Total number of product variants that are offered
 Variants
 variants and available for the customer

 Table 3.2 Necessary technical and economic product data to be acquired

 857008 5G-SMART 22
Document: D1.2
Version: v1.0 Dissemination level: Public
Date: 28.05.2021 Status: Final

 3.5.2 Process Data
 Process data characterize quality and type of application. The strength of the presented framework is
 that the data can be collected independently of the production process. This means that, e.g., milling
 machines and autonomous guided vehicles can be evaluated using the same framework. While this
 approach offers the evaluation of a wide range of possible production processes, generalized data sets
 carry the danger that application-specific data is not collected, so that the framework might generate
 too unspecific results which must be validated in the future. Table 3.3 summarizes the necessary
 technical and economic process data to be acquired (sorted by alphabetic order).

 Necessary Process Data Explanation Unit

 Average time during which application is not
 Application downtime Hours/day
 available per day
 Amount of time to make an application ready to
 Application setup time Hours/day
 produce a new batch
 Average cost for training of new Average cost for training of new employee to operate
 Euro
 employee the application
 Average number of shifts per Number of shifts per day a worker is involved in
 Shifts/day
 day operating the application
 Number of parts that are manufactured in a
 Batch Size Parts/batch
 production run

 Cost of cable harness Sum of material cost to set up wired connections Euro

 Average acquisition cost of one control unit or
 Cost of controller Euro/controller
 controller that is implemented into the application
 Cost of planned application
 Cost incurred from planned application downtime Euro/hour
 downtime
 Cost of unplanned application
 Cost incurred from unplanned application downtime Euro/hour
 downtime
 Average acquisition cost of one wired sensor that is
 Cost of wired sensor Euro/sensor
 implemented into the application
 Average acquisition cost of one wireless sensor that
 Cost of wireless sensor Euro/sensor
 is implemented into the application
 Hourly wage of application Hourly wage of a worker, technician, or engineer
 Euro/hour
 operator who is responsible for operating the application
 Hourly wage of a worker, technician, or engineer
 Hourly wage of setup staff Euro/hour
 who is responsible for setting up the application
 Time between the initiation and completion of the
 Lead time Hours/part
 production process to produce one part
 Number of control units per Number of controllers or control units that
 Controllers
 application application already uses to control the process
 The number of paths that an application can use to
 Number of paths reach its goal; in case of flexible routing, the number Paths
 is unlimited, otherwise, a value larger than one.

 857008 5G-SMART 23
Document: D1.2
Version: v1.0 Dissemination level: Public
Date: 28.05.2021 Status: Final

 Number of setups Number of setups within a time period Setups/day

 Number of wired sensors per Number of wired sensors that application already
 Sensors
 application uses to sense the process
 Number of wireless sensors per Number of wireless sensors that application already
 Sensors
 application uses to sense the process

 Personnel break time per shift Personnel break time per shift Hours/shift

 Work time of personnel per shift (without a break)
 Personnel work time per shift Hours/shift
 who is involved in operating the application
 Planned time during which application is not
 Planned application downtime Hours/day
 available per day
 Planned time to make an application ready to
 Planned application setup time Hours/day
 produce a new batch
 Planned time between the initiation and completion
 Planned lead time Hours/part
 of the production process to produce one part
 Planned time between two consecutive unit
 Planned runtime per part Hours/part
 completions on the application
 Planned amount of time during which part is
 Planned transport time Hours/day
 transported from one location to another
 Amount of time that elapses between two
 Runtime per part Hours/part
 consecutive unit completions on the application
 Number of potential paths in the factory that the
 Total number of paths application could use under given infrastructure to Paths
 reach its goal
 Amount of time during which part is transported
 Transport time Hours/day
 from one location to another

 Table 3.3 Necessary technical and economic process data to be acquired

 3.5.3 Failure Data
 Failure data characterize events that are neither planned nor desirable. Every failure causes additional
 time or cost expenses, so it is highly recommended to mitigate failure events. Table 3.4 summarizes
 necessary failure data to be acquired (sorted by alphabetic order).

 Necessary Failure Data Explanation Unit

 Average financial compensation Average cost incurred from financial compensation
 Euro
 cost per accident for an injured employee
 Average material cost to repair Average cost spent on material to repair the
 Euro
 application's failure application after its failure
 Average medical cost per
 Average cost incurred from an injured employee Euro
 accident
 Average cost incurred from customer complaint
 Cost for customer complaints (e.g., warranty cost, cost for gestures of goodwill, Euro/complaint
 administration cost)

 857008 5G-SMART 24
Document: D1.2
Version: v1.0 Dissemination level: Public
Date: 28.05.2021 Status: Final

 Hourly wage of a worker who is responsible for
 Hourly wage of repairment staff Euro/hour
 repairing the application after application's failure
 Number of failure events
 Number of failure events that are caused by
 caused by control system Failures/day
 application's control system malfunctions or failures
 malfunctions
 Number of failure events caused by mechanic failure
 Number of failure events
 such as leakage, overheat, loose attachments, failed Failures/day
 caused by mechanic failure
 brake system, …
 Number of failure events Number of failure events that are caused by collision
 Failures/day
 caused by collision other moving or static objects or people
 Number of failure events
 Number of failure events that are caused by disabled
 caused by disabled Failures/day
 communication
 communication
 Number of failure events caused by wrong task
 Number of failure events
 execution such as unsuccessful loading, undesirable Failures/day
 caused by wrong task execution
 position accuracy, …
 Number of failure events Number of failure events caused by a wrong setup
 Failures/day
 caused by wrong setup (e.g., too low or high speed, too low or high force, …)
 Number of failure events
 Number of failure events caused by cyber attacks Failures/day
 caused by cyber attacks
 Number of failure events for Number of failure events that occurred without
 Failures/day
 unknown reasons knowing the reason why it occurred
 Number of application-caused Number of accidents caused by application's
 Accidents / year
 accidents misbehavior
 Number of customer Number of customer complaints about quality issues
 Complaints/year
 complaints per year regarding product or process
 Number of customer orders per year for products
 Number of customer orders Orders/year
 that are produced by the application
 Number of customer orders per year for products
 Number of delayed customer
 produced by the application and which do not arrive Orders/year
 orders
 on time at the customer
 Number of human-caused Number of accidents caused by human mistakes
 Accidents/year
 accidents (e.g., striking one's head, falling down the stairs, …)
 Average cost incurred from delayed customer orders
 Penalty cost for delayed order (e.g., penalty cost, cost for gestures of goodwill, Euro/order
 administration cost, …)
 Average time between two consecutive failure
 Time between failure Hours
 events of the application
 Average time required to repair an application's
 (Time to repair)Long-term failure (including ordering spare parts, waiting for Hours
 service employees, …)
 Average time required to repair an application's
 (Time to repair)Short-term Hours
 short-term failure

 Table 3.4 Necessary technical and economic failure data to be acquired

 857008 5G-SMART 25
Document: D1.2
Version: v1.0 Dissemination level: Public
Date: 28.05.2021 Status: Final

 3.5.4 Facility Data
 Facility data refers to shopfloor layout and resource consumption of the application. Table 3.5
 summarizes the necessary technical and economic facility data to be acquired (sorted by alphabetic
 order).

 Necessary Facility Data Explanation Unit

 Annual interest rate that is used for discounting
 Annual interest rate % p.a.
 future cash flows
 Expected lifetime of application in years to calculate
 Application lifetime Years
 economic key figures
 Compressed air consumed by application within a Kilowatt-
 Compressed air consumption
 day hour/day
 Euro/kilowatt-
 Cost of compressed air Cost of compressed air per kWh
 hour
 Euro/kilowatt-
 Cost of electric power Cost of electric power per kWh
 hour

 Cost of gas Cost of gas per British thermal unit (BTU) Euro/BTU

 Cost of water Cost of water per liter Euro/liter

 Kilowatt-
 Electric power consumption Electric power consumed by application within a day
 hour/day
 Daily maintenance cost per square meter to keep Euro/square
 Facility maintenance cost
 shopfloor in a good state (e.g., cleaning staff) meter per day
 Euro/square
 Facility rental cost Rental cost per square meter
 meter per day
 British thermal
 Gas consumption Gas consumed by application within a day
 unit/day

 Location Country where factory site is located -

 Manufacturing area Area which is used to place machines or applications Square meter

 Rework area Area which is used to rework parts and products Square meter

 Area which is used to store spare parts, finished
 Storage area Square meter
 goods, …

 Total plant area Total area of a production plant Square meter

 Water consumption Water consumed by application within a day Liter/day

 Table 3.5 Necessary technical and economic facility data to be acquired

 857008 5G-SMART 26
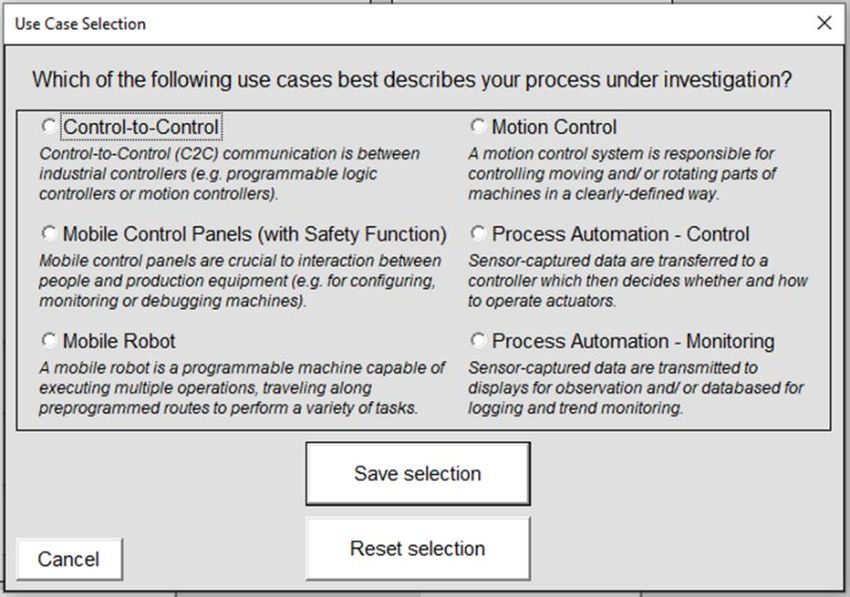
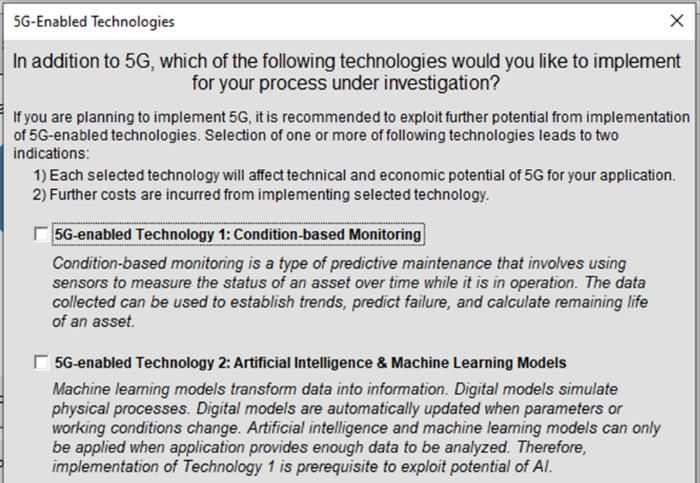
Document: D1.2
Version: v1.0 Dissemination level: Public
Date: 28.05.2021 Status: Final

 Quantification of 5G impact on data, KPI and goals
 After setting up the basic model framework, the next step is to quantify the effect of 5G on production
 use cases. Therefore, on the one hand, the implementation of 5G as a communication tool enabling,
 e.g., faster tool changes, will be considered. On the other hand, the effects of technologies being
 enabled by 5G technology will be considered. Technologies that will be analyzed in this section are
 condition-based monitoring and artificial intelligence.

 4.1 Direct 5G technology impact
 In this chapter, possible ”direct” impact of 5G on the use case and therefore its data is analyzed based
 on examples and literature. Direct impacts mean, that the influence as wireless network with high
 capabilities regarding e.g. latency and reliability (see without implementing any further technology
 is considered Probable impacts on the production process are summarized in Table 4.1 at the end of
 this section.

 Product Data

 Due to its described capabilities as communication network, 5G has an influence on the produced
 quantity (increase), scrap quantity (decrease), number of product variants per application (increase)
 and the percentage of individualized products (increase).

 Due to its high reliability and availability, 5G technology is beneficial to enable both safe and efficient
 production processes, e.g. by wirelessly controlling AGVs or machine tools and enabling control loops
 that could not be realized before due to cable or network limitations. This reduces abrupt stoppages
 and short-term failures and enables stable production process. Thus, probability of produced quantity
 increases while probability of producing scrap is reduced. Furthermore, seamless integration of 5G
 will favor on-demand manufacturing [5GACIA2]. Being wireless and not limited to its factory location,
 machines can be relocated to corresponding production line so that additional manufacturing
 resources can be added [5GACIA2]. Machines can therefore be relocated for individual production
 program for each product variant which allows to manufacturing products directly according to
 customers’ order [GEV20]. As a result, both number of product variants per application [Adi19] and
 percentage of individualized products increase [5GACIA1, EH20].

 Process Data

 In the category process data, 5G is expected to decrease the application set-up time, the unplanned
 application downtime and the lead time.

 Each interruption of communication can cause system failures and downtime. 5G’s high reliability
 assures consistent and continuous operation of applications that leads to safe, high-availability and
 uninterrupted processes. High availability and reliability of 5G communication technology and thus
 the process control facilitates high productivity of production lines. Whereas tools connected via e.g.
 Bluetooth or Wi-Fi are sensitive to interference, 5G connections are more stable [WG20]. Any
 transmission delay or failure can cause unplanned application downtime because task cannot be
 executed properly [5GACIA1], which is therefore decreased by 5G.

 857008 5G-SMART 27
Document: D1.2
Version: v1.0 Dissemination level: Public
Date: 28.05.2021 Status: Final

 Furthermore, being a wireless technology, 5G facilitates reconfigurations and tool set ups. In case of
 e.g. tool change or damage, machine tools or robots need to be reconfigured. Resetting an industrial
 robot into a safe restarting position can cause several minutes of application setup time [5GACIA3].
 70% to 80% of installation costs resulting from cabling can be saved through using 5G [BOS+20].
 Setting up wired connections is not only expensive but also time-consuming because each connection
 between machines and sensors must be carefully planned and tethered to a specific location. By using
 5G, application setup time is reduced.

 Failure Data

 In the category failure data, 5G is expected to decrease the number of application-caused accidents,
 the number of delayed customer orders and the time to repair.

 Wired connections usually work reliably but in case of failure, it might be hard to find the failure cause.
 Unplugged cables are easy to detect but detection of cable breakage is often based on assumptions.
 By using wireless connections, it will probably become easier to repair because it will not be necessary
 any more to examine the whole wiring harness. Instead, the replacement of affected sensors will be
 sufficient. In this way, time to repair decreases [BOS+20].

 For certain safety functions, transmission time under 1 ms are required [5GACIA3]. 5G with Ultra
 Reliable Low Latency Communication (URLLC) features can fulfill this requirement and is therefore an
 appropriate communication technology for safety installations to minimize the number of application-
 caused accidents.

 For manufacturing industry, cyber-attacks can lead to fatal consequences such as reduced earnings
 through lost customer trust, delayed product’s launch, or increased warranty costs [AC19]. In 2019,
 more than 20% of the companies surveyed have been victim of a cyber-attack on their smart
 manufacturing initiatives [EH20]. Cisco expects number of cyber-attacks to grow by 14% per year with
 over 20% of the attacks greater than 1 Gbps which is enough to take most organizations completely
 offline [CIS20]. As a result, the number of failure events caused by cyber-attacks is expected to grow
 which is why Industry 4.0 solutions, including 5G networks must integrate security mechanisms.

 857008 5G-SMART 28
You can also read