OECD-IMF WORKSHOP Real Estate Price Indexes Paris, 6-7 November 2006
←
→
Page content transcription
If your browser does not render page correctly, please read the page content below
OECD-IMF WORKSHOP

                   Real Estate Price Indexes
                   Paris, 6-7 November 2006

                                       Paper 7

Real estate price indices in Germany: past, present and future

                Johannes Hoffmann and Andreas Lorenz
                       (Deutsche Bundesbank)

      Electronic copy of this paper is available at: http://ssrn.com/abstract=970241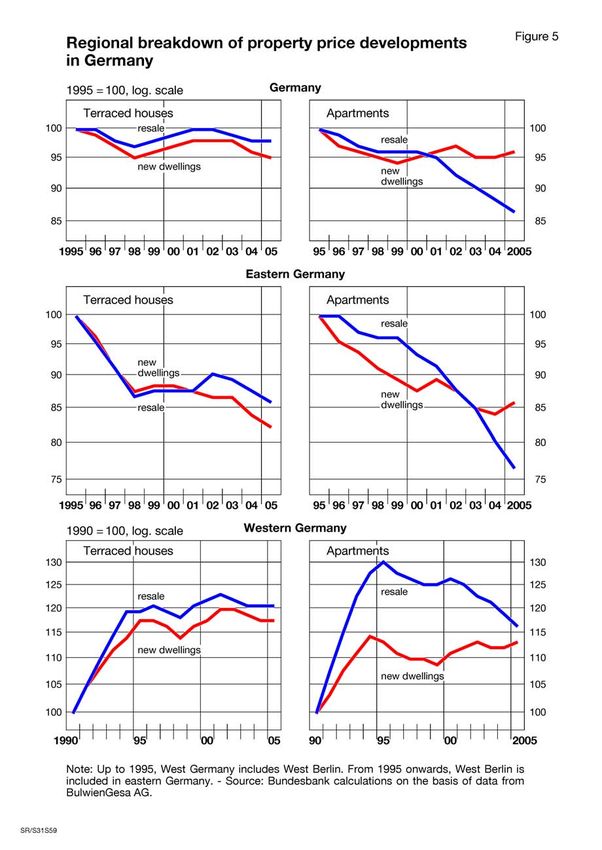
Johannes Hoffmann / Andreas Lorenz
Economics Department / Statistics Department
Deutsche Bundesbank

Real estate price indices for Germany:
past, present and future∗
Paper prepared for the OECD-IMF Workshop on real estate price indexes,
Paris, 6-7 November 2006

Revised draft of 30 November 2006

Abstract

In the past, information on residential property price developments in Germany
could be inferred only from a small number of indicators of sometimes dubious
quality. These indicators often lacked a clear methodological foundation and had
a restricted coverage. Moreover, they gave – to some extent – contradictory
signals. The Bundesbank residential property price indices derived from
BulwienGesa data, which was released in 2003, brought some improvements
with respect to intertemporal comparability. The main weaknesses of the
Bundesbank indicators are the reliance on expert assessments instead of true
transaction data and the limited coverage (only cities). Still, the
BulwienGesa/Bundesbank indicators remain the market leaders in Germany. The
increasing use of the internet for residential property transactions and finance
has provided additional indicators. However, the future will belong to hedonic
indices. The German Federal Statistical Office is developing hedonic indices
based on data gathered by local expert committees for property valuation. Due to
the federal structure of Germany, however, it is very difficult to compile
comparable data from all over the country. The Association of German Pfandbrief
Banks is developing hedonic property price indices based on data gathered in the
course of its member banks’ commercial operations, and it invests heavily in
improving the quality of the raw data. The main motivation behind this effort is
compliance with new capital adequacy requirements. As a by-product, high-
quality hedonic property price indices for Germany might emerge, covering not
only residential property but also commercial property.

Keywords: asset prices, real estate, price index, Germany

JEL classification: C43, E31, R21, R31

Contact:        johannes.hoffmann@bundesbank.de
                andreas.lorenz@bundesbank.de

∗
  This paper presents the authors’ personal opinions and does not necessarily reflect the
view of the Deutsche Bundesbank or its staff. For the synopsis of the various property
price indicators it benefited heavily from work done by the Bundesbank’s Statistics
Department. We would like to thank Hans-Albert Leifer for valuable suggestions.

Electronic copy of this paper is available at: http://ssrn.com/abstract=970241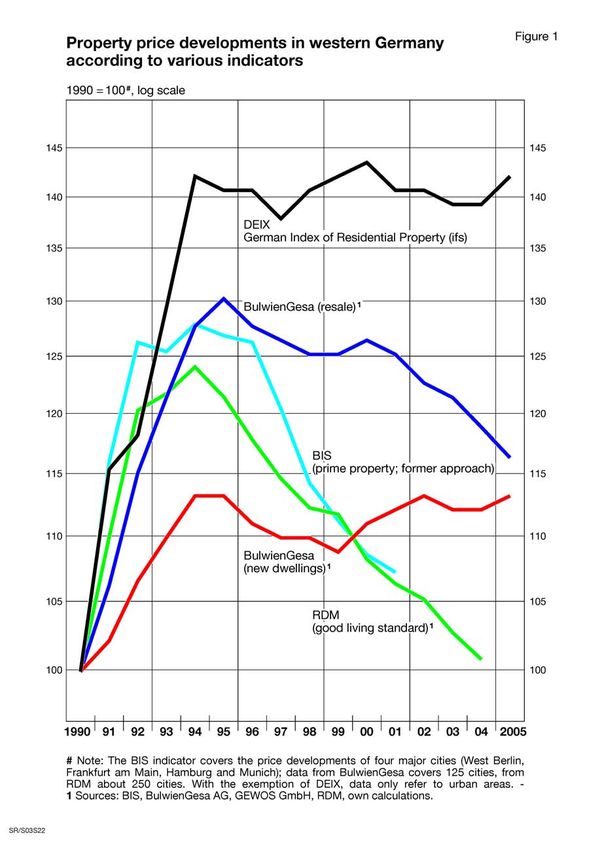
I Introduction

   Since the late 1990s, asset price developments have moved increasingly into
central bankers’ radar screens. While consumer price inflation appeared to be
well anchored at historically low and stable levels, excess liquidity seemed to flow
into asset markets and drive prices up, thereby increasing the risk of creating
bubbles, probably followed by crashes. Pronounced fluctuations in asset prices,
however, may undermine macroeconomic stability and erode the soundness of
the banking industry. In the “brave new world of central banking”, timely
information on the path of asset prices is crucial for the effectiveness of monetary
policy and for the supervision of the financial system, as Cecchetti (2006)
recently emphasised. While the availability of such data is assured with respect
to most financial assets, the situation is worse with respect to residential property
and much worse with respect to commercial property. The fact that the
International Monetary Fund devoted a full chapter of its Compilation Guide on
Financial Soundness Indicators to real estate price indices (IMF, 2004) also
highlights the need for appropriate commercial and residential property price
indicators.
   From a theoretical point of view, several authors have advanced the opinion
that house prices should be incorporated into the target price index of a central
bank (eg Bryan/Cecchetti/O’Sullivan, 2002) or into an index used for
compensation (eg Reis, 2005). While these positions are not undisputed –
Mankiw/Reis (2003), for example, advocate the use of a stability index that gives
substantial weight to wages, which are rather sluggish and bubble resistant – it is
generally agreed that a cost-of-living index has to cover owner-occupied housing,
either in the rental equivalence or the user cost variant (Diewert, 2003). Within a
cost-of-goods index (a “pure” price index) – the euro-area Harmonised Index of
Consumer Prices (HICP) follows this approach – the net acquisition of residential
structures should be considered (ILO et al, 2004, Chapter 23). All this cannot be
achieved without reliable property price indices. Even adherents to the rental-
equivalence approach would like to know whether this approach gives a
reasonable approximation to the user cost of capital.
   The present paper describes the gloomy past, the brighter present and the
hopefully radiant future of property price statistics in Germany. As in many other
countries, there exists at present no official property price index for Germany.
Information on property price developments can be acquired, however, from an
increasing number of private data suppliers. The quality of the data is sometimes
not too bad, but other times rather poor. The main problem is that in Germany
there exists no centralised register of residential property transactions, and the
existing decentralised registers are not well coordinated. Although transaction
prices are collected by the local expert (surveyor) committees for property
valuation (Gutachterausschüsse), these data pools are not standardised across
federal states – sometimes not even within states.
   A leading theme of the present paper is the slow relaxation of data constraints.
In the past, it was mostly the lack of adequate data, which impeded the

                                         1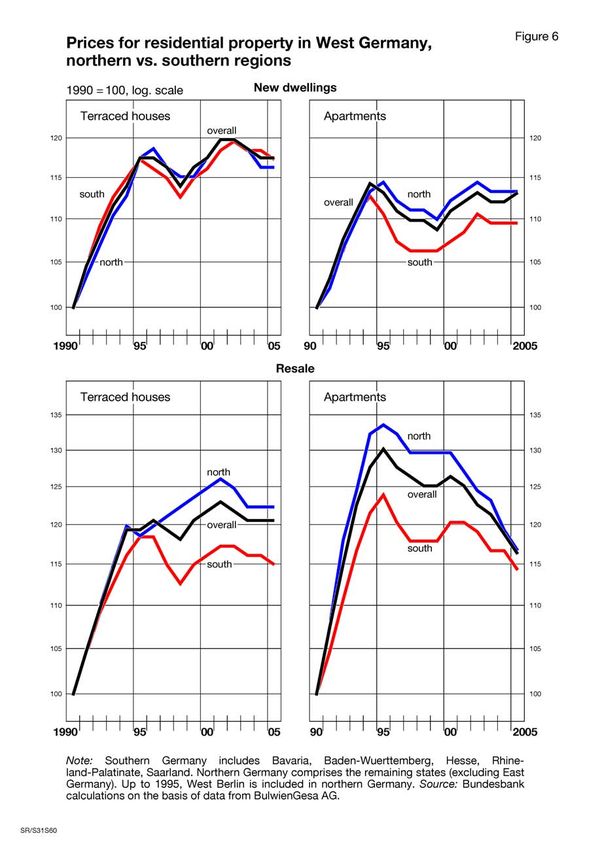
development of fully satisfying house price indicators for Germany. This lack of
data even led to German academic research on property markets being
conducted using Paris housing market data (Maurer et al, 2004). In the
meantime, however, the German Federal Statistical Office has started
negotiations with the expert committees for property valuation of the federal
states (Landesgutachterausschüsse), which in some way coordinate the work of
the local surveyor committees. This effort might lead in the medium term to a
standardised register containing transaction prices and the corresponding
property attributes, which might serve as a basis for calculating high-quality
property price indices. Also, member banks of the Association of German
Pfandbrief Banks have started to pool data on property transactions. And finally,
the internet, which is becoming increasingly important as a “virtual” marketplace
for property transactions and mortgaging, is offering new opportunities for
gathering the relevant data.
   The paper is structured as follows. Section II discusses the data requirements
of various types of property price indices. Section III reviews present day property
price indices in Germany with a look back, and section IV describes property
price indices currently under construction. Section V concludes.

II Variants of property price indices and data requirements

   The fundamental principle of price statistics is that “like” shall be compared
with “like” only. In consumer and producer price statistics this demand is normally
met by the “matched models” methods. Only if models cannot be matched
exactly are prices to be made comparable via quality adjustment (ILO et al, 2004,
Chapter 7; IMF et al, 2004, Chapter 7). Following the prices of comparable
products over time is the preferred method of compiling price indices. Comparing
the prices of non-comparable goods is the exception and not the normal case.
   The specific problem with measuring changes in property prices is the near-
infeasibility of the matched-models method. Due to the heterogeneity of
residential property and the slow turnover, it is only by chance that transactions
relating to comparable objects can be observed in a sequence of periods. Hence,
when comparing prices over time, either the comparability requirements have to
be relaxed, or the prices for non-comparable items have to be made comparable
using more or less sophisticated methods. Comparing the prices of non-
comparable objects thus seems to be the rule rather than the exception.
    The most simplistic approach to comparing property prices over time is to take
average transaction values. This so-called “unit-value method” forfeits – if applied
to non-comparable objects – the comparability requirement more or less fully. A
unit value index is compiled from average transaction values in the base and in
the observation period, meaning that changes in the pattern of transactions
impact on the index. The “true” price trend can be recovered by this method only
if perfect structural stability is assured. Given the pronounced heterogeneity of
the housing stock, however, this demand is extremely unlikely to ever be met. By

                                         2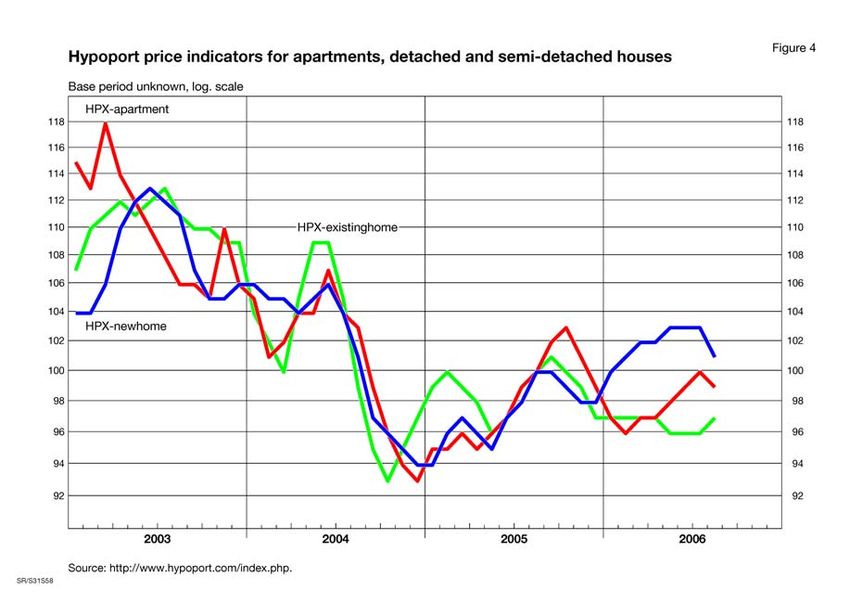
compiling unit value indices separately for specific regions and property types –
this is the so-called classification method – the effects of changes in the
composition of the sample of transactions can be minimised. Properly weighted,
the result is an index with mix adjustment (Thwaites/Wood, 2003). In the limit,
with the number of non-overlapping categories increasing, the unit value indices
will converge to matched-models indices. In practice, however, the stratification
of property types and regions has to be rather rough, as otherwise no
corresponding objects would be found and cells would be left unfilled
(Ahnert/Page, 2005). Sometimes a basic quality adjustment will be performed by
taking the price per square meter (which presupposes that the size of the living
space is known). Taking the median price instead of the average will remove
undue influences of outliers. But even then such indices are probably distorted by
changes in the composition of transactions. The major advantage of the unit-
value approach is that the data requirements are not very strict. For the most
simplistic variant just the transaction values have to be known. More ambitious
indices, however, require additional data on location and characteristics.
    Repeat sales indices try to mimic the matched-models approach of goods and
services price statistics. For the compilation of such indices, only properties sold
at least twice within the period under review are considered. The data
requirements of this approach are minor, but its limitations should be obvious.
First, the price developments of property that is resold within a rather short period
might be unrepresentative of overall price developments (this is the sample
selection bias of the repeat-sales model – see Meese/Wallace, 1997). Second,
the characteristics of a property may change over time, either due to wear and
tear or due to renovation and additions and alterations (Englund et al, 1999). And
third, repeat-sales indices are prone to revisions, as each reselling of a property
adds an observation on price change which affects not just the estimate of
average price change for the present period but for the full time span between
two transactions (Clapham et al, 2006). Especially for short-term price
comparisons, the repeat-sales method is inadequate, as the share of prices
actually observed which enters into the index compilation is close to zero.
   Hence, the preferred method of compiling property price indices would be one
which makes full use of the available information by taking all transactions into
account – as the unit value method does – but at the same time tries to achieve
comparability over time – as the repeat sales-method does, but without forsaking
representativeness. The hedonic regression method tries exactly to do this by
relating the prices of residential property to its characteristics.1 A major
requirement of this approach is a comprehensive and standardised description of
the transacted properties, with respect to location, physical characteristics of the
building, furnishing and condition.2
1
  On the hedonic approach with respect to residential property see Sheppard (1999). The
hybrid repeat-sales hedonic model proposed by Case/Quigley (1991) unites the matched-
models method for properties that were at least sold twice in the period under review and
the hedonic method for the remaining properties.
2
   In this context, it must be noted, however, that the data requirements of the
classification approach are not less demanding.

                                           3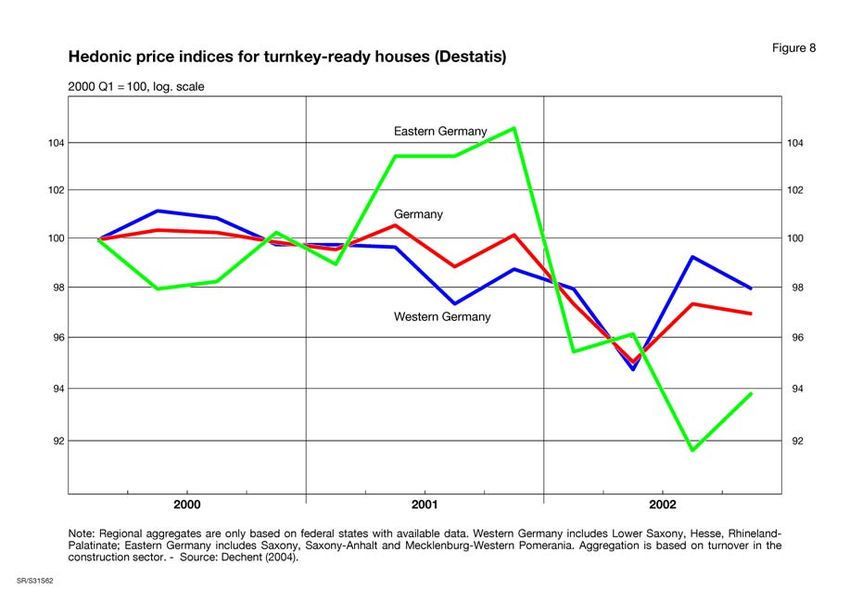
One can imagine that for a full description of properties thousands of attributes
would have to be considered. Even if it were feasible to gather all this
information, in a hedonic regression it would rapidly consume the degrees of
freedom provided by the number of observations. Properties located in a poor
neighbourhood, however, are typically poorly equipped and often in a poor
condition, and vice versa. Hence, the true problem with the estimation often is
that there is not enough variance in the data. Ways out of this dilemma include
consolidating information via expert knowledge or statistical techniques such as
principal component analyses (or multiple correspondence analysis as performed
by Arévalo/Ruiz-Castillo, 2006) or restricting the analysis to a small number of
attributes, hoping that these variables will also capture the effects of the omitted
characteristics.3 Parsimonious hedonic models tend to work reasonably well if it
is not the estimation of implicit characteristics prices but the estimation of quality
adjusted prices which is the goal (Malpezzi et al, 1998).
    Instead of confining the expert judgment to the rating of properties according
to location, furnishing and condition, one might go a step further and directly ask
local property experts for an assessment of the typical selling price of a typical
flat. This approach is only advisable if no true transaction data are available or if
the available transaction data only include prices and not much additional
information on the characteristics of the transacted properties.
   With true transaction prices not always available, the alternative of list prices
or advertised prices may be considered. Advertised prices will be different from
selling prices. Normally list prices will exceed transaction prices (eg Horowitz,
1992), and the spread between list prices and transactions prices may vary with
the state of the housing market, as there are reasons to believe that asking
prices are even more rigid downwards than selling prices. Whereas the spread
as such does not render the information in advertised prices useless, its
variability reduces the information content of advertised prices. Price indices
based on list prices might, however, be useful as complementary indicators, as
changes in the spread between ask and transaction prices may indicate turning
points of the housing market.
   Specific problems arise if new homes prevail in the transaction data set. The
construction of new residential property occurs typically at the fringe of the
metropolitan areas, meaning that the more inelastically supplied property in the
centre of the metropolitan area increases faster in price. Hence, a price index
restricted to new residential structures which does not control adequately for
location may underestimate true property price inflation (McCarthy/Peach, 2004).
More importantly, without controlling adequately for location, the prices of new
property which are farther out of town will be compared to earlier-period new
property located closer to town. This also will bias indices focussed on new
property downwards (Shiller, 2005).

3
 See Triplett (2006) for an extensive discussion of the effects of omitted variables on
hedonic coefficient estimates and on hedonic indices.

                                          4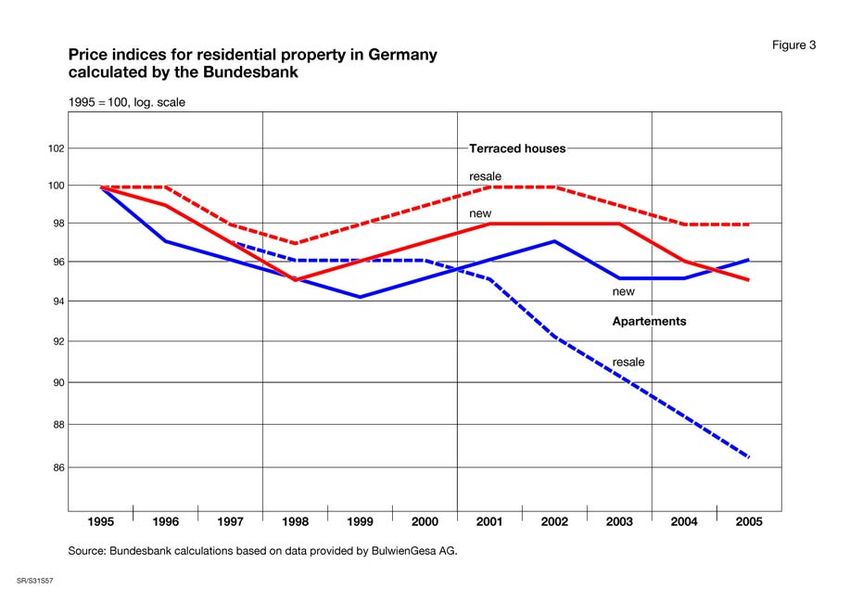
As property is immobile, diversity in regional economic developments will
impact on regional property price developments. Especially in the case of large
countries, price developments can be rather diverse. This diversity calls for a
broad coverage of regions and for adequate weighting. In this context the
question as to whether residential property price indices should be transaction- or
stock-weighted is a largely unresolved issue. A transaction-based approach is
often considered to be more representative of the actual market situation and to
be more appropriate for a price index considering housing as a durable good,
whereas a stock-based approach may be more appropriate for analysing wealth
effects (eg Ahnert/Page, 2005; Fenwick, 2005). At first glance, this line of
reasoning seems to be perfectly fine. It is, however, often observed that, in the
housing markets, the volume of transactions varies with the direction in the
change in prices (eg Genesove/Mayer, 2001). Prospering markets tend to be
characterised by increasing prices and a high volume of transactions, whereas in
depressed markets the volume of transactions tends to be much lower.
   These characteristics of property markets have important consequences for
the behaviour of prices indices. Consider, for example, a demand shock which
hits a specific segment of a housing market and then spreads out to other market
segments. A transactions-weighted (unit value or Paasche price) index would
indicate a huge increase in prices in the period of the primary shock, whereas in
consecutive periods only small price changes would be recorded. This
phenomenon is illustrated in Table 1. The highly stylised economy consists of five
submarkets with housing stocks and initial prices of the same size, and the same
steady-state level of transactions. Supply is fully inelastic. A demand shock is
supposed to lead to a doubling of prices and to a 400% increase in the volume of
transactions in submarket A. After the increase in prices, the volume of
transactions falls back to steady-state levels. In the consecutive periods, the
shock spreads out to other market segments. In the final period, all prices have
doubled, but transaction volumes are back at steady-state levels. With inelastic
supply, stock-weighted Laspeyres, Paasche, and Fisher price indices would
indicate an overall increase in prices of one-fifth per period, which seems to be a
sensible result, as in each period the price in one of the five sub-segments
doubles. The average of unit values calculated separately for each of the five
submarkets gives the same result (if prices in the base period are identical).
   Transactions-weighted indicators, however, tend to bring forward most of the
price change. Only if base-period transactions are strictly proportional to stocks,
transaction-weighted Laspeyres indices give the same results as stock-weighted
indices. In the base scenario, the unit value indicator and the Paasche indicator
estimate a price change of nearly 60% for the first period and only small changes
afterwards. The situation is even worse if the base period price distribution is not
even. Transaction-related unit-value indices may then even overshoot the true
price increase for any property. With respect to the Laspeyres-Paasche spread,
the positive correlation between prices and transactions will turn it negative. As a
consequence, chaining will drive indices further apart, with transaction-weighted

                                         5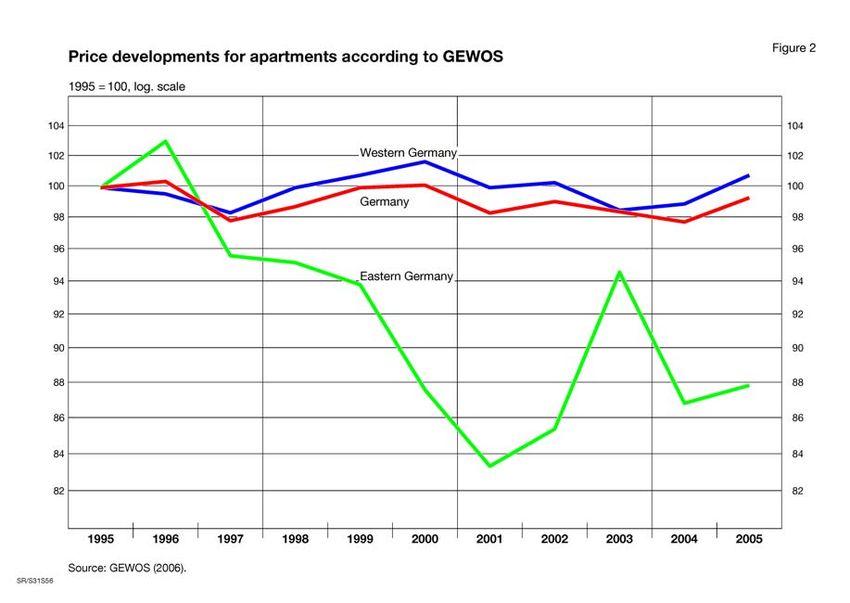
chained Laspeyres indices being seriously biased downwards.4 Summing up,
there are strong arguments in favour of stock-weighted property price indicators,
whereas transaction-weighted indicators seem to send out dubious signals.
   For a timely assessment of housing market conditions, not just annual
changes but also price developments within a year should be considered. The
European Central Bank would like to add quarterly residential property price
indexes to its set of monetary policy indicators, but due to the lack of adequate
data from several countries (including these Germany), it has to settle for an
annual indicator (Ahnert/Page, 2005). With temporal disaggregation, however,
the need for broad coverage, adequate quality adjustment and weighting
increases, since shortening the observation period reduces the number of
observations and makes changes in the structure of transactions more likely.

III Present day residential property price indices in Germany

     At present, current official statistics for the housing market cover the prices of
building land and of constructing residential buildings. In addition, the German
Consumer Price Index (CPI) contains a rent component, which is also supposed
to represent owner-occupied housing via the rental-equivalence approach.5
Official statistics on residential property prices are not provided. However, this
does not mean that there are no indicators from non-official sources that claim to
fill the gap. On the contrary, the vacuum in official statistics has brought an
increasing number of price indicators calculated by a variety of institutions
involved in some way or another in the market for residential property.6 These
indicators differ widely in terms of data source, methodological foundation,
regional scope and kind of housing stock covered. Among the targeted users are
building and loan associations, project developers, investors, real estate agents,
experts and appraisers and other persons working professionally with residential
properties. Finally, commercial banks use the data with the aim of estimating
credit default risk according to the forthcoming Basel II capital adequacy
standards.
   When evaluating the usefulness of different indicators for inferring overall price
trends, it is important to ascertain how representative the data base is for the
German residential property market and how useful it is for making intertemporal
comparisons. In order to be representative for the whole market, prices should be
observed for a large number of objects across the relevant geographic regions,
including urban and rural areas and cities of different sizes. As intertemporal
4
  This finding raises some doubts as to whether transactions-weighted house price
indices are really the appropriate approach to owner-occupied housing in the annually-
chained Laspeyres-type Harmonised Consumer Price Index. At least, multi-year
averages of weights should be considered.
5
  On the various official indicators, see Deutsche Bundesbank (2003b). The rent and
rental equivalence component in the German CPI are analysed in Hoffmann/Kurz (2002)
and Kurz/Hoffmann (2004).
6
  For a review of residential property price indicators in Germany, see also Rady/Russig
(2004) and Hofer (2005).

                                           6
price comparison is concerned, either typical cases should be considered or
differences in characteristics removed by means of hedonic quality adjustment.
The ultimate goal is to have a pure price comparison that is not influenced by
quality changes (ie changing composition of characteristics of residential
property) and structural changes (ie urban or rural areas, small and big cities). A
synopsis of available property price indicators is provided in Table 2.
Among the candidate sources of information on residential property prices are
public and private institutions with direct access to data, such as the local expert
(surveyor) committees for property valuation, real estate agent associations,
building and loan associations, mortgage banks, periodicals, online marketplaces
and tax authorities. The enumerated entities have in common that they are, as a
by-product of their daily business, regularly confronted with a high number of
price observations. For example, as a natural outcome of their job, real estate
agents have an expert insight into residential property market developments.
Hence, real estate agents associations have, at least in theory, the necessary
data for the construction of price indices for residential property. However, the
knowledge of the real estate agents is local and decentralised. It has to be
standardised and pooled to become useful for nationwide property price
indicators. The same applies to the information gathered by building and loan
associations and mortgage banks. These institutions are typically specialised
in providing mortgages for specific (regional) segments of the residential property
market.
The same applies also to the information gathered by the local expert
committees for property valuation (Gutachterausschüsse). The main task of
these expert committees consists in collecting data concerning prices and
characteristics of buildings and dwellings and in estimating the value of houses
and land. Price and locational data of recent property transactions are provided
by notaries, whereas data on further characteristics must be gathered by the
expert committees themselves. This usually takes the form of a questionnaire
which is sent to the buyer and/or seller of a property, who is, however, not
obliged to fulfil the request. The expert committees are independent, but
regulated by the Bundesländer. This regulation is rather diverse, and as a result
this applies also to the organisation of the expert committees. Some committees
were established at the district level, others at the municipality level. Moreover,
the data are not harmonised across the different committees. The raw material
available in the different local committees is highly heterogeneous and the
availability with respect to timeliness is quite diverse, so that there are huge
problems regarding standardisation of data even at the level of the
Bundesländer, not to mention the federal level.
7A Traditional property price indicators
It should therefore not come as a surprise that many of the traditional indices
are based on raw data provided by the German Real Estate Association IVD
(Immobilienverband Deutschland). IVD was founded in 2004 as a merger of the
German Real Estate Agents Association RDM (Ring Deutscher Makler) and the
Association of German Real Estate Agents VDM (Verband Deutscher Makler).
Both associations used to publish annual residential property price reviews
(Immobilienpreisspiegel) based on information gathered by the associated real
estate agents. Especially the RDM Immobilienpreisspiegel has a long tradition
dating back to the 1970s. The new IVD Wohnimmobilienpreisspiegel can be
regarded as a continuation of the traditional RDM/VDM price reviews. The main
focus of the Wohnimmobilienpreisspiegel is on regional information on price
levels of typical residential property. Some information about price developments
over time is provided only as a supplement. The IVD price review publication
covers prices on many different types of objects from nearly 300 cities. The basis
for the data set is transaction data from the second quarter of the respective
year. Associated agents report transaction prices for a specific city. After
collection, the prices are processed and condensed and outliers are deleted. The
different real estate objects are summarised into categories or types, location and
quality of living being the most important criteria for the categorisation. An
example of such categories is detached homes (incl garage and a large lot
according to location). Further quality nuances considered are simple quality
(with simple furnishing, about 100 square metres), middle quality (middle quality
of location with balanced population structure, about 125 square metres living
area, central heating, bath, WC) and good quality (one-family home in good
location, but not a prestige area with good furnishing and building substance,
central heating, about 150 square metres). As a general rule, the prices reported
in the Wohnimmobilienpreisspiegel follow the idea of the mode. Nationwide
aggregates are not computed.
Due to the importance of information on property price developments for
monetary policy, the Deutsche Bundesbank began to monitor prices in the
German residential real estate market at a very early stage (for details, see
Leifer, 2004). From the late 1980s on, the Bundesbank used RDM data to
compile price indicators for apartments, terraced houses and detached houses of
a middle quality, covering 50 West German cities. Using the population figures of
a fixed base year as a weighting scheme, the Bundesbank aggregated the city-
specific RDM data in order to obtain a price indicator for West Germany. From
the beginning, the Bundesbank was aware of the fact that the quality of the raw
data used to obtain its property price indicator could not satisfy the high
standards of official statistics. With this limitation in mind, it never was the goal of
the Bundesbank to analyse its price indicators up to the last decimal place, but to
facilitate a cautious inference about the general price trend they conveyed. The
Bundesbank price indicators derived from RDM data were never published.
8In the following years, a number of problems with the RDM data became
apparent. These problems comprised missing values for some cities, for which
estimates had to be imputed; structural breaks due to changes in the reporting
real estate agent7 and apparently excessive volatility in boom and recession
cycles, presumably due to a systematic bias in the reported prices. In the mid
1990s, the Bundesbank compared property price data of different sources with
the aim to provide a more solid and broader data basis for the regular calculation
of price indicators. After some considerations, it decided to use data from
BulwienGesa AG, a leading German real estate consultancy, as these data
seemed to display a higher degree of intertemporal consistency than the RDM
data.
The BulwienGesa AG data stem from a comprehensive annual survey of
regional property markets. Correspondents of the BulwienGesa AG estimate
typical rents and purchase prices of specific types of commercial and residential
real estate. Information derived from the work of building and loan associations,
research institutions, surveyor committees, real estate associations, chambers of
trade and industry and independent experts etc flow into these estimates. The
intention is to capture the specifics of regional differences in price movements.
Rural areas are not considered. In accordance with the typical case method, the
indices are calculated separately for various types of property and various
regions in order to eliminate the most serious structural effects. Afterwards, the
indices are condensed into overall indicators by means of suitable weightings.
The typical properties considered by BulwienGesa are terraced houses offering a
satisfactory living standard in average to good locations with approximately 100
square metres of living space and owner-occupied dwellings, likewise providing
satisfactory living conditions in average to good locations, with approximately 70
square metres of living space. The total price is shown in the case of terraced
houses and the price per sqm in the case of owner-occupied dwellings.
BulwienGesa calculates retrospectively up to 1990 typical prices for new
dwellings and for second-hand accommodation separately; the data prior to 1990
refer to new dwellings. The findings of the annual survey are summarised in the
report “Immobilienindex”.
For the calculation of its own residential property price indicators, the
Bundesbank uses objects with good quality of living in middle to good locations,
the apartments having about 70 sqm and the terraced houses about 100 sqm of
living area. Initially, data from 60 German cities (western Germany: 50 cities,
eastern Germany: 10 cities) was used. Now, the sampling universe comprises
data from 125 cities (western Germany: 100, eastern Germany: 25). Within each
of the real estate categories (apartments, new dwellings and second-hand;
terraced houses, new dwellings and second-hand) the city-specific data are
aggregated with population figures from the year 2000 to different regional and
7
For example, the new agent may take central locations into account, whereas the “old”
agent may also include the suburbs when providing the estimate of his region.
9nationwide aggregates (Germany, western Germany, eastern Germany).8 These
dwelling-specific indices are disseminated to the interested public. Further
aggregates (northern Germany, southern Germany, cities with more than
500,000 inhabitants, cities with more than 250,000 and less than 500,000
inhabitants, cities with less than 250,000 inhabitants) are compiled for
Bundesbank purposes only and are not regularly published.
As the aggregation among different types of dwellings is concerned, the
Bundesbank also calculates indices which cover apartments as well as terraced
houses. In the case of second-hand dwellings, the additional weights were
derived from total living space as recorded by the microcensus complementary
survey of 1998 and the building activity statistics. In the case of new objects, the
weights were derived from the cost of the completed building contained in the
official building activity statistics. The indices for newly constructed dwellings and
for second-hand dwellings are not aggregated.
As regards data availability, the figures for overall Germany and eastern
Germany are available from the beginning of 1995 onwards at yearly frequency.
BulwienGesa also reports data for the first half of the 1990s for eastern Germany.
However, the explanatory power of the data is not overly high for this period, so
that figures from the early 1990s are not considered by the Bundesbank. In the
case of western Germany, data on resale start in 1990 and for new dwellings in
1975. The data from BulwienGesa are available in spring of the year following the
reporting year. As IVD data for the second quarter of the reporting year are
available in late summer or autumn of the same year, the Bundesbank has been
using IVD data in order to extrapolate the BulwienGesa data, thus producing a
first “flash” estimate, which is, however, not published.
The price indicators for residential property calculated by the Bundesbank on
the basis of BulwienGesa data were initially used for internal purposes only. And
this restrictive use of the data would have prevailed until the present, if there
were no other events that left the Bundesbank with no other way than to make
available their own calculations to the general public. In the 1990s, the Bank for
International Settlements BIS published in its annual report (BIS, 2002, 130)
price indicators for residential property for Germany which were in stark contrast
to the indicators preferred by the Bundesbank (Figure 1). According to the figures
cited in the BIS report, since the mid 1990s residential property prices in
Germany fell by 2.5% per annum. The BIS figures were used by other institutions
for their analysis of the German economy, including the OECD, European
Commission and commercial banks, and could have given reasons to postulate a
deflationary process in Germany. Since the indicators of the BIS, which were
based on the unweighted arithmetic mean of the prices from RDM for flats of
8
The use of fixed population figures from the year 2000 for the whole sample (the West
German data for new dwellings begin in the year 1975) may be subject to criticism.
However, the population structure does not change dramatically. For example, if an
alternative calculation is performed for the old sampling universe of Germany (50 cities)
that does not use the population figures from the year 2000, but those from the year 1975
as the weighting scheme, then both price indicators still show very similar price dynamics.
10middle quality in only four big cities (West Berlin, Frankfurt am Main, Hamburg
and Munich), the Bundesbank did not consider these data as being
representative for Germany. Therefore, and despite its many reservations, the
Bundesbank decided to make its own price indicators for residential property
available to the general public.9 The price indicators calculated by the
Bundesbank may not describe the reality exactly, but may be nearer to the truth
than the BIS figures. They can be seen as a “second best” approach to the
problem of missing official statistics on residential property prices. Since then,
BIS has been using the Bundesbank data for its analyses and reports.
A further institution that traditionally provides regional data on real estate
prices is the Central Office of the Regional Building and Loan Associations
LBS (Bundesgeschäftsstelle der Landesbausparkassen). With yearly frequency,
it publishes the LBS-Immobilienpreisspiegel, whose data is based on the price
information gathered as a by-product of its mortgage financing and real estate
business. The LBS data contain information about the price development in 600
cities. The LBS reports the mode and the price ranges as gathered from local
property market experts in a survey conducted in spring of each year. The price
information covers apartments and single-family homes. The focus of the LBS-
Immobilienpreisspiegel is on regional property price levels. No price changes are
reported.
B More recent property price indicators
Neither IVD nor BulwienGesa nor LBS claim full regional coverage of the
German residential property market, which causes problems when using their
data to draw conclusions about overall price trends. One particular institution that
does declare full regional coverage of the German market for residential real
estate property is the Institute for Urban, Regional and Housing Research
(Institut für Stadt-, Regional- und Wohnungsforschung) GEWOS GmbH. GEWOS
gathers individual prices recorded at residential property market transactions by
the local expert committees for property valuation. The data is supplemented with
further estimates based on information provided by tax authorities on the revenue
raised by the property acquisition tax. Finally, gaps in the data are filled with
estimates based on own surveys and expert judgements (GEWOS, 2006). Based
on this information from various sources, GEWOS aims to achieve full regional
coverage (ie including all German cities and administrative districts). Actually,
GEWOS is the only institution that covers rural areas. The main results of overall
price trends are summarised in its annual real estate market analysis IMA
(Immobilienmarktanalyse). Price indicators are calculated on the basis of the
number of transactions and the turnover from these transactions, resulting in
average prices of detached houses and flats. An explicit weighting scheme is not
used. These unit value indices have the serious disadvantage of not being
9
They were first briefly presented in the May 2003 issue of the Bundesbank’s Monthly
Report (Deutsche Bundesbank, 2003a). A more detailed presentation was given in the
September 2003 issue of the Monthly Report (Deutsche Bundesbank, 2003b).
11standardised, meaning that prices of houses and apartments with differing
characteristics and location are averaged and then compared over time. Without
structural stability, these indicators cannot be expected to deliver reliable
estimates of price change on the German property market.
Based on data provided by GEWOS, the Institute for Urban Development,
Housing and Saving Schemes for Housing Purposes IFS (Institut für
Städtebau, Wohnungswirtschaft und Bausparwesen) has been publishing, on a
regular basis since 1996, an index of owner-occupied property prices called DEIX
(Deutscher Eigentums-Immobilien-Index). Backdata reach back to 1989. The
DEIX is designed to show nationwide developments in the prices of detached
houses and flats on the basis of the above-mentioned data sources. The main
pro of these indicators is their broad coverage and the reliance on actual
transaction data (according to IFS, in 2005 470,000 price observations were fed
into the index), the main con the averaging across heterogeneous objects without
adequate weighting.
The data gathered by real estate agents associations, the expert committees
and the commercial banks have in common that they are to some extent
transaction-based. The private company IDN Immodaten takes a different
approach and gathers information for offer prices of real estate property from
advertisements. For its real estate market data base, IDN Immodaten
continuously evaluates advertisements from 97 sources, ranging from daily
newspapers to online marketplaces. For an ad to be recorded, it has to contain at
least information regarding price, location and size of the residential property.
Further characteristics such as area, number of rooms and baths, and extras
such as balcony, terrace, garden, fitted kitchen, etc are also taken into account, if
available. According to IDN Immodaten, the data pool now comprises information
from over 75,000 districts and cities. This gives a fairly detailed geographical
coverage of the property market. Since April 2002, when the data base was
initiated, about 70 million ads have been recorded. At present, 1.7 million ads are
recorded per month. Such huge amounts of data, especially those taken from
online marketplaces, are handled with the help of automated data bases that filter
out extreme values. A further problem is that one single property may be
advertised simultaneously at different places, potentially leading to double
counting. In order to avoid or at least reduce the occurrence of such double
counting, IDN Immodaten employs an automated check sum approach that
identifies those advertisements that coincide in their profile of price and
characteristics and records them only once. Of course, this approach is only a
very rough filtering procedure. If the same object is advertised more than once
and the ads of the same object differ at least in the listing of one key
characteristic, then they will be (falsely) treated as if they were different objects.
Since about 70% of all ads do not even have a street name, only telephone
contact with the advertiser could ultimately avoid double counting. However, the
costs of such a procedure are prohibitively high.
The independent economic and social science consultancy Empirica AG
makes use of the IDN real estate market data base for calculating its own price
12indicators. The resulting time series start in January 2003 and are continuously
updated and made available to interested users for a fee. New ads enter the data
base with a time lag of about three weeks. Four times per year a summary of the
market for residential property for all administrative districts (Landkreise) and
cities not part of administrative districts (kreisfreie Städte) is given. The summary
comprises prices per sqm and prices per object of new semidetached, detached
and terraced houses, own-use apartments and undeveloped lots. No use is made
of the more detailed information on characteristics of the advertised properties.
The various indicators are tabulated for cities or administrative districts and are
complemented with the standard deviation and deciles of prices per square
meter. The information given on deciles is considered to substitute for an explicit
quality adjustment, which is a rather bold assertion. Moreover, the offer prices in
advertisements have the disadvantage that they usually differ from actual
transaction prices. As such, they are more an indicator of market sentiment. The
main advantage of offer prices against transaction prices is the relatively low cost
and timely access to the raw data. The IDN data also form the basis for the
residential property price indicators which are being developed by the German
Federal Office for Building and Regional Planning (Bundesamt für Bauwesen
und Raumordnung, BBR). At present, however, only scarce information on these
indicators is provided (see Sigismund, 2005).
A monthly indicator of residential property price developments is provided by
the Hypoport Group, which – according to its own description – “is a technology-
based, all-round financial services provider of a new kind.” (http://www.hypoport.
com/index.php). Its property price indices refer to single apartments, new one-
family houses and existing one-family houses. The data are gathered from the
EUROPACE platform, which is an internet provider of mortgages. Each month,
about 4,000 to 6,000 property transactions are recorded. Hypoport reports
monthly average prices (unit values), the average size of the living space and the
average year of construction. The calculation of the various indices reported by
Hypoport is rather intransparent. The reference period is August 2005, and the
reported indices are highly, but not perfectly correlated with the average price per
sqm. The graphs provided by Hypoport display a three-month moving average of
the indices.
C Comparing the various indicators
The development of the various property price indicators for Germany is
depicted in Figures 1 to 7. A good first impression about the diversity of the price
movements conveyed in the data from different providers is given in Figure 1. It
compares various price indicators, which are available at least from 1990
onwards for western Germany. As the figure shows, the various indicators share
some common dynamics. In the first half of the 1990s, a period that is marked by
the cyclical upturn that followed the opening of the borders in Central Europe, all
indicators rose continually. In the mid-1990s, a downward correction set in.
However, the pace and extent of the price hike, as well as of the downward
correction, is quite heterogeneous. While the DEIX (unit-value) indicator derived
13from GEWOS data only shows a rather slight downward movement and
stagnation afterwards, the RDM indicator (based on typical prices) has fallen
steadily, resulting in a discrepancy of more than 40 percentage points between
the DEIX and the RDM indicator at the end of the period of observation.
According to the expert-based information from BulwienGesa, in the 1990s the
price for second-hand property rose faster than the price for new dwellings. This
might be connected with the fact that living in town centres is again being
regarded as more attractive and therefore demand for second-hand property has
increased. Furthermore, the new-dwellings index might be downward biased, for
the reasons given in section II. As of late, the gap in the price development of
second-hand and new dwellings seems to have narrowed.
The indicators for Germany from GEWOS beginning in 1995 show stagnation
in western Germany and Germany after the mid-1990s and a further price
decrease in eastern Germany (Figure 2). According to the price indicators
calculated by the Bundesbank on the basis of raw data from BulwienGesa, the
prices of most types of property decreased only slightly in the latter half of the
1990s, with the exception of second-hand apartments, the prices of which
decreased more sharply (Figure 3). The monthly Hypoport price indicator turns
out to be quite volatile (Figure 4), probably due to averaging across
heterogeneous entities. Adequate quality adjustment and/or adequate weighting
would probably smoothen the development of the index.
A first impression about the regional heterogeneity of price dynamics for
residential property in Germany, which is indicative for the need for adequate
weighting, is given by the breakdown in eastern and western Germany in Figure
5. The breakdown shows that, in eastern Germany, the price trend of almost all
categories moves downward over the period of observation. In western Germany,
the prices are somewhat less volatile, perhaps with the exception of the prices of
apartments for resale, which rose sharply in the first half of the 1990s and
decreased steadily afterwards. Further insight is gained by calculating price
indices for northern and southern states in western Germany. Price indices for
new dwellings and resale constructed for western Germany, southern Germany
and northern Germany basically show a co-movement in price dynamics over the
regions. However, due to a period of divergence in the years from 1995 to 1997,
the overall price change in southern regions is lower than that in overall Germany
and in northern regions (Figure 6).
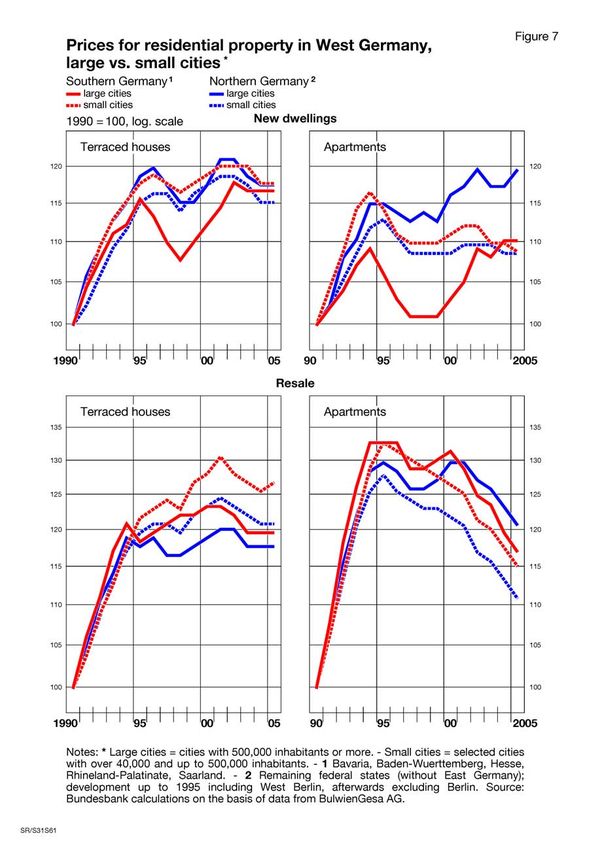
Finally, a breakdown according to the size of municipalities in western
Germany shows that the prices of new apartments between big cities of northern
Germany vs southern Germany diverged in the period of observation (Figure 7).
Summing up, most price indicators show, in principle, a co-movement in their
overall trends in the period after 1990. However, over shorter periods, the
indicators display quite heterogeneous price dynamics. For example, if one
calculates the annual percentage change in 2005 (Table 3), the price indicator for
residential property calculated by the Bundesbank stagnated in the case of new
dwellings in Germany and decreased by 2 percent in the case of second-hand
14objects. For western Germany, the indicators show a 1 percent increase in new
apartments. The DEIX for western Germany indicates a pronounced increase of
3 percent for detached houses and apartments, whereas the Hypoport indices
show a decrease ranging from -2 percent for second-hand homes to -4 percent
for new homes.
IV Upcoming property price indices for Germany
Despite the increasing number of property price indicators (mainly due to
innovations in the area of information technology such as online marketplaces),
the “status quo” in the area of residential property price indices remains
unsatisfactory in the case of Germany. Present day indicators, including the
Bundesbank residential property price indices, can only be regarded as a
“second best” or even “third best”. Improvement is mostly required with respect to
the regional coverage (inclusion of rural areas), quality adjustment and temporal
disaggregation. As far as quality adjustment is concerned, the future will certainly
belong to hedonic methods. They are well-suited to cope with such
heterogeneous products as residential properties. The method of typical cases
and the application of expert judgment on prices and quality can help, yet they
lack transparency and cannot be traced back to actual transactions. With
temporal disaggregation, the adequate quality adjustment becomes even more
important, as it is more likely that the structure of transactions in the observation
period differs from that in the reference period.
At present, there are two endeavours aiming to provide representative price
indices of residential property with the help of hedonic methods, one coming from
the private sector and one a pilot study being conducted at the German Federal
Statistical Office.
The private initiative has been launched by the Association of German
Pfandbrief Banks VDP (Verband Deutscher Pfandbriefbanken).10 In 2004, this
association began to compile a data base with transaction prices and
characteristics from commercial and residential real estate property mortgaged
by member banks (see Hagen/Hofer, 2006). The primary purpose of this data
pool is the estimation of loss given default for mortgage loans (LGD rating), which
is a requirement of the Basel II advanced internal ratings-based (IRB) approach
(see Trotz/Bärwald, 2006). Real estate property is categorised and rated
according to a standardised scheme. Main categories are commercial and
residential property; within residential property, one-family houses, two- or three-
family houses, apartment buildings and freehold flats; within one-family houses,
free-standing houses, semidetached houses and terraced houses. Residential
properties are rated according to location, furnishing, condition and saleability on
a decigrade scale, reaching from “excellent” to “disastrous”. A handbook details
how to weight the various characteristics of the properties in the rating process
10
In early summer of 2005, VDP succeeded the Association of German Mortgage Banks
VDH.
15(Verband deutscher Pfandbriefbanken, 2005; see also TEGoVA, 2003).
Furthermore, the vintage, the size of the living space and the size of the lot (for
one-family houses) are recorded. The aim is to calculate, on the basis of this
data, hedonic price indices of real estate. Presently, the main focus is still on the
quality of the input data. Whereas for the first year the data quality was rather
poor – mainly due to missing and inconsistent data – it improved significantly in
the second year, and preliminary hedonic analyses have delivered promising
results. For the compilation of a truly representative index, the regional coverage
has to be improved; at present, it is still rather unbalanced, as not all banks active
in the mortgage business pool their data with VDP. For VDP, it will be crucial to
convince member banks that the benefits of having regionalised hedonic property
price indices justify the costs of providing the price and characteristics data in a
standardised format, timely and consistently rated. A potential weakness of the
VDP approach is use of quality ratings instead of actual characteristics (but
Hoesli et al, 1997, also use ratings instead of actual characteristics), implying that
the unbiasedness of the index relies on the intertemporal consistency of the
quality ratings.
As regards efforts in the sector of official statistics, the German Federal
Statistical Office (Destatis) has developed a price index for owner-occupied
housing in Germany within a pilot study initiated by the Statistical Office of the
European Communities (Eurostat) in 2002. The main goal and motivation of this
study is to fill a gap in the coverage in the Harmonised Index of Consumer Prices
(HICP) by applying the net acquisition approach to owner-occupied housing. The
net acquisition approach requires that only residential property newly acquired by
the household sector be considered. Transactions within the housing sector are
assumed to cancel each other out. The restriction to newly acquired residential
property implies that mostly new dwellings are to be taken into account. For the
purpose of the house price index, Destatis classified new dwellings in the
following types (Dechent, 2004):
- Self-made houses (the owner buys construction materials and services from
construction companies)
- Prefabricated houses (the owner buys prefabricated homes from specialised
companies)
- Turnkey-ready houses (the owner buys a conventional, turnkey-ready home
from the property developer, who may also act as the real estate agent).
For each one of these categories, adequate sources for price data had to be
found. In order to cover the category “self-made houses” it is necessary to record
the expenditures of private households acting as buyers of construction materials
and services, ie the expenditures for all the relevant materials and for services
bought from building companies. The official price statistic for construction
(Baupreisindizes) is the main source of data on this type of residential property
acquisition.11 Since the construction price indices also contain the prices of
11
The construction price indices are calculated on a quarterly basis and measure the
price development for selected products and services needed for the construction of
houses. The recorded prices are transaction prices.
16prefabricated one-family houses (with and without a cellar), the prices for
“prefabricated houses” can also be gained from existing construction price
statistics.
The situation for turnkey-ready houses is not as straightforward. This case
comprises transactions in which the buyer of residential property purchases a
turnkey-ready new dwelling directly from the constructing company. Since such
transactions are currently not covered by official statistics, other sources had to
be looked for. In order to fill the lack of data in the field of turnkey ready building,
Destatis acquired data from the expert committees for property valuation. As the
expert committees are autonomous entities that act independently they are,
however, not obliged to deliver statistical data in a way needed for the regular
calculation of official price statistics. Due to these limitations, Destatis had do
focus on cooperation with selected expert committees and harmonise the
process of data sampling and delivery. For the pilot study, Destatis used data
from expert committees of land value from five out of 16 federal states in
Germany, covering the years 2000 to 2002. The largest federal state participating
in this experimental study supplies nearly 400 quotations per quarter of a year,
whereas other states report much less data, sometimes only 20 quotations. As
can be inferred from Table 4, the number of characteristics which go into the
(experimental) house price index is quite restricted (which is, however, not
uncommon for hedonic property price indicators).
On the basis of data described above, Destatis calculated experimental
hedonic housing price indices. Due to the small sample of the data from the
eastern Germany, the data for the eastern federal states (Saxony, Saxony-Anhalt
and Mecklenburg-Western Pomerania) were pooled in order to perform
regression analyses. Thus, the separate price indices were calculated for Lower
Saxony, Hesse and Rhineland-Palatinate and eastern Germany. With regard to
the hedonic method, a variant of the imputation method is used, meaning that
missing prices are estimated by means of regression analysis. As both the prices
of the reference period as well of the base period are imputed, the procedure is
called “double imputation” (Linz/Behrmann, 2004). Destatis prefers the double
imputation method because it excludes outliers from the index calculation, which
may enhance the robustness of the index. A specific feature of the Destatis index
is inclusion of the standard land value (Bodenrichtwert) among the explanatory
variables. This originally continuous variable is, however, transformed into
several dummy variables, with the intention that only the cross-section variation
in the standard land value enters the regression. Preliminary results are shown in
Figure 8. According to the index, property prices seem to have decreased in the
period from 2000 to 2002, which is a plausible result. Less plausible is the rather
high volatility of the quarterly figures, especially the dip in the second quarter of
2002. The pronounced volatility seems to suggest that either the quality
adjustment is not fully adequate or that the number of observations is still too
small for reliable quarterly figures.
17You can also read