ADDING AN IOT WI-FI BOARD TO THE HEAD IMPACT ASSESSMENT PROTOTYPE IN CONTACT SPORTS - AMMAR AL-KAYSI
←
→
Page content transcription
If your browser does not render page correctly, please read the page content below

Ammar Al-Kaysi

Adding an IoT Wi-Fi Board to the
Head Impact Assessment Prototype in
Contact Sports
Metropolia University of Applied Sciences
Bachelor of Engineering
Degree Programme in Electronics Engineering
Bachelor’s Thesis
23 May 2021
Abstract

                            Ammar Al-Kaysi
Author
                            Adding an IoT Wi-Fi Board to the Prototype of Head Impact As-
Title
                            sessment in Contact Sports
Number of Pages
                            49 pages + 2 appendices
Date
                            23 May 2021

Degree                      Bachelor of Engineering

Degree Programme            Electronics

Professional Major          Electronics

Instructors                 Jani Virtanen, Owner (MDS Finland)
                            Matti Fischer, Principal Lecturer (Metropolia UAS)

Head injuries are considered one of serious and worrying injuries for players and doctors
due to the difficulty of examining the injured player at the time of injury and also the difficul-
ty of following up the condition of the player's head during the period of exercise.
Head Impact Prototype is a device that follows player's head status instantaneously, as it
is fixed in player's helmet, which helps the specialist and doctor in early detection of trau-
matic brain injury and concussion.

The goal of the project is to find a cheap and convenient transmission technology that able
to transfer the Head Impact Prototype data and display it on smart devices such as porta-
ble smartphones or computers in order to be examined and followed up by health staff,
doctors,.. etc. Internet of Things (IoT) system has been chosen as a suitable solution for
this project, since the technology connects the device to the Internet, which allows special-
ists to control and display the received data from distance, due to the wide prevalence of
internet networks.

Thereupon, Particle Photon has been chosen to represent an IoT device, since it is con-
sidered one of the cheapest microcontrollers that support this technology, as well as small
in size, low power consumption, high performance and was available in Metropolia Univer-
sity lab. A Particle Photon has been added to Head Impact Prototype by connecting to
Adafruit Feather nRF52840 Express microcontroller over one of data transfer protocols
UART. The function of Photon is to receive the transferred data by Adafruit and send it to
the Particle Cloud. The transferred data contains values of Accelerometer and Gyroscope
which are considered the evaluation of brain movement. This data is stored in Particle
Cloud temporary until it is sent again to a platform, where data can be viewed graphically.
The graph can be monitored by a specialist or doctor to assess the player's situation.

Keywords                       IoT, Wi-Fi, Particle Photon, UART, Platform
Contents

List of Abbreviations

1   Introduction                                 1

2   Medical Theoretical Background               3

    2.1   Traumatic Brain Injury                 3
          2.1.1    Brain Parts                   4
          2.1.2    Brain Injury Symptoms         6
    2.2   Concussion                             6
    2.3   Concussion in Sport                    7
    2.4   Concussion Technically                 8

3   Modern Devices Technology                    10

    3.1   i-STAT Alinity                         10
    3.2   Ahead 300                              11
    3.3   Q-Collar                               11
    3.4   Head Impact Telemetry System           12
    3.5   X2 Biosystems xPatch Pro               13
    3.6   MDS Head Impact                        13

4   Embedded Communications Technologies         14

    4.1   Wireless Communications Technologies   14
          4.1.1    Wi-Fi                         14
          4.1.2    Zigbee                        14
          4.1.3    Bluetooth and BLE             15
    4.2   Wired Transmission Technologies        15
          4.2.1    SPI                           15
          4.2.2                                  16
          4.2.3    UART                          17
          4.2.4    CAN                           18

5   IoT System                                   20

    5.1   IoT Overview                           20
    5.2   IoT Architecture                       20
    5.3   IoT Boards                             21
    5.4   Cloud Services                         23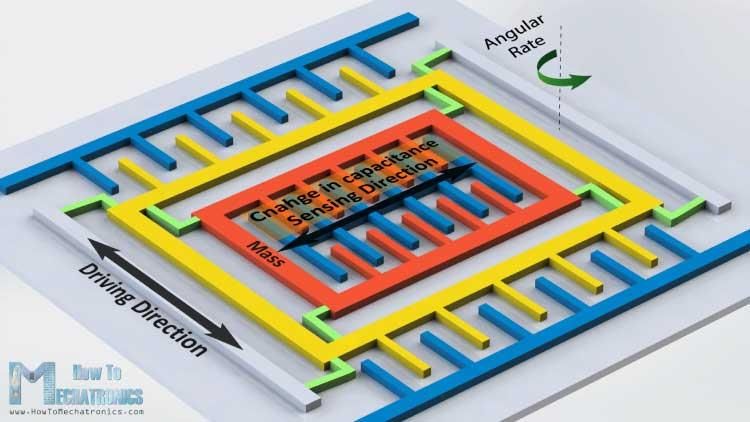
5.4.1   Types of Cloud Hosting                  23
          5.4.2   Types of Cloud Services                 24

6   Hardware System                                       26

    6.1   Adafruit Feather nRF52840 Express               26
    6.2   Accelerometer H3LIS33DL                         27
    6.3   Gyroscope ICM20649                              29
    6.4   Particle Photon                                 30
          6.4.1   Overview and Features                   30
          6.4.2   Power Consumption Modes                 32
          6.4.3   Particle Cloud                          32
          6.4.4   Connect Adafruit to Photon              33

7   Software System                                       34

    7.1   Adafruit Feather nRF52840 Express               34
    7.2   Particle Photon                                 35
          7.2.1   Transfer data from Adafruit to Photon   35
          7.2.2   Transfer data from Photon to Cloud      36
          7.2.3   Transfer data from Cloud to Platform    36
    7.3   Platforms                                       37
          7.3.1   Thingspeak                              37
          7.3.2   Blynk                                   38
          7.3.3   Webserver                               40

8   Conclusion                                            43

References                                                44

Appendices
Appendix 1. Particle PØ Wi-Fi module
Appendix 2. Prototype of Head Impact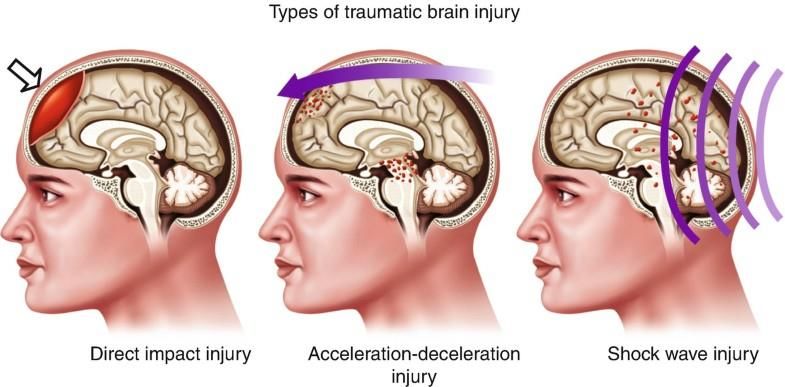
List of Abbreviations

$          United States Dollar

ACK/NACK Acknowledged/Not Acknowledged

ADC        Analogue to Digital Converter

AES        Advanced Encryption Standard

BLE        Bluetooth Low Energy

CAN        Controller Area Network

CPU        Central Processing Unit

csv        Comma separated values

CT         Computerized tomography

dBm        Decibel miliwatts

DC         Direct Current

dps        Degrees per second

ECU        Engine Control Unit

EEG        Electroencephalogram

FCC        Federal Communications Commission

FIFO       First in first out

FSR        File Select Register

g          G-force/ gravity
GB     Gigabyte

GCS    Glasgow Coma Scale

GHz    Gigahertz

GPIO   General Purpose Input/ Output

GPS    Global Position System

HDMI   High Definition Multimedia Interface

HITS   Head Impact Telemetry System

HTML   Hypertext Markup Language

HTTP   Hypertext Transfer Protocol

       Inter Integrated Circuit

       Inter IC Sound

IaaS   Infrastructure as a Service

IC     Industry Canada

IEEE   Institute of Electrical and Electronics Engineering

iOS    iPhone operation system

IoT    Internet of Things

IP     Internet Protocol

ISM    Industrial, scientific and medical

JSON   JavaScript Object Notation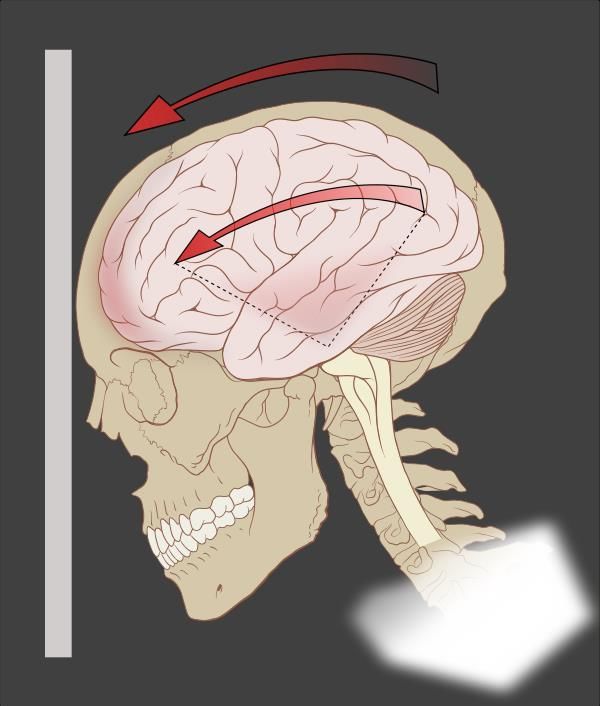
KB     Kilobyte

kbps   Kilobit Per Second

KiB    Kilo Binary Byte

Km     Kilometer

LED    Light Emitting Diode

       Meter per second squared

MB     Megabyte

Mbps   Megabit per second

MDS    Medical device consulting and services

MEMS   Micro-electromechanical system

MHz    Megahertz

MISO   Master in Slave out

MOSI   Master out Slave in

MRI    Magnetic resonance imaging

mTBI   Mild Traumatic Brain Injury

PaaS   Platforms as a Service

PC     Personal Computer

PLL    Phase Locked Loop

PWM    Pulse Width Modulation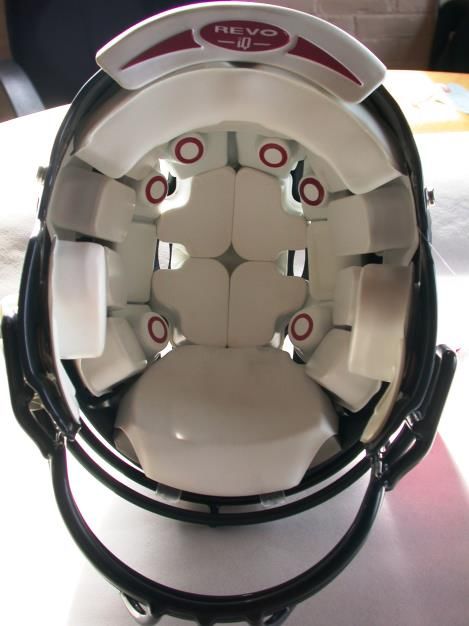
Radian per square meter

RFID   Radio Frequency Identification

RJ45   Registered Jack-45

RoHS   Restriction of Hazardous Substances Directive

RTC    Real time clock

Rx     Receiver

SaaS   Software as a Service

SCK    Synchronous Clock

SCL    Serial Clock

SD     Standard Definition

SDA    Serial Data

SMD    Service Mount Device

SPI    Serial Peripheral Interface

SQL    Structured Query Language

SRAM   Static random access memory

SS     Select Signal

SSL    Select Socket Layer

TBI    Traumatic Brain Injury

TCP    Transmission Control Protocol
TLS     Transportation Layer Security

TV      Television

Tx      Transmitter

UART    Universal Asynchronous Receiver Transmitter

UF2     USB Flashing Format

USB     Universal Serial Bus

VDC     Voltage Direct Current

VDD     Voltage Drain Drain

VM      Virtual Machine

Wi-Fi   Wireless Fidelity

μA      Microampere
1

1   Introduction

The brain is one of the most important and irreplaceable organs in the human body and
exposing to any injury may cause great damage temporarily or permanently. Therefore,
everyone is keen to stay healthy, away from any danger to the brain including concus-
sion, which is one of the common injuries among athletes, and the delay in detecting
may cause serious complications in the future that are difficult to treat.

Hence, an idea was born to create a device that measures the state of the player's
brain periodically during the time of practice, especially in sports most likely vulnerable
to a head injury such as direct contact sports, ice hockey, and others. The purpose was
to make the prototype able to send the brain data to a longer distance that makes the
specialist able to follow the athlete's head health. As such, the prototype works to fol-
low the condition of player's head which is monitored by a healthcare specialist through
smartphone or a computer viewing instant data graphically. Once the player is exposed
to a concussion, the device records a clear change in the graph proportional directly to
the head movement.

The device went through several important stages: the device design stage, the device
programming stage, and the third stage which was finding an appropriate means to
transfer prototype data to display it in more convenient way.

The Internet of Things was chosen as an effective system for transmitting data and
connecting devices together via the Internet. A Particle Photon microcontroller was also
chosen to represent the IoT system through taking advantages of the wide spread of
the Wi-Fi, moderate power consumption, as well as cost of the system.

The data was successfully transferred by Adafruit microcontroller to the Photon micro-
controller using wired transmission technology UART. Then this data was sent again by
Photon microcontroller to the cloud, which in turn deliver the data to an appropriate
application for display.

Three methods were followed to display the data: one of them using a pre-prepared
page to display the data through following intelligent algorithms that analyze the data
(Thingspeak). Another method was used a ready-made application that displays data
2

instantly on the mobile phone (Blynk). The last method was created a Webserver that
able to display the data in real time via any smart device such as computer, mobile,
tablet … etc.
3
2 Medical Theoretical Background
2.1 Traumatic Brain Injury
A Traumatic Brain Injury (TBI) is a disruption in normal function of brain that can be
caused by an external force such a bump, blow, or jolt to the head, or penetrating head
injury [1]. It can also be defined as damage that occur to the brain because of external
force, for instance rapid acceleration or deceleration, direct impact, shock wave, or
penetration by a missile fragment. As such, brain performance is affected temporarily
or permanently, and the injury may be assessable or may not be assessable with re-
cent technology. Figure 1 shows types of traumatic brain injury that affect a human
head directly.
Figure 1. Types of TBI which affect human head directly [2].
Generally, TBI can be assessed by the severity, which can be measured by Glasgow
Coma Scale (GCS). A GCS is the level of consciousness that is estimated on a scale
of 3-15 by a verbal, motor, and eye opening reactions to stimuli, for the injured person.
Based on severity and extent of damage to the brain, brain injury can be classified into
three categories [3]:
Mild: the injury state may result in a slight change in mental state or conscious-
ness. The mild injury has scaled of GCS between 13 - above.
Moderate: the injury state may result in moderate change in mental state or
consciousness. The symptoms are more intense than mild TBI and less than
the severe TBI. The moderate injury has scaled of GCS between 9 - 12.4
Severe: the injury state may result in long time of unconsciousness, coma, or
even death. The severe injury has scaled of GCS between 8 - below.
2.1.1 Brain Parts
A center of human activity is a human brain, which consists of nerve cells that distribut-
ed through directed pathways to the body. Repeated injuries that occur to the head
may affect the body's functions, as the body's functions are directly related to the brain.
Understanding the function of different parts of brain, helps to evaluate the injury ef-
fects on person's abilities and behaviors. Human brain can be divided into six main
parts as shown in Figure 2. Also functions of each brain part are mentioned in Table 1.
Figure 2. Brain six parts [4].5
Table 1. Illustrates six main brain parts and their functions [4][5].
Brain Part Functions
Breathing
Heart Rate
Swallowing
Reflexes for seeing and hearing
Brain Stem Controls sweating, blood pressure, digestion, tempera-
ture
Affects level of alertness
Ability to sleep
Sense of balance
responsible for controlling the coordination of voluntary move-
ment
Cerebellum Coordination of voluntary movement
Balance and equilibrium
Some memory for reflex motor acts
Responsible for behavioral output like social and cognitive be-
haviors and body movement.
How we know what we are doing within our environ-
ment
How we initiate activity in response to our environment
Judgments we make about what occurs in our daily ac-
tivities
Frontal Lobe Controls our emotional response
Controls our expressive language
Assigns meaning to the words we choose
Involves word associations
Memory for habits and motor activities
Flexibility of thought, planning and organizing
Understanding abstract concepts
Reasoning and problem solving
Responsible for complex behaviors, including all behavior in-
volving the senses.
Visual attention
Parietal Lobe Touch perception
Goal directed voluntary movements
Manipulation of objects
Integration of different senses
Occipital Lobe Vision
responsible for memory development and learning
Hearing ability
Memory aquisition
Some visual perceptions such as face recognition and
Temporal Lobe
object identification
Categorization of objects
Understanding or processing verbal information
Emotion6
2.1.2 Brain Injury Symptoms
The appearance of some symptoms of TBI may vary from person to person and may
last for days, weeks and even longer. However, once these symptoms appeared on a
person, it is advised that the physical activity should be terminated immediately. Here
are some of TBI symptoms, which should be evaluated by a health care specialist ap-
proved in TBI diagnostic:
Symptoms may appear early as soon as TBI occurred [5]:
Headache or a sensation of pressure in the head, nausea or vomiting, altered level
of consciousness, slurred speech, delayed response to questions, blurred vision
(dilated or uneven pupils are a sign of severe TBI), confusion, dizziness, tinnitus
(ringing in the ears), memory loss, and fatigue.
Symptoms may appear lately after TBI occurred few hours, days or weeks [5]:
Continued or persistent memory loss, trouble in concentration, irritability, personal-
ity changes, sensitivity to light and noise, disorders of taste and smell, sleep prob-
lems, mood swings, stress, and anxiety or depression.
2.2 Concussion
Concussion is a type of mild traumatic brain injury (mTBI) that impacts the brain func-
tion temporarily [6]. It can happen as a result of sports, car accident, falls and physical
altercations. Brain injuries can be affected by a direct blow to the head or by an exter-
nal force on the body that is transmitted to the head as illustrated in figure 3. Once the
brain faces enough force that result to collide in the skull, there may appear some of
short term symptoms. Unfortunately, the repetition of concussions can result to a long
term consequences, which make the recovery more complicated.7
Figure 3. The idea of a concussion [6].
However, having a concussion does not necessarily cause a loss of consciousness.
Concussion results a variety of symptoms, which some of them may appear right away,
or may delay for several days after the injury. Some symptoms are physical, such as
drowsiness, while others are cognitive, like memory loss. The following symptoms con-
sidered as the most common signs may appeared on concussed athletes, which help
to diagnose the injury: drowsiness feel, memory loss and difficulty in remember some-
thing, irritability and anger, headache, vomiting and nausea , indecision and confusion,
imbalance, dizziness, loss of consciousness, difficulty in speaking, depression, and
changes in sleep habits [7].
2.3 Concussion in Sport
There is no doubt that every sport player is exposed to a blow on head directly or to a
blow to the body indirectly, which pushes the head to rotate quickly. Therefore, con-
cussion is considered one of a major concern in contact sport duo to the serious con-
sequences that may occur to the athlete, especially, who exposes to similar incidents
frequently. As such, in some sports have more probability of contact as instant rugby,
football, ice hockey, ... etc.
However, most of concussed athletes can recover within 7 to 10 days in case the right
process of prevention has been followed. As such, once athletes have suspected in
concussion, they should terminate the sport immediately and try to have a plenty of rest8
time as the brain injuries need enough time to recover, and straining it can delay the
recovery time that makes brain healthy [8].
The young athlete exposes more to concussion and needs longer time to recover, be-
cause the brain during this period is still growing until the age of 25. Therefore, concus-
sions can result greater damage among collegiate athletes and may increase the dan-
ger to cognitive impairment [7].
Medically, the injured athlete submitted to a neurological exam to be assessed general-
ly. Essential procedure is to pass through a test for balance, coordination, vision, hear-
ing and reflexes. Once the brain injury is proved, it is checked with MRI or CT scan,
which provides doctor more details of the skull and brain status, but concussions, can-
not be seen on MRI or CT scans, so prevention is important [8].
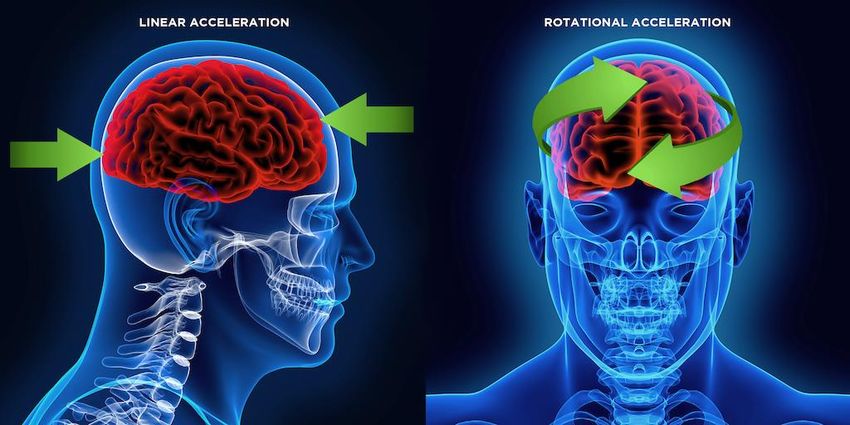
2.4 Concussion Technically
Concussion can be evaluated by measuring two motion impacts on and athlete's head:
linear acceleration and rotational acceleration. Linear concussion can be caused by
direct impacts that stops moving the head forward, but the brain continues moving for-
ward until collide to the skull, causing damage to the frontal lobe or occipital lobe or
both. Linear motion can be detected by using Accelerometer sensor. While rotational
concussion can be caused by side impacts that makes the brain to spin around its axis
causing a tear on brain structures. Rotational motion can be detected by using Gyro-
scope sensor. These two components can estimate the greater impacts of motion in
the head, which may reduce injury complications and future risks. Figure 4 shows the
idea of linear and rotational acceleration [9].
Figure 4. Linear and rotational acceleration [9].9 The Sports Legacy Institute has considered 20g or more force as the threshold for such a hit.[7] Another study has been conducted that an average value of the linear acceler- ations experienced by the head during a concussion is approximately 40.62 g, and an average value of rotational acceleration is approximately 3388 [10].
10

3     Modern Devices Technology

Previously, concussions were determined by CT scan, regular patient questionnaire,
patient history data, or a neurological test, which some of them considered inaccurate
method. However, with the revolution of technology in healthcare and medical fields
recently new methods have appeared to evaluate TBIs including concussions. Some of
new technology devices will be covered in this section.

3.1    i-STAT Alinity

Abbott company has invented a device called "i-STAT Alinity" to evaluate suspected
mild TBIs and concussions through blood test. The main function of the device is to
determine whether the TBI patient needs to have CT scan or not. The test takes 15
minutes to show up the result. The measurement is done by putting a plasma sample
on a cartridge, then installs it into the device, which in turns show up the presence of
specific proteins negatively or positively. The positive result means the patient suffers
from concussion impact [11][12]. Figure 5 shows i-STAT Alinity plasma test device.

                        Figure 5.   i-STAT Alinity plasma test device [12].
11
3.2 Ahead 300
BrainScope company has invented a device called "Ahead 300", which provides a fast
(within minutes) evaluation of mild TBIs, including concussion. Basically, it is a dispos-
able headset consisting of 8 electrodes expanded to 20 electrodes, which functionally
collects EEG data from the head, then shows it up on a screen of portable device [13].
The headset is worn when it needs to assess the severity injury of patient whether it
has serious affection. As such, Ahead 300 is considered as an early diagnose device
and can be used in Emergency Department [14]. Figure 6 shows Ahead 300 device.
Figure 6. Ahead 300 device [13].
3.3 Q-Collar
Q-Collar is a C-shaped device that is used by sport players and worn around the neck
during sport activity in order to protect the player from repetition of concussion. Indeed,
Q-Collar works by making a pressure on the arteries around the neck causing increase
in the volume of blood in the skull. This reduces the movement of the brain inside the
skull, which considers a main cause of TBI and concussion in general [15]. Figure 7
shows Q-Collar device.12
Figure 7. Q-Collar device [16].
3.4 Head Impact Telemetry System
Head Impact Telemetry System (HITS) is a programmed hardware designed for foot-
ball players and used to detect whether the player is exposed to a concussion during
exercise or not. The device is fixed in football player's helmet and the data can be
viewed from a computer. Generally, HITS technically consists 6 linear Accelerometers
fixed in specific places, a computer, an alert device and a battery [18]. Figure 8 shows
HITS fixed in a Riddell helmet.
Figure 8. HITS in a Riddell helmet [17].13
3.5 X2 Biosystems xPatch Pro
X2 Biosystems is a system that is used to detect TBI and concussion with helping of
xPatch Pro sensor, which is used to measure linear and rotation impact, due to it con-
tains Tri-Axis Accelerometer and Tri-Axis Gyroscope as main components [18]. The
sensor is mounted on the head skin behind the ear of sport player. Figure 9 shows
xPatch Pro sensor taped on the athlete head.
Figure 9. xPatch Pro sensor taped on the athlete head [19].
In fact, this system uses a wireless communication technology, since xPatch sensor
transfers data directly to Cloud through a platform where Cloud processes data in order
to be stored and monitored on any smartphone using a specific app [20].
3.6 MDS Head Impact
MDS Company aspires to make a device that checks the severity of concussion for
athletes to reduce complications that result from direct or indirect attack and help the
player to get rid of symptoms that may affect him in future. The device will be covered
in more detail in Hardware System section.14 4 Embedded Communications Technologies Embedded device connects to other device by using certain communication technolo- gies and protocols. In this thesis, it is divided into wireless or wired transmission tech- nologies depending on the transmission medium that is used. 4.1 Wireless Communications Technologies 4.1.1 Wi-Fi The most popular wireless technology based on IEEE 802.11 standard, which devel- oped to replace the wired communication IEEE 802.3 Ethernet standard. Although Wi- Fi operates on 2.4 GHz or 5 GHz ISM Bands, newer versions can also work with other frequency bands. An example of newer version is HaLow, based on 802.11h, uses band 902-928MHz and covers 1km with a suitable antenna [21]. The most popular to- pology that are used in Wi-Fi: point to point and star topologies. Many IoT applications use Wi-Fi to build a network that connect between devices. It is commonly used with devices that require higher speed, larger size data, higher band- width, and direct connection to the internet. However, it is less used by the applications that depend on low power consumption, and very limited in a device that running on small batteries for long time [22]. 4.1.2 Zigbee Zigbee is one of recommended choices used by IoT application and based on IEEE802.15.4. It is designed to work on 2.4GHz ISM, 902-928MHz and 868 MHz fre- quency bands [21]. Particularly, Zigbee is characterized by low power consumption and low data rates. It is compatible with IoT application, which uses small data rate and controls devices through internet such as the smart home. The most popular topology that are used in Zigbee: star and star topologies [22].
15

4.1.3     Bluetooth and BLE

Bluetooth is a wireless technology that works on 2.4 GHz ISM frequency band. Alt-
hough it transfers data through shorter distance, it is widely used in streaming applica-
tion, wearable devices and smart home [22].

On other hand, BLE is considered as one of lowest power consumption wireless tech-
nologies. The technology can be used to work in various network topologies: point to
point, star and mesh. However, in mesh topology all devices can communicate with
others directly, which means it can send and receive data freely among the device ne-
glecting the source. This makes the network expand to cover larger area. As an ad-
vantage of power consumption BLE is widely used by medical devices, indoor naviga-
tion and fitness wearable device [22].

Table 2 compares among Wi-Fi, Zigbee, Bluetooth and BLE and shows the most rea-
sonable technical values, which can help to select a suitable wireless technology that
meets the demanding application.

Table 2.    Comparative among wireless communication protocols [23].

   Wireless          Power Con-
                                         Transmission Range               Data Rate
  Technology          sumption

                                         100m without (Boost-
        Wi-Fi          Medium                                           10-100+ Mbps
                                                 ers)

        Zigbee           Low                  10-100m                    20-250 kbps

      Bluetooth        Medium                  1-100m                     1-3 Mbps

         BLE            Lower                   100m                   125 kbps - 2Mbps

4.2     Wired Transmission Technologies

4.2.1     SPI

Serial Peripheral Interface (SPI) is a high speed serial synchronous data transfer bus
which is used commonly in short distance systems, such as embedded. As shown in
Figure 10, it consists of four signals: two data signals MISO and MOSI, clock signal
(SCK) and slave select signal (SS). The two data signals MISO and MOSI are trans-
16
ferred to direction that referred by their names. MISO refers to Master In Slave Out,
whereas MOSI refers to Master Out Slave In. Master device launches the frame for
reading and writing data. SCK is produced by the master device to slave in order to
synchronize the transferred data to devices. SS is used to determine which slave is
going to receive the transferred data. SPI communicate between devices in full duplex
mode using single slave. Multiple slaves need separate select signal (SS1, SS2,
…etc.) [24].
SCK SCK
MOSI MOSI
Slave 1
Master MISO MISO
SS1 SS
SS2
SCK
MOSI
Slave 2
MISO
SS
Figure 10. The structure of SPI between master and two slaves.
The master sends data to the slave with the most significant bit first through MOSI line
in serial way bit by bit, whereas the slave sends data to the master with the least signif-
icant bit first through MISO line in serial.
4.2.2
Inter Integrated Circuit ( ) is an asynchronous serial communication protocol that
allows connecting multiple slaves to a single master or more. It takes the advantages of
UART and SPI, so it uses only two wires to transfer and receive data between devices.
One wire called Serial Data (SDA) is used as a transmitter and receiver, while the other
wire called Serial Clock (SCL) is used to generate a clock signal for synchronization in
order to achieve successful communication. Figure 11 shows the connection idea of
communication [25].17
SDA SDA
Master Slave 1
SCL SCL
SDA
Slave 2
SCL
Figure 11. The structure of between master and two slaves.
With this serial communication, the data is transferred as a message which consists of
start, address frame, read write, frames of data separated with ACK/NACK, and stop
bits as shown in figure 12.
Figure 12. A message of data in communication technology [25].
4.2.3 UART
Universal Asynchronous Receiver Transmitter (UART) is an asynchronous serial data
transfer circuit used to connect between devices, such as microcontrollers. UART cir-
cuit consists of two wires: transmitter Tx and receiver Rx. To connect two microcontrol-
lers Tx of first microcontroller is connected to Rx of second microcontroller, while Rx of
first microcontroller is connected to Tx of second microcontroller as shown in Figure 13.
The transmitter converts the parallel data received from the control device into a serial
form, then transmits it in sequence to the receiver, which converts the serial data back
into parallel data for the receiver [26].18
TX TX
UART 1 UART 2
RX RX
Figure 13. Two UARTs devices connected together.
Basically, UART does not need a clock signal, so data is sent by a transmitter Tx as a
packet includes start, data frame, parity and stop bits, which is handled by receiver Rx.
Figure 14 shows the packet of data which is used by UART.
Figure 14. A packet of data in UART communication technology [26].
4.2.4 CAN
Controller Area Network (CAN bus) is a multi-master serial bus that allows devices or
different microcontrollers communicate with other's applications without a host comput-
er. CAN bus is commonly used by automobiles, as well as some industrial equipment.
This serial communication uses two wires to connect each EDU. Figure 15 illustrates
the communication way of CAN bus [27].19
High
Low
EDU 1 EDU 2
Figure 15. Two EDUs connected together via CAN bus.20 5 IoT System 5.1 IoT Overview Internet of Things (IoT) is a network of devices or "things" that are connected to each other over the internet in order of transferring and receiving data among others. A prac- tical example for IoT is a smart home, which can connect all home appliances such as refrigerator, dish washer, TV … etc, to the internet and share the data with the home- owner via mobile app or web page or any suitable platform. The term "internet of things" was initially mentioned for first time by a British technology pioneer Kevin Ashton of Procter & Gamble in 1999 while presenting RFID as a basis of Internet of things [28]. Nowadays, IoT system has become one of technologies that are developed rapidly. According to McKinsey Global Institute, specialists expect in 2025 will be more than 60 billion of IoT device owned in worldwide that there will affect to the economic by $11.1 trillion per year [29]. 5.2 IoT Architecture Due to a great variety in implemented technologies of IoT, there is no certain architec- ture of IoT. However, simple design of IoT system can present the basic idea of IoT work and its architecture. Furthermore, it explains the data transferring from the device to end destination to be viewed. Figure 16 shows the path of transferred data in blocks of IoT system.
21

                   Application Layer or API Management             Smart Phone/ PC

      Processing Engine or
                                              Cloud/ Server
      Event Processing Layer

                        IoT Gateway               IoT Gateway or Aggregation Layer

          Device                     IoT Device Layer

                               Figure 16. IoT architecture [30].

IoT architecture can be simplified into four main significant layers:

      1. IoT Device Layer: includes a sensor or more that collect data from surrounding
         environment, then send it to gateway.

      2. IoT Gateway or Aggregation Layer: convert the received data to digital packets,
         then send packets to the cloud or data center wirelessly over a medium of
         communication such as Wi-Fi, BLE, … etc.

      3. Processing Engine or Event Processing Layer: include Cloud or Server that
         used to manage and store the acquired data.

      4. Application Layer or API Management: includes Smart Phone or PC which re-
         quest the stored data, then review it graphically.

5.3     IoT Boards

Many devices can be used for representing IoT system. It can be chosen according to
the required performance, such as the number of GPIO pin, cost, and other features.
22
Table 3 shows the most popular IoT microcontrollers with its most important technical
specs.
Table 3. Most important IoT boards [31].
Board Name Microcontroller Memory Interfaces I/O Pins Price
6 PWM,
14 digital,
32 KB flash, Wi-Fi,
6 analog,
Arduino Uno Rev3 ATmega328P 1 KB EEPROM, UART, , ~23$
USB,
2 KB SRAM SPI
Ethernet
RJ45
Wi-Fi, Blue-
2 MB PSRAM, 46 GPIO,
240MHz, Xtensa tooth, BLE,
ESP32 320 KB SRAM, 16 18 ADC, ~22$
32-bit LX7 UART, ,
KB SRAM in RTC 2 DAC
, SPI
4 MB flash, Wi-Fi, BLE, 16 GIPO,
80MHz, L106
ESP8266 32 KiB instruction, UART, , 11 digital, ~19$
32-bit RISC
80 KiB user data , SPI 1 analog
120MHz, BLE, Wi-Fi, 18 GPIO,
1 MB flash,
Particle Photon STM32F205 UART, , 8 digital, ~19$
128 KB RAM
ARM Cortex M3 SPI 6 analog
40 GIPO,
Bluetooth,
Full HDMI,
1.2 GHz, BLE, Wi-Fi,
Raspberry Pi 1 GB RAM Micro-SD ~35$
ARMv8 CPU UART, ,
card slot, 4
SPI
USB
4x16 bit
500 MHz, SA- Wi-Fi, PWM,
Giant Board MA5D2 ARM 128 MB DDR2 UART, , 6x12-bit ~28$
Cortex-A5 SPI ADC, Mi-
cro-SD
In this project, a Particle Photon is selected as an IoT board that transfer data over Wi-
Fi due to its superior characteristics which are represented in low power consumption,
small size, and easy to use. Moreover, it was available in the Metropolia University of
applied sciences lab.23
5.4 Cloud Services
Cloud is a virtual structure that offers some of computing services over the internet,
such as servers, data storage, databases process, networking, software, analytics and
intelligence as presented in figure 17.
Figure 17. Cloud System [33].
Comparing to other data processing systems, Cloud has superior advantages that
makes it on priority selected by IoT system: lower cost, fast enough in processing data,
ability to reach it globally, high security, productivity and reliable.
5.4.1 Types of Cloud Hosting
The cloud can be divided into three main types according to the type of hosting: a pub-
lic cloud, private cloud and hybrid cloud [32].
Public Cloud: it is owned and managed by a third-party cloud service provider,
who provides its own computing services such as servers and online data stor-
age. The user can access to these services and manage its account through a
web browser. Microsoft Azure and Google Cloud are examples of a public
cloud, where cloud providers own and manage all the hardware, software, and
other supporting infrastructure.
Private Cloud: it is exclusively dedicated by an organization or company. It can
actually exist in the organization's data center within the internal network. Also24
some organizations pay to another companies, like third-party service providers
for their cloud hosting. Users are selected within the organization to access into
cloud services instead of the general public. The maintenance process of ser-
vices and infrastructure are being done on a private network.
Hybrid cloud: it is an integration of public and private clouds, which are linked
together in order to allow sharing data and applications between each other.
Through merging feature, the hybrid cloud provides more business flexibility,
more deployment options and helps improve existing infrastructure, security,
and compliance.
5.4.2 Types of Cloud Services
Nowadays, cloud services become increasingly important in the business field. The
cloud can be divided into four main categories according to services that are provided
to the user [32]:
Infrastructure as a Service (IaaS): it is considered as the simplest category that
can be rented from a cloud service provider. In return, the cloud service provid-
er offers infrastructure servers, virtual machines (VMs), data storage, networks,
operating systems depending on a pay as it goes basis. Microsoft Azure,
Google Cloud Platform and Amazon Elastic Compute are some examples of
IaaS.
Platforms as a Service (PaaS): provides a demanding environment for develop-
ing, testing, delivering, and managing software applications. A PaaS is custom
designed for developers to create web or mobile applications easier and faster,
without worrying about setting up or managing the underlying infrastructure of
servers, data storage, network and database infrastructure which needs to de-
velop continuously. Windows Azure, Blynk and Google App Engine are exam-
ples of PaaS.
Serverless Computing: it is based on Function as a Service (FaaS) which fo-
cuses on saving time by allowing cloud platform implement application func-
tionality without caring of managing the servers and infrastructure. The cloud
provider is responsible to manage the setup procedure, capacity planning, and25
server administration. Serverless architectures are highly scalable and event-
oriented, using other services only when a specific function or trigger occurs.
IBM Cloud Functions is an example of Serverless Computing.
Software as a Service (SaaS): is a way to access a software application over
the Internet on demand, which is usually on a subscription basis. The cloud
provider hosts and manages the software application and core infrastructure,
and carries out maintenance tasks, such as upgrading on software and patch-
ing on security. Users connect to the app via the Internet using a web browser
on smart devices such as phone, tablet, or computer. Google Apps, Thingspeak
and Cisco WebEx are examples of SaaS.
Figure 18 clarifies graphically the idea of services that is provided by Cloud in different
categories.
Figure 18. Types of Cloud services [32].26
6 Hardware System
The selection of hardware system had been chosen in another thesis by the designer
Yonas Gebreyesus which explained in more details the reason of each device [44].
What was added to this section, was only a device that works on transferring data over
the internet in order to visualize it in more convenient way. The hardware can be classi-
fied into four main devices that were connected to each other: Adafruit Feather
nRF52840 Express, Accelerometer H3LIS33DL, Gyroscope ICM20649 and Particle
Photon. Figure 19 shows the whole hardware system that was built to represent the
prototype of Head Impact device includes IoT Wi-Fi Particle Photon [Appendix 2].
Accelerometer
Adafruit Feather
Particle Pho-
nRF52840 Ex-
ton
press
Gyroscope
Figure 19. Hardware system of Head Impact with Particle Photon.
6.1 Adafruit Feather nRF52840 Express
This board is a new edition of Feather family that included BLE and supports IoT Blue-
tooth system. The most common advantage of Adafruit Feather nRF52840 Express is
supporting CircuitPython language and Arduino IDE. An Adafruit was used to collect
data from the Accelerometer and Gyroscope, then the collected data was sent over
BLE to visualize it in Adafruit app "Bluefruit Connect". Figure 20 shows Adafruit Feather
nR52840 Express microcontroller.27
Figure 20. Adafruit Feather nRF52840 Express [35].
The technical features of the Adafruit Feather nRF52840 Express are listed below [34]:
ARM Cortex M4F running at 64MHz
1MB flash and 256KB SRAM
Native Open Source USB stack - pre-programmed with UF2 bootloader
Bluetooth Low Energy compatible 2.4GHz radio
Up to +8dBm output power
1.7V to 3.3V operation with internal linear and DC/DC voltage regulators
21 GPIO, 6 x 12-bit ADC pins, up to 12 PWM outputs (3 PWM modules with 4
outputs each)
Pin #3 red LED for general purpose blinking, NeoPixel for colorful feedback
Power/enable pin
4 mounting holes
Reset button
SWD connector for debugging
Works out of the box with all of our Adafruit Feather Wings! (Even the UART-
using ones like the GPS FeatherWing)
FCC / IC / TELEC certified module
6.2 Accelerometer H3LIS33DL
Accelerometer sensor is a device that can measure linear acceleration, linear motion,
tilt, and vibration, thus why it fits to use in concussion detection application. H3LIS33DL
is a 3-Axis linear accelerometer that means it can detect changes in linear motion in
three dimensions x, y and z. The measuring unit can be written in or in G-Forces
(g) where the value of 1g on the Earth is equal to gravity . Figure 21 shows the
H3LIS33DL sensor that has used in the project.28
Figure 21. Accelerometer H3LIS33DL sensor [36].
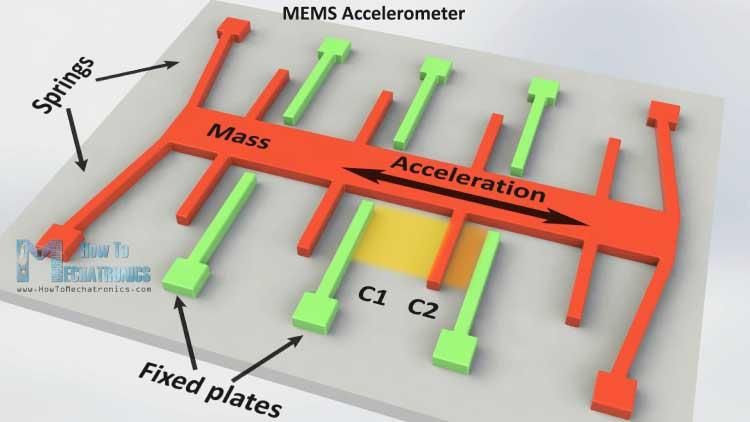
The core element of this sensor is a MEMS accelerometer which is typically formed by
proof mass and micro-sized capacitive plates internally. Some of these plates are fixed,
while others are flexible to move between these plates according to the displacement
of mass. Movement of plates occur difference in capacitance or an imbalance in the
capacitive half bridge which can be amplified to produce a voltage proportional to the
acceleration [37]. Figure 22 shows the structure of MEMS accelerometer and the work
basic idea.
Figure 22. The basic structure of MEMS accelerometer [39].
H3LIS33DL accelerometer sensor has the following features as mentioned in
datasheet [37]:
Voltage Supply 2.16 V - 3.6 V.
Low-voltage compatible IOs, 1.8 V.
Ultra-low power consumption down to 10 μA (low-power mode).
±100g/±200g/±400g dynamically selectable full scales.29
/SPI digital output interface.
16-bit data output.
Sleep-to-wakeup function.
10000 g high-shock survivability.
ECOPACK®, RoHS and “Green” compliant.
Temperature range -40 - +85 °C.
6.3 Gyroscope ICM20649
The ICM20649 consists of three different MEMS gyroscopes, which can detect the ro-
tation of X-, Y-, and Z- Axes. Gyroscope is a device that can measure angular rotation
or angular motion by means of Coriolis Effect which generates a force that moves the
mass due to changes occur with velocity (V) and external angular rate (Ω). The value
of displacement of mass is directly related to angular rotation. That means when gyro-
scope is rotated in different angular motion, the Coriolis Effect causes a vibration which
can be detected by changing in capacitance values. This value can be amplified, de-
modulated and filtered to produce a voltage that is proportional to the angular rotation.
The voltage is digitized by using 16 bit ADCs to sample each axes. The full scale dy-
namic range or angular rate range of ICM20649 is ±500, ±1000, ±2000, or ±4000 de-
grees per second (dps) [38]. Figure 23 shows the structure of MEMS Gyroscope and
the work basic idea.
Figure 23. MEMS of Gyroscope [39].30
Gyroscope ICM20649 sensor has the following features as mentioned in datasheet
[38]:
3-Axis gyroscope with programmable FSR of ±500 dps, ±100 dps, ±2000 dps,
and ±4000 dps.
3-Axis accelerometer with programmable FSR of ±4g, ±8g, ±16g, and ±30g.
User-programmable interrupts.
Wake-on-motion interrupts for low power operation of applications processor.
512-byte FIFO buffer enables the applications processor to read the data in
bursts.
On-Chip 16-bit ADCs and Programmable Filters.
DMP Enabled:
o SMD, Step Count, Step Detect, Activity Classifier, RV, GRV
o Calibration of accel/gyro/compass
Host interface: 7 MHz SPI or 400 kHz
Digital-output temperature sensor
VDD operating range of 1.71V to 3.6V
MEMS structure hermetically sealed and bonded at wafer level
RoHS and Green compliant
Unfortunately, the Gyroscope for some reason did not provide any result in the proto-
type, so its data was not transferred, and therefore no relevant result was shown on
platforms.
6.4 Particle Photon
6.4.1 Overview and Features
The Particle Photon is a prototype hardware that works on Internet of Things over Wi-
Fi. It mainly consists of ARM Cortex M3 microcontroller and a Broadcom Wi-Fi chip
packed together in tiny thumbnail-sized module called PØ. Figure 24 shows the Parti-
cle Photon [40]:31
Figure 24. Particle Photon [40]:
The technical features of the Particle Photon are listed below [40]:
Particle PØ Wi-Fi module [Appendix 1]:
o Broadcom BCM43362 Wi-Fi chip.
o 802.11b/g/n Wi-Fi.
o STM32F205RGY6 120MHz ARM Cortex M3.
o 1MB flash, 128KB RAM.
On-board RGB status LED (ext. drive provided).
18 Mixed-signal GPIO and advanced peripherals.
6 analog input pins (A0 – A5) can read voltages.
8 digital pins (D0 – D7) can be configured as either inputs or outputs.
2 SPI, 2 UART and an .
Open source design.
Real-time operating system (FreeRTOS).
Soft AP setup.
FCC, CE and IC certified.
Due to IoT Wi-Fi board features, Particle Photon has been added to the Head Impact
prototype as a convenient solution that makes the device more flexible, longer distance
reachable and easier to access.32
6.4.2 Power Consumption Modes
Photon can be powered by Micro-USB or directly over the VIN pin, but in this case it is
needed to consider that the voltage should be regulated between 3.6-5.5VDC. When
Photon is powered by USB, VIN will provide an output of 1A and 4.8VDC, due to exist-
ence of Schottky diode between V+ of USB and VIN. Pin 3V3 can also be used as an
output with overhead limits of 100mA. However, the current in Deep sleep mode typi-
cally with the lowest limits of 80uA [40].
Power consumption is an essential advantage feature for a microcontroller. Photon
contains a processor of STM32F20x family, which has three low power modes depend-
ing on three variables short time in startup, lower power consumption and wakeup [41]:
Sleep mode: in this mode, only CPU is stopped while all other circuits are work-
ing properly. CPU can work again when an interrupt happens.
Stop mode: it is considered as lower power consumption mode. As it stops the
work of some chip components such as the PLL, crystal oscillator and all clocks
in 1.2V domain, but keeps the contents of SRAM and registers. The voltage
regulator can be adjusted on normal or low power consumption mode. The de-
vice is woken up from the stop mode as soon as receives any wakeup signal
from the Ethernet, or the USB, or other wakeup components.
Standby mode: it is considered the lowest consumption power, as it is switched
off some chip component the PLL, crystal oscillator and all clocks in 1.2V do-
main. It also loses contents of SRAM and registers, except the registers in the
backup domain and the backup SRAM. The device is gone out of Standby
mode as soon as receives an external reset or other signals.
6.4.3 Particle Cloud
Particle company offers a public and private cloud that can be used to manage the IoT
device. It makes Particle devices to communicate in secure and efficient way. Public
cloud is available for subscribers free of charge, but the received data is deleted every
60 seconds [43].33
For data security, it is necessary to create initial handshaking process using AES over
TCP. Once the device connects to the cloud, all devices on Wi-Fi networks can be
reached without needing to make any custom port forwarding or even changing in fire-
wall [42].
Particle Publish sends data to external servers using 150-200 bytes of data. When a
TLS / SSL connection is established directly to an external server, the device uses
5000 bytes of data for each piece of data sent including the TLS/SSL handshake data.
Because TLS/SSL authentication is done off the device using a webhook or events
stream that are sent by server [42].
6.4.4 Connect Adafruit to Photon
Different values of linear and rotational acceleration are collected by Adafruit through
Accelerometer and Gyroscope sensors respectively. Then the collected data is trans-
ferred from Adafruit microcontroller to Photon microcontroller using UART communica-
tion technology, as the transferred data is small size, the communication UART is reli-
able, available in both microcontrollers, and easy to install, since it needs only two sig-
nal wires to be connected and GNDs. Figure 25 illustrates the UART connections were
installed in practical prototype.
Figure 25. UART connection between Adafruit and Photon [35][40].34
7 Software System
7.1 Adafruit Feather nRF52840 Express
Previously, the software of Adafruit microcontroller has been installed by another stu-
dent Nargiza Deidieva as a thesis work [45]. The software was able to collect the data
from Accelerometer, then sent it wirelessly over Bluetooth protocol in order to be re-
ceived by any smartphone using "Bluefruit Connect" app, which is customized by Ada-
fruit company. Unfortunately, Gyroscope functionally wasn't given any data.
A simple modification happened to the software which included re-editing and adding
some commands to make the Adafruit Feather allow sending data to the Particle Pho-
ton. Additionally, a calibration code has been implemented for Accelerometer in order
to fit the position where the device has been located. Figure 26 shows values of X, Y,
and Z axes that had given by calibration software where the device assumed to put on
a flat table.
Figure 26. Accelerometer X, Y, Z values on a flat table.35
7.2 Particle Photon
Particle Photon has been coded to act as a gateway IoT Wi-Fi device by receiving data
from Adafruit microcontroller and sending it to Particle Cloud. The data is stored for a
moment, then it is transferred again through HTTP or webhook to a platform or through
designed HTML page in order to monitor the data graphically.
Simply, transmission process can be done by following three steps:
7.2.1 Transfer data from Adafruit to Photon
Adafruit has been connected to the Particle Photon via the UART port, where data can
be transferred safely. The transferred data was the data that was collected by the 3-
axis Accelerometer sensor, as the Gyroscope sensor did not give any result.
In fact, the process of transferring data was done by making some modifications to the
software to make the data sent by Adafruit as a stream packet through serial port and
received it by Photon.
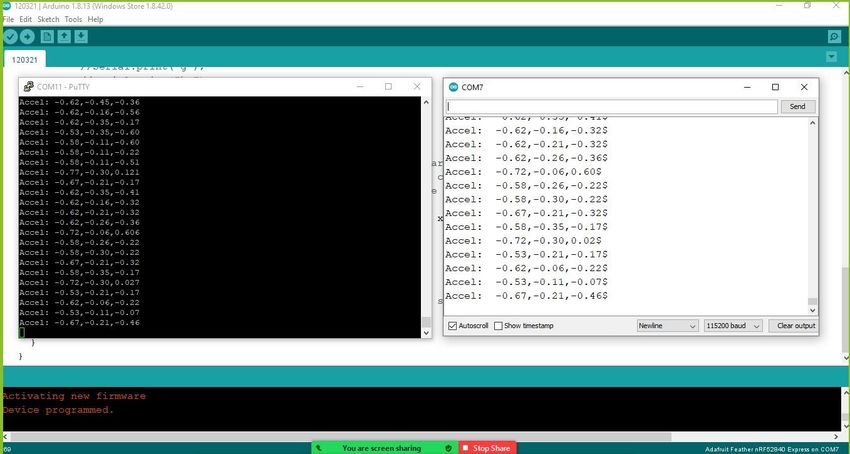
However, to ensure that data was sent successfully, Putty software has been installed.
The arduino software was used to show up the sent data by Adafruit, while Putty was
used to show up the received data by Photon, as shown in Figure 27 where data has
been sent and received successfully. The data was the Accelerometer data in the X, Y,
and Z axis separated with comma.
Figure 27. Transferred data from Adafruit to Photon.36
7.2.2 Transfer data from Photon to Cloud
The received packet by Photon can be parsed into data, then the splitted data trans-
ferred again to the Particle Cloud where it can be viewed in Events part. Events in
cloud can be stored for 60 seconds as a maximum duration for free membership, which
is fairly enough to redirect the received data to a desired online platform. Figure 28
shows 3-axis Accelerometer (X, Y and Z) data while passing through Particle Cloud.
Figure 28. The data on Particle Cloud.
7.2.3 Transfer data from Cloud to Platform
The transferred data from Cloud to a platform server can be done using webhook, or
HTTP protocol. A webhook is used commonly to deliver data from a system app such
as Cloud to a web page address or user app, whereas HTTP is used to make a con-
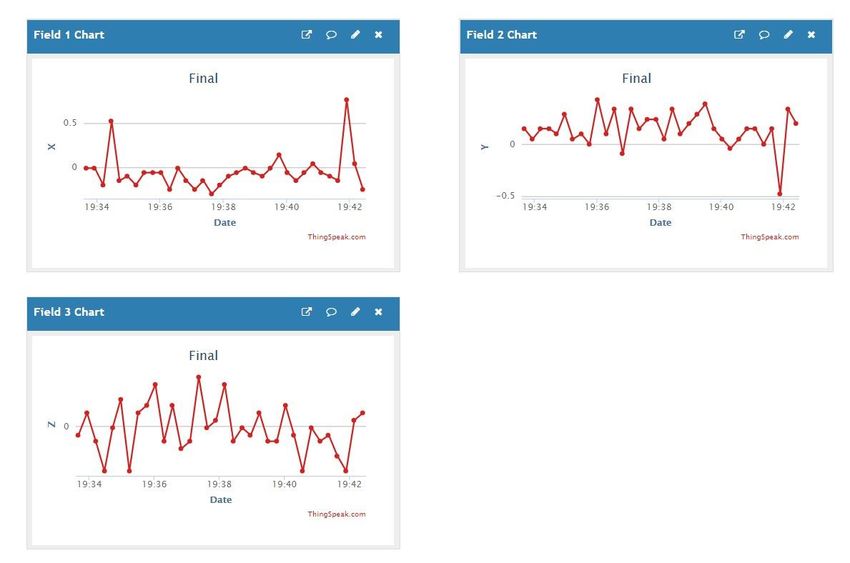
nection between the server and HTML page in order to be viewed by the user.37 7.3 Platforms Three platforms have been created during practical work of this thesis: Thingspeak, Blynk, and webserver. 7.3.1 Thingspeak Thingspeak is one of the most commonly recommended by Particle team as an open source IoT analytics platform using MATLAB simulator. It can be used to visualize the posted data by devices instantaneously over webhook that carries data instantly as HTTP request (POST) to Thingspeak application. That means you view data as it hap- pens immediately. Simply, as soon as packet arrives to Particle Photon, it sends the splitted data directly to Particle Cloud, which acts as a routing device. A webhook was built to take the split- ted data (X, Y and Z) from the Cloud over JSON transport protocol and sent it to Thing- speak website in order to be viewed graphically in channels. The prototype was located on a flat table and was exposed to a slow movement in var- ious directions. The graph in channels were responding to some movement resulting changes in axes values X, Y and Z positive or negative according to the direction of movement. Figure 29 shows X, Y and Z axes values distributed in three channels separately for period of 8 minutes. These values have been taken by Accelerometer only, which were representing the values of linear acceleration for player's head.
38

                       Figure 29. Accelerometer data on Thingspeak

According to Thingspeak website options, it was mentioned that Thingspeak can up-
date the arrived data every few seconds for free subscribed members, but it can also
offer updates every one second as a minimum time period for prepaid subscribed
members, which might be not useful enough for a project like Head Impact as it needs
at least few updates per each single second to assess the concussion accurately.

7.3.2   Blynk

Blynk is a platform that is designed to work with iOS and Android mobile applications
over the internet to control microcontroller, such as Arduino, Particle Photon,.. etc. It is
highly recommended by amateurs and professionals where it is possible to view, store
and visualize the received data. Moreover, it can control the microcontroller remotely.

In practice, Particle fully supports Blynk platform through the existence of Blynk library
that makes the connection between Particle Photon and Blynk server is easier. As
soon as Blynk server is begun, the transferred data from Photon to Blynk app is han-
dled, so that the received data is viewed on Blynk platform.

To begin with the Blynk platform, it is necessary to have Blynk application that is up-
loaded on mobile through which designs Blynk application for viewing data on chart. A
39
Blynk application TEST1 was designed to receive the splitted data (X, Y, and Z) using
virtual pins, which were also added as a function instruction on Photon code. Figure 30
shows three different color lines representing the received data (ACCX, ACCY and
ACCZ) by Blynk app. The prototype was located on a flat table and was exposed to a
slight movement in various directions. The graph was responding to any change in
movement instantaneously resulting change in lines ACCX, ACCY and ACCZ accord-
ing to the direction of movement. Thus, it is considered an assessment of head move-
ment when the prototype put in a helmet that moves according to the movement of the
player's head.
Figure 30. Accelerometer data in Blynk platform
Comparing to Thingspeak platform, Blynk is producing more effective timing response
since it can update the received data every 100 milliseconds. It can also save the re-
ceived data as csv file. Unfortunately, the chart can be displayed only on smartphone
Android or iOS system. It can also be displayed on computer, but under emulator soft-
ware such as using BlueStacks, YouWave … etc.40
7.3.3 Webserver
A special platform has been designed to satisfy the requirements of the project. This
platform was composed of webserver and static page using HTML, where both were
uploaded to Photon. The webserver allowed receiving the sent data by Adafruit and
saving it in a buffer temporarily till it was sent to HTML static page through HTTP
transportation protocol. The IP address of HTML page was given to user by webserver
through Cloud.
A static page has been designed to view the received data instantaneously in a graph-
ical way. The chart has been taken from a webpage https://code.highcharts.com as a
free data visualization graph, which can offer different types lined or scattered. In addi-
tion, the time axis has been adjusted accordingly to the data time, while the value of
the acceleration was given according to the value of acceleration in X, Y and Z axes.
Figure 31 shows the designed HTML static page before connecting to webserver.
Figure 31. The designed HTML static page41
Webserver was able to view data on HTML chart every 100 nanoseconds at its best
case, but for testing purpose it has been built to receive and send data every 100 milli-
seconds. The received data (X-Accel, Y-Accel and Z-Accel) by HTML can be repre-
sented into three various color lines as shown in figure 32. The prototype was placed
on a flat table and exposed to two fast hits resulting these two fast response values
(one was negative colored blue, while other was positive colored red triangles).
Figure 32. Accelerometer data in HTML via Webserver platform
Additionally, chart offers an option that makes it easier for the user to follow the graph.
It can view the received data (X-Accel, Y-Accel and Z-Accel) separately through double
click on the unwanted legend X-Accel or Y-Accel or Z-Accel to hide it. Figure 33 shows
the received data are viewed separately X-Accel or Y-Accel or Z-Accel.42
Figure 33. Viewing the received data separately
However, previous graphs show that the device was very sensitive as the data
changed rapidly around the same value, so it needed to be filtered in order to get a
more appropriate graph.
Making a comparison between webserver and Blynk platform, it has shown that web-
server was more powerful in timing response than Blynk, since it can provide a faster
response to the data approximately of 100 nanoseconds at its superior cases. Howev-
er, webserver cannot process and store the received data.43
8 Conclusion
To summarize, the goal of the thesis work was to find a transmission way to transfer
the prototype data of Head Impact in order to receive it and view data in more practical
and convenient way. An IoT system has been chosen to the prototype in order to han-
dle and transfer data over Wi-Fi communication technology, which made the prototype
able to broadcast the data to wider area, due to the wide spread of internet networks
and moderate consumption to the power.
The data was successfully transferred from the prototype of Head Impact device to the
Photon via the UART circuit, which is sent as serial packets, then packets are splitted
into data and sent to the Photon to the cloud, where the cloud is delivered to a platform
to display it graphically. There were several platforms for displaying data:
Thingspeak platform: was not that functional platform, because it provides min-
imum time response to display the data in one second.
Blynk platform: was kind of estimated platform, as it offers a minimum time re-
sponse of 100 milliseconds to display data instantaneously, however, it cannot
be viewed on a computer.
Webserver platform: is considered the best platform that is used for the proto-
type, since it provides a minimum time response of 100 nanoseconds in its best
case. In addition, it works on all smart devices such as computers, mobile de-
vices and others within the network.
Future development can be done to make the project more distinguished and effective
through adding a filter to the system in order to display data smoothly, making it easier
to be followed and diagnosed. Moreover, it would be better to find a solution for data
storage in order to save the head's evaluation data in case that needs to view it later.You can also read