Evaluating Animal-Based Foods and Plant-Based Alternatives Using Multi-Criteria and SWOT Analyses - MDPI
←
→
Page content transcription
If your browser does not render page correctly, please read the page content below
International Journal of
           Environmental Research
           and Public Health

Article
Evaluating Animal-Based Foods and Plant-Based
Alternatives Using Multi-Criteria and
SWOT Analyses
Irene Blanco-Gutiérrez 1,2, * , Consuelo Varela-Ortega 1,2 and Rhys Manners 3
 1    Department of Agricultural Economics, Statistics and Business Management, ETSIAAB,
      Campus Ciudad Universitaria, Universidad Politécnica de Madrid (UPM), Av. Puerta de Hierro 2-4,
      28040 Madrid, Spain; consuelo.varela@upm.es
 2    CEIGRAM, Universidad Politécnica de Madrid (UPM), Senda del Rey 13, 28040 Madrid, Spain
 3    International Institute of Tropical Agriculture (IITA), KG 563 Kigali, Rwanda; r.manners@cgiar.org
 *    Correspondence: irene.blanco@upm.es

 Received: 1 September 2020; Accepted: 26 October 2020; Published: 29 October 2020

 Abstract: Global diets have transitioned in recent decades with animal and processed products
 increasing. Promoting a reversal in these trends towards plant-based diets could reduce the
 environmental impacts of food systems and reduce the prevalence of non-communicable diseases
 and malnutrition. In Spain, a reference point for the Mediterranean diet (predominantly plant-source
 based), plant-based alternatives to traditional animal-based products are receiving increased attention.
 However, limited focus has been given to the opinions of stakeholder groups on the potential of these
 novel products. We evaluate the opinions of stakeholders within the Spanish agri-food sector, using
 multicriteria and SWOT analyses, on traditional and novel food products. Stakeholders involved in
 the supply chain of food products (producers, processors, and distributors) were critical of novel
 plant-based foods, highlighting problems with their taste, processing technology, and high prices.
 These results contrast with the perspectives of policymakers, researchers, environmental NGOs,
 and consumers who see novel products more positively - healthier, more sustainable, and highly
 profitable. These results illustrate the more traditional mindset seen in Spanish production systems,
 contrasting with the rapidly shifting tastes and demands of consumers and the potential legislative
 orientation of policymakers. This study calls for improved understanding and collaboration between
 stakeholders to better manage complex choices that affect the future of food systems during their
 needed transformation.

 Keywords: high protein foods; meat; milk; vegetarian substitutes; innovation; diet’s sustainability;
 perceptions; stakeholders

1. Introduction
     The structure of current food systems has left more than two billion people suffering some form of
malnutrition [1]. These systems are also major contributors to deforestation, soil degradation, freshwater
contamination, biodiversity loss and climate change [2–5]. Increasing the sustainability of global food
systems will be decisive in achieving the UN’s Sustainable Development Goals (SDGs 2, 12, 13) and stay
within the boundaries of the United Nations Framework Convention on Climate Change’s (UNFCC)
Paris Agreement [6]. However, sustainable improvements will have to be made in the contexts of
growing global populations and rapidly evolving dietary patterns [1,6]. Food productive capacity will
have to increase by at least 50% by 2050 to track increasing demand, intensifying competition for land,
water, and energy [2]. These developments underscore the urgent need for policies and strategies to

Int. J. Environ. Res. Public Health 2020, 17, 7969; doi:10.3390/ijerph17217969     www.mdpi.com/journal/ijerph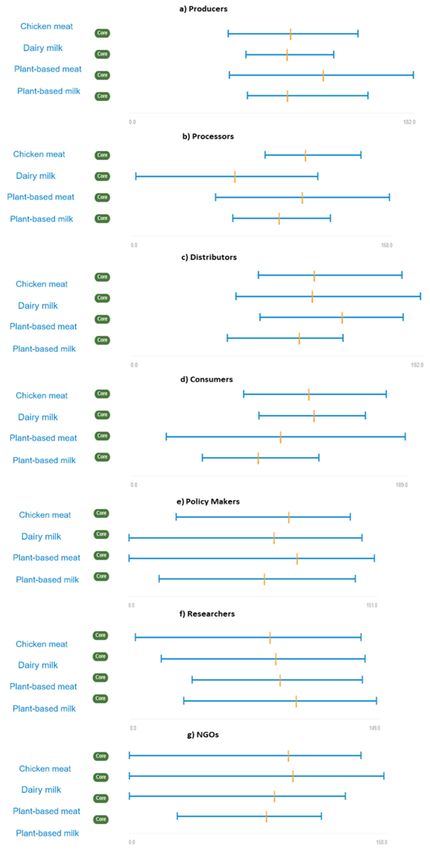
Int. J. Environ. Res. Public Health 2020, 17, 7969                                               2 of 26

sustainably reorientate food systems through alternative food consumption patterns [2] and reduced
environmental impacts of dietary choices [7].
     Promoting healthy and sustainable food consumption presents a potential mechanism to improve
the environmental condition of production systems, achieve sustainable food and nutrient security,
and to enhance public health [8–11]. A number of seminal studies have outlined potential diets that,
if widely adopted, could reorient food systems towards more sustainable pathways [6,12]. These studies
recommend, in many cases, traditional Mediterranean or vegetarian diets as mechanisms to ensure
good nutrition and reduce environmental impacts [7,9,13].
     Despite these calls, global diets are increasingly transitioning away from basic and staple
food products such as fruits and vegetables, towards higher-value (fish, meat, dairy products) and
processed (high in fat, sugar, or salt) products. These trends have been implicated in the increased
prevalence of non-communicable diseases and compounded the environmental health impacts of
food production [1,9,14,15]. An example of where these changes have already been seen is Spain,
a reference point for the Mediterranean diet, where traditional plant-based diets have become less
prevalent [7,16,17].
     Nevertheless, in several countries, including Spain, there is a small but growing number of
consumers reducing, in part or completely, animal product consumption and returning to more
traditional diets [17]. This segment of consumers are restricting their consumption of meat in favour
of a more plant-based diet, convinced of the health, ethical, and environmental benefits of such
change [18]. In response, an entire industry has grown to develop healthy and more sustainable
alternatives to animal food products [19]. Manufacturers are currently focusing on new product
developments, which include cultured meat and innovative plant-based foods with a high-protein
content and improved texture and appearance. The European market for plant-based meat and dairy
alternatives is particularly promising, with annual growth rates in of 14% and 11%, respectively [20].
The scale of growth has led to suggestions that this sector may present a step on the pathway of
improving sustainable food systems [21].
     Previous studies of novel and plant-based alternative food products to replaced animal-based
products have analysed their sensory acceptance [22,23], technological feasibility [24], sustainability
gains [25], nutritional and health implications [18,26], economic viability, and effects on markets
and societal organisation [19,27]. However, analyses of meat alternatives as production systems
remain fragmented, lacking an integrated assessment that includes their associated socio-economic,
ecological, technological, and organisational implications [19]. Besides, there is a relative dearth of
research regarding stakeholder responses to these products [27,28] and how they compare to the
products they are designed to replace. The vast majority of scientific studies on new (plant) protein
foods focus on consumers [29–31], neglecting the opinions of other major stakeholders directly or
indirectly involved in the agri-food supply chain. The present study addresses this research gap by
investigating how different stakeholders (not only consumers) evaluate plant-based meat alternative
food products according to multiple value domains (economic, social, environmental, policy, sensorial,
and technological).
     One method for obtaining stakeholder preferences and responses is through the use of Multicriteria
Analysis (MCA). MCA provides a systematic, transparent approach that increases objectivity and can
generate reproducible results by directly comparing different products, relative to each other and
to specific analysis criterion [32,33]. A number of methodologies have been developed within the
umbrella of MCA, including Multicriteria Mapping (MCM). MCM is used in complex and uncertain
situations in which many decision factors coexist and where intuitive solutions are not easy to
achieve [34,35]. MCM has been used for a wide range of different purposes, including the appraisal
of options for improved food production and consumption [34,36]; health and nutrition [37,38];
energy strategy [39,40]; and environment and climate change policy consultation [41,42]. To the best
of our knowledge, MCM, despite its potential, has never been used to assess stakeholders’ attitudes
towards food products.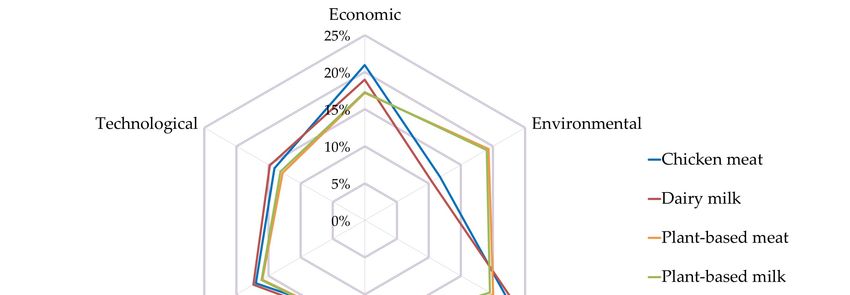
Int. J. Environ. Res. Public Health 2020, 17, 7969                                                                    3 of 26

        In this study, MCM will be used in combination with Strengths, Weaknesses, Opportunities,
Threats     (SWOT) analysis to better understand the preferences of Spanish stakeholders regarding
Int. J. Environ. Res. Public Health 2020, 17, x                                                                        3 of 26
plant-based alternatives to animal-based food products, compared to the products they are designed to
replace.    The analysis
distributors,     consumers,  includes   seven majorresearchers,
                                   policy-makers,        groups of stakeholders    (producers,
                                                                      and environmental       NGOs)processors,
                                                                                                        within distributors,
                                                                                                                 the Spanish
consumers,
agri-food sector. From this, perceived strengths and weaknesses of novel foods willagri-food
                 policy-makers,      researchers,    and  environmental     NGOs)   within   the  Spanish              sector.
                                                                                                              be derived,   as
From
well asthis,   perceived
           external            strengthsand
                       opportunities        andthreats
                                                  weaknesses
                                                         that mayof benefit
                                                                    novel foods    will be
                                                                            or impede        derived,
                                                                                          their furtherasdevelopment.
                                                                                                           well as external
                                                                                                                         The
opportunities
study provides      andan threats   that may
                           integrated,          benefitanalysis
                                          structured      or impede   their
                                                                  of the    further development.
                                                                          perspectives                 The studyfacilitating
                                                                                         of key stakeholders,       provides
an  integrated, structured
better-informed         decisionsanalysis
                                     about the of the perspectives
                                                  future   of Spanishoffood
                                                                         key systems
                                                                             stakeholders,    facilitating
                                                                                        in their            better-informed
                                                                                                 needed transformation.
decisions about the future of Spanish food systems in their needed transformation.
2. Methodology
2. Methodology
        The present study combines a MCM and a SWOT analysis to explore how different stakeholders
evaluate present
        The  specific study      combines
                         animal-based         a MCM
                                           foods   and and    a SWOTalternatives.
                                                        plant-based    analysis to explore    how different
                                                                                      Both methods             stakeholders
                                                                                                        are implemented     in
evaluate
a participatory manner, through face-to-face interviews with key stakeholders within and outsidein
             specific   animal-based      foods   and  plant-based   alternatives.  Both   methods    are implemented     thea
participatory      manner,      through    face-to-face    interviews  with  key  stakeholders
agri-food chain, performed in 2019–2020. First, MCM is applied to examine the performance of food  within   and  outside  the
agri-food     chain, performed
products according                    in 2019–2020.
                             to various    criteria andFirst,   MCM is MCM
                                                           sub-criteria.  applied to examine
                                                                                results          the performance
                                                                                          are afterwards             of food
                                                                                                             further applied
products     according      to various  criteria   and  sub-criteria.  MCM    results  are afterwards
for SWOT. A SWOT matrix is built to specifically analyse the current situation of innovative protein-    further  applied  for
SWOT.      A SWOT
rich vegetable          matrix
                     foods    andistheir
                                     builtpotential
                                           to specifically    analyse
                                                      to replace      the currentproducts.
                                                                  animal-based      situation of innovative protein-rich
vegetable foods and their potential to replace animal-based products.
2.1. Multi-Criteria Mapping
2.1. Multi-Criteria Mapping
     We use Multi-criteria Mapping (MCM) [43] to systematically clarify what food products are
     We use Multi-criteria Mapping (MCM) [43] to systematically clarify what food products are
preferred by stakeholders and why. A key strength of MCM is the ability to capture different
preferred by stakeholders and why. A key strength of MCM is the ability to capture different
stakeholders’ perspectives, values, and uncertainties using structured and transparent analysis [44].
stakeholders’ perspectives, values, and uncertainties using structured and transparent analysis [44].
The MCM software package provides immediate visual feedback on the outcomes and choices made,
The MCM software package provides immediate visual feedback on the outcomes and choices made,
enabling respondents to easily understand and modify their responses [45]. The output of MCM is
enabling respondents to easily understand and modify their responses [45]. The output of MCM is both
both a qualitative and quantitative ‘map’ of how different options perform under distinct criteria.
a qualitative and quantitative ‘map’ of how different options perform under distinct criteria. Although
Although MCM can be used to explore best option, it also provides a robust and detailed
MCM can be used to explore best option, it also provides a robust and detailed understanding of how
understanding of how options are appraised by the respondents and how outcomes change,
options are appraised by the respondents and how outcomes change, depending on the view that is
depending on the view that is taken and the values brought to bear in doing so [46].
taken and the values brought to bear in doing so [46].
     The MCM approach usually follows six steps (Figure 1), as described by Stirling [35] and
     The MCM approach usually follows six steps (Figure 1), as described by Stirling [35] and
Holdsworth [37]. The following sections describe how these steps have been implemented in this
Holdsworth [37]. The following sections describe how these steps have been implemented in this study.
study.

      Figure 1. Steps of the multi-criteria mapping. Source: Adapted from Stirling [35] and Holdsworth [37].
      Figure 1. Steps of the multi-criteria mapping. Source: Adapted from Stirling [35] and Holdsworth [37].
Int. J. Environ. Res. Public Health 2020, 17, 7969                                                  4 of 26

2.1.1. Frame the Problem
     The first step in any MCM process is to frame the problem, i.e., to define the decision context
and the purpose of the study. The present study has been framed inside the Protein2Food (P2F)
project (Development of high-quality food protein through sustainable production and processing;
Project No. 635727-2, Horizon 2020 Programme, under the Societal Challenge 2—Food Security,
Sustainable Agriculture and Forestry, Marine, Maritime and Inland Water Research and the Bioeconomy,
EU Commission, 2015–2020, https://www.protein2food.eu/). P2F aimed to develop innovative, healthy,
and sustainable plant-based protein-rich products from multi-purpose seed crops (quinoa, amaranth
and buckwheat) and grain legumes (lupin, fava bean, chickpea and lentil). Examples of such food
products included plant-based milk and infant formulas, yoghurt alternatives, meat analogues,
breakfast cereals, and pasta and bread products free of soy or egg proteins. With these innovative
products, the project intended to increase the choice of plant-based foods and to help European
consumers decrease their animal-protein intake. Inputs and feedback from key stakeholders were
actively pursued and carried out through the project ‘stakeholder forum’, an advisory body to the
project. The stakeholder forum met annually and sought to account for the diversity of viewpoints of
EU stakeholders directly or indirectly involved in the agri-food value chain.
     The present study aimed at assessing the perception of the new food products developed in P2F
(and their animal counterparts) across different stakeholder groups. In total, 63 stakeholders from seven
different groups (9 per group) were identified and interviewed face-to-face from 2019–2020. In our
study, interviews were limited to stakeholders from the stakeholder forum who are based within Spain
(geographical scope of the study) and we used snowball sampling with stakeholders to identify other
individuals to interview. More information about the P2F stakeholder forum and the MCM stakeholder
consultation can be found in Manners et al. [47] and Blanco et al. [48]. Stakeholder groups were defined
according to the breakdown used in the P2F stakeholder forum: (1) Producers (independent farmers,
livestock owners, and relevant farmers’ associations); (2) Processors (food industries, including the
Small and Medium-sized Enterprises (SMEs) involved in P2F); (3) Distributors (food distributors’
associations, supermarkets, grocery stores, restaurants); (4) Consumers (flexitarians or meat-reducers,
which represent the biggest growth potential for plant-based protein products [49]); (5) Policy-makers
(Official Departments of Agriculture, Health and Environment at national level and the EU Commission);
(6) Researchers (from P2F project and other research institutions); (7) NGOs (environmental and food
security-related).

2.1.2. Identify Options (Food Products)
      This step is devoted to the selection of food products to be appraised. Four food products were
selected: two new plant-based products developed in P2F (lentil-based vegetable milk, and lupin and
amaranth based fiber-like vegetable meat) and two animal-based products (dairy milk and chicken
meat) acting as traditional counterpoints to the innovative vegetable products. Detailed information
on the functional and nutritional properties of the new P2F food products can be found in [50,51].
      The selection of products was based on discussions with the P2F stakeholder forum and the
project team. At the time this research was carried out, vegetable milk and meat prototypes were
fully developed and ready for testing. The lentil-based milk was perceived to be a good substitute
for cow milk, with similar protein and fat content, and better than other typical dairy milk replacers
(e.g., more environmentally friendly than soy-milk and richer in proteins than almond or rice milks) [51].
Lupin and amaranth based fiber-like meat was also considered a good alternative for chicken meat
for the same reasons—its ability to provide the same amount of proteins and energy with lower
environmental impact [50]. Cow milk and chicken meat were also found particularly relevant as
animal-based counterpart products. Both are widespread products, commonly found in traditional
European diets, that in recent years have been replaced by a growing number of plant-based substitutes.
Chicken meat was chosen instead of red meat because its consumption is rapidly increasing, and its
plant-based alternatives are more widely marketed and better known than beef or pork vegan products.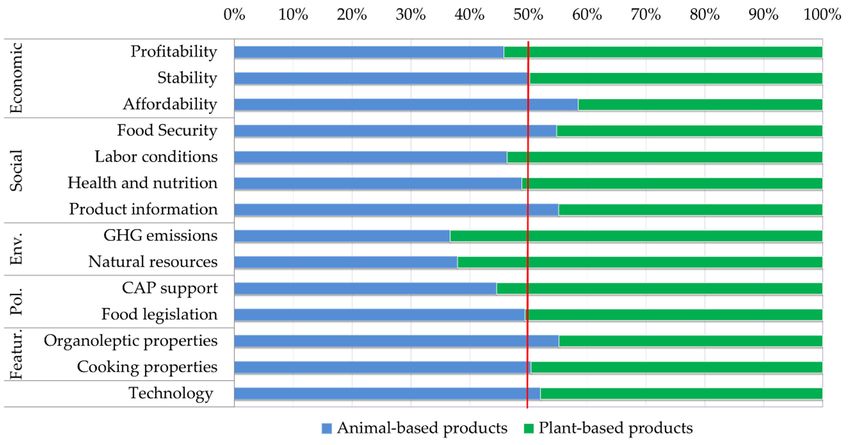
Int. J. Environ. Res. Public Health 2020, 17, 7969                                                                    5 of 26

2.1.3. Deciding Criteria
     This step is key in any MCA. It refers to the identification of criteria, which are the measures
of performance that are used to evaluate the different options (food products) previously defined.
The identification process was performed in collaboration with P2F stakeholders consulted during
the second stakeholder forum meeting, held in Caserta (Italy), in May 2017 [48]. The meeting was
attended by 50 participants: 38 P2F project members, and 12 stakeholders from the stakeholder forum.
Participants were carefully selected by the P2F coordination team, in collaboration with P2F partners
and the EU Commission, to include representatives from each main group of stakeholders considered in
the project and in this study (producers, processors, distributors, consumers, policy-makers, researchers,
and environmental NGOs). Following Holdsworth et al. [37], the initial identification of participants
was done ‘ad-hoc’, following a snowball sampling procedure. Then, high ranking individuals were
selected to represent their stakeholder groups, taking into consideration their positions in terms of
influence and relevance [38,52], in particular: professional knowledge and trust within their field,
experience acting as representatives in relevant forums, connections to policy, capability of influencing
others and capacity to engage in group discussions, level of interest and motivation in participating in
the project, and capacity to disseminate the discussions and results of the project in their own field
of activity.
     Participants were asked to state the most important criteria and sub-criteria that, in their view, should
be considered when choosing or comparing different protein-rich food products. In total, 14 sub-criteria
were chosen and grouped into 6 criteria: 1 Economic, 2 Social, 3 Environmental, 4 Policy, 5 Relevant
features for the consumer, and 6 Technological. Criteria and sub-criteria are shown in Table 1.

                        Table 1. Criteria, sub-criteria, and questions included in the interviews.

        Criteria                        Sub-Criteria                                   Questions
                                                                  How profitable do you think this product is? Do you
                                        Profitability
                                                                 think it is a sector where you can earn a lot of money?
                                                                   How stable do you think this sector is in terms of
       Economic                           Stability              agricultural prices and yields? Is this sector safe from
                                                                           sudden ups and downs in prices?
                                       Affordability             Do you think the product is affordable? How much?
                                                                Do you think that this product makes the protein more
                                       Food security
                                                                        accessible/available to the consumer?
                                                                 Do you think that the working conditions in this sector
                                    Labour conditions
          Social                                                are adequate? (salary, labour accidents, and labour laws)
                           Supportive of health and nutrition   Do you think that this product is healthy and nutritious?
                             Adequate information about the            Do you think the information available is
                                        product                                  adequate/sufficient?
                               Emissions related to climate     Do you think these products have a low greenhouse gas
                                         change                                     emission rate?
    Environmental            Use of natural resources (water      Do you think that these products have a low rate of
                                       and land)                   natural resources consumption (land and water)?
                                                                   Are Common Agricultural Policy (CAP) subsidies
                               CAP subsidies convenience
                                                                                  convenient?
          Policy
                                Adequate regulation/food        Is there adequate regulation/legislation regarding food
                                 legislation (food safety)                       safety in this sector?
                                 Organoleptic properties         Do you think that this product is tasty and pleasant?
   Product Features
                                    Ease of preparation                Do you think this product is easy to cook?
                                Adequate production and          Do you think that this sector has adequate production
     Technological
                                 processing technology                       and processing technology?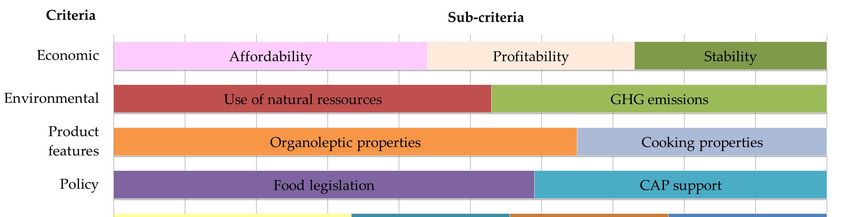
Int. J. Environ. Res. Public Health 2020, 17, 7969                                                   6 of 26

2.1.4. Assessing Scores (Scoring Food Products)
     This step is devoted to the evaluation of the different food products. Stakeholders selected in
Section 2.1.1, were invited to score each of the four food products (plant-based meat, chicken meat,
plant-based milk, and dairy milk) on a numerical scale (0–100) under each of the 14 sub-criteria
chosen (see Table 1), one-by-one, 0 representing the worst and 100 the best relative performance.
These scores are not made relative to another product, but individually. A respondent is only ever
considering one product at a time, so their score relative to each sub-criterion is independent of all
other products. To allow uncertainty in the estimation, the MCM software allows respondents to give
a range (‘pessimistic’ or minimum score, and ‘optimistic’ or maximum score) rather than a single
number [45]. During the scoring process, stakeholders were asked to explain the range assigned to the
different food products and the assumption made when deciding value ranges. Questions used to
score each food products under different sub-criteria are shown in Table 1.

2.1.5. Assigning Weights (Weighting of Criteria and Sub-Criteria)
      In this step, respondents assign weights to each criterion and sub-criterion. We utilised
a methodology similar to Stirling and Mayer [34], Hansen [53], McDowall and Eames [39],
and Raven et al. [42] to assign weights. Firstly, stakeholders were asked to assess the importance of the
different criteria when choosing food products, with a single score (not a range) from 0 (representing
the worst) to 100 (the best), so the more points they gave to a criterion the more important it was
considered. These scores are not made relative to another criterion, but individually (each criterion can
be given 100). Secondly, stakeholders were invited to evaluate the importance of each sub-criterion
with respect to the criterion it belongs to. Stakeholders were asked to distribute the score given to a
criterion among all the sub-criteria that were part of this criterion.

2.1.6. Reviewing (Examining) the Results
      The MCM software provides a series of parameters to facilitate the interpretation and review of
results. In the present study, the following parameters were used:
      “Ranks”. This is used to calculate the overall performance rank for each food product, under all
the criteria and sub-criteria taken together for a specific stakeholder’s perspective. The MCM software
uses the simple ‘linear additive weighting’ method, in which ranks are derived by adding weighted
scores. The minimum (‘pessimistic’) and maximum (‘optimistic’) scores given by a stakeholder to a
product under a specific criterion are multiplied by the weight percentages assigned to that criteria.
Ranks are calculated by repeating this process for each criterion and summing all values obtained.
The final ranks of products were discussed in-situ with stakeholders to check whether they accurately
represented their perspective.
      “Uncertainty”. This parameter reflects the degree of uncertainty displayed in the scores and
resulting ranks of interviewees. In other words, it reveals how stakeholders express how unsure they
are in their scoring intervals. We use ‘ratio uncertainty’, which is expressed as a ratio to the median
score. A high score means a high degree of uncertainty, and on the contrary a low score means a low
degree of uncertainty. The degree of uncertainty assigned to a specific stakeholder group is represented
as a mean value for all respondents (stakeholders) belonging to the group.
      “Weights”. This parameter displays the relative magnitudes of weightings assigned to different
criteria under different stakeholder’s perspectives. The MCM software only shows the range of weights
attached to criteria; it does not provide information about the weights of different sub-criteria. For that
reason, the weight that each sub-criterion has concerning the criteria group it belongs to has been
calculated ex-post, not with the MCM software.
      For further information about the arithmetic behind the calculation of ranks, uncertainties,
and weights, see Annex A of the MCM manual [45]. Furthermore, we calculated two additional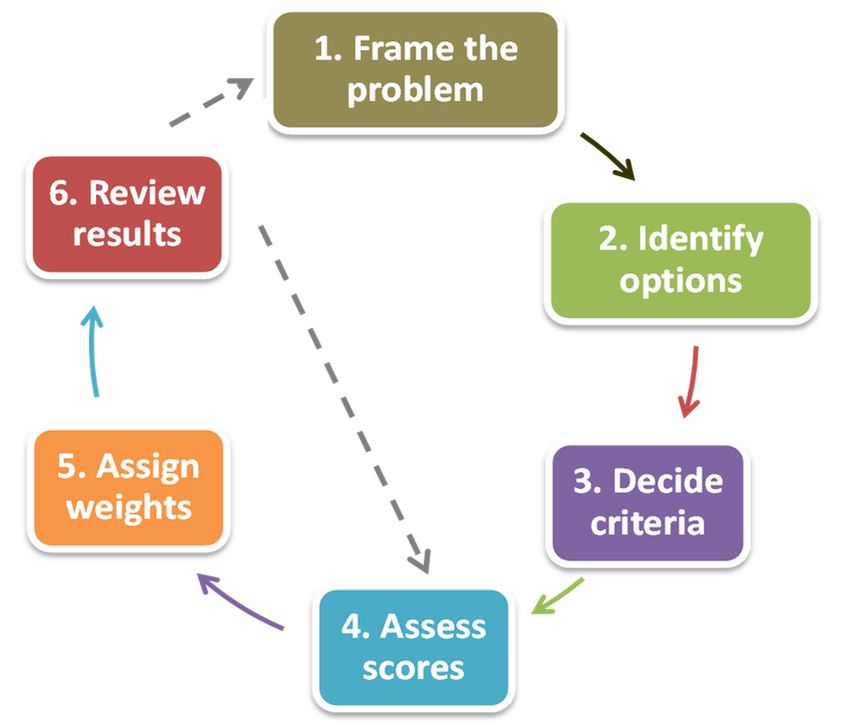
Int. J. Environ. Res. Public Health 2020, 17, 7969 7 of 26
parameters (sub-criteria weighted score and criteria weighted score) to analyse in more detail the
performance of food products under different criteria and sub-criteria.
“Sub-Criteria weighted score” (SubWS) of a food product p, for a stakeholder i, is represented by
the following equation:
Wsub
Sub WSp,i = scrp,i · P (1)
r Wcrtr
where (scrp,i ) is the average score value of a product p for a stakeholder i (the average of minimum
and maximum scores given by a stakeholder to a product under a specific criterion), Wsub is the
weight of the sub-criteria, and Wcrtr is the sum of weights assigned to each of the criteria groups r.
The sub-criteria weighted score shows the performance of food products under specific sub-criteria and
individual stakeholder perspectives. The value for a group of stakeholders is calculated by averaging
scores across stakeholders belonging to the group.
“Criteria weighted score” (CritWS), of a food product p, for a stakeholder i, is obtained as shown
in the following equation: X
Crit WSp, i = Sub WSp,i,s (2)
s
where Sub WSp,i,s is the sub-criteria weighted score of a food product p, for a stakeholder i, and a
sub-criteria s. Therefore, the criteria weighted score is simply the sum of all the sub-criteria weighted
scores that are included in a group of criteria. This shows the performance of food products under
specific criteria and individual stakeholder perspectives. Again, the value for a group of stakeholders
is calculated by averaging scores across stakeholders belonging to the group.
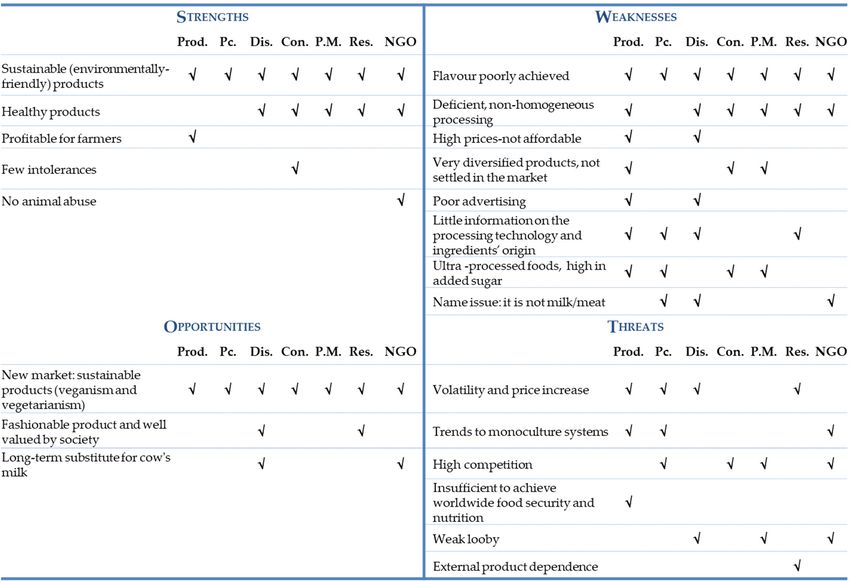
2.2. SWOT Analysis
SWOT is a well-known method used by companies for strategy formulation and development [54].
It stands for ‘strengths, weaknesses, opportunities, and threats’. Strengths and weaknesses are internal
factors that offer the products a competitive advantage or disadvantage. On the contrary, opportunities
and threats are external factors capable of facilitating or hindering the development of a product.
Recently, several studies have attempted to use SWOT for the entire supply chain in agricultural
product strategy formulation, such as Suwanmaneepong et al. [55] who used SWOT to develop
marketing strategies for agricultural products. Baudino et al. [56] also applied SWOT to analyse the
environmental impact of different food production supply chains.
In the present study, we performed the SWOT analysis as a complement to the MCM analysis.
At the end of each of the interviews, each stakeholder was asked to describe the strengths, weaknesses,
opportunities, and threats for each food product. Following Prišenk and Borec (2012) [57], MCM results
were used as a base for SWOT. Those MCM criteria and sub-criteria that rated the highest were
considered potential strengths of the products. On the contrary, those criteria and sub-criteria
that received the worst rating were deemed as potential weaknesses. Considering the objective
of the P2F project (developing innovative protein-rich vegetable products for replacing animal-based
products), we focused on plant-based products to try to investigate the trends and patterns that
may have either positive or negative impacts on the development of modern vegetable meat and
milk alternatives. Results from interviews were used to build a SWOT matrix, in which strengths,
weaknesses, opportunities, and threats of plant-based products were examined and differentiated by
stakeholder groups.
3. Results
3.1. Ranking of Food Products
Figure 2 shows the rank values of the four food products examined under all stakeholder’ views.
Results indicate that the most preferred product is plant-based milk (which has the highest mean and
extrema scores), followed by dairy milk, and plant-based meat. The least preferred food product is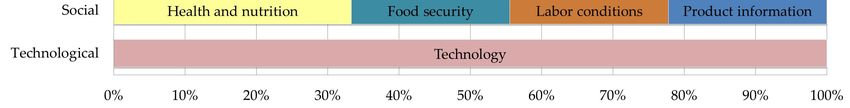
3. Results

3.1. Ranking of Food Products
         FigureRes.
Int. J. Environ. 2 shows   the rank
                    Public Health 2020,values
                                        17, 7969of the four food products examined under all stakeholder’ views.
                                                                                                          8 of 26
 Results indicate that the most preferred product is plant-based milk (which has the highest mean and
 extrema scores), followed by dairy milk, and plant-based meat. The least preferred food product is
chicken
 chickenmeat.
            meat. Nevertheless,
                   Nevertheless, ifif we
                                      we compare
                                          compare vegetable-based
                                                   vegetable-based products
                                                                       products against
                                                                                    against animal-based
                                                                                            animal-based products,
                                                                                                           products,
ititcan
     can be observed that the former are preferred over the latter (i.e., plant-basedmeat
        be  observed   that the former    are preferred over  the  latter (i.e., plant-based    meatisispreferred
                                                                                                         preferredto
                                                                                                                   to
chicken    meat,  and plant-based     milk to dairy milk). Both  pessimistic     (low)  and  optimistic
 chicken meat, and plant-based milk to dairy milk). Both pessimistic (low) and optimistic (high) mean   (high) mean
scores
 scores(left
          (leftand
                andright
                    rightsides
                          sidesofofthetheorange
                                          orangebar,
                                                 bar,respectively)
                                                      respectively)arearegreater
                                                                           greaterfor forvegetable-based
                                                                                          vegetable-basedproducts
                                                                                                            products
than
 than in animal-based products. Only in the case of milk is the pessimistic meanscore
       in animal-based   products.     Only in the case of milk is the  pessimistic    mean   scoresimilar
                                                                                                   similarfor
                                                                                                            fordairy
                                                                                                                dairy
milk   and   plant-based  milk.
 milk and plant-based milk.

      Figure2.2.Overall
     Figure      Overallranking of of
                          ranking  food  products
                                      food        (all stakeholder’
                                            products                views).
                                                       (all stakeholder’    Solid Solid
                                                                         views).  orangeorange
                                                                                         bars show
                                                                                                barsrank
                                                                                                     showmeans
                                                                                                          rank
     (the left and right ends indicate  the means  of  the low  and high ranks  assigned  by each
      means (the left and right ends indicate the means of the low and high ranks assigned by eachstakeholder).
     Thin blue lines refer to rank extrema (the left and right ends indicate the lowest and highest ranks
      stakeholder). Thin blue lines refer to rank extrema (the left and right ends indicate the lowest and
     assigned by any stakeholder).
      highest ranks assigned by any stakeholder).

      Looking at each stakeholder group individually (Figure A1), the analysis shows that consumers,
      Looking at each stakeholder group individually (Figure A1), the analysis shows that consumers,
researchers, and members of NGOs have the highest opinion (i.e., rank values closer to 100) of vegetable
 researchers, and members of NGOs have the highest opinion (i.e., rank values closer to 100) of
products. Only researchers assigned higher pessimistic scores to dairy milk than plant-based milk.
 vegetable products. Only researchers assigned higher pessimistic scores to dairy milk than plant-
In contrast, interviewees within the agri-food supply chain (processors, distributors, and notably
 based milk. In contrast, interviewees within the agri-food supply chain (processors, distributors, and
producers) prefer animal-based products than vegetable-based products. In general, they assign higher
 notably producers) prefer animal-based products than vegetable-based products. In general, they
mean scores to products of animal origin, except in the case of meat for processors, where chicken meat
 assign higher mean scores to products of animal origin, except in the case of meat for processors,
has a lower optimistic score than vegan meat. Finally, policymakers do not show a clear preference for
 where chicken meat has a lower optimistic score than vegan meat. Finally, policymakers do not show
vegetable products or animal-based products. They rank dairy milk higher than vegan milk, but rank
 a clear preference for vegetable products or animal-based products. They rank dairy milk higher than
chicken meat lower than vegan meat.
 vegan milk, but rank chicken meat lower than vegan meat.
3.2. Uncertainty
 3.2. Uncertainty
      Figure 3 displays the uncertainty attached to each product according to all stakeholder’s views.
ResultsFigure
          show3that
                displays   the uncertainty
                    plant-based              attached
                                  meat has the         toaverage
                                                 highest  each product
                                                                  degreeaccording   to all(the
                                                                          of uncertainty   stakeholder’s   views.
                                                                                               orange cross-line
 Results   show  that plant-based   meat   has the highest   average  degree  of uncertainty  (the
is located more to the right), followed by chicken meat, and dairy milk. Plant-based milk shows    orange   cross-
                                                                                                              the
 line is located  more  to the right), followed   by chicken   meat,  and dairy  milk. Plant-based   milk
lowest average degree of uncertainty. These findings indicate that meat products have more uncertainty     shows
 the lowest average
(stakeholders   are lessdegree   of uncertainty.
                         sure about  their scores)These    findings
                                                    than milk        indicate
                                                               products.       that meat no
                                                                          Furthermore,     products   haveresults
                                                                                             conclusive      more
 uncertainty   (stakeholders    are less  sure  about   their scores)  than  milk  products.
are obtained when animal-based products and vegetable products are compared. Plant-based meat  Furthermore,    no
 conclusive   results are  obtained  when   animal-based     products  and vegetable   products   are
has a slightly higher degree of uncertainty than chicken meat, but dairy milk shows more uncertainty  compared.
 Plant-based
than           meatmilk.
      plant-based    has a slightly higher degree of uncertainty than chicken meat, but dairy milk shows
 more uncertainty than plant-based milk.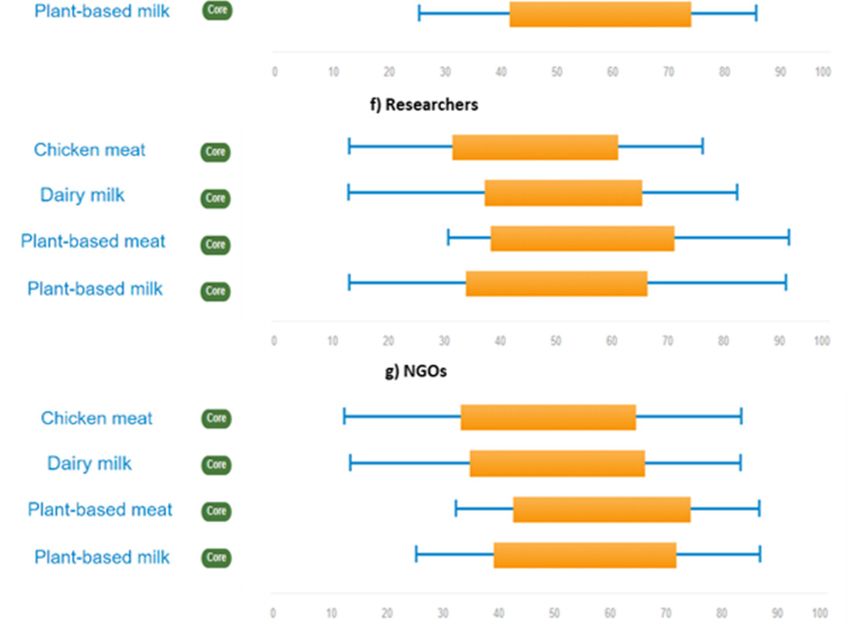
Int. J.
Int. J. Environ.
Environ. Res.
Res. Public
Public Health
Health 2020,
2020, 17,
17, x7969 99 of 26
of 26
Int. J. Environ. Res. Public Health 2020, 17, x 9 of 26
Figure 3. Uncertainty (all stakeholder’ views). The
The orange
orange cross-line
cross-line represents the average degree of
Figure 3. Uncertainty (all stakeholder’ views). The orange cross-line represents the average degree of
uncertainty. The
uncertainty. The blue
blue line
line refers
refers to extreme
extreme values
values (the
(the left
left and right ends show the largest and lowest
uncertainty. The blue line refers to extreme values (the left and right ends show the largest and lowest
uncertainty).
degrees of uncertainty).
degrees of uncertainty).
Looking
Looking at at the
the breakdown
breakdown by by each stakeholder group
each stakeholder group (Figure
(Figure A2),
A2), results
results show
show that plant-based
that plant-based
meat
Looking at the breakdown by each stakeholder group (Figure A2), results show that plant-based
meat isisthe
theproduct
product with the the
with highest average
highest degreedegree
average of uncertainty for producers,
of uncertainty processorsprocessors
for producers, (together
meatchicken
with
is the product
meat),
with the highest
distributors, and
average degree
policy-makers. Dairy
of milk
uncertainty
is the
for producers,
most uncertain
processors
product for
(together with chicken meat), distributors, and policy-makers. Dairy milk is the most uncertain
(together with chicken meat), distributors, and policy-makers. Dairy milk is the most uncertain
consumers and members of NGOs, and plant-based milk for researchers.
product for consumers and members of NGOs, and plant-based milk for researchers.
product for consumers and members of NGOs, and plant-based milk for researchers.
Results
Results also
alsodemonstrate
demonstrate that forfor
that both plant-based
both plant-based and animal-based
and animal-based products, members
products, of NGOs,
members of
Results also demonstrate that for both plant-based and animal-based products, members of
policy-makers, researchers, and consumers were more decisive in their answers
NGOs, policy-makers, researchers, and consumers were more decisive in their answers than than producers, processors,
NGOs, policy-makers, researchers, and consumers were more decisive in their answers than
and distributors.
producers, The orange
processors, bars (Figure A1)
and distributors. The are shorter
orange bars(differences
(Figure A1) between pessimistic
are shorter and optimistic
(differences between
producers, processors, and distributors. The orange bars (Figure A1) are shorter (differences between
scores are smaller)
pessimistic in these scores
and optimistic groups. areFurthermore, the left
smaller) in these side ofFurthermore,
groups. the blue line the
(lowest uncertainty)
left side in
of the blue
pessimistic and optimistic scores are smaller) in these groups. Furthermore, the left side of the blue
Figure A2 is 0 for some products in the case of policy-makers, researchers and environmental
line (lowest uncertainty) in Figure A2 is 0 for some products in the case of policy-makers, researchers NGOs,
line (lowest uncertainty) in Figure A2 is 0 for some products in the case of policy-makers, researchers
which means that some
and environmental stakeholders
NGOs, belonging
which means thattosome
these groups are extremely
stakeholders belongingsuretoabout
thesetheir answers.
groups are
and environmental NGOs, which means that some stakeholders belonging to these groups are
This does not happen among producers, processors, and distributors,
extremely sure about their answers. This does not happen among producers, processors, andwho responded with an ample
extremely sure about their answers. This does not happen among producers, processors, and
range of uncertainty.
distributors, who responded with an ample range of uncertainty.
distributors, who responded with an ample range of uncertainty.
3.3. Criteria and
3.3. Criteria and Sub-Criteria
Sub-Criteria Weights
Weights
3.3. Criteria and Sub-Criteria Weights
Figure
Figure 44 shows
shows thethe weights
weights assigned
assigned by by all
all stakeholders
stakeholders to to each
each ofof the
the six
six criteria
criteria examined:
examined:
Figureenvironmental,
economic, 4 shows the weights
product assigned
features by all stakeholders
relevant for consumers, to each of social,
policy, the sixandcriteria examined:
technological.
economic, environmental, product features relevant for consumers, policy, social, and technological.
economic, environmental, product features relevant for consumers, policy, social, and technological.
Figure 4. Weights assigned to each criterion (economic, environmental, features for consumers, policy,
Figure 4. Weights assigned to each criterion (economic, environmental, features for consumers,
Figure technological)
social, 4. Weights assigned
(%) (alltostakeholders’
each criterion (economic,
views). environmental,
The orange cross-line features
shows theformean
consumers,
value.
policy, social, technological) (%) (all stakeholders’ views). The orange cross-line shows the mean
policy,
The bluesocial, technological)
horizontal line shows (%) (all stakeholders’
the range views).
between lowest The orange
and highest weightscross-line
attached shows
to each the mean
criterion.
value. The blue horizontal line shows the range between lowest and highest weights attached to each
value. The blue horizontal line shows the range between lowest and highest weights attached to each
criterion.show that the most important criterion when choosing a food product according to all
Results
criterion.
stakeholder’s views is economic (19.6% mean weight), followed closely by product features (flavour
Results show
and cooking
that the
properties, 19%
most
mean
important criterion
weight),criterion
when choosing
environmental
a food
(18.2%) and
product
social
according
(17.4%).
to all
The lowest
Results show that the most important when choosing a food product according to all
stakeholder’s
weighted
views
criteria
is
are is
economic
policy
(19.6%
(13.1%)
mean weight),
and technological
followed closely by product features (flavour
stakeholder’s views economic (19.6% mean weight),(12.7%).
followed closely by product features (flavour
and cooking properties, 19% mean weight), environmental (18.2%) and social (17.4%). The lowest
and Differences among criteria
cooking properties, 19% meanare weight),
more evident when looking
environmental at the
(18.2%) and weights assigned
social (17.4%). Thebylowest
each
weighted criteria are policy (13.1%) and technological (12.7%).
stakeholder group (see Figure A3 and Table A1). Results
weighted criteria are policy (13.1%) and technological (12.7%).indicate that for the stakeholders within the
Differences among criteria are more evident when looking at the weights assigned by each
agri-food supply among
Differences chain (producers,
criteria areprocessors, distributors,
more evident and consumers),
when looking economic
at the weights and product
assigned by each
stakeholder group (see Figure A3 and Table A1). Results indicate that for the stakeholders within the
stakeholder group (see Figure A3 and Table A1). Results indicate that for the stakeholders within the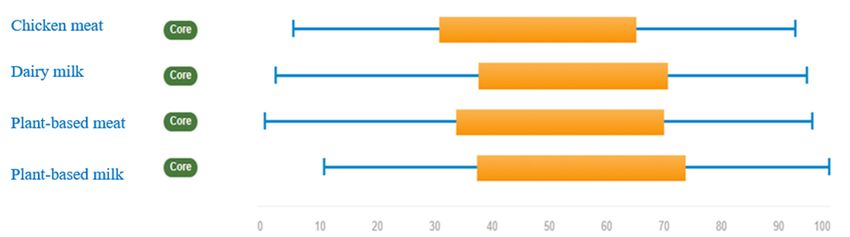
Int. J. Environ. Res. Public Health 2020, 17, x                                                                     10 of 26
Int. J. Environ. Res. Public Health 2020, 17, 7969                                                                   10 of 26
agri-food supply chain (producers, processors, distributors, and consumers), economic and product
features are the most important criteria. While producers, consumers and researchers give more
features are the most important criteria. While producers, consumers and researchers give more
importance to economic criteria, processors and distributors value product features more (e.g.,
importance to economic criteria, processors and distributors value product features more (e.g., flavour
flavour and cooking properties). Stakeholders with a high degree of environmental awareness, such
and cooking properties). Stakeholders with a high degree of environmental awareness, such as
as members of NGOs and policy-makers, give more weight to environmental issues. The social
members of NGOs and policy-makers, give more weight to environmental issues. The social criterion
criterion is middle ranked in all stakeholder groups. Finally, policy is the least weighted criterion for
is middle ranked in all stakeholder groups. Finally, policy is the least weighted criterion for producers,
producers, processors, and distributors, while technological is least weighted for consumers,
processors, and distributors, while technological is least weighted for consumers, policymakers,
policymakers, researchers, and environmental NGOs.
researchers, and environmental NGOs.
     Weights of the different sub-criteria are shown in Figure 5 (all stakeholder’ views together) and
     Weights of the different sub-criteria are shown in Figure 5 (all stakeholder’ views together) and
Table A1 (by type of stakeholder group). Results indicate that, for all stakeholders, affordability is the
Table A1 (by type of stakeholder group). Results indicate that, for all stakeholders, affordability is the
most important economic sub-criterion (representing 44% of the total mean economic weight),
most important economic sub-criterion (representing 44% of the total mean economic weight), followed
followed by stability and profitability (both approximately 27%–29%). Regarding the environmental
by stability and profitability (both approximately 27%–29%). Regarding the environmental domain,
domain, the most important sub-criterion is use of natural resources (53% of the total mean
the most important sub-criterion is use of natural resources (53% of the total mean environmental
environmental weight), especially for producers (56%), distributors (59%), and policymakers (56%).
weight), especially for producers (56%), distributors (59%), and policymakers (56%). Only researchers
Only researchers score emissions related to climate change slightly higher emissions than use of
score emissions related to climate change slightly higher emissions than use of natural resources 51%
natural resources 51% versus 49%). In features relevant for consumers, all groups of stakeholders
versus 49%). In features relevant for consumers, all groups of stakeholders (notably distributors)
(notably distributors) give much more weight to organoleptic properties (e.g., flavour) than they do
give much more weight to organoleptic properties (e.g., flavour) than they do to cooking properties.
to cooking properties. On average, organoleptic properties represent 65% of total features’ mean
On average, organoleptic properties represent 65% of total features’ mean weight, while cooking
weight, while cooking properties only represent 35%. Concerning policy issues, food legislation is
properties only represent 35%. Concerning policy issues, food legislation is the sub-criterion with
the sub-criterion with most weight, counting for 59% of the total mean policy weight. Processors
most weight, counting for 59% of the total mean policy weight. Processors (63%), distributors (72%)
(63%), distributors (72%) and policymakers (67%) give food legislation the highest weight (63%, 72%,
and policymakers (67%) give food legislation the highest weight (63%, 72%, and 67%, respectively).
and 67%, respectively). Only members of NGOs value Common Agricultural Policy (CAP) support
Only members of NGOs value Common Agricultural Policy (CAP) support more than food legislation
more than food legislation (53% versus 47%). Regarding social criteria, health and nutrition is the
(53% versus 47%). Regarding social criteria, health and nutrition is the most important sub-criterion
most important sub-criterion (34% of the total mean social weight), notably for distributors (36%),
(34% of the total mean social weight), notably for distributors (36%), policymakers (42%), and researchers
policymakers (42%), and researchers (37%). The other three social sub-criteria (food security, labour
(37%). The other three social sub-criteria (food security, labour conditions, and product information)
conditions, and product information) are weighted similarly (22% each). Finally, concerning
are weighted similarly (22% each). Finally, concerning technology, no sub-criteria were defined.
technology, no sub-criteria were defined. Distributors are the group that value it the most and
Distributors are the group that value it the most and consumers the least (see Table A1).
consumers the least (see Table A1).

     Figure 5. Weights assigned to each sub-criterion (% of the total weight of the criteria) (all stakeholder’ views).
      Figure 5. Weights assigned to each sub-criterion (% of the total weight of the criteria) (all stakeholder’
      views).
3.4. Performance  of Food Products
       The performance
3.4. Performance  of Food of  food products has been analysed examining the results of the ‘Criteria
                          Products
weighted score’ (CritWS) (Figure 6 and Table A2) and ‘Sub-Criteria weighted score’ (SubWS) (Figure 7
       The performance
and Table   A3). Figureof6 food    products
                               shows          has been
                                       the overall       analysedofexamining
                                                   performance                the results
                                                                    food products   underofeach
                                                                                             the criterion
                                                                                                  ‘Criteria
weighted   score’ (CritWS)   (Figure  6 and Table  A2) and ‘Sub-Criteria weighted score’ (SubWS)
(i.e., how all stakeholders value different products under each criterion). Disaggregated results  (Figure
                                                                                                        by
7  and  Table A3). Figure  6 shows   the overall
group of stakeholders are displayed in Table A2. performance  of food  products under each  criterion (i.e.,
how all stakeholders value different products under each criterion). Disaggregated results by group
of stakeholders are displayed in Table A2.
Int. J. Environ. Res. Public Health 2020, 17, 7969 11 of 26
Int. J. Environ. Res. Public Health 2020, 17, x 11 of 26
Figure
Figure 6. 6. Overall
Overall performance
performance ofof food
food products
products under
under each
each criterion
criterion (all
(all stakeholder’
stakeholder’ views).
views). Average
Average
weight of each criterion (%).
weight of each criterion (%).
Resultsindicate
Results indicatethat thatthe
theweight
weightofofallallcriteria
criteriaisisalmost
almostthe thesame
sameininthe thetwotwoplant-based
plant-basedfood food
products analysed (meat and milk) (see Figure 6). In both products,
products analysed (meat and milk) (see Figure 6). In both products, the environmental and product the environmental and product
features
features criteria
criteria areare weighted
weighted the highest
the highest (19%–20%
(19%–20% on average),
on average), followed followed
by economicby economic
(17%), social(17%),
social (16%), and policy (15%) criteria, and finally the technological criterion
(16%), and policy (15%) criteria, and finally the technological criterion (13%). Table A2 shows that (13%). Table A2 shows that
consumers, policy makers and members of NGOs, particularly
consumers, policy makers and members of NGOs, particularly value the environmental performancevalue the environmental performance
ofofthese
theseproducts
products(they (theyassign
assignthe thehighest
highestweights
weightstotothe theenvironmental
environmentalcriterion,
criterion, about
about 20%–24%),
20%–24%),
while processors, distributors, and researchers give more importance
while processors, distributors, and researchers give more importance to product features (20%–25%). to product features (20%–25%).
Hereagain,
Here again, the
the differences
differences between
between plant-based
plant-based meat meatandand plant-based
plant-based milk milk
are are small.
small. In the In case
the case
of
of producers,
producers, bothboth criteria
criteria (environmental
(environmental andand product
product features)
features) areare weighted
weighted similarly
similarly (19%–20%),
(19%–20%),
closelyfollowed
closely followedbyby thethe economiccriterion
economic criterion(17%–19%).
(17%–19%).All All stakeholders
stakeholders weight
weight least
least thethe technological
technological
criterion(only
criterion (only6%–7%
6%–7%ininthe thecase
caseofofconsumers),
consumers),except exceptproducers
producersand andprocessors,
processors,who whoassignassignthe the
lowest score to the policy criterion
lowest score to the policy criterion (11%–13%). (11%–13%).
Furthermore,
Furthermore, thetheresults
resultsobtained,
obtained, shown
shown ininFigure
Figure6,6,indicate
indicatethat
thatcriteria
criteriaininthe thetwotwoanalysed
analysed
productsof
products of animal
animal originorigin are
arealsoalsoweighed
weighed similarly
similarly(although
(althoughmoremoredifferences can becan
differences found be between
found
chicken meat and dairy milk than between plant-based meat and
between chicken meat and dairy milk than between plant-based meat and plant-based milk). Product plant-based milk). Product features
weigh the
features weigh highest (23%–24%
the highest of the total),
(23%–24% of the closely followed
total), closely by economic
followed (19%–21%)
by economic (19%–21%)and social criteria
and social
(17%).(17%).
criteria Technological
Technological and policy
and policycriteria havehave
criteria almostalmostthe the
same weight
same weight(14%–15%
(14%–15% andand 13%–14%,
13%–
respectively). The environmental criterion is weighted least (around
14%, respectively). The environmental criterion is weighted least (around 10% for dairy milk and 10% for dairy milk and12% 12%
forchicken
for chickenmeat).
meat).Processors,
Processors, distributors,
distributors, policy
policy makers,
makers, researchers,
researchers, and
and members
members ofofNGOs
NGOsgive give
the highest weight to the product features criterion (20%–26%),
the highest weight to the product features criterion (20%–26%), notably when it comes to dairy milk notably when it comes to dairy
milk
(see (seeA2).
Table Table A2). Producers,
Producers, and notablyand notably
consumers, consumers,
value more value morethe
highly highly the economic
economic criterioncriterion
(18%–
25%), particularly in the case of chicken meat. For all stakeholder groups, the social criterion is alsois
(18%–25%), particularly in the case of chicken meat. For all stakeholder groups, the social criterion
also important.
important. It is weighted
It is weighted highlyhighly (15%–21%),
(15%–21%), slightlyslightly
belowbelow the economic
the economic criterion.
criterion. As inAs theincase
the case
of
of plant-based products, the least weighted criterion for producers and
plant-based products, the least weighted criterion for producers and processors is policy (12%–13%), processors is policy (12%–13%),
whilefor
while forconsumers
consumersit itisis technological
technological (9%–10%).For
(9%–10%). Forthethe rest
rest ofof
thethe stakeholder
stakeholder groups
groups (distributors,
(distributors,
policy makers, researchers, NGOs) it is the environmental
policy makers, researchers, NGOs) it is the environmental criterion (9–12%). criterion (9–12%).
Thelargest
The largest differences
differences inincriteria
criteria weights
weights are are
seenseen
between animal-based
between and plant-based
animal-based and plant-based products
(Figure 6). On average, products of animal origin show a better performance
products (Figure 6). On average, products of animal origin show a better performance than products than products of plant
origin in the following criteria: product features (weighted 3%–5%
of plant origin in the following criteria: product features (weighted 3%–5% higher), economic (+2%– higher), economic (+2%–4%),
technological
4%), technological (+1%–2%),
(+1%–2%), andand social (+1%–2%).
social (+1%–2%). On Onthe the
contrary, plant-based
contrary, plant-basedproducts
products havehave a better
a
performance than animal-based products under environmental
better performance than animal-based products under environmental (+7%–9%) and policy (1%–2%) (+7%–9%) and policy (1%–2%) criteria.
criteria.Int. J. Environ. Res. Public Health 2020, 17, 7969 12 of 26
Int. J. Environ. Res. Public Health 2020, 17, x 12 of 26
Looking
Lookingat at sub-criteria
sub-criterialevel
level(Figure
(Figure7),
7),we
wecan
cansee
see that
that only
only 55 (out
(out of
of 14)
14) sub-criteria
sub-criteria have
have higher
higher
weights
weights in products of animal origin than in products of plant origin: affordability (weighted 58% in
in products of animal origin than in products of plant origin: affordability (weighted 58% in
animal
animal products
products vs. vs. 42% in vegetable products), food security,
security, product
product information
information andand organoleptic
organoleptic
properties
properties (55%
(55% vs.vs. 45%),
45%), and
and technology
technology availability
availability (52%
(52%vs.vs. 48%).
48%). Animal-based
Animal-based products
products and
and
plant-based products have similar weights concerning stability and cooking properties
plant-based products have similar weights concerning stability and cooking properties (50% vs. (50% vs. 50%).
Finally,
Finally,plant-based
plant-based products
productsare are
perceived as having
perceived better performance
as having than animal-based
better performance products
than animal-based
in 7 (out ofin14)
products sub-criteria:
7 (out profitabilityprofitability
of 14) sub-criteria: (54% vs. 46%),(54%labour conditions
vs. 46%), labour(54% vs. 46%),(54%
conditions CAPvs.
support
46%),
(55%
CAP vs. 45%), (55%
support healthvs. and nutrition
45%), healthand
andfood legislation
nutrition (51% legislation
and food vs. 49%), and (51%notably GHG
vs. 49%), emissions
and notably
(63%
GHGvs. 37%), and
emissions natural
(63% resources
vs. 37%), use (61%
and natural vs. 38%).
resources use (61% vs. 38%).
Figure 7. Overall performance of food products grouped into animal-based and plant-based products,
Figure 7. Overall performance of food products grouped into animal-based and plant-based products,
under each sub-criterion (all stakeholder’ views). Average weight of each sub-criterion (%).
under each sub-criterion (all stakeholder’ views). Average weight of each sub-criterion (%).
As can be seen from Table A3, all stakeholders agree that plant-based products are more profitable
As can be seen from Table A3, all stakeholders agree that plant-based products are more
and less affordable (final prices are higher) than animal-based products. Consumers and NGOs also
profitable and less affordable (final prices are higher) than animal-based products. Consumers and
perceive that plant-based products face lower risks (i.e., less variability of prices and yields) than
NGOs also perceive that plant-based products face lower risks (i.e., less variability of prices and
animal-based products, and therefore believe that they are more stable. Only distributors think the
yields) than animal-based products, and therefore believe that they are more stable. Only distributors
opposite. All other stakeholders consider that both products are equally stable.
think the opposite. All other stakeholders consider that both products are equally stable.
Regarding social issues, most stakeholders assign higher weights to food security for animal-based
Regarding social issues, most stakeholders assign higher weights to food security for animal-
products than in plant-based products. Consumers are the only group that believe that more and
based products than in plant-based products. Consumers are the only group that believe that more
better proteins can be obtained from novel plant-based products. Furthermore, all stakeholders
and better proteins can be obtained from novel plant-based products. Furthermore, all stakeholders
(except producers and processors) perceive products of plant origin to be healthier and more nutritious
(except producers and processors) perceive products of plant origin to be healthier and more
than those of animal origin. However, they think that product information is more adequate in the
nutritious than those of animal origin. However, they think that product information is more
case of products of animal origin.
adequate in the case of products of animal origin.
Reactions also diverged regarding policy aspects. While producers and distributors think that policy
Reactions also diverged regarding policy aspects. While producers and distributors think that
support (CAP subsidies) is more convenient in the case of animal-based products, other stakeholders
policy support (CAP subsidies) is more convenient in the case of animal-based products, other
think the opposite.
stakeholders think the opposite.
The strongest consensus is found around environmental issues. In all stakeholder groups,
The strongest consensus is found around environmental issues. In all stakeholder groups, the
the weight assigned to (low) GHG emissions and use of natural resources is higher in plant-based
weight assigned to (low) GHG emissions and use of natural resources is higher in plant-based
products than animal-based products.
products than animal-based products.
Concerning features relevant for consumers, all stakeholders agree that animal-based products
Concerning features relevant for consumers, all stakeholders agree that animal-based products
are tastier and more pleasant than plant-based products. Consumers and processors also think that
are tastier and more pleasant than plant-based products. Consumers and processors also think that
animal-based products are easier to cook. Finally, there is also a consensus that the production
animal-based products are easier to cook. Finally, there is also a consensus that the production and
and processing technology of innovative plant-based foods has still room for improvement.
processing technology of innovative plant-based foods has still room for improvement. Most
Most stakeholders assign higher weights to technology in animal products than in vegetable products.
stakeholders assign higher weights to technology in animal products than in vegetable products.You can also read