Dairy Situation and Outlook - February 2014 Update - BL Medien
←
→
Page content transcription
If your browser does not render page correctly, please read the page content below
Dairy Situation and Outlook
           February 2014 Update
Australian Dairy supply chain in January 2014
Milk production                                         Manufacturing                                                                    Export Markets
• A
   ustralian milk production trails 2012/13            • A djusting product mix to maximise returns where contractual arrangements • Dairy demand remains robust in a high price environment. Some
  in year-to-date (YTD) data, largely due to               permit.                                                                         markets–particularly China–are growing imports rapidly as local
  overhanging issues from the challenging                                                                                                  production levels fall short of domestic requirements.
  second half of that season. Some recovery             • Lower than expected milk production forcing some processors to delay
                                                           order fulfilment.                                                            • Competition for limited export volumes has sustained near
  is expected, however milk volumes are likely
                                                                                                                                           record prices through most of 2013.
  to finish 2013/14 at levels similar to, or slightly   • WCB takeover closer to conclusion as Saputo takes control; meanwhile
  below 2012/13’s.                                         Fonterra acquires Tamar Valley; Hong Kong businessman buys UDP; and          • Price sensitivity encouraging exports from cheaper alternatives,
                                                           Manassen (Bright Food) picks up Mundella Foods.                                 either by origin or by reformulating to replace dairy with cheaper
• F
   armgate milk prices are up around 25% on
                                                                                                                                           vegetable fats.
  last season, but any increased cash flow is           • Strong competition for milk to fill new processing infrastructure across the
  being largely directed to creditor payments              industry and ongoing industry change expected to result from competition • Weaker AUD supporting exporter competitiveness; and soon to
  and debt retirement.                                     for Australian resources and to secure supply for international markets.        be ratified free trade agreement (FTA) with the Republic of Korea
                                                                                                                                           (ROK) promises further opportunities.
                                                        • Domestic retail price competition constraining value growth in some
                                                           categories, but consumers benefiting from lower prices.

                     Water                                                                                                                         Export
                                                                     Milk                    Manufacturing               Marketing &                                      Retail &
                     Grain &                   Input                 Production                                          Distribution                                     Food Service
                     Hay                                                                                                                         Australia

                                                                                          Import

Production inputs                                                                                                                        Australian Market
• S
   trong export program, dry northern conditions and weakened AUD maintaining                                                           • C
                                                                                                                                            onsumer sentiment is holding above the long-term average,
  upward pressure on feed grain prices.                                                                                                    but consumers remain cautious about spending.
• Australian dairy heifer exports still in high demand                                                                                  • M
                                                                                                                                            ilk and dairy spread sales volumes stable, but cheese coming
• W
   eaker Australian dollar is offsetting some of the gains from relatively lower global                                                   under retail discounting pressure.
  fertiliser prices and increasing the cost of fuel.                                                                                     • Y
                                                                                                                                            oghurt selling well on the basis of protein, ‘naturalness’ and
• Good water allocations mean short-term security for irrigators.                                                                         indulgence traits.

• Temporary water prices roughly double what they were 12 months ago.

1   Situation and Outlook – Feb 2014
Key driver outlook

       Global economy                         Global demand                 Australian market                  Global supply                          Inputs                      Exchange rates

    Situation         Outlook              Situation       Outlook        Situation       Outlook         Situation       Outlook          Situation          Outlook         Situation       Outlook

     Positive          Neutral             Positive        Neutral         Neutral         Neutral         Neutral         Neutral          Neutral          Negative          Positive        Neutral

• Improved US outlook and              • Global demand remains on        • Consumer sentiment is        • The focus on supply is         • Despite a good Australian        • USD appreciating as the
  recovery in Europe lifting             a steady footing – despite        holding above the long-term    currently undergoing its         winter crop, dry northern          US central bank ‘tapers’
  global economic growth                 pricing near record levels.       average, but consumers         seasonal transition from         conditions continue to place       quantitative easing (reduces
  expectations.                                                            remain cautious about          the southern to northern         upward pressure on feed            its economic support
                                       •   Production shortfalls in        spending. Milk and dairy       hemisphere.                      prices.                            program).
• But, European economic                   both China and Russia have      spreads sales volumes
  recovery is patchy and                   boosted import demand           stable.                      • Most major global              • National hay stocks are at       • A weaker AUD as mixed
  could take much longer to                from these markets; while                                      producers are yet to show a      expected levels for this time      data from China and
  recover as a whole.                      Brazil is yet to close its    • Retail competition             significant supply response      of year; however, while stocks     Australia dampen markets’
                                           supply gap, remaining a         contributing to supermarket    in light of current farmgate     are good in the south, they        outlooks on the local
• Divergent pattern of growth              major dairy importer.           cheese category volume up,     pricing; however this is         are very low in the north;         economy.
  extending in Europe as                                                   but value down.                expected to develop as           West Australian markets are
  deflation fears mount.               •   Price sensitive markets                                        2014 progresses.                 largely in balance. Protein hay • But the weaker Australian
                                           such as Africa imported       • Yoghurt maintaining                                             is in shorter supply than usual.   dollar also supports
• Stronger global demand                   fewer products and turned       reasonable value growth      • New Zealand continues to                                            higher export earnings
  expected to lift consumer                to cheaper alternatives.        with protein, ‘naturalness’,   display steady growth and      • International fertiliser prices    and remains positive for
  purchasing power in                                                      and indulgence.                some EU member states            are close to or below average,     farmgate prices.
  Southeast Asian economies. •             Southeast Asia continues to                                    are rapidly expanding            but the AUD depreciation
                                           show steady growth overall,                                    production despite the           could see domestic price rises. • Emerging market importers
• Chinese policy reform                    despite localised challenges.                                                                                                      and households could be
  reorienting economy more                                                                                threat of superlevy fines;
                                           Exports to ROK will benefit                                    others are seeing continued    • Water allocations are good,        tested by broadly weaker
  in favour of domestic                    from the Korea-Australia                                                                        although prices are up year-       currencies.
  consumption.                                                                                            declines.
                                           Free Trade Agreement                                                                            on-year.
                                           (KAFTA).                                                     • US has not grown as rapidly
                                                                                                          as expected due to high        • Dairy cattle exports remain
                                       •   Key consumer markets                                           cull rates; however margins      strong, given good pricing
                                           in the US and EU are                                           positive and herd rebuilding     and requirement for many
                                           recovering with the broader                                    is underway.                     farmers to supplement
                                           economy: modest growth is                                                                       cashflow following a difficult
                                           tipped in 2014.                                                                                 previous season.

2   Situation and Outlook – Feb 2014
February 2014: Situation and Outlook

International market fundamentals have been weighted towards higher                                  Growth expectations for emerging markets have also been reweighted - away from Brazil and
                                                                                                     Russia and in favour of Southeast Asia and China.
commodity prices for most of 2013. Milk supply from most producers is
yet to fully recover from the setbacks (low milk prices, climatic conditions,                        Meanwhile, Australian producers focused more on the domestic fresh milk market have not seen
higher debt loading) of earlier in the year, and demand continues to                                 the same jump in milk price as those experienced by dairy producers in export-focused regions,
                                                                                                     but are still facing similar cost pressures as a result of unfavourable weather and tight regional
expand. With high international commodity prices now reflected in                                    feed supplies.
farmgate returns, 2014 will see global milk production grow, although
some constraints remain.                                                                             Figures from the 2012/13 Queensland Dairy Accounting Scheme (QDAS) survey highlight
                                                                                                     challenges presented by last season, in which the average Queensland dairy operating profit
Despite importing countries facing a variety of different challenges, dairy demand remained          decreased to $55,328 ($247 per cow) in 2012/13 from $110,466 ($482 per cow) in 2011/12. The
robust through 2013 and continued to drive international commodity prices above market               report reflected the tough conditions in Queensland with severe flooding which affected dairy
expectations. With the global economic recovery expected to continue, demand shows little            farmers in several areas, especially central Queensland as well as drought conditions affecting a
sign of easing in the short-term. The recently signed FTA with the ROK will also offer exporters a   large number of farmers. Data collected from the 65 farms from the South East Coastal, Darling
more competitive position into a growing dairy market.                                               Downs, Central Queensland and North Queensland dairy regions shows the average return on
Ongoing dairy demand is now translating to improved returns to farmers, with farmgate prices         assets was 1.4% (2.5% in 2011/12) and average return on equity was -0.2% (1.4% in 2011/12).
increasing 10-25% in the EU, USA and Australia, and over 40% in export-focused New Zealand.          The QDAS figures reflect the significant transition in the northern milk production region that
Although seasonal conditions and a higher debt loading from the previous season are holding          have occurred in the last 3-5 years. While corporate mergers and limited export opportunities
back growth for some producers, New Zealand and the EU have been most responsive to                  for some processors has reduced demand for milk, changes to supermarket milk supply
positive farmgate signals. NZ production is forecast to finish the season up 6% to 21bn litres,      arrangements has left some farmers uncertain as to which processor they can supply their
while EU-28 milk production is expected to lift 1% to 147bn litres–driven by year-to-date growth     milk. Supermarket transitions to ‘line of sight’ relationships with farmers, either directly or via
of 5% in Ireland, 3% in the Netherlands and 2% in Germany.                                           cooperatives for milk procurement, have also increased certainty for a number of suppliers
                                                                                                     engaged within the longer term contracts offered within these arrangements.
Tight financial conditions and heavy culling has reduced US output and left a number of markets
short of lower priced US product. Meanwhile, Australian milk production growth has been              Turning toward Australian consumers, sentiment has fallen slightly, but higher housing and share
constrained by challenging conditions in the 2012/13 season and end of season volumes are            prices are holding optimism above long-term averages—and ABS retail sales figures indicate
now expected to be largely flat compared to last year.                                               households are spending again, albeit cautiously.

At this time of year, the transition from southern hemisphere to northern hemisphere milk            Supermarket milk and dairy spreads sales volumes and values remain stable—although the
production is critical in forming an outlook for commodity pricing.  With markets comfortable        latter has recorded lower average prices and slower value growth; cheese volumes are up, but
with the production growth and product mix coming from New Zealand, attention is now                 discounting of chilled (block) cheeses has contributed to a slight decline in the total category
directed to the USA and EU. While EU production is widely expected to grow, the wildcard will        value.
be export availability from the US, where the export share of production recently lifted above       USD strength is recovering, driven largely by the US central bank’s reduction of government
15% of production for the first time. If corn prices stay low, the US’s biggest challenge will be    support programs (tapering). Assuming ongoing positive economic indicators, financial analysts
how to get new heifers into the dairy and cope with processing peak milk flow.                       expect tapering to continue and the USD to appreciate against other currencies. Tapering and
Fortunately for commodity prices, the improving economic outlook in the EU and US will drive         the resulting fund flows back to the USD remain a key factor driving the AUD down; but market
some recovery in domestic consumption and moderate export availability. The US economic              participants have also dampened their views on the AUD given mixed data on China and the
outlook has firmed, with higher GDP and lower unemployment expected in 2014. US dollar               Australian economy, including data indicating a softer labour market. Importers and households
appreciation is also reducing affordability (and competitiveness) of US dairy exports as             across emerging markets may be tested as currencies are broadly weaker in a period of elevated
currencies in demand markets fall against the USD.                                                   international dairy commodity prices.

The economic circumstances of EU member states appear to be diverging, as southern states            Conversely, the recent AUD depreciation has meant a loss of purchasing power for imports,
face persistent unemployment, while Germany and the UK are showing stronger growth.                  such as fuel and fertiliser, and has also placed upward pressure on grain prices.

3   Situation and Outlook – Feb 2014
Despite falls in international benchmark wheat prices, domestic grain has been supported by
strong domestic demand (due to dry conditions in northern Australia) and solid export demand.
Similarly, fodder supplies are also short in northern Australia, especially for quality protein hay.
While fodder stocks are currently adequate in southern states and WA, prices are climbing as a
result of increased demand from northern milk producers. Water allocations are good, although
temporary water prices have roughly doubled in 12 months, and Chinese demand continues to
drive increased dairy cattle exports.
Despite last season’s challenges, Australia has made global headlines as a result of the
strong competition to acquire Warrnambool Cheese & Butter (WCB). Australia has been an
internationally recognised and highly regarded supplier of dairy products and ingredients for
years, however the strong bidding has prompted many to look at Australian dairy in a new light.
While the spotlight was firmly on WCB, there has been a spate of other transactions in the dairy
sector reflecting efforts to secure supply for local markets as well as for booming demand in
Asia. Yoghurt specialist Tamar Valley Dairy was acquired by Fonterra in November 2013; while
WA cheese and yoghurt business Mundella will become a wholly owned subsidiary of Manassen
Foods, which itself was acquired in 2011 by Chinese company Bright Foods; and UDP has been
purchased by Hong Kong investor William Hui.
Ongoing strength in dairy commodity prices means substitution of dairy remains a concern.
In some cases international buyers are already replacing dairy fat with vegetable fat to be able
to sell at more affordable prices. The risk of longer term demand reduction grows over time as
commodity prices remain too high, and thus unaffordable for large populations in developing
markets.
When considering where to from here, as long as China remains short of dairy product (either via
demand growth or struggling local milk production) commodity prices should remain elevated.
Debt loadings and challenging conditions are expected to constrain dairy production growth
from the US; parts of Europe will prosper while others continue to struggle; and despite strong
production growth from New Zealand, it’s still unlikely to meet world demand. However, some
measure of caution still needs to be applied given a fragile economic recovery, and that no one
really knows the extent of possible shadow-banking issues in China.

4   Situation and Outlook – Feb 2014
Key Driver Analysis
Global Economy Figure 1. China: bad loans and credit
Indications of resurgent growth in advanced economies led the International Monetary 18.0 3
Fund (IMF) to nudge its 2014 global economic growth forecast up 0.1% to 3.7%—with the 16.0
2.5
forecast for 2015 unchanged at 3.9% (from 3.0% in 2013). 14.0
An improved outlook has prompted the IMF to lift its advanced economies forecast for 12.0 2.0
Renimbi (CNY) Billions
2014 up 0.2% to 2.2% (from 1.3% in 2013). 10.0
1.5
US housing and industrial activity data have provided positive signs. Higher US GDP 8.0
growth and lower unemployment are expected in 2014—although continued household 6.0 1.0
deleveraging and a lack of income growth (below the upper end) are likely to constrain 4.0
consumption growth. 0.5
2.0
Europe is still technically out of recession, but lagging the US. A divergence exists between 0.0 0.0
countries such as Germany and the UK, showing stronger growth, and especially southern
Mar-09
May-09
Jul-09
Nov-09
Mar-10
Sep-09
Jan-10
Jul-10
Mar-11
Mar-12
Mar-13
May-10
Jan-11
Jul-11
Sep-10
May-11
Jan-12
May-12
Jul-12
Jan-13
Jul-13
Nov-10
Sep-11
Nov-11
Sep-12
May-13
Nov-12
Sep-13
countries such as Italy and Greece that remain challenged by high unemployment, weaker
financial systems and business activity. Falling rates of inflation (and potential deflation) is
supressing growth by discouraging business investment and consumer spending are emerging
concerns for advanced economies. China total amount of social financing CNY bn (LHS)
China bad loans: CNY bn (RHS)
By contrast, Japan has seen more positive inflation growth—although largely due to the China all business and consumer loans outstanding: CNY bn (RHS)
country’s continued reliance on more non-nuclear power. The consumption tax rise from 5%
to 8% is effective 01/04/14; but, assuming base wages rise, consumer spending should remain
steady.
Overall expectations for emerging markets remain positive—with some reweighting
Concerns over China’s financial stability (bad debt and ‘shadow banking system’) geographically, towards Developing Asia and away from Brazil and Russia. The IMF has
have heightened. Some observers expect China’s investment-driven economy to slow more upgraded its forecast for Developing Asia 0.2% to 6.7% in 2014—and 6.8% in 2015; while China
dramatically; while others still expect a ‘soft landing’ as economic growth ‘slows’ to sub-8%. and India were lifted to 7.5% and 5.4%.
Nevertheless, domestic demand remains strong and structural reforms (See: China: relaxing
the ‘one child’ policy box) should support growth. Thailand and Vietnam are expected to resume stronger economic growth with the resolution
of political tensions and expanded foreign investment respectively; like Indonesia, both
countries should also receive a lift from increased external demand; while Indian growth may be
constrained by a debt-bloated corporate sector. Still, post-election, pro-market policy reforms
from new administrations in both Indonesia and India later this year could further support
growth. Middle East and North African growth forecasts for 2014 have been revised down,
reflecting the impacts of conflict and lower expectations of oil output.
5 Situation and Outlook – Feb 2014Global Dairy Demand Supply gaps
With the economic outlook improving in some key consumer markets and steady in others, China’s domestic milk supply issues have maintained its prominence in international dairy
dairy demand remains on a solid footing despite little commodity price relief for buyers. markets. Exports to China totalled 1.2 million tonnes during the first 9 months of 2013–a 30%
The pace of growth in global dairy trade slowed a little through the third quarter of 2013, with increase on the same time last year. In a tight market the total value of these products increased
volumes decreasing 1% compared to Q3 2012. With prices at or near record levels in USD 33% to US$3.95bn. New Zealand has captured a significant proportion of this increased
terms, however, the total value of trade (in USD terms) increased 15%. Of particular note, whole demand as a result of the New Zealand-China Free Trade Agreement.
milk powder (WMP) and skim milk powder (SMP) volumes were down 18% and 1% respectively,
Russia’s dairy industry has also reportedly struggled to meet its milk output growth targets; the
but total values up 17% and 37%.
resulting shortfall contributed to a 14% increase in imports to September 2013.
Developments through 2013 to September can be grouped along several themes, as shown in
Exports to Brazil decreased 8% to 147,000t as local production recovered and began to
the chart below.
displace imports.
Figure 2. Dairy import volume change to September 2013 - selected markets
Price sensitive
350,000 As dairy commodity prices soared, some markets were forced to reduce demand. Exports to
300,000 +30% North African destinations fell 12% to 553,000t, with the largest market, Algeria, importing nearly
210,000t – 9% down on January-September 2012. Despite political unrest, exports to Egypt
250,000
increased 7% to 169,000t, while Libyan volumes declined 34% to 105,000t.
Volume Change (tonnes)
200,000
The Middle East also saw falls related to price sensitivity, with Saudi Arabia and the UAE dropping
150,000 12% and 2% respectively. Exports to the region as a whole decreased 5% to almost 1, 100,000t.
100,000 Steady growth
+14%
50,000
+7% +7% +5% +7% Southeast Asia presents a mixed picture, but overall demand growth has been steady. Export
+1% +23%
– volumes to the region increased 4% to 1,510,000t in the nine months to September 2013.
-8% -4% -2%
– 50,000 -9% -40% Indonesia, Malaysia, the Philippines and Singapore saw volumes grow between 1% and 7%,
-34% while global exports to Vietnam eased 1% and those to Thailand fell 4%.
– 100,000
Thailand’s political unrest is affecting consumer demand and overall confidence; however
China
Russia
Brazil
Algeria
Egypt
Libya
Indonesia
Malaysia
Phillipines
Singapore
Thailand
Vietnam
Cambodia
Iran
continued retail investment activity suggests a resolution is expected in due course.
potential
Supply GaPs price sensitive steady long-term growth
growth
6 Situation and Outlook – Feb 2014Growth potential The Australia and Republic of Korea FTA
Iran is a small export market, but one exporters are eyeing with renewed interest following the Australia concluded a free trade agreement in late 2013 with the ROK, the country’s 10th
recent thaw in relations with Western governments. The most recent data suggests there is largest dairy market (by value: 2012/13). Australian dairy exporters stand to benefit from timely
ample room for growth: exports to September fell 40% on the same period in 2012, to 36,000t. implementation of KAFTA, which will provide opportunities via additional market access for
cheese, butter and infant formula. KAFTA’s completion represents our eighth FTA, prompting
Also starting from a relatively small base, Cambodia showed the strongest growth in Southeast optimism about the conclusion of FTAs with Japan and China.
Asia, increasing 23% to 40,305t. Vietnamese giant Vinamilk recently announced plans to invest
in a processing facility in the capital Phnom Penh to produce liquid and condensed milks and The Australian Dairy Industry Council (ADIC) described the deal, “as a step forward on the path
yoghurt. towards further trade liberalisation in Asia,” and noted that although “the deal has not delivered
all that had been hoped for, it will provide access to a range of new opportunities in an important
Investments like Vinamilk’s highlight an ongoing trend of building capacity to supply new regional market.” According to ADIC, “relevant highlights in the agreement for dairy include: a
developing customer bases from non-traditional supply bases. majority of dairy tariff lines on a pathway to duty-free access over specified time lines; and tariff-
Recovering economies free access for specified volumes of cheese, infant formula and butter under Country Specific
Quotas (CSQ) from day one of the agreement.”
Although not included in the chart (Figure 2. Dairy import volume change to September
2013 - selected markets), dairy demand in the US and EU remains a key balancing factor for The ROK imported 18,178 tonnes of dairy products from Australia during the 2012/13
the broader international market. financial year, worth US$78 million. In product categories where 2012/13 exports exceeded
The US economy continues to enjoy a positive outlook, which is supporting consumption. Local US$1 million, the biggest growth in export value for Australia was in ice cream (432.0%),
analysts report robust foodservice sales and a recovering retail environment. One downside risk lactose (135.9%), infant powder (31.3%), butter blend (21.5%) and SMP (14.4%).
remains cuts to unemployment benefits and domestic food assistance programs.
In Europe meanwhile, cheese sales are tipped to resume growth in 2014, while eastern EU
member states are expected to lead steady dairy consumption growth over the medium term.
This is a result of lower per capita consumption rates gradually increasing to close the gap with
their western neighbours.
China: relaxing the ‘one child’ policy
Recent changes to China’s one child policy are forecast to result in an increase of around
25% in the number of births annually. The projected increase of 2-4 million births per year
bodes well for infant nutrition markets (around 16 million babies were born in 2012). China’s
population peak should occur in 2024 rather than 2021, with the employed labour force to
remain 11 million persons (1.6%) higher in 2033 than under the base scenario. The change
will not reverse China’s ageing population, but in slowing the process it will create a more
resilient consumer base.
Source - data and projections: (IMA Asia – Impact of China One Child Policy Change)
7 Situation and Outlook – Feb 2014Australian Market
Figure 3. Retail dairy category performance Figure 4. Retail cheese category performance
-4 -2 0 2 4 6 8
Milk Cheese
0.5
Chilled Cheese
Volume 1.7
Volume Value Volume Value
Change Change Change Change
% % % % 1.6
+2.0 +2.7 +2.3 -0.6 Value
-2.5
3.1
Deli Cheese
Volume 5.4
Yoghurt Dairy Spreads
6.4
Volume Value Volume Value Value
Change 6
Change Change Change
% % % %
+0.7 +3.7 +2.3 +1.5 0.9
Total Cheese
Volume 2.3
2.7
Source: Aztec Australia – national retail channel (MAT 06/10/13) Value
-0.6
Consumer sentiment remains cautious on the back of concerns about a softer labour
market outlook (5.8% unemployment in Australia), heightened by Dec.‘13 data—which showed
MAT to 07/10/12 MAT to 06/10/13
what Bloomberg described as ‘the worst year of full-time [job] losses since 1992’—but it is still
above long-term average. Lower interest rates and higher asset prices (housing values and Source: Aztec Australia – national retail channel (MAT 06/10/13)
superannuation balances) continue to support sentiment. Despite volume increasing, the retail value of chilled cheese continues to decline:
Aztec data indicates stronger YoY volume growth at 1.7%, but average per kilo prices are down
Households are spending: ABS retail data indicated a 0.5% lift in retail sales growth in
YoY by around 4%.
December, and year-on-year (YoY) growth of 5.7%, with spending at cafes and restaurants
contributing to the uptick. Aztec data shows total cheese (chilled and deli) sales volumes are up; deli cheeses continue to
grow at a faster rate (5.4%) off a lower base (roughly 1/6 the volume of chilled). (See: Figure 4.
Inflation has increased: up 0.7% in the Dec.’13 quarter, largely due to a weaker AUD lifting the
Retail cheese category performance )
‘imported’ component; and the rates outlook is consequently weighted towards rate increases—
albeit still within the Reserve Bank’s target 2-3% range. The ABS’ dairy-related inflation measure Average per kilo retail prices for deli cheese have maintained steady growth, around
shows positive growth in the Dec’13 quarter (up 0.5% from Sep’13), but is still down on Dec’12 6% YoY—and are nearly double those of chilled (MAT06/10/13: chilled at $12.55 versus deli at
levels (-0.4%). $23.60 per kilo retail prices).
Milk and dairy spreads sales are stable: supermarket milk sales volume and value growth New yoghurt product releases in the latest quarter have capitalised on a combination
steady; total dairy spreads sales value growth is lagging behind that for volume given lower of wider trends including renewed interest in protein (as opposed to fat levels), ‘natural
average prices (See: Figure 3. Retail dairy category performance). ingredients’ and indulgence. Aztec data on supermarket yoghurt sales (MAT 06/10/13)
But the impact of discounting and supermarket sales strategies in the cheese indicates still reasonable value growth—after two consecutive years of >5% growth—outpacing
category is illuminated in the latest available Aztec data: major manufacturers have lost volume growth, given average per kilo retail prices up from $6.01 to $6.20.
share of chilled cheese (branded product) over the latest 12 months (MAT 06/10/13) while private Dairy snacks sales volumes have meanwhile dipped, with yoghurt also capturing those
label (PL) sales volume has grown strongly at 7.5%: accounting for a little more than the branded concerned about ‘weight wellness.’
volume lost by two of the top three major manufacturers. PL has consolidated its share of chilled
cheese: up 1.9%, from 33.9% in the previous period (MAT 07/10/12) to 35.9% (MAT 06/10/13).
8 Situation and Outlook – Feb 2014Global Dairy Supply An appetite for post-quota growth is particularly apparent in Ireland, where some farmers have
expressed a willingness to pay superlevy fines for exceeding quotas, rather than suppress
Overview
production.
As southern hemisphere milk output decreases seasonally, the focus is shifting to the northern
Industry forecasts indicate the current growth trajectory is expected to continue, with 2014 milk
hemisphere, where farmers and processors are gearing up for the spring flush. Approaching this
deliveries tipped to hit 147bn litres (up 1%).
seasonal changeover, production is higher than a year ago for most major exporters and further
growth is expected: US
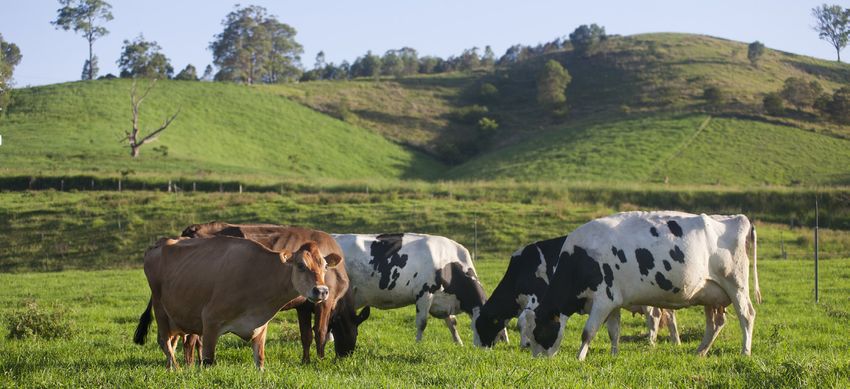
Figure 5. YTD and projected growth – 4 largest exporters US milk production has not yet begun to show the expected supply response. In particular,
November and December were virtually flat compared to the same months in 2012. Declining
10.0% cow numbers and static per-cow production have been blamed, with local analysts suggesting
Fcst 8%
heavy culling has outweighed the supply of replacement heifers, though steady herd rebuilding
% milk production growth
8.0%
is likely to begin in Q2, 2014.
6.0%
vs prior year
4.0% The cheese-focused Midwest and north-eastern states have seen slower growth due to strong
Fcst 1% Fcst 2% performances in late 2012, and particularly cold winter conditions impacting cow productivity
2.0%
Fcst -1% while increasing feed usage. Although Californian numbers are better, drought continues to
0.0%
plague the state and may affect output in coming months if water shortages worsen.
-2.0%
YTD 6% YTD 0.4% YTD 1% YTD-3% Although margins over feed cost have improved substantially, there are indications that many
-4.0%
NZ EU-28 US AUST
farmers are more risk averse than in previous years, opting to bolster their equity position before
Width of column represents
pursuing expansion.
export share in MEQ
Notwithstanding the challenges, production growth is expected to accelerate through 2014 as
Note: Columns denote YTD growth, points projected growth. margins remain favourable. The USDA’s forecast for 2014 US milk production is more than 93bn
litres, representing 2% growth on 2013.
Aggregate milk production growth for the four largest dairy exporters for the coming year is just
over 2%, representing an additional 5.6 billion litres. The US industry’s drive to increase its export presence has delivered a fourth consecutive year
of record exports by volume. New investments in milk powder production capacity and ongoing
Key drivers
programs to better meet international specifications and gain market share are likely to see
Better weather, lower input costs (particularly feed grains) and significantly higher farmgate milk further inroads made in coming years.
prices have helped drive increased production. Despite differences in price mechanisms and
NZ
sensitivities, strong commodity prices on international markets have boosted returns at the
farmgate across all major exporters: New Zealand’s milk production is entering its seasonal decline, with the weather remaining
broadly favourable, temperatures are seasonally hotter and rainfall close to average. Mild rainfall
Farmgate price growth – 4 largest exporters deficits are predicted for the South Island; however the availability of irrigation will help mitigate
this and there are no indications of a similar drought to 2013 occurring.
Exporter EU-28 US Australia NZ
The industry has largely brushed off the effects of the 2013 drought, with steady (if slowing)
Farmgate price (compared to prior year) +17% +10% +25% +42% growth evident in the data to date. November 2013 milk production was 4% greater than
November 2012’s, with season to date production up 6% on last season.
EU
The trend of slowing growth rates is likely to end in February, as drought affected 2013 figures
Overall EU-28 milk deliveries have resumed YoY growth as margins have improved and weather inflate the comparisons. Overall, full season forecasts suggest growth of around 8% for 2013/14
conditions have remained favourable. November data revealed a 4% increase compared to that to 21bn litres.
month in 2012. YTD growth within the EU has been mixed, with some member states such as
the Netherlands and Ireland (up 3% and 5% respectively) well above the 0.4% average, while
ongoing challenges have seen further contraction in countries such as Italy (down 4%).
9 Situation and Outlook – Feb 2014Australia Australia’s milk production has continued to shrink through the first six months of the 2013/14 season, due to carryover production and financial challenges from the previous season. Higher farmgate prices have seen the trend slowly reverse however, with December output up 1.5% compared to December 2012. Adverse weather has played a constraining role–particularly in northern regions–as have physical factors such as in-calf rates and pasture damage. Some regions remain constrained by poor cash flow, low confidence, increased debt servicing requirements and attractive prices for heifer exports. Ongoing improvements to farmgate pricing are likely to boost confidence and provide further latitude to capture profitable production opportunities as the season progresses. Dairy Australia is forecasting milk production of 9.0-9.2 billion litres for the 2013/14 season, which implies a full year contraction of between 0-2%. South America Estimates suggest Argentina’s milk production finished 2013 around the same level as 2012, with a late season recovery offsetting earlier impacts of unfavourable weather and negative margins. Argentina is likely to grow its dairy exports in 2014, as milk production resumes growth of 3-4% amid stable domestic consumption. Neighbouring Uruguay ended 2013 with three months of growth in excess of 10%, producing around 2 billion litres of milk for 2013. A growing domestic market has supported Brazil’s dairy industry in recent years, with further production growth of 2% anticipated in 2014. However, consumption growth, high production costs and a firmer currency continue to discourage exports. China Local reports continue to suggest Chinese milk production is tracking as much as 20% below recent years, with intensive international purchasing activity over the past few months also suggesting a shortfall. Drivers include the timing mismatch between smaller farms exiting the industry (due to regulatory pressure and advantageous beef prices) and larger operations coming online. As many as 1-2 million dairy cows are believed to have been culled over the past year. Spiralling feed costs and hot conditions over summer also played a role through depressing cow milk yields. The coming spring will reveal the extent to which short-term stabilization and recovery is likely. Investment into large-scale dairy farms has maintained a steady pace; however the lead time involved in these ventures makes them a longer term measure in China’s milk supply plans. India While Indian milk production has outstripped domestic demand and facilitated an enhanced export presence in 2013, a foot-and-mouth disease (FMD) outbreak has reduced milk output by 25% in the five southern states affected, lowering national growth expectations by 0.5%. India’s dairy exports reached 144,000t in the year to September (up 176%), with product often sought by buyers seeking a cheaper alternative to milk powder from Europe and Oceania. However, competition for lower cost supply has seen origin-related discounts heavily eroded in recent months. 10 Situation and Outlook – Feb 2014
Inputs                                                                                                   Table: Irrigation allocations as at 29 January 2014
Fertiliser                                                                                                                                  High Reliability Water         Low Reliability Water
The recent AUD depreciation means a loss of purchasing power for fertiliser imports, although                                               Share                          Share
this has largely been offset by the general softening in global fertiliser prices over the past 12        Goulburn-Murray Water
months.
                                                                                                          Murray                            100%                           0%
Market uncertainty following the split between Belaruskali and Uralkali has seen the FOB
Vancouver price for Muriate of Potash (STD Grade) at 6 year lows (Potashcorp), and December               Broken                            100%                           100%
ending inventories for North American producers were 14% above the 5-year average.                        Goulburn                          100%                           0%
Record urea exports from China contributed to softer 2013 prices, although the close of their             Campaspe                          100%                           46%
low-export-tax season has seen tighter final quarter availability. Stronger demand for both
urea and diammonium phosphate (DAP) has seen international benchmark prices recover                       Loddon                            100%                           0%
somewhat, to close to their 5-year averages.                                                              Bullarook Creek                   100%                           100%
Softer global prices should have insulated domestic buyers from the full impact of a lower
                                                                                                          Southern Rural Water
AUD. However, demand for North American potash rose in the final quarter of 2013, and Indian
imports are tipped to increase. If this drives international prices higher, local prices would likely     Macalister Irrigation District    90%                            0%
follow and the impact would be exacerbated if the AUD were to continue depreciating.
                                                                                                          Murray Irrigation Ltd.
Water
                                                                                                          Class A – Town water              Class B – High Security        Class C – General Security
Temporary water prices in Northern Victoria were at around $87 per mega litre for
December; roughly double what they were twelve months earlier. The volume traded was up                   100%                              100%                           100%
54% on the previous year, and 45% above the 5-year average. In line with the environmental
                                                                                                         Cows
water trading framework, the recent Commonwealth Government announcement that it would
sell up to 10 billion litres of temporary water in the Gwydir Valley in northern NSW is not              Cull cow sales volumes (year-to-date) are 5% lower than at the same time last year, which
expected to affect prices in that valley or more broadly. There is no significant dairying activity in   is unsurprising given that milk prices are favourable, while cull cow prices are marginally below
the Gwydir Valley.                                                                                       the 5-year average.
Climate models surveyed by the Bureau of Meteorology suggest that the El Niño-Southern                   On farm cashflow pressure and strong prices have contributed to a 12% increase
Oscillation (ENSO) will remain in a neutral state until at least autumn, and that the tropical Pacific   (to 84,449 head) in live dairy cattle exports in the 12 months to November 2013. This puts
Ocean will then warm through the southern autumn and winter. Some (but not all) models                   exports for the period 15% above the 5-year average. China was the major buyer by far (79%),
predict that this warming may approach El Niño thresholds by early winter. El Niño is normally           followed by Pakistan (10%) and Russia (4%).
associated with lower than average winter/spring rainfall over much of eastern Australia.
                                                                                                         Feed grains
                                                                                                         All key regions have completed their wheat harvests, so global production is virtually
                                                                                                         accounted for. Australia had a good national crop, variously estimated at 25.2 million metric
                                                                                                         tonnes (Mt) (Australian Crop Forecasters, mid-January), 26.5Mt (January United States
                                                                                                         Department of Agriculture (USDA) World Agricultural Supply and Demand Estimates (WASDE)),
                                                                                                         and 26.2 Mt (ABARES December Crop Report). Frost damage and a dry finish means that
                                                                                                         despite good yields, significant quantities of grain were quality affected, increasing the amount
                                                                                                         of feed grain available.
                                                                                                         Wheat fell and corn moved higher on Chicago Board of Trade (CBOT) March futures following
                                                                                                         the January WASDE report. Global wheat ending stocks were revised nearly 2.6 Mt higher,
                                                                                                         based on reduced domestic consumption (the premium over coarse grains has seen less wheat
                                                                                                         in feed rations) combined with production increases for China and Russia. This saw CBOT
                                                                                                         wheat futures close to two-year lows in AUD terms. Global corn ending stocks were
                                                                                                         revised downward by 2.2 Mt, with higher Chinese production insufficient to cover increased
                                                                                                         United States consumption.
11 Situation and Outlook – Feb 2014
Despite the fall in global wheat prices, strong domestic demand (due to dry conditions Hay
in Northern Australia), a strong export program, and the lower Australian dollar have
Fodder shortages were experienced in most regions of Australia’s eastern states during 2013,
strengthened local prices. The impact of markets dragging feed north from Victoria is
partly due to structural declines in hay production in recent years. 2013 yields were below
demonstrated by port zone prices: for feed barley, this January the average difference between
average in northern regions, but good in most southern regions for both cereal and pasture hay.
Melbourne and Adelaide prices has been around $23/t, as compared to an historical January
The boost to fodder stocks from cutting frost damaged cereal crops in NSW and Victoria was
average of around $11/t. The availability of grain from export-oriented regions such as South
less than initially hoped.
Australia does however place a ‘cap’ on feed prices, as, if northern demand drives prices to
levels adequate to cover transport costs, feed grain may be sourced from these regions. Nationally, hay stocks are at expected levels for this time of year. However, while stocks are
good in the south, they are very low in the north. In most regions protein hay is in shorter supply
Looking forward, insufficient buffer stocks exist to cushion demand related price increases.
than usual, and the Australian Fodder Industry Association (AFIA) expects that shortages will
Large purchases by Egypt and Saudi Arabia in recent weeks, coupled with increasing concerns
emerge in coming months.
about the US winter wheat crop due to extremely cold temperatures, did see a slight price
increase, and could result in further fluctuations going forward. Across Queensland and Northern NSW, the short supply of all fodder types is currently
accompanied by high ongoing demand. This is forcing buyers to source hay from further
Dry northern conditions have reduced the area of sorghum planted, and may well affect
south. Dry conditions are impacting on summer crop growth, so locally produced fodder is not
yield. Feed grain from further south could remain under pressure if the sorghum crop is smaller
expected to alleviate the situation until cereal crops can be harvested in spring. High irrigation
than expected, or if conditions remain ‘average to dry’ as the Bureau of Meteorology (BOM)
water costs are also forcing Northern NSW growers to critically evaluate lucerne hay programs,
forecasts.
which could further impact on supply shortages.
The outlook for cropping regions in the south-east is for average-to-dry conditions, while
Through southern NSW, Victoria and SA current stocks of hay are good. Strong demand from
the outlook for south-west WA is wetter than average.
the north is putting pressure on supplies, with even SA receiving enquiries from NSW and
Figure 6. Feed grain (Melbourne) & hay (Shepparton) prices Queensland. The quality of cereal and pasture hay is variable, and supplies are likely to tighten,
particularly in southern NSW. Protein hay is expected to become harder to source as the year
600 progresses. Prices are likely to increase over the coming months.
In Tasmania, 2013 silage production was down, but pasture hay of variable quality is in good
500
supply across the state. Supplies of most other hay varieties, particularly lucerne, are tight.
In WA, there appear to be good supplies of cereal hay and straw, but other hay varieties (and
(AUD/tonne)
400 lucerne in particular) are in short supply.
Dairy Australia’s Grain & Hay Report provides a comprehensive overview of the market
300
and indicative pricing by dairying region, and is published most weeks–available at
www.dairyaustralia.com.au.
200
100
0
Jan-06
Mar-06
May-06
Jul-06
Sep-06
Nov-06
Jan-07
Mar-07
May-07
Jul-07
Sep-07
Nov-07
Sep-08
Nov-08
Nov-09
Jan-08
Mar-08
May-08
Jul-08
Jan-09
Mar-09
May-09
Jul-09
Sep-09
Jan-10
Mar-10
May-10
Jul-10
Sep-10
Nov-10
Mar-12
Jan-11
Mar-11
May-11
Jul-11
Sep-11
Nov-11
Jan-12
May-12
Jul-12
Sep-12
Nov-12
Jan-13
Mar-13
May-13
Jul-13
Sep-13
Nov-13
Jan-14
Pasture Hay Lucerne Hay Barley Wheat
Source: Rural Press.
12 Situation and Outlook – Feb 2014Exchange Rates Japan’s Yen fell more than 20% against the USD and EUR in 2013, driven lower
by a deterioration in its current account position—with the deficit for October (released 9
A stronger USD has prevailed since the US central bank’s monetary policy decision-
December) the first time in 30 years that the country recorded a second consecutive monthly
makers on 18 December announced that the Federal Reserve would begin tapering
current account deficit. Japanese manufacturers are challenged to pass input costs through
(reducing purchases in its asset-buying program down from USD85bn to USD75bn).
to consumers—but moves by corporate Japan to increase base wages could provide some
The move has triggered strengthening of the USD against most currencies, as funds are
support.
directed back into US-denominated assets in anticipation of more favourable returns from the
US economy. Continued tapering should see the USD strengthen further. The EUR continued to strengthen throughout much of 2013 against the Yen (up 26.4%), AUD
(up 21.4%) and USD (4.2%); the EUR is expected to strengthen further against the USD given the
The AUD continued to weaken against major currencies throughout the final quarter
relatively improved outlook for the European economy.
of 2013: down 14.2% against the USD, 17.7% to the EUR, and 13.5% on the NZD.
Australian exporters’ Northern Hemisphere competitors may see currency
The AUD/USD has tracked closer toward 85c in the early weeks of 2014 on mixed data
advantages diminish.
including business activity data from China and weaker Australian labour market figures, fuelling
perceptions of deteriorating prospects for the Australian economy. The NZD has lifted due to the combination of New Zealand’s stronger economic growth,
larger government surplus and expectation that NZ’s central bank will be lifting interest rates in
Depending on currency hedging, exporters should see further earnings increases;
the first half 2014.
and although it may arrive too late to further boost 2013/14 farmgate milk prices,
a sustained weaker dollar should provide some upside for farmgate prices. SMP import affordability in key export markets has continued to decline over
the second half of 2013, as SMP prices hike up toward the record levels of 2007.
Furthermore, the currencies of importing countries are broadly weaker as a strong USD
returns—potentially testing importers and consumers, especially in markets such as Indonesia.
Figure 7. AUD/USD forecast Figure 8. SMP affordability index
MORE EXPENSIVE
1.04
300.0
275.0
250.0
225.0
200.0
0.93
0.91 175.0
0.90
0.89 0.89 150.0
0.88 0.88
0.87 0.87 0.87
0.86 0.86 0.86 0.86 125.0
0.85 0.85 0.85
0.84 0.84 0.84 0.84 100.0
LESS EXPENSIVE
75.0
0.80
Q1 13 Q2 13 Q3 13 Q4 13 Q1 14 Q2 14 Q3 14 Q4 14 2015 50.0
Jan-07 Jul-07 Jan-08 Jul-08 Jan-09 Jul-09 Jan-10 Jul-10 Jan-11 Jul-11 Jan-12 Jul-12 Jan-13 Jul-13 Jan-14
Actual Historical Westpac Median Bloomberg Forecast ANZ NAB SMP Benchmark China Mexico Thailand Indonesia Russia
(66 contributors)
13 Situation and Outlook – Feb 2014An update on the northern dairy industry Production system analysis
The northern dairy industry of Australia has undergone significant transition in the last season. QDAS data collection concentrates on gaining a “snap-shot” into different production systems
On top of poor seasonal conditions, flooding, cyclones and now drought; a number of changes in the regions.
have occurred within the local fresh milk market.
The three systems are:
Against the background of reduced export opportunities, as a result of a diminishing pool of
Grazing (GRA) – Milk production principally from grazing and grain and concentrates fed in
milk, corporate mergers have seen rationalisation of some processing assets, and thus reduced
the dairy.
demand for milk–evidenced by Tier 2 milk pricing.
Significant change has occurred as a result of supermarket transitions to ‘line of sight’ Partial Mixed Ration (PMR) – Milk production from a combination of grazing, grain,
relationships with farmers either directly, or via cooperatives for milk procurement. This has been concentrates, hay and silage.
demonstrated through the decision by Coles to enter into long-term contractual arrangements
Total Mixed Ration (TMR) – Milk production principally from a silage based mixed ration
with the two major cooperatives (MG and Norco) for the supply of fresh milk. From Woolworths’
fed on a pad.
perspective, this has been demonstrated by their direct supply arrangement with farmers
to supply “Farmer’s Own Milk” in parts of NSW. The growing ‘provenance’ trend among Across the regions the difference between average milk receipts widened during 2012/13.
consumers has encouraged small scale boutique milk brands such as Scenic Rim 4 Real, Darling Downs TMR farmers received 4.6c/L more for milk than North Queensland farmers.
marketed direct by farmers to emerge in the northern market. These TMR farmers receive incentive payments for high volumes. North Queensland farmers
faced cuts to their Tier 1 milk volumes allocations which have reduced average milk price.
In an environment where some farmers are uncertain as to which processor would accept
their milk, the entrance of Murray Goulburn into the fresh milk market and long-term contracts Production per cow increases as the feeding system intensifies. The grazing farms in South
offered to processors and groups of farmers have increased certainty for parts of the industry. East Coastal and North Queensland achieve 5,145 L/cow and 5,109 L/cow. The PMR regional
However, there are still challenges and opportunities present for the northern industry both production systems averaged 5,746 and 6,036 L/cow while the Darling Downs TMR farms
from the perspective of farm production economics and also local and international demand for achieved 7,070 L/cow.
Australian dairy products.
The returns vary across regions and systems with the Darling Downs TMR farms achieving the
DAFFQ QDAS Project highest return on assets managed of 4.8%.
The Queensland Dairy Accounting Scheme (QDAS) is a joint initiative between the Department Key physical and financial results from QDAS 2012/13
of Agriculture Fisheries and Forestry Queensland (DAFFQ) and Dairy Australia. QDAS analyses
physical and financial data from 65 farms from the South East Coastal, Darling Downs, Central Darling
Sth East Sth East Darling
Queensland and North Queensland dairy regions. The 2012/13 report is available and can be Downs North Qld
State Coastal Coastal Downs
found at www.dairyaustralia.com.au Coastal Grazing
Grazing PMR TMR
PMR
Dairy operating profit decreased from $110,466 ($482 per cow) in 2011/12 to $55,328 ($247
per cow) in 2012/13. This result is even lower than the 2010/11 dairy operating profit of $99,431 No of farms 65 13 15 7 9 14
($471 per cow), a year that was affected by floods, cyclones and extended wet periods. Return
Cows (milkers + dry) 224 232 224 185 276 212
on assets managed decreased from 2.5% in 2011/12 to 1.4% in 2012/13
Production per cow (L) 5,833 5,145 5,746 6,036 7,070 5,109
The results show average milk price (milk receipts) decreased by 2.1c/L down from 53.4c/L
($7.31/kgMS) in 2011/12 to 51.3c/L ($7.03kg/MS) in 2012/13. This is the fourth consecutive year Milk solids (kgMS/cow) 486 380 421 438 525 365
milk price has decreased.
Milk receipts ($/kgMS) 7.03 6.97 7.05 7.24 7.16 6.81
Feed related costs increased by 0.6 c/L, from 26.2 c/L ($3.58/kgMS) to 26.8 c/L ($3.67/kgMS)
in 2012/13. The change in feed-related costs is primarily due to a 1.2 c/L increase in the cost of Feed related costs ($/ 3.67 3.35 3.17 3.51 4.33 3.48
purchased feeds. The price of grains, protein and other concentrates increased dramatically in kgMS)
the last four months of 2012/13. The importance of feed-related costs is evident in this year’s
data, with feed-related costs consuming 52% of milk income (49% in 2011/12). Return on assets 1.4 1.9 1.1 1.2 4.8 -0.1
managed (%)
The 2012/13 year included severe flooding that affected dairy farmers in several areas, especially
central Queensland. Equity (%) 81 77 89 81 61 85
Investment per cow ($) 15,388 12,766 15,752 18,19 0 11,9 9 6 17,209
14 Situation and Outlook – Feb 2014Industry consolidation: WCB takeover Figure 9. WCB share price
12 Sep 2013 ega (BGA) launches first bid: $2 cash + 1.2 BGA shares per WCB share; the
B $10
contest for scale and close to 10% of national milk intake begins. $9
08 Oct 2013 aputo (SAP) makes first bid: $7 cash per share; WCB directors unanimously
S $8
recommend the offer. $7
12 Oct 2013 PMG publishes its independent expert report: valuing WCB at $6.96-
K $6
$7.49 per share; the valuation hinges on (a) EBITDA figures reflecting WCB $5
management’s revised FY2014 EBITDA forecast, and (b) valuation multiples $4
for comparable companies.
$3
18 Oct 2013 urray Goulburn (MG) makes its first bid: $7.50 cash per share; MG proposes
M $2
making WCB part of a ‘Murray Goulburn Warrnambool’ combination.
$1
29 Oct 2013 ion (local subsidiary of Tokyo-listed Kirin) pays an average of $9.25 per share
L $0
for a 9.9% holding in WCB to safeguard cheese supply. Lion leases a cheese 23/01/09 23/01/10 23/01/11 23/01/12 23/01/13
cut-and-wrap facility adjacent to WCB’s manufacturing plant at Allansford;
and WCB supplies the bulk of Lion’s block chilled cheese [FY13 supermarket
retail value: $250 million (MAT 30/06/13, AZTEC)].
Corporate activity you might have missed while
the focus was on WCB
31 Oct 2013 onterra pays $4.95 per share to acquire a 6% holding in BGA, indicating that
F
it, like Lion, is moving to protect its longer term business in Australia. BGA Fonterra purchased assets of Launceston-based yoghurt specialist Tamar Valley Dairy (6
cuts and wraps Fonterra’s cheese marketed under the Bega brand. BGA and Nov.), after a period in which the administrators noted ‘the business had been challenged by
Fonterra earlier this year renewed their cutting and packaging contract for a slowdown in sales and pressure on margins.’ Under the sale agreement, Fonterra acquired
a term of 10 years [Fonterra’s chilled cheese FY13 supermarket retail value: Tamar Valley’s ‘processing equipment, related services, intellectual property rights and
$459 million (MAT 30/06/13, AZTEC)]. trademark for the Tamar Valley Dairy brand’ effective 25 Nov. Fonterra’s purchase secured
continuation of, and minimised disruption to, supply for yoghurts, including those under
11 Nov 2013 reasurer Joe Hockey/Foreign Investment Review Board give approval for
T the Roaming Cow brand, which Tamar manufactured and packed for the NZ co-op’s local
SAP’s bid. subsidiary.
14 Nov 2013 BGA’s final offer: $2 cash plus 1.5 BGA shares per WCB share. Hong Kong-based investor William Hui has purchased Victorian-based milk supplier and
28 Nov 2013 MG’s final offer: $9.50 cash per share. manufacturer United Dairy Power (UDP) for a reported $70m. Management has indicated that
the new owner intends to retain UDP’s ‘current business and investment strategy.’ UDP has
29 Nov 2013 Fonterra lifts its stake in BGA from 6.1% to 9.1%. three processing facilities, manufacturing about 15,000 tonnes of products including butter and
17 Dec 2013 AP’s final offer: $9 cash per share--$9.20 at >50%; $9.40 at >75%; $9.60 at
S cheese, and an annual turnover of more than $200m and net profits of $15m.
>90%. Meanwhile, Bright Foods, the Shanghai-headquartered Chinese food and beverage major,
16 Jan 2014 GA sells its 18.8% stake in WCB to SAP ($61.8m-$68.2m gain before costs
B in mid-January confirmed that that it had acquired Western Australian farm-based business
and tax). Mundella. The development comes just weeks after the Chinese food and beverage major
Bright Foods pre-Christmas denied that it was the party earlier linked to the sale of UDP. Cheese
22 Jan 2014 SAP achieves 52.7%; MG >50% interest in WCB made unachievable. and yoghurt specialist Mundella will become a wholly owned subsidiary of Bright-controlled
23 Jan 2014 G announces that it will withdraw its offer for WCB and sell its 17.7% stake
M Manassen Foods (acquired in 2011 for $516m). Although relatively small in terms of production
to SAP (approximately $51m gain before costs and tax). volume or export capacity, Mundella adds more quality Australian products to Manassen’s
portfolio, complementing peer WA brand Margaret River Dairy.
28 Jan 2014 ion reiterates that it has no intention of accepting SAP’s offer—‘although it
L
reserves the right to do so.’
SAP achieves 77.1%: offer at $9.40 per share; extended until 7PM, 12 Feb
15 Situation and Outlook – Feb 2014You can also read