Euroscepticism and EU Cohesion Policy: The Impact of Micro-Level Policy Effectiveness on Voting Behavior - Department of Economics Working Paper ...
←
→
Page content transcription
If your browser does not render page correctly, please read the page content below
Department of Economics
Working Paper No. 273

Euroscepticism and EU Cohesion
Policy: The Impact of Micro-Level
Policy Effectiveness on Voting
Behavior

Julia Bachtrögler
Harald Oberhofer

November 2018
Euroscepticism and EU Cohesion Policy:
   The Impact of Micro-Level Policy Effectiveness on Voting Behavior

                    Julia Bachtrögler                                          Harald Oberhofer

       Austrian Institute of Economic Research                Vienna University of Economics and Business
            Julia.Bachtroegler@wifo.ac.at                       Austrian Institute of Economic Research
                                                                      Harald.Oberhofer@wu.ac.at

                                                        Abstract

        This study investigates whether there is a link between the successful implementation of European cohesion
        policy and the voters’ attitudes towards the EU. Using the French presidential elections in 2017 as a case
        study, we do not solely consider regional funds expenditures but also its induced effects in a region as
        further potential determinant of pro-European or eurosceptic voting behavior. In order to measure the
        effectiveness of EU structural funds and Cohesion Fund assignment, firm-level employment effects in
        French NUTS-2 regions stemming from project allocation during the multi-annual financial framework
        2007-2013 are estimated. The obtained average treatment effects are, in a next step, used together
        with other regional characteristics to capture the citizens’ perceived exposure to the EU in an empirical
        voting model for the French presidential election in 2017. The estimation results reveal a significant
        negative relationship between the effectiveness of EU funds allocation and the vote share of the eurosceptic
        candidate Marine Le Pen.

        JEL classification: C21; D72; E61; R11; R58.

        Keywords: Euroscepticism; EU cohesion policy; effectiveness; voting behavior; French presidential elec-
        tion.


       We are very grateful to numerous seminar and conference participants at the Joint Research Centre, the Economics
department of Vienna University of Economics and Business, the Austrian Institute for Economic Research as well as the ERSA
2017 for helpful comments and suggestions. Furthermore, we thank Andrés Rodríguez-Pose for pointing to the panel dimension
of the European Quality of Governance Index, and Aurélien Fichet de Clairfontaine for valuable hints regarding the French
electoral system.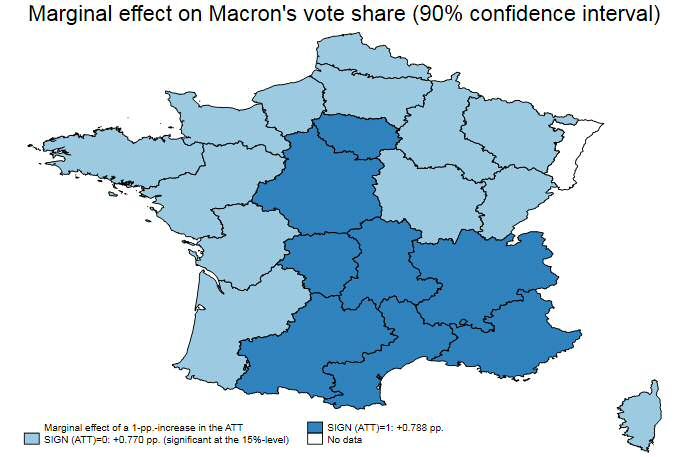
1    Introduction

In the first round of the French presidential election in 2017, the citizens had been able to choose among
candidates with strongly opposing views on the European Union (EU). While Emmanuel Macron presented
himself as clear pro-European and in favor of deeper economic and political integration, two of his opponents
claimed a serious political interest in leaving the EU. However, Marine Le Pen and Jean-Luc Mélenchon pre-
sented completely different reasons for their respective opinions. Moreover, Mélenchon suggested he would
consider a withdrawal from the EU only after failing in convincing the European institutions of the necessity
to change their (austerity) policies1 , whereas Le Pen questioned the main principles of the European Union.
The results of this premier tour, especially the vote shares for Macron on the one hand and the strongly
eurosceptic Le Pen on the other hand, documents the French population’s heterogeneous attitudes towards
the EU.

There is a growing stream of literature with the aim of understanding citizens’ voting behavior (for nationalist
parties) and growing “hard” and “soft” Euroscepticism (Treib, 2014). Most recently, Becker, Fetzer & Novy
(2017) and Crescenzi, Di Cataldo & Faggian (2017) investigated the determinants of the “Brexit” referendum
result on the local and regional level, respectively, considering the local citizens’ exposure to the EU mea-
sured in terms of trade with EU countries, foreign direct investment in- and outflows (Crescenzi, Di Cataldo
& Faggian, 2017), immigration and the amount of structural funds received. Moreover, the studies account
for the quality of the public political and financial system (Becker et al., 2017), the openness and previously
measured attitude towards the EU (Crescenzi, Di Cataldo & Faggian, 2017), demographics and educational
attainment of a region’s population as well as regional economic characteristics. Becker et al. (2017) find
that immigration and trade played a role for the outcome of the referendum, however, to a relatively low
extent in quantitative terms. What mattered most are demographic aspects, the size of the manufacturing
sector, wages and the regional gross domestic product (GDP).

These findings serve as a starting point for our analysis in which we refine the way in which European cohe-
sion policy, as one of the EU’s main policy instruments, enters the estimation equation. Becker et al. (2017),
Crescenzi, Di Cataldo & Faggian (2017), Fidrmuc, Hulényi & Tunali (2016) and Crescenzi, Di Cataldo &
Giua (2017) do not find any or an ambiguous influence of the EU’s regional policy on vote shares for Leave in
UK regions. However, we expect that taking into account only the amount of paid-out or committed funds
(as all of these studies did) may not be sufficient to explain the citizens’ perception of cohesion policy but
that it is rather the policy’s effectiveness which shapes voters’ attitudes towards the EU.

The large literature dealing with the evaluation of the economic effects of EU structural funds (European Re-
gional Development Fund, ERDF, and European Social Fund, ESF) and Cohesion Fund (CF; hereafter they
are referred to as “regional funds”) allocation can be divided into two main strands: The first one is rooted
in regional economics and thus typically provides evidence on the NUTS-2 level of regional disaggregation
(among the latest, e.g., Becker et al., 2017; Ferrara, McCann, Pellegrini, Stelder & Terribile, 2016; Percoco,
2017).2 The other one focuses on specific projects or programs conducted but mainly applies case-study
    1
      See www.theguardian.com/world/2017/apr/04/french-presidential-election-how-the-candidates-compare or www.
politico.eu/article/france-elections-2017-presidential-candidates-eu-wishlists-macron-melenchon-le-pen-fillon.
    2
      NUTS denotes the Nomenclature des unités territoriales statistiques (European Commission, 2011) that defines regions at
different disaggregation levels. NUTS-3 regions in France correspond to French départements.

                                                            1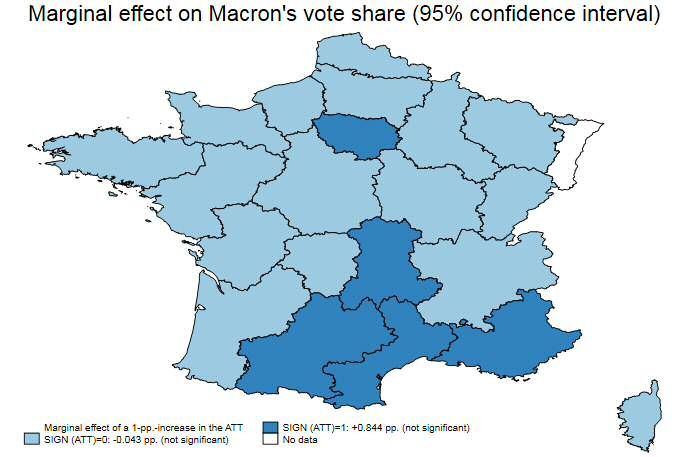
approaches (see e.g., Hartsenko & Sauga, 2012).3 Due to differences in the methodological approaches and
data, the literature has not reached a final conclusion on (the determinants of) the effectiveness of EU’s
regional policy yet. While some studies are not able to identify any significant effects (e.g., Barone, David &
de Blasio, 2016), others highlight the conditional success of these policy measures (refer to Rodríguez-Pose
& Fratesi, 2004, or others cited above).

What has only been done in a handful of studies until now is a careful microeconometric evaluation based
on actual projects and beneficiary firms. Such an investigation allows to quantify the individual effects of
regional policy instruments at the firm-level and to explore its (likely) heterogeneity across regions. This
paper contributes to this recent stream of literature by applying a dataset capturing the French beneficiary
firms and institutions of regional funds during the multi-annual financial framework (MFF) 2007-2013 to-
gether with a comprehensive sample of non-beneficiary firms and institutions which serve as a control group
for the counterfactual scenario.4

In a first step, employment growth effects of regional funds in firms that actually implement the supported
projects are estimated. We assume that EU project-induced job growth in a (NUTS-2) region is more likely
to be perceived by the citizens as compared to other effects at the firm-level such as e.g., value added creation
or changes in productivity, and effective programs may contribute to a positive perception of EU policies.
Empirically, we rely on standard econometric methods from the program evaluation literature in order to
identify causal treatment effects of EU’s regional policies. Average treatment effects on the treated (ATTs)
are estimated by applying a combination of propensity-score matching with a difference-in-difference ap-
proach.

Based on the findings from the first part of the empirical analysis, we further explore whether there is a
link between the employment effects induced by EU’s regional funds and the attitudes of NUTS-3 regions’
citizens towards the EU. The latter is measured in terms of the vote shares for the pro-European presidential
candidate Macron in the first round of French presidential election on 23th of April 2017 and, vice-versa,
that for Le Pen who politically represents “hard” Euroscepticism (Treib, 2014). In addition to cohesion
policy effectiveness, we consider the total amount of regional funds payments, the importance of tourism
and trade for regional gross value added (GVA) creation and net migration in a NUTS-3 region relative
to the national average in the econometric analysis. Further control variables on the NUTS-3 (or, if not
available, NUTS-2) regional level include the highest educational attainment of citizens, their trust in the
EU before the elections (Eurobarometer study), institutional quality, the size of the respective industry and
construction sectors, regional income, unemployment rates and population density.

The estimation results reveal a significant negative relationship between EU regional funds expenditure in a
NUTS-3 region and the vote share for Marine Le Pen. A one percentage point increase in the (statistically
significant) average employment growth effect of EU cohesion policy on firms within a region induces a
significant decrease of Marine Le Pen’s vote share by approximately two percentage points. In qualitative
terms, likewise, Emmanuel Macron’s vote share is identified to be larger in French regions with effective EU
   3
     Very recent exceptions are Beņkovskis, Tkačevs & Yashiro (2018); Fattorini, Ghodsi & Rungi (2018); Bachtrögler, Fratesi
& Perucca (2017).
   4
     Details on the used database which includes the beneficiaries of 2,055,375 EU regional projects carried out within 25 EU
countries during the programming period from 2007 to 2013 are available in Bachtrögler, Hammer, Reuter & Schwendinger
(2017).

                                                             2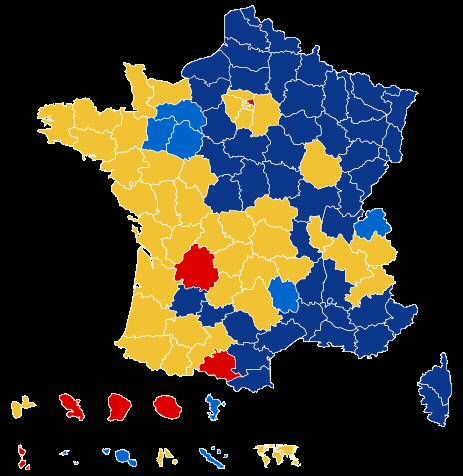
policies, this effect, however, is sensitive to different model specifications.

The size of the trade and tourism industries as well as net migration do not appear to be related to the
election outcomes. However, we find that higher income, education and regional institutional quality as well
as lower unemployment rates and smaller manufacturing and construction sectors are associated with more
favorable voting outcomes for Emmanuel Macron.

The remainder of the paper is structured as follows: Section 2 reviews the literature on firm-level regional
policy evaluation and the causes of Euroscepticism. Section 3 describes our econometric methodology and
Section 4 the data sources used. Section 5 discusses the estimation results, in Section 6 we offer some
concluding remarks.

2     Literature review

This paper contributes to two streams of the economic literature: First, it is related to a strand studying the
determinants of voting behavior putting a specific focus on voting for eurosceptic parties or the Leave option
in the UK’s “Brexit” referendum. Second, by providing microeconometric evidence on the effectiveness of
the EU’s regional policies, we add to the broad stream of EU cohesion policy evaluation which, so far, has
mainly focused on either aggregate effects on the regional level or on small-scale case studies.

2.1   Determinants of eurosceptic voting behavior

The research question of this study, whether firm-level effects of regional policy and other elements represent-
ing the voters’ perceived exposure of the EU are associated with their attitude towards the EU, is strongly
related to recent research on the determinants of the “Brexit” vote in the United Kingdom in June 2016.
Fidrmuc et al. (2016), Goodwin & Heath (2016) and Zoega & Arnorsson (2018) were among the first studies
to investigate the determinants of the vote share for Leave in British NUTS-2 regions and find that it is
smaller in richer regions (in terms of GDP per capita), in regions with a population having attained higher
education and a larger share of inhabitants that are over 65 years old.

Lubbers & Scheepers (2010) analyze the determinants of Euroscepticism using the Eurobarometer survey
and find that individual characteristics like human capital and social strata (i.e., occupation) matter next to
economic (GDP, unemployment, inflation) and political characteristics (e.g., programs of political parties)
of regions and countries. This finding is in line with the human capital hypothesis introduced by Eichen-
berg & Dalton (1993), which suggests that people with higher education (and more prestigious occupational
positions) face better opportunities from European integration than those with lower degrees of educational
attainment (see also Gabel & Palmer, 1995; McLaren, 2002).

Next to economic self-interest (Curtice, 2017, p.20), one’s view on the EU has been shown to depend on
the perception of European identity (Curtice, 2017) and individual personality. Regarding the latter, Gar-
retsen, Stoker, Soudis, Martin & Rentfrow (2018) demonstrate that the voters’ personality trait of openness
is strongly linked to the “Brexit” referenderum outcome, whereby more openness is associated with fewer

                                                         3
eurosceptic votes within a region.5 Also McLaren (2002) indicates that not only economic factors (costs
and benefits) but perceived threats through European integration shape the citizens’ attitudes towards the
European Union. As the perception of potential advantages and disadvantages of being part of the EU
is likely to be influenced by media, Lubbers & Scheepers (2010) have shown that the media coverage of
European topics as well as the way in which they are reported indeed contribute to the citizens’ perception
of the EU. Moreover, there are various studies in which immigration has been shown to matter for voting
behavior (mostly for nationalist parties) (see e.g., Lubbers & Scheepers, 2007; Barone, D’Ignazio, de Blasio
& Naticchioni, 2016; Goodwin & Heath, 2016). Finally, Lubbers & Scheepers (2007) show that living in a
less densely populated area is positively associated with more political Euroscepticism.

As it is a consistent finding in the literature that the (relative) income level of regions plays a crucial role
for citizens’ attitudes towards the EU, one may expect that the EU’s regional policy which aims at reducing
income disparities across European regions can contribute to dampen Euroscepticism (see e.g., Rodríguez-
Pose, 2018). Two of the most recent research papers on the “Brexit” determinants have taken the amount of
EU regional funds expenditure in British regions and more geographically disaggregated units into account.
However, according to the empirical findings reported by Fidrmuc et al. (2016) and Crescenzi, Di Cataldo
& Giua (2017), it seems to be the case that EU cohesion policy does not affect the result of the referendum
in a specific way.

Becker et al. (2017) apply machine-learning techniques to find the most appropriate set of predictors for
the outcome of the “Brexit” referendum. They argue that trade with and immigration from other EU mem-
ber states is able to explain only very little of the outcome and that the amount of EU regional funds
expenditures (in NUTS-3 regions) did not have any systematic impact on vote shares. Instead, in line with
previous literature, the distribution of education levels, historically high importance of the manufacturing
sector, income levels and unemployment rates are shown to be significantly correlated with the referendum
results. Although British politics may have played an important role for the outcome of the referendum, the
authors state that the “Brexit” vote can be interpreted as a vote against the EU. Crescenzi, Di Cataldo &
Faggian (2017) consider foreign direct investment flows as additional element of regional exposure to the EU,
which turns out to be relevant in contrast to the amount of EU structural funds paid out per inhabitant,
immigration growth and trade. The authors find that vote shares for the Remain option have been higher in
NUTS-2 regions with inhabitants with more cultural openness, which are younger as well as in regions with
relatively fewer unemployed citizens.

This study sets up a voting model based on the previous literature in order investigate whether the same or
similar determinants hold to be relevant when examining the share of eurosceptic votes (for Marine Le Pen)
in the French presidential election in 2017. As indicated in the introduction, we hypothesize that using only
the total amount of regional funds expenditures in a region is not sufficient to depict citizens’ perception
of EU cohesion policy. Therefore, we additionally include a measure of policy effectiveness that is expected
to be “visible” for the voters, namely, whether the funded firms create more new jobs. Another reason for
doing so is that French citizens appear to be more informed about EU co-financed projects in their regions
and cities as compared to British voters. Based on a question asked in the Flash Eurobarometer 427, 71% of
the French respondents assess the impact of EU projects on their region’s development in a positive manner,
which, still only constitutes the fourth smallest share among all EU countries (European Union, 2015a). In
the UK only 66% of all surveyed citizens believe that EU structural funds exhibit positive effects on the
  5
    Rentfrow, Gosling & Potter (2008) have previously analyzed the spatial dimension of psychological factors determining
economic and social behavior.

                                                           4
economic development of the region of residence.
2.2 The evaluation of the EU’s regional policy
In contrast to studies on the national and regional (NUTS-2 or NUTS-3) level, there is only a scarce literature
which investigates the effects of the EU’s regional policy on firm performance. Bondonio & Greenbaum (2006)
study business investment incentives co-funded by Objective 2 structural funds in 1989-1993 and 1994-1999
in Northern and Central Italy. The authors’ impact analysis isolates a positive employment growth effect on
treated firms stemming from co-funding programs. Some years later, Bondonio & Greenbaum (2014) com-
pare the firm-level effects induced by structural funds allocation with national public transfers to enterprises
in one Italian region during the multi-annual financial framework 2000-2006. They do not find a difference
in the impact of different funding sources but are able to show that larger economic incentives provided to
firms induced larger positive employment effects.
De Zwaan & Merlevede (2013) analyze the impact of structural funds assignment in NUTS-2 regions on
firm performance. The authors do not consider actual beneficiary firms but firms producing in regions that
receive structural funds and find that the receipt of these EU transfers do not induce statistically significant
differences in firm employment and productivity. Focusing on smaller samples, Hartsenko & Sauga (2012)
claim that co-funding by structural funds increases net sales in Estonian firms, and Maroshegyi & Nagy
(2010) conclude that structural funds payments have been important for Hungarian firms to stay financially
liquid over the course of the economic and financial crisis.
Bernini & Pellegrini (2011) investigate firm-level effects of a domestic regional policy subsidy in Italy and
indicate that it increases employment and fixed assets in treated firms while inducing negative productivity
effects measured in terms of output per employee. In a similar vein, Bergström (2000) shows that there is a
positive effect of capital subsidies for firms’ employment but that productivity is not systematically affected.
Presenting qualitatively similar results, Cusimano & Mazzola (2013) analyze financial incentives provided to
firms in Italy by means of territorial integrated projects which aim at facilitating the receipt of EU structural
funds. Firms that are treated by this program face significantly faster employment and sales growth but
there does not appear to be any significant impact on productivity as measured via value added per employee.
Most recently, Beņkovskis et al. (2018) use a detailed dataset for Latvian beneficiaries and non-beneficiary
firms and show that funded firms increase their number of employees, turnover and capital-to-labour ratio
immediately, while positive effects on labor productivity and total factor productivity become effective two
years after having received financial assistance. However, the productivity effects are not consistent across
different estimation procedures used and not homogeneous across different types of firms. Both this study as
well as Fattorini et al. (2018) indicate that initially less productive firms experience higher productivity gains
induced by receiving co-funding from the ERDF. The latter study evaluates the impact of funds dedicated
explicitly to business support and research, technology and development in the NUTS-2 regions of the 28
EU member states (during the MFF 2007-13) on total factor productivity of firms located in those regions.
Thereby the authors assume that all firms within treated regions are able to take advantage from the funds.
Finally, using a dataset of actual beneficiaries in seven EU member states, Bachtrögler, Fratesi & Perucca
(2017) find that carrying out a project co-funded by the ERDF, the ESF or CF increases manufacturing
firms’ employment, value added and labour productivity growth. However, the authors show that the effects
5differ across countries and also within countries, depending on territorial characteristics and the regional
income level.
This paper adds to this literature by providing regional treatment effects for EU structural funds projects
carried out in France. Furthermore, by using the estimated employment effects of these projects as an empir-
ical measure of policy effectiveness in a voting model, we additionally assess how current EU policy measures
affect the attitudes of French citizens towards the EU and are able to demonstrate that the effectiveness of
EU cohesion policy is significantly linked to voting decisions.
3 Methodology
The first part of this section is dedicated to the estimation of the effect of carrying out a project co-funded by
regional funds on firms’ employment growth, while the second part discusses the setup of the empirical voting
model incorporating the obtained causal employment effects as potential determinant of the vote shares for
Emmanuel Macron and Marine Le Pen, respectively, at the French presidential election.
3.1 Estimating employment effects of EU regional policies
For estimating average treatment effects on treated firms, we combine propensity score matching (PSM)
(see, e.g., Cameron & Trivedi, 2005; Angrist & Pischke, 2009) with a standard difference-in-difference (DiD)
approach. PSM allows to control for (time-varying) observable characteristics while DiD wipes out unobserv-
able but time-invariant firm characteristics. In a first step, we specifiy an empirical model which allows to
obtain propensity scores which are later on used for matching treated firms (i.e., recipients of regional funds
during the programming period 2007-2013) with ones from the control group (i.e., firms that did not receive
regional funds payments). As the effectiveness of EU regional policy in terms of beneficiary firms’ perfor-
mance may differ across regions (Bachtrögler, Fratesi & Perucca, 2017), we only consider control group firms
which are located in the same NUTS-2 region for modeling the treated firms’ unobservable counterfactual.
Formally, the propensity score model reads as (see, e.g., Imbens & Wooldridge, 2009):
p(wi ) = P r(Ti = 1|xi ) = F (xi0 β) (1)
where p(wi ) is the propensity score (i.e., the probability of being a beneficiary of regional funds) for each
firm i. Ti denotes the treatment indicator which is equal to one for firms receiving regional funds payments
during the MFF 2007-13 and zero otherwise. F (.) is a cumulative distribution function (CDF) which maps
the linear predictor xi0 β such that 0 ≤ p(wi ) ≤ 1. In this application we estimate probit models and thus
F (.) = Φ(.), i.e., the standard normal distribution function. xi0 denotes a vector of observable firm char-
acteristics measured prior to the multi-annual financial framework 2007-2013 and β is the corresponding
vector of parameters to be estimated. Assuming conditional independence, we only need to control for the
propensity score p(wi ) in order to identify a causal average treatment effect on the treated (ATT). In our
empirical specification and in order to assure balancing across the treatment and control group (i.e., similar
propensity scores are based on similar realizations of xi0 ), we include squared and interaction terms of the
included covariates when estimating p(wi ) (Angrist & Pischke, 2009). In Section 4 we detail on the specific
6observables entering xi0 . Furthermore, PSM requires the common support assumption to be fulfilled im-
plying that we need to exclude funds-receiving firms from the estimation of Equation (1) which cannot be
matched with firms from the control group due to too large differences in the respective propensity scores.
Based on the obtained propensity scores, we estimate the causal average employment effect stemming from
EU regional funds allocation. In general, the ATT is given by τ [p(wi )] = E[Yi (1) − Yi (0)|T = 1, p(wi )]
where τ [p(wi )] denotes the ATT and Yi (1) and Yi (0) refer to the potential outcomes under alternative
regional funding states. For treated firms we only observe Yi (1) directly but need to estimate the missing
counterfactual Yi (0). For each treated firm the counterfactual is based on Epanechnikov kernel matching
such that each control firm enters the calculation of the counterfactual based on a weight assigned according
to the inverse of the distance in the respective propensity scores. Furthermore, we combine the PSM with
a DiD approach by studying the differences in employment growth rates across treated and untreated firms.
Formally, we thus aim at estimating a sample analogue to the following population estimand:
τ (w) = E[g(1) − g(0)|T = 1, p(w)] (2)
where g(1) and g(0) denote the respective employment growth rates across the treatment period under the
two different treatment states. In the sample these two are approximated by the log-differences in em-
ployment, i.e., the number of employees, in firms which receive regional funds and from the control group,
respectively. Since the propensity score on which we additionally need to condition on is an estimate, we
report bootstrapped standard errors based on 500 replications in order to infer on the statistical significance
of the obtained employment growth effects of EU regional funds allocation.
As our target is to differentiate the firm-level effects across regions within France, we run the DiD estimation
and match firms within NUTS-2 regions considering NUTS-3 regional fixed effects. Thus, we end up with
ATTs for 21 NUTS-2 regions that correspond to 96 NUTS-3 regions.6 After bootstrapping the standard
errors, we construct a dummy variable taking on the value of one if the ATT is significant at the 95% level
and zero otherwise. That dummy variable as well as the coefficient of the ATT and the interaction thereof
will be further used for the analysis of voting behavior in the French presidential elections in 2017.
3.2 Estimating the determinants of the French presidential election outcome
The main focus of this paper is to explore the determinants of the voting behavior in the first round of French
presidential elections in 2017, in which the voters could choose between candidates with a moderate attitude
towards the EU (e.g., François Fillon), Macron as a clear pro-European who stands for further European
integration and Le Pen as an exponent of “hard Euroscepticism” (Treib, 2014).7 In addition, we empirically
asses whether the effectiveness of EU’s regional policy is also able to explain variation in voter turnout across
the French NUTS-2 regions.
6
We skip the French overseas departments Guyane, Guadeloupe, Mayotte, La Réunion and Martinique due to a lack of data.
Furthermore, the estimation of a causal employment effect is not possible for the NUTS-2 region of Alsace as there are only
three treated firms that could be matched with ORBIS and for which all firm characteristics needed for the DiD estimation and
the matching are available.
7
As a consistency check, we also run a regression on the second round-results and additionally consider the vote shares for
Mélenchon (see Section 5.4).
7The choice of indicators of French citizens’ exposure to the EU as well as the control variables is based on
previous literature on the determinants of Euroscepticism and, especially, the Leave vote in the “Brexit”
referendum discussed in Section 2.1. Regarding the potential impact of EU regional policy, we refine the
mechanism through which structural funds assistance in regions might affect French inhabitants by including
the average firm-level effect on employment growth for each NUTS-2 region (ATT in Equations 3 and 4),
the dummy variable denoting its statistical significance (SIGN ) and the corresponding interaction term.
Here, we assume that employment growth is more likely to be perceived by citizens as compared to other
firm performance outcomes, such as e.g., productivity or investments. Additionally, we include the structural
funds and the Cohesion fund expenditure per inhabitant in a NUTS-3 region (Regfundsexp) as former related
studies did. For both policy effectiveness and payments per capita, a negative relationship with Le Pen’s
vote share might be expected.
For modeling a region’s exposure to the EU, we furthermore take i) the GVA share generated by the whole-
sale and retail trade industries, transport, accommodation and food service activities, i.e., industries G,
H and I according to the NACE Rev.2 classification (GVAtradtour ), in a NUTS-3 region and ii) the net
migration rate in a NUTS-3 region relative to the national average (Netmigr ) into account. Unfortunately,
immigration and emigration data are not available separately on a regional level for France. Following e.g.,
Barone, David & de Blasio (2016), one could expect that regions with a higher net migration rate than the
country’s average (i.e., regions with a relatively large number of immigrants or relatively small number of
emigrants) may be more likely to be eurosceptic. With regard to the impact of trade and tourism, on the
one hand, citizens may see a large emphasis on these industries as a sign for undesirable dependence on
demand stemming from other EU member states (Curtice, 2017). On the other hand, the participation in
the EU single market and the Schengen area might involve additional economic benefits in the regions, which
could result in more EU-friendly attitudes held by its citizens. As a consequence, the respective sign of the
coefficient in a regression explaining Marine Le Pen’s share of vote remains ambiguous ex-ante.
In this paper, we mainly estimate an equation for Macron’s and Le Pen’s vote shares, for which opposite
signs for all explanatory variables included are expected. This assumption is consistent with the argument
that Macron and Le Pen represented extreme opposite positions regarding the future role of France within
the EU. The two separate estimation equations read as following:
MACRONj =α0 + β1 ∗ Regfundsexpj + β2 ∗ GVAtradtourj + β3 ∗ Netmigrj +
(3)
γ1 ∗ ATTj + γ2 ∗ SIGNj + γ3 ∗ ATTj ∗ SIGNj + Xj δ + j
LEPENj =α1 + ζ1 ∗ Regfundsexpj + ζ2 ∗ GVAtradtourj + ζ3 ∗ Netmigrj +
(4)
κ1 ∗ ATTj + κ2 ∗ SIGNj + κ3 ∗ ATTj ∗ SIGNj + Xj θ + ηj
where MACRONj and LEPENj denote the vote shares received by Macron and Le Pen in a French NUTS-3
region j, respectively. j and ηj denote error terms which are identically distributed but clustered at the
NUTS-3 regional level. The parameters of most interest in this paper are denoted by γ1 to γ3 and κ1 to κ3 ,
respectively.
8The vector of control variables Xj includes the following variables measured at the NUTS-3 level: i) Pop-
ulation density (expected negative relationship with Le Pen’s share of vote), ii) GDP per capita and iii)
GDP per capita growth depicting the economic performance during the Great Recession (for both variables,
expected negative link to eurosceptic votes for Le Pen) and iv) the share of the population aged above 64
(the effect may be positive or negative).
Further controls which are only available at the NUTS-2 regional level are i) institutional quality measured
by the European Quality of Government Index (EQI) (?) as this variable may explain part of the extent
of regional policy effectiveness (Rodríguez-Pose & Garcilazo, 2015), ii) the share of respondents to an Eu-
robarometer study that tend to trust in the EU (European Union, 2015b), iii) the average annual regional
employment growth rate for the years from 2007 to 2014 which may be correlated with our measure of pro-
gram effectiveness8 , iv) the share of population with primary education (ISCED levels 0-2; expected positive
correlation with eurosceptic votes), v) the share of employees working in the sectors industry and construc-
tion, vi) the quality of the health system (inhabitants per hospital bed, expected negative relationship),
and vii) the unemployment rate (expected positive association with eurosceptic votes). The corresponding
vectors of parameters associated with the control variables are denoted by δ and θ, respectively. Finally, in
some specifications we alternatively include NUTS-2 regional fixed effects instead of the above mentioned
variables on this regional level.
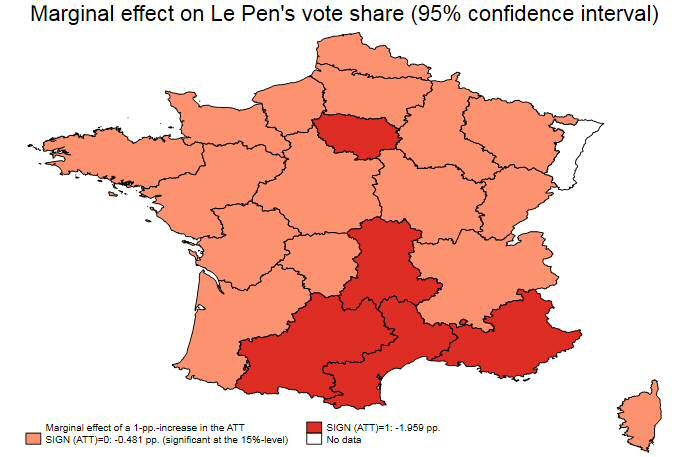
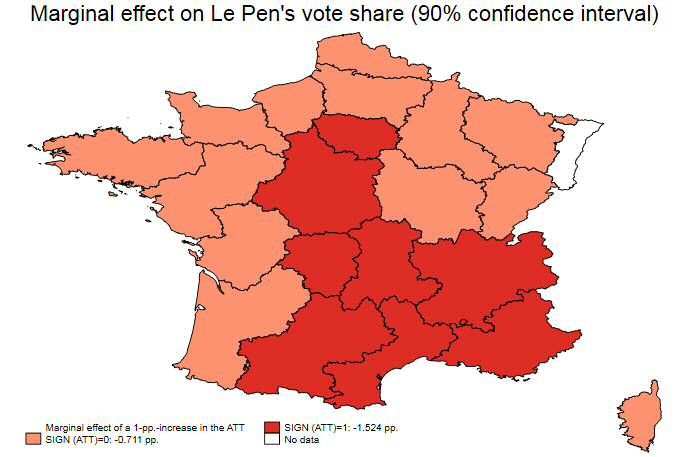
From Equations 3 and 4, we can derive the marginal effect of a one percentage point increase in cohesion
policy effectiveness, in terms of employment growth, on Macron’s and Le Pen’s vote shares by calculating:
∂MACRON
Marginal effectCP Eff. = = γˆ1 + γˆ3 ∗ SIGNj (5)
∂ATT
∂LEPEN
Marginal effectCP Eff. = = κˆ1 + κˆ3 ∗ SIGNj (6)
∂ATT
When presenting the main results, we rely on cross-sectional data and apply simple ordinary least squares
(OLS) and thus consider, if not specified differently in the data section, the averages of each variable from
2007 to 2015 (prior to the election). As we use the estimated ATT from Equation 2, standard errors (clustered
by NUTS-3 region) of the second-stage regressions are bootstrapped with 20,000 replications. Robustness
checks include a Poisson regression using the number of votes as dependent variable, the estimation of vote
shares using a fractional response model (Papke & Wooldridge, 1996) and a seemingly unrelated regression
(SUR) framework. Additionally, we run regressions taking into account Marine Le Pen’s vote shares in 2012
and exploit the time variation in the voting data for analyzing the potential impact of EU’s regional policy
effectiveness.
8
A matrix with the correlation coefficients of all variables is provided in the appendix. Interestingly, the correlation between
regional average employment growth and the cohesion policy-induced effect on firm-level employment growth is quite small
(ρ = 0.109)
9Figure 1: Candidate with most votes by département
Source: By Mélencron (own work) [CC BY-SA 4.0 https://creativecommons.org/licenses/by-sa/4.0, via Wikimedia Com-
mons.
4 Data
4.1 The outcome of the 2017 French presidential election
The voting results of the first (and second) round of the presidential elections in 2017 (and also 2012)
are reported for the NUTS-3 regional level (French départements) on the website of the French ministry
of internal affairs. Given the diverse set of positions regarding the French EU agenda represented by the
candidates in this round, we assume that the voters of Macron held widely pro-European views while the
supporters of Le Pen most likely took an eurosceptic position. Figure 1 visualizes the geographical divide
with regard to the candidates that won the election in each French département. Moreover, Table 1 presents
the variation of minimum and maximum vote shares for Emmanuel Macron and Marine Le Pen across the
NUTS-3 regions. Especially the difference of thirty percentage points between regional vote shares for the
eurosceptic Front National candidate (Le Pen) motivates research about the determinants of French citizens’
voting decisions.
10Table 1: Vote shares per candidate and French NUTS-3 regions, first-round presidential election 2017
Candidate Total share Min. share Max. share
Emmanuel MACRON 24.01% 17.73% (FR825) 34.83% (FR101)
Marine LE PEN 21.30% 4.99% (FR101) 35.67% (FR221)
François FILLON 20.01% 12.75% (FR621) 29.14% (FR105)
Jean-Luc MÉLENCHON 19.58% 13.78% (FR832) 34.02% (FR106)
Notes: Valid votes: 31,381,603. Further candidates: Benoît HAMON (6.36%), Nicolas DUPONT-AIGNAN(4.70%),
Jean LASSALLE (1.21%), Philippe POUTOU (1.09%), François ASSELINEAU (0.92%), Nathalie ARTHAUD
(0.64%), Jacques CHEMINADE (0.18%).
4.2 Data on cohesion policy beneficiaries
For the estimation of the effectiveness of EU cohesion policy at the micro-level, information on actual benefi-
ciaries of EU regional policy instruments during the programming period 2007-2013 (i.e., firms that actually
carried out projects co-funded by the ERDF, the ESF or the CF) is needed in order to identify the treated
firms in France. For this purpose, a new dataset has been compiled which uses different sources. First, ben-
eficiary lists including the funded projects that are part of the EU member states’ operational programmes
are (mostly) publicly available on the websites of the respective managing authorities. They have been com-
puterized and carefully checked for plausibility. The information regarding a funded firm’s name, in a next
step, allows to match this data with information on firm characteristics stemming from the ORBIS database
(commercially) provided by Bureau van Dijk.9 Comparable information for non-funded firms which serve as
the control group is also collected from ORBIS.
For France, the final sample for which all required data is available consists of 1,383 treated entities and
123,167 firms in the control group.10 The outcome variable of interest is employment growth from its pre-
treatment value (2006 or, if not available in ORBIS, 2005 or 2004) to its post-treatment value (2014, if not
available, 2015 or 2016). In order to be able to compare estimates across firms and ATTs across regions,
we calculate average annual employment growth rates by dividing each firm’s growth rate by the number of
years between the utilized pre- and post-treatment observations. In addition we are interested in estimating
a “lagged ATT”. For this purpose, we entirely ignore the employment data from 2014 and calculate average
annual employment growth rates by only considering 2015 or 2016 as post-treatment outcome of interest.
This allows to account for an additional lag in the effects induced by EU structural funds payments.
The variables used for the estimation of the propensity scores and retrieved from the ORBIS database are the
following: (Log) pre-treatment number of employees, (log) initial firm age measured as difference between the
recorded date of incorporation and 2007, (log) initial fixed assets per employee, (log) pre-treatment current
ratio (current assets divided by current liabilities) and two-digits industry dummy variables based on the
NACE Rev.2 classification. Furthermore, matched control firms are restricted to be located in the same
NUTS-2 region as their funded counterparts and, additionally, NUTS-3 region fixed effects are included in
the propensity score matching procedure.
9
See Bachtrögler, Hammer, Reuter & Schwendinger (2017) for detailed information on the dataset.
10
As firm age enters the probit model for estimating the propensity scores as logarithm, i.e., firms which have been founded
in 2007 (and thereafter) are excluded from the sample.
11Two thirds of all firms in the sample are active either in the manufacturing, construction or wholesale and
retail trade sectors (NACE Rev.2 industries C, F and G). An additional share of 15% of all observations
(firms) considered operate in accommodation and food services industries or provide professional, scientific
and technical activities (NACE Rev.2 industries I and M).11 Geographically, almost one quarter of all treated
firms is located in Île de France. Another 12% of all observations is located in either the NUTS-2 region of
Rhône-Alpes or Provence-Alpes-Côte d’Azur, respectively.
Table 2 reports summary statistics for the group of EU fund-receiving firms and the control group, respec-
tively. The reported average realizations across these two different groups clearly motivate the need for
applying a matching procedure for eliminating differences in observable characteristics. In the whole sample,
firms which are funded by EU regional policy instruments exhibited much faster employment growth over
the observed time span, employed on average about seven times as many workers, and in 2007 they were
about five years older as compared to the control group average. Moreover, physical capital available per
worker was higher prior to the programming period while the current ratio of the average control firm slightly
exceeded the one of an average treated firm.
Table 2: Descriptive statistics: Firm-level data
Variable Obs. Mean Std.Dev. Min Max
Treatment group
Employment growth 1,383 0.174 0.698 -5.384 4.766
Average annual employment growth 1,383 0.021 0.086 -0.673 0.596
Number of employees 1,383 231.037 2,342.82 1.000 83,006.000
Age (until 2007) 1,383 20.612 14.987 1.000 107.000
Fixed assets per employee 1,383 162.030 1,057.418 0.002 24,290.600
Current ratio 1,383 1.653 2.110 0.028 53.667
Control group without outliers
Employment growth 123,163 0.010 0.663 -6.094 8.147
Average annual employment growth 123,163 0.001 0.082 -0.737 1.018
Number of employees 123,163 32.349 341.533 1.000 74,506.000
Age (until 2007) 123,163 15.498 12.378 1.000 125.000
Fixed assets per employee 123,163 148.226 4,776.599 0.001 825,289.000
Current ratio 123,163 1.660 4.051 0.001 487.455
Notes: Sources: Bachtrögler, Hammer, Reuter & Schwendinger (2017), ORBIS database. All variables apart from employment growth are measured prior to
treatment. Note that the distribution of most variables is highly skewed, e.g., the median value of employment in treated firms amounts to about 25. One
outlier observation with regard to the pre-treatment value of fixed assets per employee is excluded (non-treated firm with a value of 1,375,649.000 in Île de
France) and three observations (also in the control group) with a current ratio above 600 (maximum value of 92,043.630), located in Île de France and
Rhône-Alpes are excluded.
4.3 Regional data for the voting model
Descriptive statistics for the regional characteristics entering the analysis of the French voting behavior are
reported in Table 3. Accumulated expenditure data (until 2014) per NUTS-3 region is provided by the
European Commission (DG REGIO). On average, it amounts to 82 Euros per inhabitant in France, ranging
11
Note that we do not limit the sample by excluding firms in different sectors but control for different sectors when estimating
propensity scores. We do so as the main research question in this study is whether increasing employment growth induced by
EU regional policy affects a specific region’s citizens’ attitude towards the EU. Whether this takes place in different sectors,
may be, on average, of minor importance to the voters.
12from below 8 Euros per capita in two NUTS-3 regions in Île de France to 359 Euros per capita in Corse. As
further variables indicating a region’s exposure to the EU, the importance of the trade and tourism sector
(NACE Rev.2 industries G-I) and regional net migration are considered. As emigration and immigration
data is not available for France (on a regional level), the relationship of the regional to the national average
should proxy the extent of net migration into a depártement as compared to others within France, which
may determine a citizen’s perceived exposure to foreign countries and therefore the EU.12
Table 3: Descriptive statistics: Regional characteristics for 96 NUTS-3 regions in the voting model
Variable Averagea Source Mean Std.Dev. Min Max
NUTS-3 level
Regional funds expenditure (mio.) 2007-14 DG REGIO 0.082 0.059 0.007 0.359
per 1,000 inhabitants (sum)
GVA share NACE Rev.2 G-I (%) 2007-15 Eurostat 17.810 3.054 12.500 31.605
Relative crude net migration rate (%) 2007-15 Eurostat 0.000 2.073 -4.386 5.034
(Deviation NUTS-3 from national average)b (own calc.)
Population density: Inhabitants 2007-15 Eurostat 558.823 2456.684 14.856 21,130.45
per km2
GDP per capita 2007-15 Eurostat 27,184.640 10,012.81 19,037.50 90,312.50
GDP per capita growth (%) 2007-15 Eurostat 0.782 0.806 -1.061 3.277
(own calc.)
Population share over 65 years (%) 2007-15 Eurostat, 19.020 3.473 10.844 26.761
(own calc.)
NUTS-2 level
European Quality of Government 2007-15 EQIc 0.475 0.223 0.073 0.999
Index (EQI)d World Bank
Eurobarometer: Trust in the EU (%) 2015 Eurobarometere 37.042 4.034 29.000 46.000
Employment rate growth (%) 2007-14f Eurostat 0.078 0.447 -0.785 1.136
Population share with 2007-15 Eurostat 27.814 4.456 20.611 42.800
ISCED levels 0-2g (%)
Employment share in industry 2007-15 Eurostat 22.927 4.454 14.570 33.489
and construction sector (%)
Inhabitants per hospital bed 2007-15 Eurostat 149.987 12.871 115.583 174.108
Unemployment rate (%) 2007-15 Eurostat 8.839 1.349 6.956 12.878
a
For the first difference regression (robustness check) we use average values from 2008 to 2011 and from 2012 to 2015
(2012-2014 for employment growth).
b
In order to ensure a reliable comparison of the values at the NUTS-3 level, regional crude rates of net migration are first
standardized so that their mean coincides with the crude net migration rate reported for metropolitan France (excluding French
overseas departments).
c
?
d
As described in Charron & Lapuente (2018), the EQI 2010 and 2013 are based on an average country score of the World
Governance Indicators (WGI) ’Control of corruption’, ’Government effectiveness’, ’Rule of law’ and ’Voice and accountability’.
As the WGI are available until 2015, we are able to create a time-variant institutional quality measure from 2007 to 2015. We
add the distance of the NUTS-2 level EQI to the national average EQI that coincides with the WGI country score, which is
available on an annual basis, in 2010 and 2013, respectively. EQI 2010 is used for the years from 2007 to 2013 and EQI 2013
for the years 2014 and 2015.
e
European Union (2015b)
f
As the firm-level effects on employment growth included in the voting model are estimated over the MFF 2007-2013 until
2014 (or later years if the 2014 value is not available), this is also the time span of interest regarding the aggregate employment
growth rate of a NUTS-2 region.
g
The population share refers to the inhabitants aged 25 to 64. The highest educational attainment referred to by ISCED
levels from 0 to 2 is primary education (UNESCO, 2012).
12
Unfortunately, the stock of migrants relative to a region’s total inhabitants, as an alternative measure, is not available as
a time series but on the NUTS-2 regional level in 2011. The average population share with foreign citizenship corresponded to
5% that year.
13As regional differences in cohesion policy effects on firm performance may be due to the quality of institutions
within a region (as a determinant of absorptive capacity, see e.g., Becker, Egger & von Ehrlich, 2013), we
include the European Quality of Government Index introduced by ?.13 Moreover, to capture the regional in-
habitants’ attitude towards the EU independently from the running candidates, an indicator stemming from
a Eurobarometer survey about the citizens’ trust in the EU is included. That is, the share of respondents
within a NUTS-2 region who “tend to trust” in the European Union as a whole. In order to account for
overall employment growth within a NUTS-2 region, we add the average of this variable for 2007-2014 as
further control variable. Those three covariates are expected to be associated with less Euroscepticism.
Additional control variables on the NUTS-3 regional level are population density, income and income growth
as well as the share of the regional population aged over 65 years. Divergent GDP per capita growth rates
should account for the asymmetric impact of the Great Recession on regional economic development. For the
NUTS-2 region level, another set of economic characteristics is considered, namely, the employment share
in the manufacturing and construction industries and the unemployment rate. Finally, the share of the
population aged between 25 and 64 years with primary or no education (on average, 28%) and an indicator
describing the quality of the health system (inhabitants per hospital bed) are included in the estimation.
Based on previous findings in the literature, we expect that higher income and income growth, population
density and education as well as fewer inhabitants per hospital bed are correlated with less Euroscepticism
and fewer votes for Marine Le Pen.
5 Estimation results
5.1 Firm-level effectiveness of regional funds
The first part of the empirical analysis estimates the firm-level effects of projects co-funded by regional funds
in French NUTS-2 regions. The results are presented in Table 4, which reports estimated average treat-
ment effects on the treated (ATT) over the whole time span (from before the MFF 2007-2013 to afterwards,
depending on data availability) and annualized (i.e., annual average) ATTs. The estimates are based on
employment growth from 2006 (or earlier if the 2006 value is not available from ORBIS) to 2014 or later
(if the 2014 value is unknown), as well as with an additional lag (lagged ATT). Recall that for estimating
lagged ATTs, the post-treatment value considered for the calculation of employment growth is 2015 and
2016, respectively and not 2014. By using employment growth instead of employment, our approach com-
bines propensity score matching with a DiD framework. With regard to the propensity score matching,
covariate-balancing is achieved in all different specifications applied.
In the baseline results of the voting model presented in the next section, we use the non-lagged annual ATT
as the co-funded projects carried out by the firms during the MFF 2007-2013 start from 2007 on and we
therefore expect that a lag in policy effectiveness is already included for a large share of the projects also
when taking into account employment growth (only) until 2014.
13
Refer to Table 3 for details on the calculation of a panel version of the European Quality of Government Index.
14Table 4: Results: Firm-level average treatment effects on the treated firms’ employment growth
NUTS-2 region Total obs. ATT Annual Total obs. Lagged Annual
Treated obs. ATT Treated obs. ATT lagged ATT
Île de France 26,779 0.285∗∗∗ 0.029∗∗ 22,773 0.282∗∗∗ 0.031∗∗∗
196 (0.097) (0.012) 174 (0.109) (0.011)
Champagne-Ardenne 1,325 0.042 0.004 1,123 0.188 0.020
44 (0.155) (0.018) 42 (0.165) (0.018)
Picardie 1,050 0.122 0.015 520 0.316 0.035
18 (0.295) (0.036) 15 (0.336) (0.037)
Haute-Normandie 1,162 0.317 0.038 1,042 0.386 0.043
24 (0.260) (0.032) 24 (0.287) (0.032)
Centre (FR) 2,242 0.315 0.039∗ 1,853 0.597∗∗∗ 0.066∗∗∗
40 (0.193) (0.024) 36 (0.186) (0.021)
Basse-Normandie 1,223 0.405 0.048 1,041 0.077 0.006
18 (0.301) (0.036) 12 (0.292) (0.032)
Bourgogne 1,772 0.220 0.028 1,500 0.345† 0.038†
35 (0.204) (0.025) 33 (0.209) (0.023)
Nord-Pas-de-Calais 3,892 0.234† 0.028† 3,373 0.332∗∗ 0.037∗∗
81 (0.145) (0.018) 73 (0.162) (0.018)
Lorraine 1,389 0.061 0.008 1,206 0.125 0.014
87 (0.105) (0.013) 75 (0.133) (0.015)
Franche-Comté 1,558 0.191 0.023 1,097 0.262† 0.029†
40 (0.153) (0.019) 40 (0.180) (0.020)
Pays de la Loire 2,404 0.139 0.017 2,145 0.106 0.012
36 (0.193) (0.024) 30 (0.194) (0.021)
Bretagne 1,318 0.204 0.025 1,117 0.395 0.044
20 (0.275) (0.034) 18 (0.292) (0.032)
Poitou-Charentes 1,382 −0.005 0.000 1,205 0.090 0.010
52 (0.151) (0.019) 48 (0.154) (0.017)
Aquitaine 5,246 0.131 0.015 4,223 0.045 0.005
57 (0.156) (0.019) 53 (0.163) (0.018)
Midi-Pyrénées 7,193 0.218∗∗∗ 0.027∗∗∗ 6,026 0.227∗∗∗ 0.025∗∗∗
255 (0.073) (0.009) 223 (0.082) (0.009)
Limousin 1,052 0.274∗ 0.033∗ 858 0.037 0.004
52 (0.150) (0.018) 46 (0.162) (0.018)
Rhône-Alpes 11,546 0.167∗ 0.021∗ 9,687 0.060 0.007
118 (0.095) (0.012) 105 (0.109) (0.012)
Auvergne 1,382 0.397∗∗ 0.049∗∗ 1,216 0.317† 0.035†
34 (0.183) (0.023) 31 (0.201) (0.022)
Languedoc-Roussillon 5,599 0.431∗∗ 0.053∗∗ 4,673 0.293† 0.032†
64 (0.170) (0.021) 58 (0.189) (0.021)
P.A.-Côte d’Azur 9,810 0.384∗∗ 0.047∗∗ 7,946 0.394∗∗ 0.043∗∗
50 (0.152) (0.019) 49 (0.171) (0.019)
Corse 929 0.193 0.023 752 0.012 0.000
29 (0.221) (0.027) 25 (0.222) (0.024)
Notes: *** denotes statistical significance at the 1% level, ** at the 5% level, * at the 10% level, † at the 15% level. The treatment effects are estimated per
NUTS-2 region with considering a NUTS-3 region fixed effect in the estimation of the propensity scores. For FR421 and FR422 (Bas-Rhin and Haut-Rhin in
Alsace), no ATT could not be calculated due to too few observations. The lagged ATT considers the 2015 value, or if it is not available from ORBIS, the 2016
value as a post-treatment value for the calculation of the outcome variable (employment growth).
From the propensity score matching estimation and based on bootstrapped standard errors, we find that, on
average, treated firms in five (eight) of the 21 French NUTS-2 regions experience a positive and statistically
significant employment growth effect at least at the standard confidence level of 95% (90%). To give an
example, in Île de France, annual average employment growth of treated firms over the programming period
2007-2013 is by 2.9 percentage points larger due to funding from EU structural funds. Taking into considera-
tion the lagged effect until 2015, the (significant) annualised ATT increases further by 0.2 percentage points.
15A similar pattern can also be found for the NUTS-2 regions of Centre and Nord-Pas-de-Calais, where the
treatment effect turns significant at the 5%-level when considering the time lag of the effect. The policy
effects are also statistically significant in Midi-Pyrénées and Provence-Alpes-Côte d’Azur, while the estimated
treatment effects in some other regions are only significant at the 15%-level when lagging the post-treatment
employment outcomes.14
In the majority of regions, however, the projects co-funded by the EU’s structural funds do not appear to
have had a statistically significant impact on employment growth for beneficiary firms. In all cases, the
estimated ATTs take on positive values but we are not able to rule out a zero effect.15 As indicated in
Table 4, in some regions the number of treated firms is relatively small which reduces the statistical power
associated with the estimated treatment effects stemming from the applied propensity score matching and
DiD framework. In general, however, one may conclude that EU structural funds payments do not seem
to induce adverse employment effects in the French NUTS-2 regions but its statistical effectiveness varies
substantially across regions. In the next step we are aiming to exploit the variation in the obtained EU
structural funds effects in order to explain voting behavior in the 2017 French presidential election.
5.2 The basic model for explaining eurosceptic voting
In the following, we concentrate on the proposed voting model explaining variation in the vote at the French
presidential election across French NUTS-3 regions. Thereby, we put special emphasis on the main hypothe-
sis of this study, namely, that not only the amount of cohesion policy expenditures in a NUTS-3 region but,
conditional on these, also actual policy effectiveness affects the voting behavior of French citizens. Policy
effectiveness enters the voting model via the estimated ATTs stemming from the firm-level analysis of the
employment growth effects of EU structural funds payments. As indicated in the introduction, we expect
that (this kind of) policy effect may be perceived by voters.
Table 5 reports the estimated marginal effects of the selected variables, identified in the previous literature,
on Macron’s vote share (reported at the left-hand side) and on Le Pen’s election success (at the right-hand
side), without considering the effectiveness of EU regional policies. Thus, these results offer a benchmark
and are comparable to the ones provided by other papers for the case of the “Brexit” referendum (e.g.,
Becker et al., 2017). In the first specifications each we include all available NUTS-2 and NUTS-3 regional
characteristics. Specifications (2) alternatively include NUTS-2 fixed effects and, as a consequence, only
study the impacts of regional characteristics available at the more disaggregated NUTS-3 level. The third
specifications for each of the two candidates include the vote shares of Le Pen in Macron’s equation, and
vice versa, as they are strongly negatively correlated with ρ = −0.927 (see Table A1 in the Appendix).
According to our estimates, there is no clear relationship between the size of the trade and tourism sectors
as well as the regional net migration rate (relative to national net migration) and the voting behavior in
French regions. By contrast, the estimation results indicate that a one percent increase of regional funds
expenditure per 1,000 inhabitants in the respective NUTS-3 region statistically significantly decreases the
vote share for Marine Le Pen by about one to two percentage points. The corresponding effect for the vote
14
In Limousin and Rhône-Alpes, the standard ATT is only statistically significant at the 90%-level, which may explain its
loss of significance when being lagged.
15
Refer to Figure 2 for a depiction of significant and non-significant ATTs by NUTS-2 region in a map of France.
16You can also read