Frequency Based Emergency Disconnection Policy Review for the Nordic Region - Statnett
←
→
Page content transcription
If your browser does not render page correctly, please read the page content below
Åpen informasjon / Public information

           Frequency Based Emergency Disconnection Policy
           Review for the Nordic Region

           Frequency Based Emergency Disconnection
           Policy Review for the Nordic Region
           Report – V 1.0

           Nordic Analysis Group (NAG)
           14 June 2017

                                                                                                                                                                 1
           ENTSO-E AISBL • Avenue de Cortenbergh 100 • 1000 Brussels • Belgium • Tel + 32 2 741 09 50 • Fax + 32 2 741 09 51 • info@entsoe.eu • www. entsoe.eu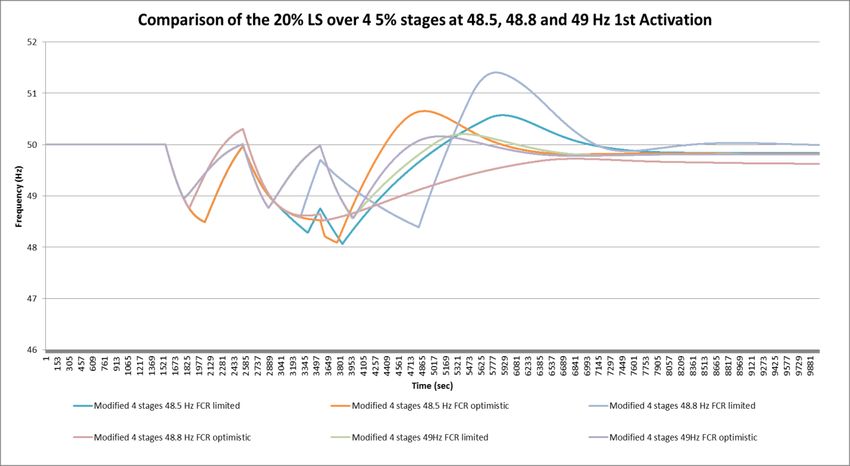
Åpen informasjon / Public information

           Frequency Based Emergency Disconnection Policy
           Review for the Nordic Region

           Version                     [1]
           Date                        14/06/2017
           Authors                     Graeme Hutchison                                             (Ramboll)
                                       Øyvind Breidablik                                            (Statnett)
                                       Harri Kuisti                                                 (Fingrid)
                                       Ilkka Luukkonen                                              (Fingrid)
                                       Magnus Nielsen                                               (Statnett)
                                       Flemming Brinch Nielsen                                      (Energinet)
                                       Johan Setréus                                                (Svenska Kraftnät)
                                       Lars Gjedsted Sørensen                                       (Energinet)
                                       Jukka Turunen                                                (Fingrid)

           Approved by                 Nordic Analysis Group

                                                                                                                                                                 2
           ENTSO-E AISBL • Avenue de Cortenbergh 100 • 1000 Brussels • Belgium • Tel + 32 2 741 09 50 • Fax + 32 2 741 09 51 • info@entsoe.eu • www. entsoe.eu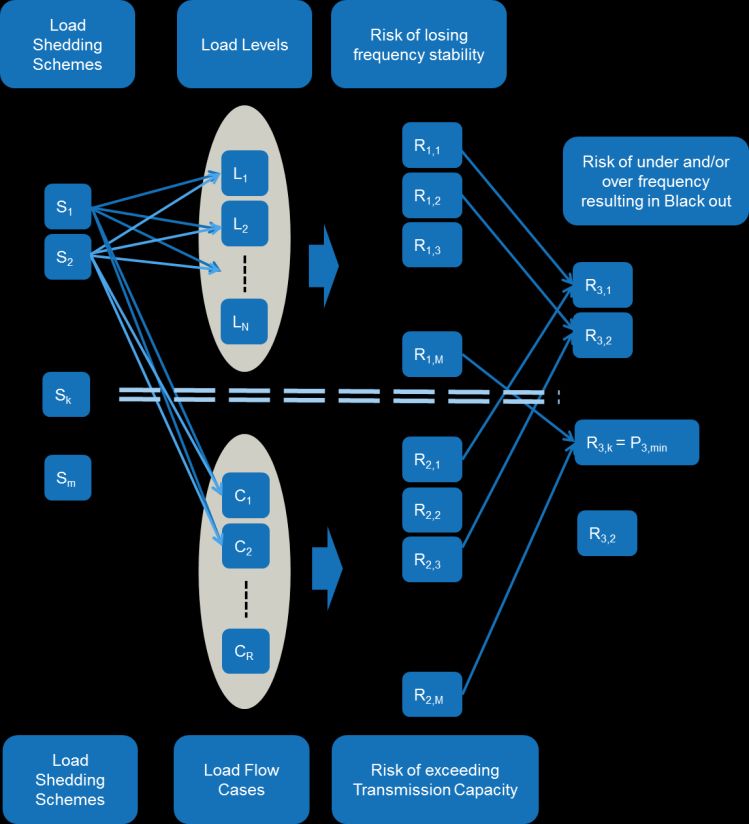
Åpen informasjon / Public information

           Frequency Based Emergency Disconnection Policy
           Review for the Nordic Region

                  Contents
           Contents.................................................................................................................................................................. 3
           Executive Summary .............................................................................................................................................. 5
           1.          Introduction............................................................................................................................................... 6
           2.          Current Situation ...................................................................................................................................... 7
           3.          Study Concept ........................................................................................................................................... 9
                Principles of UFLS .............................................................................................................................................. 9
                   Assumptions .................................................................................................................................................. 10
                Evaluation Methodology ................................................................................................................................... 11
                Evaluation of UFLS Scheme ............................................................................................................................. 12
                Identified Schemes ............................................................................................................................................ 13
                Final Scheme Evaluation Criteria ..................................................................................................................... 14
           4.          Screening of Schemes - Frequency Stability ......................................................................................... 15
                Overview ........................................................................................................................................................... 15
                Methodology ..................................................................................................................................................... 15
                   Lumped Parameter Model Modifications and Assumptions ......................................................................... 16
                Lumped Model Results ..................................................................................................................................... 17
           5.          Screening of Schemes - Transmission Capacity ................................................................................... 23
                Overview ........................................................................................................................................................... 23
                Methodology ..................................................................................................................................................... 23
                Modelling Assumptions .................................................................................................................................... 25
                   Market Modelling ......................................................................................................................................... 25
                   Generation / Interconnector Modelling ......................................................................................................... 25
                   Reactive Compensation and Ancillary Services (FCR) ................................................................................ 25
                   Relay Activation Time .................................................................................................................................. 25
                Data Recorded ................................................................................................................................................... 26
                   Cases Evaluated ............................................................................................................................................ 26
                   Schemes Considered ..................................................................................................................................... 26
                   Events Considered ........................................................................................................................................ 27
                Transmission Capacity Results ......................................................................................................................... 28
                   Scheme Commentary .................................................................................................................................... 29
                   Scheme Summary ......................................................................................................................................... 31
           6.          Combined Screening Results ................................................................................................................. 32
                Risk of Blackout................................................................................................................................................ 32
                   Frequency Stability using the RAR model.................................................................................................... 32
                   Transmission Capacity Assessment .............................................................................................................. 32
                   Calculation of Total Risk of Blackout .......................................................................................................... 33
                Selected Schemes .............................................................................................................................................. 35

                                                                                                                                                                                          3
           ENTSO-E AISBL • Avenue de Cortenbergh 100 • 1000 Brussels • Belgium • Tel + 32 2 741 09 50 • Fax + 32 2 741 09 51 • info@entsoe.eu • www. entsoe.eu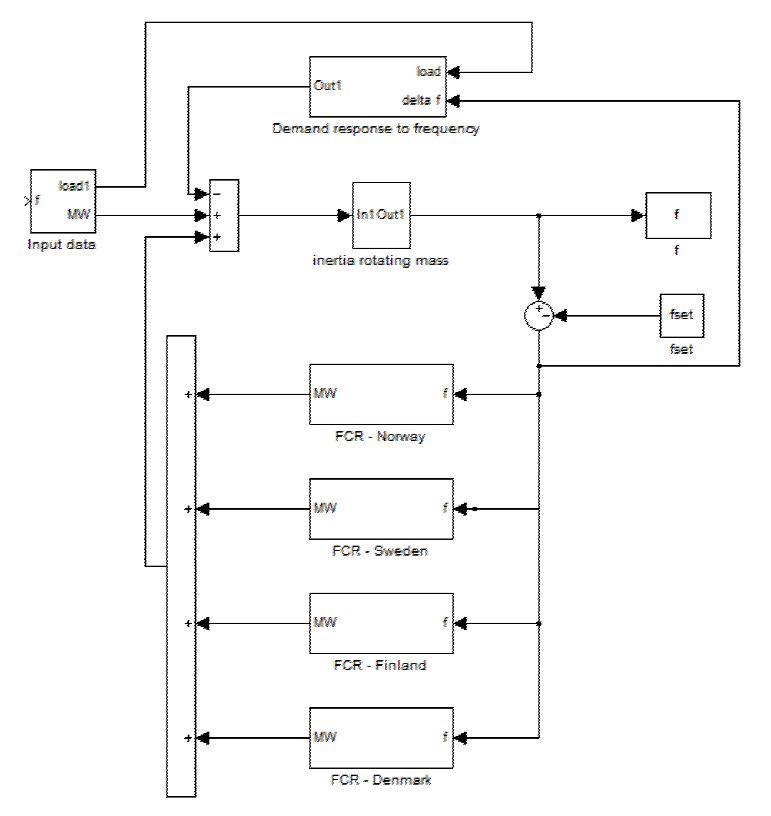
Åpen informasjon / Public information

           Frequency Based Emergency Disconnection Policy
           Review for the Nordic Region

           7.           Detailed Evaluation – PSSE Studies ...................................................................................................... 36
                Overview ........................................................................................................................................................... 36
                Five Scenarios - Base Cases and Extreme Case ................................................................................................ 36
                Contingency Events .......................................................................................................................................... 37
                Results ............................................................................................................................................................... 39
                   2020 Minimum Demand ............................................................................................................................... 39
                   2020 Maximum Demand .............................................................................................................................. 41
                   2025 Minimum Demand ............................................................................................................................... 43
                   2025 Maximum Demand .............................................................................................................................. 45
                   Commentary .................................................................................................................................................. 47
                Summated Result .............................................................................................................................................. 47
                   Long Term Planning Considerations ............................................................................................................ 48
           8.           Recommended UFLS Scheme ................................................................................................................ 49
                   Over Frequency ............................................................................................................................................. 50
           9.           Implementation ....................................................................................................................................... 53
                Overview ........................................................................................................................................................... 53
                Review of Associated Codes, Standards & Agreements ................................................................................... 53
                Nordic Grid Code .............................................................................................................................................. 53
                   System Operation Agreement (SOA)............................................................................................................ 53
                   ENTSO-E Network Code on Emergency and Restoration (Awaiting implementation) ............................... 55
                   COMMISSION REGULATION (EU) 2016/631- Network Code on Requirements for Grid Connection of
                   Generators ..................................................................................................................................................... 57
                TSO Roll out ..................................................................................................................................................... 58
                   Implementation of UFLS in Eastern Denmark ............................................................................................. 58
                   Implementation of UFLS in Finland ............................................................................................................. 58
                   Implementation of UFLS in Sweden............................................................................................................. 59
                   Implementation of UFLS in Norway ............................................................................................................ 59
           References ............................................................................................................................................................ 60
           10.          Appendix A - RAR Model Structure ..................................................................................................... 61
           11.          Appendix B – PSSE Modelling Assumptions ....................................................................................... 62
                Modelling Principles ......................................................................................................................................... 62
           12.          Appendix C - Current Situation ............................................................................................................ 67
                Norway .............................................................................................................................................................. 68
                Sweden .............................................................................................................................................................. 69
                Denmark ............................................................................................................................................................ 69
                Finland .............................................................................................................................................................. 70
           13.          Appendix D – High Risk Operational Cases ........................................................................................ 71

                                                                                                                                                                                             4
           ENTSO-E AISBL • Avenue de Cortenbergh 100 • 1000 Brussels • Belgium • Tel + 32 2 741 09 50 • Fax + 32 2 741 09 51 • info@entsoe.eu • www. entsoe.eu
Åpen informasjon / Public information
Frequency Based Emergency Disconnection Policy
Review for the Nordic Region
Executive Summary
The Nordic network has changed significantly in the recent years. It is envisaged that this change will
continue over the next decade in order to accommodate an increase in renewable penetration and HVDC
interconnections to continental Europe and the UK. As a result of this change, there are other likely
eventualities; closure of nuclear units in Sweden, or a reduction in thermal generation units.
These changes in generation profile, inter-country spot trading, and associated network reinforcements have
resulted in a need to re-evaluate the policies and settings that maintain and secure network frequency under
serious outage events. As a result of this the Nordic Analysis Group (NAG) was engaged to review the
Under Frequency Load Shedding (UFLS) philosophy for the Nordics. This report documents the associated
review and presents the following initial observations:
‒ The current SOA agreed UFLS settings are no longer optimal and may increase the risk of
frequency instability in the network under severe outage events.
‒ The current declared UFLS levels are not actually what is implemented within the network;
with up significantly less load shedding available than prescribed within the SOA (country
specific).
‒ In reality, the effort to implement a new set of UFLS settings may be no more labour intensive
than ensuring that mandated levels of UFLS are implemented in all countries.
Having identified the above salient details, a study was instigated to derive a set of revised UFLS settings
that:
‒ Appropriately distributes shed load between TSOs as well as within a TSO area.
‒ Provides the same reference for frequency and load shedding stage across the interconnected network.
‒ Minimises UFLS whilst ensuring frequency stability across the network.
‒ Avoids over frequency and transients that can lead to an additional loss of generation
Varying UFLS schemes have been assessed through pre-screening studies to evaluate the risk of frequency
instability and the risk of exceeding transmission capacity across the wider network. As a result of this, 10
potential schemes were considered against the current network topology and the 2025 network
configuration (as set out by each TSO’s long term development statement).
The studies enabled each scheme was evaluated against frequency deviation, stability and ultimately the
average level of load lost per load shedding event that encompassed over 800 scenarios and dynamic
stability studies.
‒ The UFLS scheme identified to most efficiently maintain stability whilst minimising total
load shed is a 4 stage UFLS scheme shedding 20% of maximum load in 5% stages
occurring at 48.8 Hz, 48.6 Hz, 48.4 Hz and 48.2 Hz.
As a result of this there will be a need to present a set of revised changes to the System Operation
Agreement (SOA). It is noted that the recommended changes are generally consistent and compliant with
the ENTSO-E Network Code on Emergency and Restoration. The only area that would be necessary to
revise would be the mandatory total disconnected load (set at 30% for the Nordics). Given the associated
study and the beneficial impact this revision would create, it is likely this revision would be considered
favourably.
5
ENTSO-E AISBL • Avenue de Cortenbergh 100 • 1000 Brussels • Belgium • Tel + 32 2 741 09 50 • Fax + 32 2 741 09 51 • info@entsoe.eu • www. entsoe.euÅpen informasjon / Public information
Frequency Based Emergency Disconnection Policy
Review for the Nordic Region
1. Introduction
When large generating units or significant parts of the connected network are disconnected, the power
system may encounter a swing in frequency of a magnitude relative to the size of loss. Limits are imposed
on the magnitude of frequency deviation to prevent plant damage, or in worst case, collapse of the system.
Frequency responsive services to recover lost energy are offered in the form of ancillary services such as
Frequency Control Reserve (FCR). Likewise, part-load plant, or ‘spinning reserve’, operates outside of
optimal settings, resulting in lower efficiencies, and higher emissions. Under the circumstance of severe
disturbance that is not recoverable without the disconnection of load in order to stabilise operating
frequency, Under Frequency Load Shedding is employed. The methodology and magnitude is set out in an
UFLS policy that is implemented by Transmission System Operators TSO’s as part of their licence
obligations.
The main scope of this report is to evaluate the existing and alternative UFLS strategies within the Nordics
(Norway, Sweden, Eastern Denmark and Finland). Having evaluated suitable options, this report presents a
set of recommendations for a coordinated UFLS policy that can be implemented by the relevant TSO’s.
The ultimate deliverable of this project is to review and update the UFLS scheme and associated policies
based on current and future transmission network and generation development plans for Norway, Sweden,
Western Denmark and Finland. In order to provide an appropriate evaluation of these settings varying
power systems have been performed in order to provide confidence in the recommendations presented. The
structure of this report is presented below.
Chapter 3 provides a context to the current settings, highlighting the current regulatory obligations of each
of the TSO’s within the System Operation Agreement. The methodology of how each TSO fulfils these
obligations is identified.
Chapter 4 sets out the principles and methodology of the study and how UFLS schemes will be evaluated.
Chapters 5 & 6 describe the pre-screening phases of potential UFLS schemes.
Chapter 7 presents the combined findings of the pre-screening and identifies schemes that have been
nominated for further study.
Chapter 8 documents the detailed power system studies that were performed in order identify the most
technically appropriate UFLS scheme.
Chapter 9 identifies the most technically viable UFLS scheme for the Nordic Operating Area and provides
specific commentary on the schemes performance under severe network events.
Chapter 10 documents a high level implementation plan for each TSO/country. This considers the impact
of regulation on the study and the regulatory changes required as a result of the recommended scheme.
6
ENTSO-E AISBL • Avenue de Cortenbergh 100 • 1000 Brussels • Belgium • Tel + 32 2 741 09 50 • Fax + 32 2 741 09 51 • info@entsoe.eu • www. entsoe.euÅpen informasjon / Public information
Frequency Based Emergency Disconnection Policy
Review for the Nordic Region
2. Current Situation
The existing ULFS philosophy was initially developed and implemented within the 1980’s in order to
consider the rising interconnectivity of the Nordic system (formerly Nordel). The plan was consistent with
"Proposed Recommendation for frequency controlled power conditioner in the synchronous Nordel area".
To this end, the policy set out the following principles:
‒ HVDC connections out of the Nordel area were used for emergency power within the frequency range
from 49.5 to 49.0 Hz. Utilisation (MW/s and MW) was agreed for each individual HVDC connection
depending on its capability.
‒ ULFS within the national power systems was implemented during frequency drops down to 48.7 Hz.
Disconnections were made in steps of 0.2 Hz and in a total magnitude of 20-50% of the total load
depending on the expected production deficit.
‒ The individual ULFS policy of the country defined the size, locality and distribution of frequency step
whilst having due regard to the requirements of an overall Nordel operation.
‒ The first ULFS policy steps were implemented in, or near Nordel system load centres.
‒ ULFS was carried out in such a manner that it minimised the risk of overload due to the changes in
power flow around the network.
‒ Possible localised problems without significant consequences for Nordel network were addressed
nationally.
As a result of these principles the following recommendations were adopted within in Nordel system:
‒ Sweden began load disconnection at 49.0 Hz (time delay 20s) and then used five 0.2 Hz decremented
steps.
‒ Denmark and Norway began load shedding at 48.7 Hz and subsequently over five 0.2 Hz decremented
steps.
‒ Denmark adopted a first stage time delay of twenty seconds, while Norway adopted a relatively small
MW level during the first stage.
‒ Finland began load disconnection at 48.7 Hz (time delay 20 s) and then two 0.2 Hz decremented steps.
These settings have evolved in the intervening years to the settings currently adopted within the SOA. The
Current UFLS policy enacted within the SOA is seen in Table 1. It is noted that there are some significant
time delays stipulated within the SOA prior to disconnection. Whilst the reason for this has not been fully
identified, it has been inferred that this larger duration was to facilitate frequency stabilisation should a
significantly severe event cause networks to disconnect and run in islanded sections. Historically this may
have been more likely given considerably less network reinforcement and cross border connections but it
could be argued is less relevant given the current network topology.
Table 1 identifies the current UFLS policies and obligations that have been adopted within each Nordic
country. It is noted that although the SOA prevails over other UFLS policy for each country, there are
other procedures that underpin this policy1. Although each country has a clear methodology for UFLS
activation, the methodology for implementation is different from one country to the next. This is invariably
a legacy from the original determination of the settings. The settings together with a summarised
methodology of the UFLS application from one country to the next is seen within Appendix C on page 67.
1
During the process of this study, it has become evident that the quantities of UFLS mandated within the SOA may
not be fully available for each Nordic country. An example of this would be the levels of available load to be shed
within SE3 and SE4 in Sweden. In these cases the SOA mandates 30% of maximum load should be available for
shedding. In reality, it is understood that this level is closer to 20% of load.
7
ENTSO-E AISBL • Avenue de Cortenbergh 100 • 1000 Brussels • Belgium • Tel + 32 2 741 09 50 • Fax + 32 2 741 09 51 • info@entsoe.eu • www. entsoe.euÅpen informasjon / Public information
Frequency Based Emergency Disconnection Policy
Review for the Nordic Region
Table 1 Current UFLS Policy within the SOA
Country Locality Criteria
Denmark East 10% of consumption f < 48.5 Hz momentary, f < 48.7 Hz at
20 s
10% of consumption f < 48.3 Hz momentary, f < 48.5 Hz at
20 s
10% of consumption f < 48.1 Hz momentary, f < 48.3 Hz at
20 s
10% of consumption f < 47.9 Hz momentary, f < 48.1 Hz at
20 s
10% of consumption f < 47.7 Hz momentary, f < 47.9 Hz at
20 s
West 15% of consumption f < 48.7 Hz
25% of consumption f < 47.7 Hz
Norway 30% of load in stages between 48.7 Hz to 47 Hz
Sweden South of Electric Boilers and Heat Pumps
Constraint 35 MW P ≤ 49.4 Hz in 0.15 s
25 MW ≤ PÅpen informasjon / Public information
Frequency Based Emergency Disconnection Policy
Review for the Nordic Region
3. Study Concept
In this section, the basic principles of how the varying UFLS schemes are to be modelled and evaluated are
presented. This is in order that the reader has a clear understanding of how the subsequent sections inform
the selection process.
Principles of UFLS
The system frequency of a synchronous AC power system, such as the Nordic transmission grid, varies
with the imbalance between generation and load. To maintain system frequency within appropriate limits, a
degree of frequency responsive plant is required in order to allow for dynamic adjustment of generated
power.
When large generating units or there is a considerable loss of power infeed, the resultant swing in frequency
is relative to the size of loss. The Nordic Code imposes on the magnitude of frequency deviation to prevent
plant damage, or in worst case, collapse of the system. Frequency responsive services to recover lost energy
are offered in the form of ancillary services such as Frequency Control Reserve (FCR). Under the
circumstance of severe disturbance that is not recoverable, the disconnection of load is used in order to
stabilise operating frequency. The methodology and magnitude is set out in the UFLS policy that is
implemented by TSO’s as part of their licence obligations.
The UFLS policy as presented in the SOA sets out the criteria by which the Nordic TSO’s plan and operate
the Nordic transmission system under very low frequency events. The UFLS policy is relevant both to the
TSO’s, and to Users of the transmission system, namely bulk customers and distribution network operators.
For the TSOs, it describes the frequencies under which load is shed as part of a recovery plan to restore
system frequency in the event of a severe disturbance that would undermine the transmission networks
capacity to operate within the criteria set out by the SOA.
UFLS is applied in a way that provides a compromise between a quasi-linear control target and a rigid fixed
pre-set load disconnection. In essence, practical disconnection stages derived from appropriate dynamic
studies covering applicable scenarios and realistic operational concerns.
An efficient UFLS scheme is generally planned on the basis of several principles:
‒ Geographically distributed to effectively shed load between TSOs as well as within a TSO area
‒ Same reference for frequency and load shedding steps across the interconnected network
‒ Effective implementation ensures the UFLS has minimal necessary requirement for shedding of load
‒ Compensate disconnection of dispersed generation at unfavourable frequencies
‒ Avoid over frequency (overcompensation), overvoltage and power transients that can lead to an
additional loss of generation
This review of the current UFLS settings takes the following additional conditions into consideration:
‒ Utilisation of the current ancillary market mechanisms for frequency support
‒ Avoidance of splitting of network by intervention of associated protection
‒ Due consideration of the net effect of losing embedded generation located on the load feeders subject
to load shedding
‒ Account for the operational dispatch of HVDC as part of frequency recovery
Whilst there is an inherent need to review and revise the current settings in order to maintain the high
standards of transmission network operation that is currently achieved, it is also necessary to recognise the
changing landscape under which transmission networks operate. The transition away from conventional
large fossil fuelled or nuclear generating stations having significant inertia, to a higher proportion of
embedded or renewable sources has forced TSOs to re-evaluate the way they operate in order to maintain
security and quality of supply to Users.
9
ENTSO-E AISBL • Avenue de Cortenbergh 100 • 1000 Brussels • Belgium • Tel + 32 2 741 09 50 • Fax + 32 2 741 09 51 • info@entsoe.eu • www. entsoe.euÅpen informasjon / Public information
Frequency Based Emergency Disconnection Policy
Review for the Nordic Region
Assumptions
Given the relative complexity of the study it is necessary to quantify the assumptions made during the
evaluation. Amongst these assumptions are the below exclusions from the study. These include:
• Operational scenarios based on voltage disturbance.
• Load shedding schemes based on under voltage.
• Load shedding schemes based on Rate of Change of Frequency (ROCOF).
• Pump storage control.
• HVDC frequency support2
• Wind turbine synthetic inertia and associated frequency support.
Whilst the study considers the loss of generation, be it conventional thermal or renewable sourced, the
study does not consider the relative and seasonal impact of wind patterns on wind generation levels.
In order to stimulate sufficient instability that UFLS is activated, it is necessary to provide severe
discrepancy between Generation / Power infeed and associated electrical demand. The associated stages
selected to instigate such instability is losses of 1800, 2300, 2800, 3300, 3800, 4300, 4800, 5300, 5800,
6300 and 6900 MW tested with the largest total disconnection (∆P) being 6900 MW which equates to the
loss of all HVDC links to continental Europe at full power (and includes 1400 MW of additional capacity
from Nordlink from 2020).
The following frequency ranges are assumed:
The reason is to reserve a range between 50 Hz and 49 Hz (1 Hz) where primary
The first step of reserve is trying to recover the effect from the power deficit. The same range is also
load shedding is usable by TSOs to compensate other effects mainly due to the additional imbalances
fixed at equal to or that could happen in their system. For example, a TSO could choose to shed load (i.e.
below 49 Hz. pumping storage plants or interruptible customers) in order to compensate generator
trips due to noncompliant frequency disconnection settings.
The last step is This provides a range of 1.1 Hz to control the under frequency transient by loads
activated at shedding. Below this frequency there is a certain margin (around 0.2 Hz) where
47.7 Hz generating units can operate and hopefully recover without trip.
2
Outside of the associated levels required by the SOA.
10
ENTSO-E AISBL • Avenue de Cortenbergh 100 • 1000 Brussels • Belgium • Tel + 32 2 741 09 50 • Fax + 32 2 741 09 51 • info@entsoe.eu • www. entsoe.euÅpen informasjon / Public information
Frequency Based Emergency Disconnection Policy
Review for the Nordic Region
Evaluation Methodology
There have been other ENTSO-E studies that have considered the development of harmonised UFLS
Schemes for Continental Europe (ENTSO-E, 2014). This approach utilised a simplified representation of
frequency control reserves in which each generation technology provides an associated contribution. It also
considered the power systems effective inertia to gauge network response to frequency deviation. This
concept, whilst fitting for an extended network (where there is less certainty in availability and accuracy of
data) has been supplemented with detailed network modelling in this study in order to develop UFLS
settings that are more applicable to the Nordics.
To this end, the study is formed with three main stages:
‒ An initial screening phase utilising a lumped parameter model to characterise dynamic stability.
‒ A secondary screening phase using a PSSE based model to assess the impact of the UFLS scheme on
violation of transmission capacity limits. And finally;
‒ a detailed power system studies using a comprehensive network model for the Nordics in PSSE in
order to verify technical viability of the schemes against identified operational constraints.
This process is characterised in Figure 1 below.
Figure 1 UFLS Evaluation Process
11
ENTSO-E AISBL • Avenue de Cortenbergh 100 • 1000 Brussels • Belgium • Tel + 32 2 741 09 50 • Fax + 32 2 741 09 51 • info@entsoe.eu • www. entsoe.euÅpen informasjon / Public information
Frequency Based Emergency Disconnection Policy
Review for the Nordic Region
Evaluation of UFLS Scheme
In order to characterize the relative benefits of one load shedding scheme to another; it becomes necessary
to adequately characterise the risk of frequency instability. To this end M different load shedding schemes
(S1...SM) are considered. Each load shedding scheme includes a definition of quantity of load lost in the
form of percentage of total load per stage, and division of load shedding per bidding zone. Under the
evaluation criteria:
‒ Each load shedding scheme Sk is simulated in N different Nordic load/production levels (L1...LN)
where the risk of losing frequency stability is:
R1(Sk) = R1,k (1)
‒ Each load shedding scheme Sk is simulated in R load flow cases (C1...CR) where the risk of exceeding
transmission capacity:
R2(Sk) = R2,k (2)
3
‒ Thus, the total risk of black out R3(Sk)= P2,k is calculated for each load shedding scheme , where:
R3(Sk) =R1(Sk) + R2(Sk) - R1(Sk)*R2(Sk) (3)
As a result, the load shedding scheme Sk results in the lowest risk of black-out, R3,k, and is considered the
most viable. The associated scheme is graphically represented below in Figure 2. For clarity, load level
evaluation will be performed using the lumped parameter model discussed above. Load flow cases will be
evaluated using the Nordic Power System bidding zone PSSE model.
Figure 2 calculating the total risk of black-out as a result of loss of frequency stability or violation of transmission capacity
limits
3
Where (3) is an equation derived to identify the probability of one or both risk criterion occurring
12
ENTSO-E AISBL • Avenue de Cortenbergh 100 • 1000 Brussels • Belgium • Tel + 32 2 741 09 50 • Fax + 32 2 741 09 51 • info@entsoe.eu • www. entsoe.euÅpen informasjon / Public information
Frequency Based Emergency Disconnection Policy
Review for the Nordic Region
Identified Schemes
In order to determine the recommendations, varying different scenarios have been assessed. As a reference
case, the current implemented ULFS is also simulated (cases 1 and 2). The schemes evaluated include
varying connotations proposed by the ENTSO-E continental Europe study (ENTSO-E, 2014). As a further
benchmark, the study has included varying other UFLS schemes applied internationally by other TSO’s in
order to include other good practices that could be applied within the Nordics.
The schemes considered are found in the table 2 below. This list is not exhaustive of differing connotations
of the same scheme considered with marginally differing values and is included for reference only.
Table 2 Identified potential UFLS schemes considered
Frequency of a ctiva ting thres hol d
Scheme Country # Fa s t Thres hol ds
% of l oa d s hed per thres hol d
48.5 48.3 48.1 47.9 47.7 - Total
Denma rk n=5
10 10 10 10 10 - 50
48.8 48.6 48.4 48.2 48 -
Sweden n=5
UFLS Pl a n 1 (SOA defi ned 6 6 6 6 6 - 30
pl a n)* 48.5 48.3 - - - -
Fi nl a nd n=2
10 10 - 20
48.6 48.2 47.8 47.4 47 -
Norwa y n=5
6 6 6 6 6 - 30
48.5 48.3 48.1 47.9 47.7 -
Denma rk n=5
10 10 10 10 10 - 50
48.8 48.6 48.4 48.2 48 -
Sweden n=5
UFLS Pl a n 2 (SOA i n 4 4 4 4 4 - 20
rea l i ty)* 48.5 48.3 - - - -
Fi nl a nd n=2
10 10 - 20
48.7 48.5 48.3 48.1 >> 47.7
Norwa y n = 10
2 7 7 11 >> 3 38
ENTSO-E Pl a n 1 (0.15s 49 48.8 48.6 48.4 48.2 48
Al l n=6
del a y) 2 4 6 8 10 10 40
ENTSO-E Pl a n 2 (0.15s 49 48.7 48.4 48.2 - -
Al l n=4
del a y) 5 9 11 15 - - 40
48.5 @ 0.4s 48.5 @ 15s - -
Pl a n A (New Zea l a nd) Al l n=2
16 16 - - 32
49.5 49 48.85 48.5 48 -
Pl a n B (Aus tra l i a ) Al l n=5
10 10 10 10 10 - 50
48.8 48.75 48.7 48.6 >> 47.8
Pl a n C (UK) Al l n = 10
5 5 10 7.5 >> 5 65
48.85 48.8 48.75 48.7 >> 48.5
Pl a n D (Irel a nd) Al l n=8
5.9 6.4 5 7.4 >> 10.3 57.2
58.5 58.2 57.9 57.7 57.5 -
Pl a n E (Bra zi l South)** Al l n=5
7 7 7 7 7 - 35
57.8 57.1 56.5 55.5 55.2 -
Pl a n F (Bra zi l North)** Al l n=5
7 7 7 7 7 - 35
59.2 58.8 58.65 58.5 58.3 -
Pl a n G (Gua m)** Al l n=5
9 9 9 10 10 - 47
59.5 59.3 59.1 58.9 58.7 -
Pl a n I (Wes tern USA)** Al l n=5
5 5 5 5 5 - 25
49.2 49.1 49 48.8 >> 47.9
Pl a n J (South Afri ca ) Al l n =7
5 5 5 5 >> 10 49.9
49.4 49.2 49 48.8 48.6 -
Pl a n K (Li bya ) Al l n =5
10.6 8.7 11.1 10.7 13.2 - 54.3
* The scheme is not exhaustively described within this table and does not account for heat pump and
electric boiler disconnection.
** Scheme operates on a steady state frequency of 60 Hz, for the purposes of this study 10 Hz has been
subtracted
13
ENTSO-E AISBL • Avenue de Cortenbergh 100 • 1000 Brussels • Belgium • Tel + 32 2 741 09 50 • Fax + 32 2 741 09 51 • info@entsoe.eu • www. entsoe.euÅpen informasjon / Public information
Frequency Based Emergency Disconnection Policy
Review for the Nordic Region
Final Scheme Evaluation Criteria
As seen in the Figure 1; schemes that have been deemed as technically acceptable having been considered
against the varying criterion outlined in following chapters are then evaluated based on their ability to
maintain wider network integrity whilst minimising disconnection to consumers. These schemes are
compared based on their performance and practicality of implementation.
In order to provide a clear metric for the comparison of the reviewed schemes that are deemed feasible the
study has considered disconnected load (as a result of UFLS) on a staged and cumulative basis. This allows
a robust measure of each viable scheme. This may be used in later works to inform a Value of Lost Load
(VOLL) calculation should it be necessary. For clarity this study has not performed this calculation.
14
ENTSO-E AISBL • Avenue de Cortenbergh 100 • 1000 Brussels • Belgium • Tel + 32 2 741 09 50 • Fax + 32 2 741 09 51 • info@entsoe.eu • www. entsoe.euÅpen informasjon / Public information
Frequency Based Emergency Disconnection Policy
Review for the Nordic Region
4. Screening of Schemes - Frequency Stability
Overview
As stipulated in the study concept, there have been previous ENTSO-E UFLS studies for continental
Europe. This approach utilised a ‘lumped’ model to represent the wider electricity network within mainland
Europe. This model has merits, in that it can be used to screen preliminary study schemes prior to
progressing to more detailed studies which will use a more comprehensive power systems model.
As a result this study has utilized the Requirements for Automatic Reserves ‘RAR’ model as a basis for
UFLS scheme screening. The model comprises separate models for the Danish (eastern Denmark), Finnish,
Norwegian and Swedish governors involved in FNR and FDR. The HVDC connections in Denmark and
Finland, used in Frequency Control Normal Operation Reserve (FCR-N) and Frequency Control
Disturbance Reserve (FCR-D), are also included. This numerical model enables the characterisation of any
non-linearity in performance and assesses the relative risk of the loss of frequency stability to identify
viable UFLS schemes.
The risk of loss of frequency stability can be interpreted as the risk of frequency going below 47.5 Hz. This
is the point of disconnection of conventional thermal plant that would result in frequency collapse.
It is observed that the NordPool Spot has several bidding zones. As a result load could be shed in zones in
differing quantities. It is assumed that an even division is used initially for screening purposes, with further
studies informing the most appropriate distribution; the main requirement being to not increase the
probability of overload or frequency instability.
Given that RAR model has gone through significant development and evaluation (Nordic Analysis Group,
2011), this study report does not consider its functionality in great detail, more it is recognised as a useful
tool in the process. For clarity a schematic view of the lumped parameter model is found within Appendix
A.
Methodology
If a generation plant or an HVDC link suddenly trips, the balance between load and power infeed in the
Nordic system is disturbed. Immediately after this disturbance, rotating energy of the synchronously
rotating machines (both generators and motors) is converted into electrical energy. This leads to a reducing
speed of these generators and motors and consequently a decreases frequency in the Nordic system.
Assuming that automatic reserves are not sufficient to stop this trend, frequency would reduce until the
imbalance is compensated by the activation of UFLS. If this response is not sufficient, there is a high risk of
frequency collapse.
In the existing situation in the Nordic countries, FCR-D attempts to mitigate this frequency drop and
stabilize the frequency at steady state.
In order to evaluate the appropriateness of an associated scheme, it becomes necessary to instigate
disturbances that are sufficiently onerous that FCR-D is not sufficient to maintain frequency stability and
thus activate UFLS. To this end, varying levels of power loss were initiated to assess the UFLS schemes.
These losses were of the order of 1800, 2300, 2800, 3300, 3800, 4300, 4800, 5300, 5800, 6300 and
6900 MW with the total loss of production divided into equal three parts, 2nd and 3rd coming 10 and 20 sec
after the first one.
The loss of power infeed was separated in stages under the rationale that, should large scale disconnections
occur, the likelihood of simultaneous disconnection is remote, thus any form of associated occurrence
would occur in a cascaded form, where one disconnection stimulates the next. An example of this is seen in
Figure 3 where 6300 MW is disconnected in three 2100 MW blocks at time stamps: 5, 15 and 25s.
15
ENTSO-E AISBL • Avenue de Cortenbergh 100 • 1000 Brussels • Belgium • Tel + 32 2 741 09 50 • Fax + 32 2 741 09 51 • info@entsoe.eu • www. entsoe.euÅpen informasjon / Public information
Frequency Based Emergency Disconnection Policy
Review for the Nordic Region
Figure 3 Dynamic response from the loss of 6300 MW disconnected in three 2100 MW blocks at times 5, 15 and 25s
7000 50,4
6000 50,2
5000 50
4000 49,8
3000 49,6
2000 49,4
1000 49,2
0 49
0 10 20 30 40 50 60
-1000 48,8
-2000 48,6
-3000 48,4
Load shed (MW) Power lost (MW) Inertia response (MW)
FCR response (MW) Frequency (Hz)
Lumped Parameter Model Modifications and Assumptions
In using the Lumped Parameter (RAR) model for the assessment of the frequency stability element of the
screening study; whilst the model and the values have been well proven it is necessary to highlight any
specific differences to the model that have been made for completeness. The notable changes or
assumptions are:
‒ A phased disconnection of power infeed as deemed more realistic that in instantaneous common mode
failure thus for large scale loss of generation simulations, the disconnection is designed to occur over
three equal stages.
‒ In the initial RAR model, frequency dependence of load was 1%. This study has used the value 0.75%
as it equidistant to the values used in sensitivity analysis (the precise value in not known).
‒ The multi-run component of the model utilizes Samlast market simulation data for year 2025.
‒ The initial RAR model can be parametrized for 3 different loading/generation levels in the Nordics.
The model uses the parameters for load of 30,000 MW (the medium level).
‒ For a demand of 30,000 MW, inertia is calculated by multiplying the generation by 4 s. This gives the
minimum inertia of 90 GWs, average inertia of 170 GWs and maximum inertia of 250 GWs.
16
ENTSO-E AISBL • Avenue de Cortenbergh 100 • 1000 Brussels • Belgium • Tel + 32 2 741 09 50 • Fax + 32 2 741 09 51 • info@entsoe.eu • www. entsoe.euÅpen informasjon / Public information
Frequency Based Emergency Disconnection Policy
Review for the Nordic Region
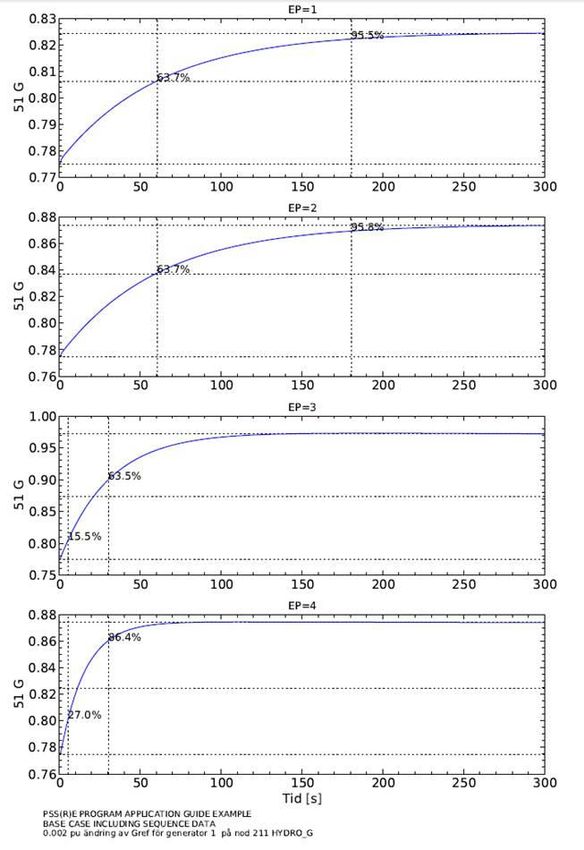
Lumped Model Results
In order to provide a clear comparison of each UFLS scheme, key results are presented in the following
section. Whilst this information is not exhaustive it provides the pertinent facts that needed to be
considered whilst screening for viable schemes. These key aspects are:
‒ Risk that the scheme will result in under frequency (i.e. less than 48.5 Hz)
‒ Risk that the scheme will result in over frequency (i.e. higher than 51 Hz)
‒ Absolute minimum frequency that the scheme reached during the 2860 simulations
‒ Absolute maximum frequency that the scheme reached during the 2860 simulations
‒ Average level of load disconnected during the simulations in MW
More detailed information from the simulations can be found in Appendix A.
Table 3 UFLS Cases comparing internationally implemented schemes
Number of simulated cases
A B C D E F G **) H **) I **) J **) K **)
2860 for each scheme
Risk Index (f51 Hz) 62 98 9 9 11 12 75 89 0 5 100
fmin, Hz 47.6 48.9 48.6 48.7 48.1 47.1 48.7 48.8 49 48.7 49
fmax, Hz 55.6 57.2 53 51.8 51.9 52.5 52.5 55.5 51 52.2 57
Average LS (MW) 4461 6323 2804 2999 2630 2091 4702 5452 4057 2787 6649
**) Load shedding activates above 49 Hz.
Table 3 Considers the internationally implemented UFLS schemes reviewed in the context of how they
would perform when applied to the Nordic Network. The above results assume the levels of FCR in the
RAR-model. Table 4 considers the same schemes but with a limited level of FCR contribution to the
network (max. 1800 MW4).
Of the internationally implemented schemes considered over 2860 simulations, it is clear that there are
some schemes that have a significant risk either under frequency, or more commonly, over frequency. Of
the schemes that had promising results, there are common themes; the most obvious being that the
magnitude of disconnection per stage was not particularly large in the initial stages of disconnection (of the
order of 5% per stage).
Schemes C and D had first stage activation at 48.8 and 48.85 Hz respectively which would be realistic
levels for this study. I and J had very early level of stage activation (49.5 and 49.2 when adjusted to a
50 Hz network). This level of activation would not be considered realistic within the Nordic network. The
schemes with earlier activation do result in a higher level of fmin (48.9 and 48.7 Hz), which is expected,
though the fmin values for schemes C and D are not that much lower than the early activation schemes (48.6
and 48.7 Hz).
The resulting conclusions based on this initial comparison would suggest that the relative size of initial
activation should not be more than around 5% of load on the basis that it increases the risk of over
frequency. This core principle is reinforced when considering a lower level on frequency support (as seen
in Table 4). In this instance schemes C and D also have more pronounced risk of over frequency, though
this is measured against the relative point of first stage activation.
4
This value includes the present obligation volumes of FCR-N and FCR-D specified in the System Operation
Agreement of the Nordic TSO’s.
17
ENTSO-E AISBL • Avenue de Cortenbergh 100 • 1000 Brussels • Belgium • Tel + 32 2 741 09 50 • Fax + 32 2 741 09 51 • info@entsoe.eu • www. entsoe.euÅpen informasjon / Public information
Frequency Based Emergency Disconnection Policy
Review for the Nordic Region
Table 4 UFLS Cases comparing internationally implemented schemes with realistic levels of FCR
Number of simulated cases
A B C D E F G **) H **) I **) J **) K **)
2860 for each scheme
Risk Index (f51 Hz) 91 98 32 34 47 62 75 90 1 15 100
fmin, Hz 47.5 48.9 48.6 48.7 47.9 46.5 48.7 48.8 48.9 48.7 49
fmax, Hz *) *) *) 53 52.9 54.5 *) *) 51.6 59.6 *)
Average LS (MW) 6633 7071 3833 3918 3909 3907 4735 5817 4091 3540 7031
*) Frequency in many cases continues to rise to unrealistic values, as no over frequency disconnection of generation
was considered.
**) Load shedding activates above 49 Hz.
Graphically the schemes are represented in figure 4. The bracketed ‘RAR’ suffix can be considered as
levels of FCR within the RAR model (optimistic). No suffix denotes levels of FCR consistent with SOA
requirements.
Figure 4 Risk of over frequency or under frequency based on international UFLS scheme
100
90
80
70
60
50
40
30
20
10
0
A B C D E F
G **) H **) I **) J **) K **)
Risk Index (f51 Hz)(RAR)
Risk Index (f51 Hz)
Table 5 presents the simulation results of various schemes considered in other ENTSO-E works (ENTSO-
E, 2014) as well as considers the current UFLS scheme prescribed within the SOA. As noted within
Chapter 3; there is a difference between the real implemented scheme and the UFLS scheme mandated
within the SOA. For completeness both variations are considered within this study.
18
ENTSO-E AISBL • Avenue de Cortenbergh 100 • 1000 Brussels • Belgium • Tel + 32 2 741 09 50 • Fax + 32 2 741 09 51 • info@entsoe.eu • www. entsoe.euÅpen informasjon / Public information
Frequency Based Emergency Disconnection Policy
Review for the Nordic Region
Table 5 UFLS Cases comparing ENTSO-E proposed schemes
4 stages
ENTSO-E, ENTSO-E,
ENTSO-E, ENTSO-E, 49, 48.8, 4 stages 4 stages 2 stages
Number of simulated cases SOA, Plan 2, 4 Plan 2, 4
SOA Plan 1, 6 Plan 2, 4 48.6, 48.4 48.8, 48.6, 48.5, 48.3, 49, 48.8 Hz
2860 for each scheme "real" stages, stages, 48.4 and 48.1 and (5% both)
stages stages Hz (5 %
30% 20% 48.2 Hz (5 47.9 Hz (5
each)
% each) % each)
Risk Index (f51 Hz) (RAR) 0 0 3 15 7 1 0 0 6 0
fmin, Hz 48.3 48.3 48.4 48.6 48.4 48.3 48.5 48.4 48.1 46.7
fmax, Hz 51.3 50.9 51.5 52.3 51.6 51.2 51 51.1 51.5 51
Average LS (MW) 2142 2882 2407 3183 2744 2302 3371 2496 2044 2641
Table 5 considers the listed ENTSO-E reviewed UFLS schemes in the context of how they would perform
when applied to the Nordic Network. The above results consider that levels of FCR are consistent with
stated levels within the SOA. As above, Table 6 considers the same schemes, but assumes a more realistic
level of FCR contribution to the network (less than 1800 MW5).
It is noted that, generally due to inherent characteristics of the Nordics, generally international
benchmarked schemes are likely to increase the risk of frequency instability (with the exception of the
Western USA) they are discounted from further analysis. It is noted that the 5 stage scheme adopted within
the Western States of the United States of America did perform well. Given its characteristics are similar in
stage and disconnection level to that of other ENTSO-E plans, this plan is not considered separately.
Table 6 UFLS Cases comparing ENTSO-E proposed schemes with FCR limited to mandatory levels of SOA.
4 stages
ENTSO-E, ENTSO-E,
ENTSO-E, ENTSO-E, 49, 48.8, 4 stages 4 stages 2 stages
Number of simulated cases SOA, Plan 2, 4 Plan 2, 4
SOA Plan 1, 6 Plan 2, 4 48.6, 48.4 48.8, 48.6, 48.5, 48.3, 49, 48.8 Hz
2860 for each scheme "real" stages, stages,
stages stages Hz (5 % 48.4 and 48.1 and (5% both)
30% 20%
each) 48.2 Hz (5 47.9 Hz (5
% each) % each)
Risk Index (f51 Hz) 5 4 16 31 22 15 10 12 25 8
fmin, Hz 48.2 48.2 48.3 48.4 48.3 48.2 48.5 48.3 48.1 42.2
fmax, Hz 51.5 51.4 52.7 53.3 52.9 52.7 51.9 51.9 52.7 51.6
Average LS (MW) 2831 2873 3124 3908 3425 3065 4083 3169 3003 3098
Commentary on the performance of each scheme found in table 5 and 6 is found in the section below.
5
This value has been identified following combined discussions with the all four Nordic TSO’s
19
ENTSO-E AISBL • Avenue de Cortenbergh 100 • 1000 Brussels • Belgium • Tel + 32 2 741 09 50 • Fax + 32 2 741 09 51 • info@entsoe.eu • www. entsoe.euÅpen informasjon / Public information
Frequency Based Emergency Disconnection Policy
Review for the Nordic Region
Figure 5 Percentage risk of over frequency or under frequency based on ENTSO-E UFLS schemes
90
80
70
60
50
40
30
20
10
0
SOA
SOA,
"real" ENTSO-E,
ENTSO-E,
Plan 1, 6 ENTSO-E,
Plan 2, 4
stages Plan 2, 4 ENTSO-E, 4 stages 49,
stages Plan 2, 4 4 stages
stages, 48.8, 48.6,
stages, 48.8, 48.6, 4 stages
30% 48.4 Hz (5 2 stages 49,
20% 48.4 and 48.5, 48.3,
% each) 48.1 and 48.8 Hz
Risk Index (f51 Hz) (RAR)
Risk Index (f51 Hz)
In Table 5 it is observed that both the UFLS scheme as defined by the SOA and the scheme that is
implemented within the Nordics have a reasonable probability of under frequency as a result of UFLS. The
associated risk is increased as the level of FCR is decreased as seen in Table 6. This suggests that the
scheme does not cut quickly or sufficiently to arrest the loss of system frequency. This is graphically
illustrated in figure 5
Figure 6 Impact of FCR Contribution to the SOA frequency performance
20
ENTSO-E AISBL • Avenue de Cortenbergh 100 • 1000 Brussels • Belgium • Tel + 32 2 741 09 50 • Fax + 32 2 741 09 51 • info@entsoe.eu • www. entsoe.euÅpen informasjon / Public information
Frequency Based Emergency Disconnection Policy
Review for the Nordic Region
In considering Figure 6 further; as can be seen for the currently implemented UFLS, during the initial
stages of generation disconnection, the FCR is capable of sustaining frequency stability thus the FCR levels
have limited impact. As the level of available FCR reduces in further disconnection stages the schemes
performance is not directly comparable as expected. For this reason it becomes necessary to take a
pragmatic view on the levels FCR available in the future.
In considering ENTSO-E Plan 1 over 6 stages; it is observed that whilst the risk of frequency instability is
low with larger FCR, as the FCR is reduced, the risk of both under and over frequency is increased. It is
further noted that the relative level of over frequency reached for this scheme under realistic FCR reserves
is around 52.7 Hz. Whilst this is not the highest level reached within the respective schemes, it is still
relatively high and any Over Frequency Control (OFC) scheme considered would have to be implemented
with such levels considered in order to minimise the risk of UFLS stimulating OFC and vice versa until
total loss of network stability is a realistic possibility.
ENTSO-E Plan 2 (over 4 stages) provides similar characteristics to that of Plan 1. The relative risk of over
frequency is higher and the level of over frequency is a notable concern (53.3 Hz). It is very likely any OFC
scheme implemented would have been activated at such levels. The likely reason for such levels of high
frequency is the relative quantity of load shed over the 4 stages; whilst stage 1 of the scheme cuts 5% of
load, further stages are considerably higher (9, 11 & 15). This magnitude of disconnection is likely to
instigate the high frequency characteristics which results in a total of 3908 MW shed in total. This is the
second highest loss of load of any of the schemes considered.
In the further iterations of ENTSO-E Plan 2 considered, three variations of the scheme were tested. The net
reductions in load by the schemes were 20%, 30% and 40% respectively. The first stage activation of the
schemes was at 49 Hz. It is noted that whilst the risk of under frequency is marginally increased, the risk of
over frequency is decreased as total shed load is reduced. Needless to say, as the level of FCR is reduced to
realistic levels, the risk of both over and under frequency is marginally increased.
Based on the principle that a 4 stage scheme that has a lower level of total disconnection would appear to
produce more advantageous results, 3 additional variations of this scheme were considered. The main
difference in the schemes is the point of first stage activation; one at 49 Hz, one at 48.4 Hz and one at
48.5 Hz. Of the three schemes, the first (activated at 49 Hz) had the lowest overall risk of over and under
frequency however it disconnects nearly 900 MW in load more in order to achieve this. The primary
reason for this is that, with the activation stage at 49 Hz, the scheme cuts early. This doesn’t seem to
provide a significant difference in risk when compared to the scheme with first stage activation at 48.8 Hz
and 3169 MW total disconnected (Realistic FCR). The scheme with first stage activation at 48.5 Hz has a
far higher risk of under and over frequency; this suggests that cutting this late does not present a realistic
option.
It is observed in Figure 7 that in reality, one of the largest contributing factors to the risk of frequency
deviation is the effective level of FCR available. As FCR decreases the level of frequency deviation
inevitably increases. For this reason any identified options have to be evaluated against this rationale, and
projected FCR levels. For completeness, the subsequent section on transmission capacity also considers
realistic and mandated levels of FCR.
21
ENTSO-E AISBL • Avenue de Cortenbergh 100 • 1000 Brussels • Belgium • Tel + 32 2 741 09 50 • Fax + 32 2 741 09 51 • info@entsoe.eu • www. entsoe.euYou can also read