2019 Air Quality Data Summary - September 2020 - Puget Sound Clean Air Agency
←
→
Page content transcription
If your browser does not render page correctly, please read the page content below
1904 Third Avenue, Suite 105
                  Seattle, Washington 98101
                  www.pscleanair.gov

      2019
  Air Quality
Data Summary

 September 2020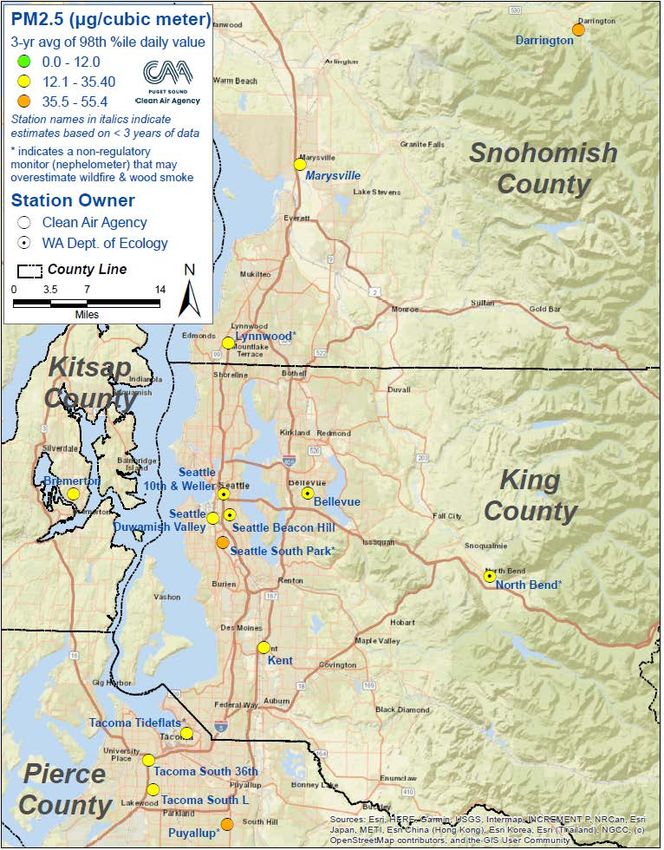
2019 Air Quality Data Summary

                                                                                                       Table of Contents
Table of Contents ........................................................................................................................................................................................................................................... ii
List of Figures ......................................................................................................................................................................................................................................................iii
List of Maps .......................................................................................................................................................................................................................................................... iv
List of Tables ....................................................................................................................................................................................................................................................... iv
Appendix – Data Tables ..........................................................................................................................................................................................................................v
Executive Summary ...................................................................................................................................................................................................................................... 1
Monitoring Network ......................................................................................................................................................................................................................................2
Air Quality Index............................................................................................................................................................................................................................................... 8
Particulate Matter ........................................................................................................................................................................................................................................10
   PM10 .........................................................................................................................................................................................................................................................................10
   PM2.5 Health and Environmental Effects .......................................................................................................................................................................10
   Ultrafine Particulate Matter (UFP) ........................................................................................................................................................................................10
   PM2.5: Federal Reference Method and Continuous Methods ..................................................................................................................11
   PM2.5 Daily Federal Standard and Health Goal........................................................................................................................................................11
   PM2.5 Annual Federal Standard ...............................................................................................................................................................................................18
   PM2.5 Continuous Data and Seasonal Variability ............................................................................................................................................. 23
   PM10: Annual Standard and Modeled Concentrations ............................................................................................................................... 23
Particulate Matter – PM2.5 Speciation and Aethalometers ........................................................................................................................... 25
   Speciation Monitoring and Source Apportionment ..................................................................................................................................... 25
   Aethalometer Data............................................................................................................................................................................................................................26
Ozone .......................................................................................................................................................................................................................................................................28
Nitrogen Dioxide........................................................................................................................................................................................................................................... 32
Carbon Monoxide.......................................................................................................................................................................................................................................34
Sulfur Dioxide ...................................................................................................................................................................................................................................................35
Lead.............................................................................................................................................................................................................................................................................37
Visibility...................................................................................................................................................................................................................................................................38
Air Toxics ...............................................................................................................................................................................................................................................................40
   Relative ranking based on cancer risk & unit risk factors......................................................................................................................40
   Health effects other than cancer .....................................................................................................................................................................................44
   Air toxics trends .....................................................................................................................................................................................................................................44
Definitions............................................................................................................................................................................................................................................................59
   General Definitions ............................................................................................................................................................................................................................59

Table of Contents                                                                                                                                                                                                                                    Page ii
2019 Air Quality Data Summary

                                                                                                List of Figures
Figure 1: Days Exceeding the PM2.5 Health Goal at One or More Monitoring Sites.............................................................. 12
Figure 2: Daily PM2.5 Design Values for King County ..............................................................................................................................................14
Figure 3: Daily PM2.5 Design Values for King County with wildfire-impacted days removed.................................14
Figure 4: Daily PM2.5 Design Values for Kitsap County.........................................................................................................................................15
Figure 5: Daily PM2.5 Design Values for Kitsap County with wildfire-impacted days removed ........................... 15
Figure 6: Daily PM2.5 Design Values for Pierce County ........................................................................................................................................16
Figure 7: Daily PM2.5 Design Values for Pierce County with wildfire-impacted days removed ............................16
Figure 8: Daily PM2.5 Design Values for Snohomish County .......................................................................................................................... 17
Figure 9: Daily PM2.5 Design Values for Snohomish County with wildfire-impacted days removed ............. 17
Figure 10: Annual PM2.5 Design Values for King County ......................................................................................................................................18
Figure 11: Annual PM2.5 Design Values for King County with wildfire-impacted days removed........................... 19
Figure 12: Annual PM2.5 Design Values for Kitsap County .................................................................................................................................19
Figure 13: Annual PM2.5 Design Values for Kitsap County with wildfire-impacted days removed.................. 20
Figure 14: Annual PM2.5 Design Values for Pierce County ............................................................................................................................... 20
Figure 15: Annual PM2.5 Design Values for Pierce County with wildfire-impacted days removed ................... 21
Figure 16: Annual PM2.5 Design Values for Snohomish County .................................................................................................................. 21
Figure 17: Annual PM2.5 Design Values for Snohomish County with wildfire-impacted days removed.... 22
Figure 18: Annual PM2.5 Black Carbon ....................................................................................................................................................................................27
Figure 19: Ozone for Puget Sound Region .........................................................................................................................................................................31
Figure 20: Ozone for Puget Sound Region with wildfire impacted days removed ............................................................ 31
Figure 21: Nitrogen Dioxide (NO2) (1998-2005) and Reactive Nitrogen (NOy – NO) (2007-Present) for the
     Puget Sound Region ................................................................................................................................................................................................................... 33
Figure 22: Sulfur Dioxide (SO2) 1-Hour Maximum Concentrations (3-Year Average of the 99th
     Percentile) for the Puget Sound Region...............................................................................................................................................................36
Figure 23: Puget Sound Visibility ............................................................................................................................................................................................... 39
Figure 24: County-wise Visibility ............................................................................................................................................................................................... 39
Figure 25: National ethylene oxide comparison from October 2018 to March 2019 ........................................................ 46
Figure 26: Formaldehyde Annual Average Potential Cancer Risk at Beacon Hill, 2000-2019 .............................. 47
Figure 27: Carbon Tetrachloride Annual Average Potential Cancer Risk at Beacon Hill, 2000-2019 ............. 48
Figure 28: Benzene Annual Average Potential Cancer Risk at Beacon Hill, 2000-2019 ................................................ 49
Figure 29: Chloroform Annual Average Potential Cancer Risk at Beacon Hill, 2000-2019 ....................................... 50
Figure 30: Hexavalent Chromium Annual Average Potential Cancer Risk at Beacon Hill, 2005-2013.......... 51
Figure 31: Arsenic Annual Average Potential Cancer Risk at Beacon Hill, 2003-2019 ..................................................... 52
Figure 32: Acetaldehyde Annual Average Potential Cancer Risk at Beacon Hill, 2000-2019 ................................ 53
Figure 33: Ethylene Dichloride Annual Average Potential Cancer Risk at Beacon Hill, 2014-2019.................... 54
Figure 34: 1,3-Butadiene Annual Average Potential Cancer Risk at Beacon Hill, 2000-2019 .................................. 55
Figure 35: Naphthalene Annual Average Potential Cancer Risk at Beacon Hill, 2008-2019................................... 56
Figure 36: Ethylbenzene Annual Average Potential Cancer Risk at Beacon Hill, 2007-2019 ................................... 57
Figure 37: Cadmium Annual Average Potential Cancer Risk at Beacon Hill, 2003-2019 ............................................. 58

Table of Contents                                                                                                                                                                                                   Page iii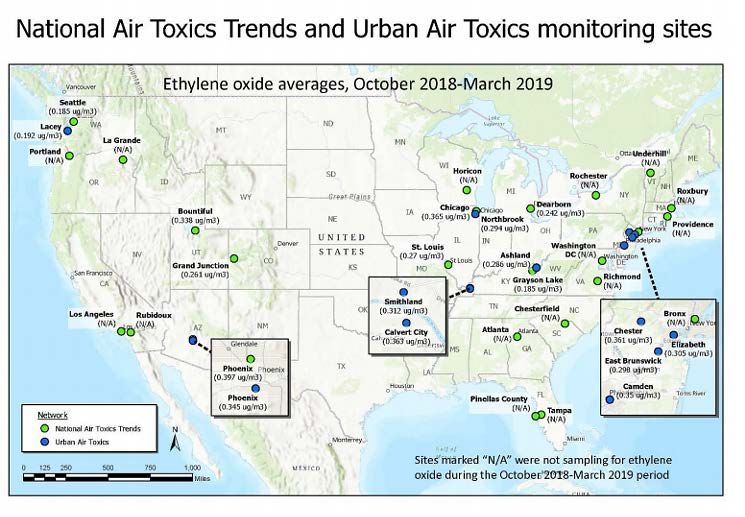
2019 Air Quality Data Summary

                                                                                       List of Maps
Map 1: Active Air Quality Monitoring Station Locations in 2019 ...................................................................................................................3
Map 2: The 98th Percentile 3-Year Average Daily PM2.5 Concentrations for 2019 ............................................................... 13
Map 3: Ozone 3-year Average of 4th Highest 8-hr Value for 2019 ..................................................................................................... 29

                                                                                     List of Tables
Table 1: Air Quality Monitoring Network Parameters 2019 ................................................................................................................................. 4
Table 2: Air Quality Index (AQI) Ratings for 2019 ........................................................................................................................................................... 9
Table 3: Five-year DVs for PM10 concentrations for 2019 ................................................................................................................................. 24
Table 4: 2019 Beacon Hill Air Toxics Ranking .................................................................................................................................................................. 42
Table 5: 2019 Calculation and Breakpoints for the Air Quality Index (AQI) ................................................................................. 59

Table of Contents                                                                                                                                                                          Page iv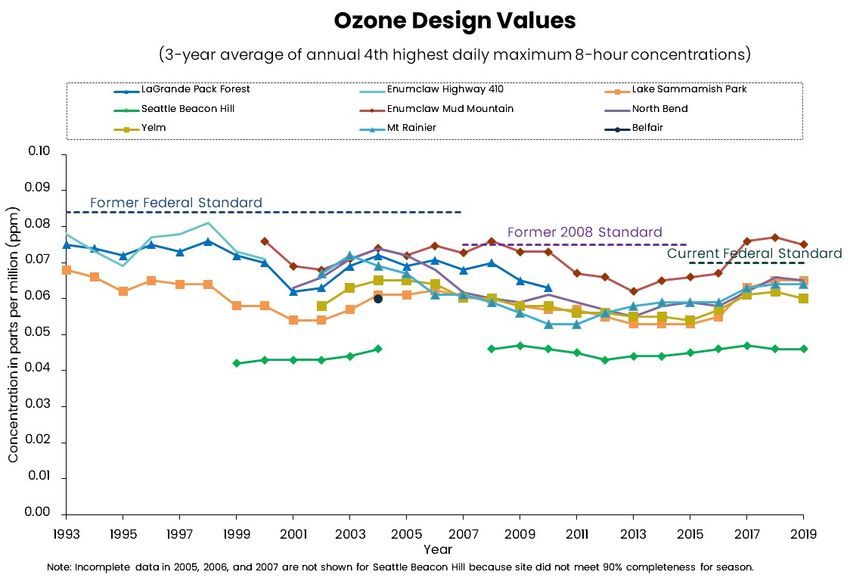
2019 Air Quality Data Summary

                                                                                  Appendix – Data Tables
Monitoring Methods Used from 1999 to 2019 in the Puget Sound air shed ............................................................................. A-2
Historical Air Quality Monitoring Network ..................................................................................................................................................................... A-3
Burn Bans 1988-2019..............................................................................................................................................................................................................................A-8
Particulate Matter (PM2.5) – Federal Reference Method ............................................................................................................................. A-10
Particulate Matter (PM2.5) – Federal Equivalent Methods ........................................................................................................................... A-11
Particulate Matter (PM2.5) – Continuous Nephelometer Sampling Method..........................................................................A-12
PM2.5 Speciation Analytes Monitored in 2019 .............................................................................................................................................................A-13
PM2.5 Black Carbon................................................................................................................................................................................................................................. A-14
Ozone (8-hour concentration)............................................................................................................................................................................................... A-15
2019 Beacon Hill Air Toxics Statistical Summary for Air Toxics ............................................................................................................ A-16
2019 Air Toxics Unit Risk Factors...............................................................................................................................................................................................A-17
2019 Beacon Hill Potential Cancer Risk Estimates, per 1,000,000, 95th Percentile ............................................................ A-18
2019 Non-cancer Reference Concentrations (RfC) and Hazard Indices >1 .......................................................................... A-19
Air Toxics Trends Statistical Summary ........................................................................................................................................................................A-20
Air Quality Standards and Health Goals.......................................................................................................................................................................A-21

Table of Contents                                                                                                                                                                                                            Page v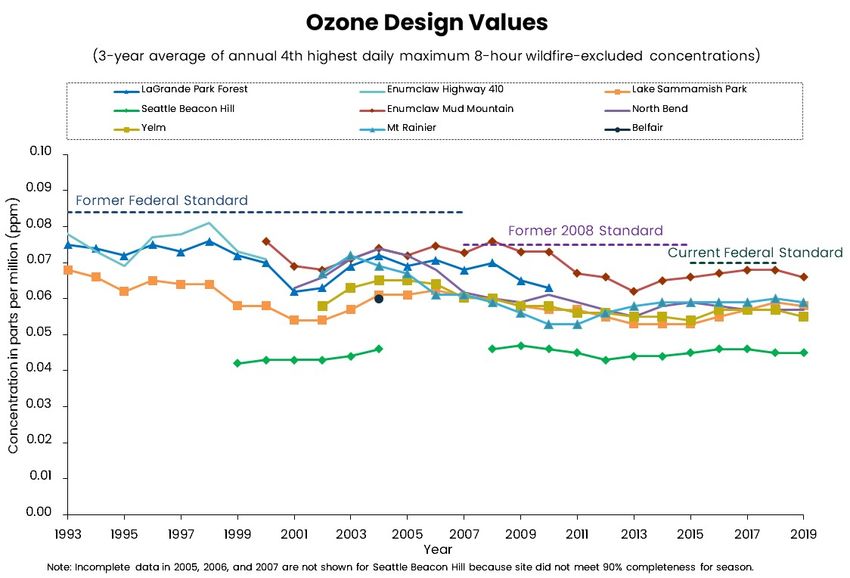
2019 Air Quality Data Summary

The 2019 Air Quality Data Summary is available for viewing or download on the internet at:

                                   www.pscleanair.gov

     Links to additional documents for download are also available at the web site.

      This material is available in alternate formats for people with disabilities.
      Please call Joanna Cruse at 206-689-4067

                                                                                      Page v
2019 Air Quality Data Summary

                                                Executive Summary
The Puget Sound Clean Air Agency (the Agency) summarizes air quality data from our core
monitoring network every year. This report summarizes regional air quality by presenting air quality
monitoring results for six criteria air pollutants and air toxics. The U.S. Environmental Protection
Agency (EPA) sets national ambient air quality standards (NAAQS) for the criteria pollutants. The
criteria pollutants are:

     •    Particulate Matter (particles 10 micrometers and smaller [PM10] and 2.5 micrometers and smaller
          in diameter [PM2.5])
     •    Ozone
     •    Nitrogen Dioxide
     •    Carbon Monoxide
     •    Sulfur Dioxide
     •    Lead (monitoring discontinued due to very low levels)

Air toxics are defined by Washington State and the Agency to include hundreds of chemicals and
compounds that are associated with a broad range of adverse health effects, including cancer. 1
Many air toxics are a component of either particulate matter or volatile organic compounds (a
precursor to ozone). The Air Quality Index (AQI) 2 is a nationwide reporting standard for the criteria
pollutants. The AQI is used to relate air quality levels to health effects in a simplified way, and is
intended mainly for forecasting and real-time communication. “Good” AQI days continued to
dominate our air quality in 2019. However, air quality degraded into “moderate” and “unhealthy for
sensitive groups” for brief periods.

The Agency and the Washington State Department of Ecology (Ecology) work together to monitor air
quality within the Puget Sound region. The Agency’s jurisdiction includes King, Kitsap, Pierce, and
Snohomish Counties. Real-time air monitoring data are available for pollutants at
www.pscleanair.gov/157/Request-Air-Quality-Data.
To receive the Agency's most updated news and stay current on air quality issues in King, Kitsap,
Pierce and Snohomish counties, visit www.pscleanair.gov/258/Connect-With-Us and select your
favorite news feed method. Friends and subscribers receive the latest on air quality news and
updates on projects in the Puget Sound region. You can also find us on Facebook and Twitter.

Data included in this report are for our core monitoring network. We also perform local, seasonal
monitoring studies – you can see reports on these study results at the library on our website at
www.pscleanair.gov.

1
    Washington Administrative Code 173-460. See Table of Toxic Air Pollutants, WAC 173-460-150.
    apps.leg.wa.gov/WAC/default.aspx?cite=173-460-150
2
    https://www.airnow.gov/aqi/aqi-basics/

Executive Summary                                                                                 Page 1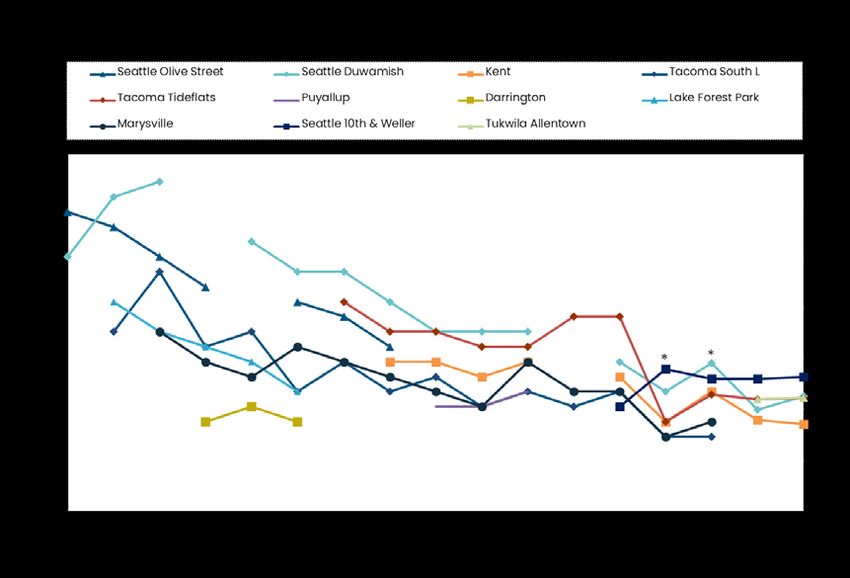
2019 Air Quality Data Summary

Over the last two decades, many pollutant levels have declined, and air quality has improved overall.
In 2019, the overall air quality remained good, continuing the trend of improvement, though we still
face challenges. Elevated fine particle levels (PM2.5) pose the greatest air quality challenge in our
jurisdiction. While fine particle levels met the U.S. Environmental Protection Agency’s (EPA’s) health-
based standard of 35 micrograms per cubic meter in 2019 when days with wildfire smoke are
excluded, the Agency’s more stringent local PM2.5 health goal of 25 micrograms per cubic meter was
exceeded on 22 days which were in winter months at various sites.

Ozone levels remain a concern in our region. The Enumclaw Mud Mountain monitor has the highest
regional ozone concentrations, at levels above the revised 2015 federal standard.

Some air toxics were measured at levels known to cause adverse health effects. These health effects
include, but are not limited to, increased cancer risk, respiratory effects, and developmental effects.

Overall, the air quality in Puget Sound region has remained good in 2019 with the continuing
improvement in meeting the standards. There were no wildfire-impacted days in the year which
helped in maintaining the good air quality in the region. Increasingly, our air quality monitoring
program is moving towards continuous data which provides better temporal and seasonal
variability. We are also undertaking local, short-term studies that inform on a local scale what air
quality is like in communities with specific impacts (for example, communities located near major
roadways).

                                     Monitoring Network

The Puget Sound Clean Air Agency (the Agency) and the Washington State Department of Ecology
(Ecology) operated the monitoring network within the Agency’s jurisdiction of King, Kitsap, Pierce, and
Snohomish Counties in 2019. The network is comprised of meteorological and pollutant-specific
monitors, as well as instruments dedicated to special studies. Data from the network are normally
collected automatically via Ecology’s data network, or in some cases, collected manually by field
staff. Monitoring stations are located in a variety of geographic locations in the Puget Sound region.
Monitors are sited according to EPA criteria to ensure a consistent and representative picture of air
quality.

Map 1 and Table 1 show King, Kitsap, Pierce, and Snohomish County monitoring sites used in 2019. An
interactive map is available at www.pscleanair.gov/NetworkMap.

Executive Summary                                                                           Page 2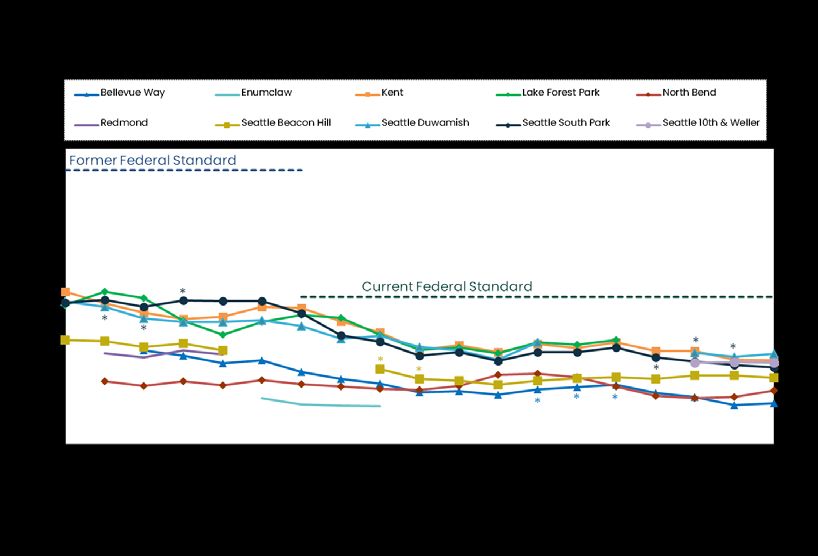
2019 Air Quality Data Summary

Map 1: Active Air Quality Monitoring Station Locations in 2019

Monitoring Network                                                           Page 3
2019 Air Quality Data Summary
Table 1: Air Quality Monitoring Network Parameters 2019
Station PM2.5
Location O3 SO2 NOY CO bsp Wind Temp AT Vsby Location
ID Ref Spec FEM ls bc
BK 10th & Weller, Seattle a
BL 11675 44th Ave S, Tukwila Allentown b, e, f
BW Beacon Hill, 15th S & Charlestown, Seattle b, d, f
CE Duwamish, 4700 E Marginal Way S, Seattle a, e
CW James St & Central Ave, Kent b, d
DB 17171 Bothell Way NE, Lake Forest Park b, d, f
DD South Park, 8201 10th Ave S, Seattle b, e, f
DF 30525 SE Mud Mountain Road, Enumclaw c
DG 42404 SE North Bend Way, North Bend c, d, f
DN 20050 SE 56th, Lake Sammamish State Park, Issaquah b, d
EQ Tacoma Tideflats, 2301 Alexander Ave a, e
ER South Hill, 9616 128th St E, Puyallup b, f
ES 7802 South L St, Tacoma b, f
Tacoma Indian Hill, 5225 Tower Drive NE, northeast
FF b, f
Tacoma
FG Mt Rainier National Park, Jackson Visitor Center c
IG Marysville JHS, 1605 7th St, Marysville b, d
II 6120 212th St SW, Lynnwood b, d
IK 14310 SE 12th St, Bellevue a, d
Monitoring Network Page 42019 Air Quality Data Summary
Station PM2.5
Location O3 SO2 NOY CO bsp Wind Temp AT Vsby Location
ID Ref Spec FEM ls bc
JO Darrington High School, Darrington 1085 Fir St d, f
PA 1802 S 36th St, Tacoma a, f
QK Spruce, 3250 Spruce Ave, Bremerton b, f
RV Yelm N Pacific Road, 931 Northern Pacific Rd SE, Yelm c,f
TC M St SE, Auburn b, f
Monitoring Network Page 52019 Air Quality Data Summary
Station operated by Ecology SO2 Sulfur Dioxide
Indicates parameter currently monitored NOy Nitrogen Oxides
PM2.5 ref Particulate matter2019 Air Quality Data Summary Page A-2 of the Appendix shows a list of the methods used for monitoring the criteria pollutants. Additional information on these methods is available at EPA’s website at epa.gov/ttn/amtic/. Information on air toxics monitoring methods is available at epa.gov/ttn/amtic/airtox.html. The Agency has been conducting air quality monitoring as early as 1965. A summary of the monitoring stations and parameters used over the history of the program is on page A-3 of the Appendix. The network changes periodically because the Agency and Ecology regularly re-evaluate monitoring objectives, resources, and logistics. Air Quality Index Page 7
2019 Air Quality Data Summary

                                        Air Quality Index

EPA established the air quality index (AQI) as a simplified tool for communicating daily air quality
forecasts and near real-time information. It is intended to help people plan their daily activities. The
AQI indicates how clean or polluted air is and what associated health effects might be a concern. It
focuses on health effects that may be experienced within a few hours or days after breathing
polluted air. EPA calculates the AQI for five major air pollutants regulated by the Clean Air Act:
ground-level ozone, particle pollution (also known as particulate matter or PM), carbon monoxide,
sulfur dioxide, and nitrogen dioxide.

EPA mainly developed the AQI as a daily indicator or forecast of air quality. To view the real-time AQI
for your area, visit http://www.airnow.gov. For more information about local air quality, visit
www.pscleanair.gov/27/Air-Quality.

A higher AQI indicates higher levels of air pollution and greater health concern. An AQI value of 100
generally corresponds to the national air quality standard for the pollutant, which is the level EPA has
set to protect public health. It’s important to note that health effects can be experienced even at
“good” or “moderate” levels.

The purpose of the AQI is to help people understand what local air quality means to health. To make it
easier to understand, the AQI is divided into six categories:

          Air Quality Index
                                       Levels of Health Concern                    Colors
            (AQI) Values

           When the AQI is:             …air quality condition is:           …look for this color:

                    0 – 50                       Good                              Green

                51 – 100                       Moderate                            Yellow

               101 – 150            Unhealthy for Sensitive Groups                 Orange

               151 – 200                       Unhealthy                             Red

               201 – 300                    Very Unhealthy                         Purple

               301 - 500                      Hazardous                           Maroon

Table 2 shows the percentage of days in each AQI category by county for 2019. The maximum AQI
value from all of our network monitors in a county determines its AQI category for the day. Most days
were in the “Good” air quality category, some “Moderate” days, and three days that were “Unhealthy
for Sensitive Groups”. See the appendix for more information on the AQI.

Air Quality Index                                                                             Page 8
2019 Air Quality Data Summary
Table 2: Air Quality Index (AQI) Ratings for 2019
AQI Rating (% of year)
Unhealthy for Highest
County Good Moderate Sensitive Groups Unhealthy AQI
King 76.7% 23.3% 0% 0% 90
Kitsap 99.5% 0.5% 0% 0% 75
Pierce 78.4% 21.1% 0.5% 0% 134
Snohomish 74.5% 25.2% 0.3% 0% 105
Air Quality Index Page 92019 Air Quality Data Summary
Particulate Matter
"Particulate matter," also known as particle pollution or PM, is a complex mixture of extremely small
particles and liquid droplets. Particle pollution consists of several components, including acids (such
as nitrates and sulfates), organic chemicals, metals, and soil or dust particles. PM can be categorized
into three broad classes based on size: Coarse—with a diameter of 10 µm or less (PM10); Fine—with a
diameter of 2.5 µm or less (PM2.5) and Ultrafine—with a diameter of less than 0.1 µm (UFP).
PM10
PM10 is particulate matter with a diameter of 10 micrometers (or microns) or less. These particles can
include larger particles like dust, and smaller particles (PM2.5) that come mainly from combustion
sources. Studies show that the finer PM2.5 particles have more significant health risks. With levels well
below the federal standard for years, the Agency ceased direct PM10 monitoring in 2006. For a historic
look at the PM10 levels in the Puget Sound Region, please request a copy of the 2007 data summary,
pages 32-35. 3
PM2.5 Health and Environmental Effects
PM2.5 (or fine particulate matter) has a diameter of 2.5 microns or less. An extensive body of scientific
evidence shows that exposure to particle pollution is linked to a variety of significant health
problems, such as increased hospital admissions and emergency department visits for
cardiovascular and respiratory problems, heart attacks and premature death. Older adults, children,
pregnant women, and those with pre-existing health conditions are more at risk from exposure to
particle pollution. Particle pollution also reduces visibility in cities and some of our nation’s most
treasured national parks.
Fine particles are emitted directly from a variety of sources, including wood burning (both outside,
and in wood stoves and fireplaces), vehicles and industry. They also form when gases from some of
these same sources react in the atmosphere.
Ultrafine Particulate Matter (UFP)
Emerging health studies indicate that very tiny ultrafine particles with a diameter of 0.1 micron and
less may be linked with negative health effects. Currently, there are no health-based standards on
what a healthy level of ultrafine particles is. We are exploring new methods for measuring and
assessing ultrafine particles, but this technology is not yet ready to add to our core monitoring
network.
3
To request a document, please visit www.pscleanair.gov/272/2396/Records-Request
Particulate Matter – PM2.5 Page 102019 Air Quality Data Summary
PM2.5: Federal Reference Method and Continuous Methods
Fine particulate matter (PM2.5) is measured using a variety of methods to ensure quality and
consistency. EPA has defined a filter-based method as the federal reference method (FRM)—the
primary method used to determine PM2.5 concentrations. EPA further defined several federal
equivalent methods (FEM), which are continuous instruments operated under specific standard
operating procedures. The main advantage of continuous FEMs is to provide PM concentrations at a
higher temporal resolution (hourly averages) compare to the FRM (24-hour averages).
The Agency uses the FRM, FEMs, and a nephelometer estimation method to provide data. These
methods determine fine particulate matter concentrations differently:
• The FRM involves pulling in air (at a given flow rate) for a 24-hour period and collecting
particles with a diameter of 2.5 microns or smaller on a filter. The filter is weighed, and the
mass is divided by air volume (determined from flow rate and amount of time) to provide
concentration. Particles on the filter can later be analyzed for more information about the
types of particulate matter.
• There are now three different FEM instruments used in the network: (1) The tapered element
oscillating microbalance-filter dynamic measurement system (TEOM-FDMS), (2) The TEOM
1405F, a newer model that replaced the TEOM-FDMS, and (3) The Met-One BAM, a beta
attenuation monitor which uses the attenuation of beta radiation to assess the PM2.5 mass on
a filter tape.
• The nephelometer measures the scattering of light in a photomultiplier tube; its results are
then compared to FRM and FEM method data to produce an estimate of PM2.5. While light
scattering has been proven to correlate well with direct PM2.5 measurements, this is an
“unofficial” method because it does not measure particle mass directly.
The Agency and Ecology work together on quality assurance to ensure the FEM-generated data are
directly comparable to those generated by the reference method.
PM2.5 Daily Federal Standard and Health Goal
The EPA set a daily health-based fine particle standard of 35 micrograms per cubic meter (µg/m3). All
monitors in our four counties reported values below this standard in 2019. In addition to the federal
standard, our Board of Directors adopted a more stringent health goal of 25 µg/m3 in 1999, based on
recommendations from our Particulate Matter Health Committee. Monitors in King, Kitsap, Pierce and
Snohomish Counties exceeded the local health goal of 25 µg/m3 on 22 days which were during winter
months in 2019.
Figure 1 shows the number of days the health goal was exceeded annually in the region, from 2000 to
2019. Our highest fine particulate days overwhelmingly take place during the winter wood heating
months, when our region exceeded the health goal. However, we have made progress reducing the
number of days exceeding the health goal to zero during summer months in 2019.
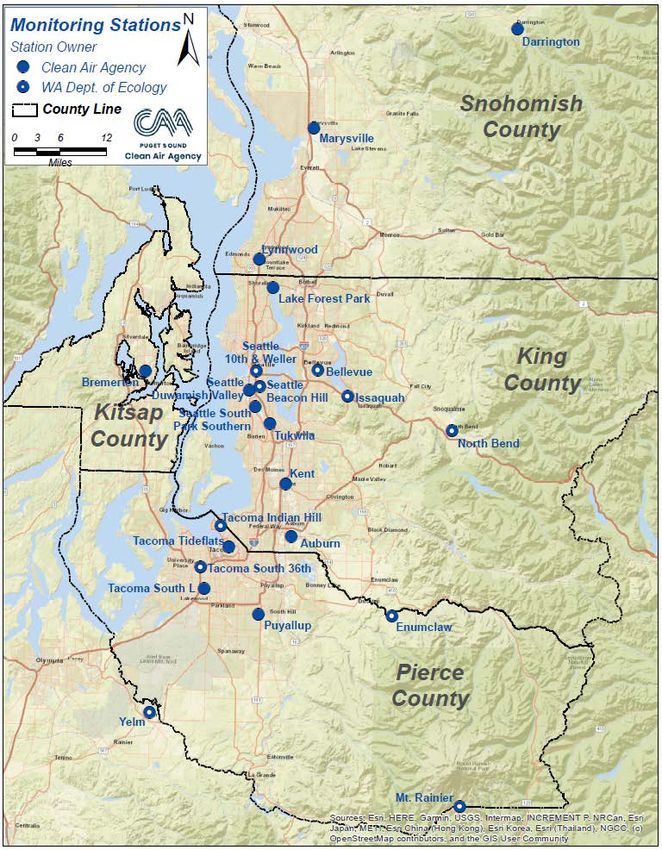
Particulate Matter – PM2.5 Page 112019 Air Quality Data Summary Figure 1: Days Exceeding the PM2.5 Health Goal at One or More Monitoring Sites Map 2 shows the 98th percentile of the 3-year average of daily PM2.5 concentrations from 2017 to 2019. This map incorporates data collected from federal reference, federal equivalent, and nephelometer estimation methods. The monitoring sites with less than three years of complete data from 2017 to 2019 have been marked in italics. Particulate Matter – PM2.5 Page 12
2019 Air Quality Data Summary

Map 2: The 98th Percentile 3-Year Average Daily PM2.5 Concentrations for 2019

Particulate Matter – PM2.5                                                      Page 13
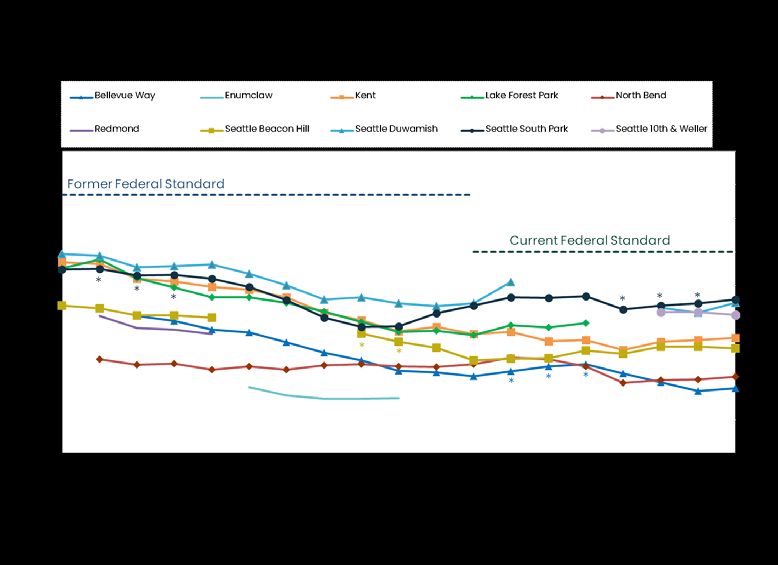
2019 Air Quality Data Summary

Figures 2 through 9 show daily 98th percentile 3-year averages at each monitoring station in King,
Kitsap, Pierce, and Snohomish Counties compared to the current daily federal standard. Points on the
graphs represent averages for three consecutive years. For example, the value for 2019 is the
average of the 98th percentile daily concentration for 2017, 2018, and 2019. These figures incorporate
data collected from federal reference, federal equivalent, and nephelometer estimation methods.
For each county, we include two figures: the first shows the entire dataset, and the second shows
levels with wildfire smoke-impacted days removed in 2017 and 2018. The EPA allows data from days
that were influenced by exceptional events that are beyond the ability of air agencies to control,
such as wildfires or dust storms, to be excluded from regulatory calculations. There were no wildfire-
impacted days in 2019. With wildfire smoke-impacted days excluded from 2017 and 2018, all monitors
in our four counties fall below the federal standard of 35 µg/m3. Without excluding wildfire smoke-
impacted days, monitors in King, Pierce and Snohomish Counties equaled or exceeded the standard
in 2019.

Figures 4 and 5 do not show any 2012-2014 data for Kitsap County because the Bremerton monitoring
site moved to a new location and design values could not be computed until three complete years of
data were collected at the new site. Statistical summaries for 98th percentile daily concentrations for
2018 data are provided on pages A-9 through A-11 of the Appendix.

Figure 2: Daily PM2.5 Design Values for King County

Figure 3: Daily PM2.5 Design Values for King County with wildfire-impacted days removed

Particulate Matter – PM2.5                                                                  Page 14
2019 Air Quality Data Summary

Figure 4: Daily PM2.5 Design Values for Kitsap County

Figure 5: Daily PM2.5 Design Values for Kitsap County with wildfire-impacted days removed

Particulate Matter – PM2.5                                                            Page 15
2019 Air Quality Data Summary

Figure 6: Daily PM2.5 Design Values for Pierce County

Figure 7: Daily PM2.5 Design Values for Pierce County with wildfire-impacted days removed

Particulate Matter – PM2.5                                                            Page 16
2019 Air Quality Data Summary

Figure 8: Daily PM2.5 Design Values for Snohomish County

Figure 9: Daily PM2.5 Design Values for Snohomish County with wildfire-impacted days removed

Particulate Matter – PM2.5                                                          Page 17
2019 Air Quality Data Summary

                                PM2.5 Annual Federal Standard
Figures 10 through 17 present 3-year average of annual concentrations at each monitoring station for
King, Kitsap, Pierce, and Snohomish Counties. In 2012, the EPA strengthened the annual standard from
15 µg/m3 to 12 µg/m3. All counties have levels below the 12 µg/m3 annual standard. Figures 12 and 13 do
not show any 2012-2014 data for Kitsap County because the Bremerton monitoring site moved to a
new location and design values could not be computed until three complete years of data were
collected at the new site

Figures 10 through 17 include data from the federal reference method (FRM) and continuous method
monitors. The federal standard is based on a 3-year average, and each value on the graph is an
average of the current year and the two prior years. For example, the value shown for 2019 is the
average of the annual averages for 2017, 2018, and 2019. As with the daily standard, for each county
we include two figures: the first shows the entire dataset, and the second shows levels with wildfire
smoke-impacted days removed in 2017 and 2018.

Figure 10: Annual PM2.5 Design Values for King County

Particulate Matter – PM2.5                                                                  Page 18
2019 Air Quality Data Summary Figure 11: Annual PM2.5 Design Values for King County with wildfire-impacted days removed Figure 12: Annual PM2.5 Design Values for Kitsap County Particulate Matter – PM2.5 Page 19
2019 Air Quality Data Summary

Figure 13: Annual PM2.5 Design Values for Kitsap County with wildfire-impacted days removed

Figure 14: Annual PM2.5 Design Values for Pierce County

Particulate Matter – PM2.5                                                           Page 20
2019 Air Quality Data Summary

Figure 15: Annual PM2.5 Design Values for Pierce County with wildfire-impacted days removed

Figure 16: Annual PM2.5 Design Values for Snohomish County

Particulate Matter – PM2.5                                                           Page 21
2019 Air Quality Data Summary

Figure 17: Annual PM2.5 Design Values for Snohomish County with wildfire-impacted days removed

Particulate Matter – PM2.5                                                          Page 22
2019 Air Quality Data Summary

                              PM2.5 Continuous Data and Seasonal Variability
Continuous monitoring data provide information on how PM2.5 levels vary throughout the year. For
example, many sites have elevated PM2.5 levels during the winter when residential wood burning and
air stagnations are at their peak but have low levels of PM2.5 during the summer. A summary of the
continuous data for PM2.5, black carbon and ozone for the year 2019 is available at
https://pscleanair.gov/615/Data-Summary. For more detailed information on continuous data, please
see the Air Graphing tool at https://secure.pscleanair.org/airgraphing to plot the sites and
timeframes of interest.

                          PM10: Annual Standard and Modeled Concentrations
Our region was nonattainment for PM10 in 1987 in the three industrial areas of Puget Sound: Seattle
Duwamish Valley, Tacoma Tideflats, and Kent. The streets were paved, and the area saw significant
reductions thereafter and levels were far below the standard since. While the direct monitoring of
PM10 concentrations ended in 2007, we can still model recent concentration levels of PM10 using the
observed PM2.5 concentrations and two site-dependent linear relationships (one for summer (Apr-
Sep) and one for winter (Oct-Mar)). These relationships were established for the 1999-2007 time-
period when PM10 and PM2.5 were recorded simultaneously at our sites. The main assumption with that
method is that the linear relationships remained constant over time. 4

In Table 3, we present the design values (DVs) that have been calculated using both a table-look-up
method and a statistical-fit method, described in the EPA PM10 State Implementation Plan (SIP)
Development Guideline 5. We did these calculations for the following sites: Kent (AQS Site ID: 53 033
2004), Seattle-Duwamish (53 033 0057), and Tacoma Tideflats (53 053 0031) PM10 Maintenance Areas
and for the last three years (2017, 2018 & 2019).

The DVs presented in Table 3 are calculated following two scenarios:
   - Scenario 1: All daily modeled PM10 concentrations are included in the DV calculation.
   - Scenario 2: Daily modeled PM10 concentrations are excluded from the DV calculation during
      2017-2018 wildfire-smoke days (I-Flags 6,7).

4
    The PM2.5 concentrations come from several instruments at each site. At all sites, we prioritize instruments measuring PM2.5
concentrations with missing values in the following way: FEM BAM > 1400ab/8500 FEM TEOM > 1405 FEM TEOM > nephelometer.
While Kent and Seattle-Duwamish have the majority of their data coming from TEOM (2013-2018) and BAM (2018-2019), only a
nephelometer has been in operation at Tacoma-Tideflats for 2013-2019.
5
    PM10 SIP Development Guideline - United States Environmental Protection Agency. June 1987. EPA-450/2-86-001
6
    Informational Flag request for 2017 Wildfire Affected Exceedances – WA Dept. of Ecology. Flagging Memo. Feb 2018.
7
    Informational Flag request for 2018 Wildfire Affected Exceedances – WA Dept. of Ecology. Flagging Memo. Feb 2019.

Particulate Matter – PM2.5                                                                                            Page 23
2019 Air Quality Data Summary
As part of being in maintenance at these sites, five-year DVs less than 98 µg/m3 are required to
continue to qualify for the Limited Maintenance Plan (LMP). 8 Over the last three years, scenario 1 (with
wildfire smoke days included) does not meet this qualification. Scenario 2 does meet the
qualification and is a more appropriate estimate for the Puget Sound region’s three Maintenance
Areas, given the unprecedented wildfire smoke levels witnessed in summers of 2017 and 2018.
Table 3: Five-year DVs for PM10 concentrations for 2019
Five-year DVs - Scenario 1 Five-year DVs - Scenario 2
Sites 2017 2018 2019 2017 2018 2019
89 ± 25 115 ± 35 115 ± 37 54 ± 6 62 ± 12 60 ± 13
Kent
(82) (118) (118) (53) (65) (64)
Seattle 72 ± 11 119 ± 45 117 ± 46 53 ± 3 52 ± 3 48 ± 4
Duwamish (80) (110) (101) (56) (53) (48)
Tacoma 93 ± 39 163 ± 69 163 ± 70 60 ± 16 60 ± 12 59 ± 13
Tideflats (94) (165) (165) (55) (58) (58)
Values appear as DV ± an uncertainty interval from a lognormal fit to the data and its 95% prediction
interval. Parenthetical values are the DVs obtained using the table-look-up method.5
8
Memorandum: Limited Maintenance Plan Option for Moderate PM10 Nonattainment Areas. U.S. EPA. Aug 2001.
Particulate Matter – PM2.5 Page 242019 Air Quality Data Summary
Particulate Matter – PM2.5 Speciation and Aethalometers
Although there are no regulatory requirements to go beyond measuring the total mass of fine
particulate matter, it is beneficial to know its chemical makeup in addition to its mass. Knowledge
about the composition of fine particulate can help guide emissions reduction strategies, such as the
Agency’s commitment to reducing wood smoke and diesel particulate emissions, 9,10,11 and is useful to
scientific and health researchers investigating questions about the effects of fine particulate matter
on human health and the environment.
Speciation Monitoring and Source Apportionment
Speciation monitoring involves determining the chemical composition of fine particulate matter
collected on different types of filters. Speciation filters are analyzed to determine what metals and
organic molecules make up the fine particulate at a site. Over 40 chemical species are measured at
speciation monitors in the area. These data are used in source apportionment models to estimate
contributing sources to PM2.5. Source apportionment models use statistical patterns in data to identify
likely pollution sources and then estimate how much each source is contributing at each site.
Ecology and PSCAA conducted speciation monitoring at three sites in the Puget Sound region in 2019:
• Seattle Beacon Hill – typical urban impacts, mixture of sources (speciation samples collected
every third day, operated by Ecology)
• Seattle 10th & Weller – Near-road micro-scale monitoring site (speciation samples collected
every sixth day, operated by Ecology)
• Seattle Duwamish – urban site with industrial sources (speciation samples collected every
sixth day, operated by PSCAA)
• Tacoma South L – urban residential area, impacts from residential wood combustion
(speciation samples collected every sixth day, operated by Ecology)
• Tacoma Tideflats - urban site with industrial sources (speciation samples collected every
sixth day, operated by Ecology)
In addition to using speciation data for concentrations of specific species or source apportionment
modeling, the Agency uses them to qualitatively look at the makeup of fine particulate at our
monitoring sites. For a list of PM2.5 analytes measured at these sites, please see page A-12 of the
Appendix.
9
Puget Sound Air Toxics Evaluation, October 2003. www.pscleanair.org/DocumentCenter/View/2355/Puget-Sound-Air-Toxics-
Evaluation-Final-ReportPDF?bidId=
10
Tacoma and Seattle Air Toxics Evaluation, October 2010.
epa.gov/ttn/amtic/files/20072008csatam/PSCAA_CommunityAssessment_FR.pdf.
11
Ogulei, D. WA State Dept of Ecology (2010). “Sources of Fine Particles in the Wapato Hills-Puyallup River Valley PM2.5
Nonattainment Area”. Publication Number 10-02-009. https://fortress.wa.gov/ecy/publications/documents/1002009.pdf
Particulate Matter - PM2.5 Speciation and Aethalometer Page 252019 Air Quality Data Summary
Aethalometer Data
Aethalometers provide information about the carbon fraction of fine particulate matter.
Aethalometers continuously measure light absorption at seven different optical wavelengths to
estimate carbon concentrations. Two of these wavelengths are important in our evaluation: black
carbon (BC) and ultraviolet (UV). Measurements from the black carbon channel correlate well with
elemental carbon (EC) concentrations derived from speciation data. Measurements from the UV
channel help produce a qualitative estimate of organic carbon (OC), which is correlated with the
difference between the UV and BC channel measurements (UV-BC). Elemental and organic carbon
are related to diesel particulate, wood smoke particulate, and particulate from other combustion
sources. 12 Unfortunately, neither is uniquely attributed to a particular combustion type, so the
information gained from aethalometer data is qualitative.
The Agency maintains aethalometers at monitoring sites with high particulate matter
concentrations, as well as sites with speciation data, so that data from the different methods to
measure carbon may be compared. Figure 18 shows annual average trending of black carbon
concentrations. Since 2003, the general trend shows reducing BC levels. A statistical summary of
aethalometer black carbon data is presented on page A-13 of the Appendix.
12
Urban Air Monitoring Strategy – Preliminary Results Using Aethalometer Carbon Measurements for the Seattle Metropolitan Area.
https://www3.epa.gov/ttnamti1/archive/files/ambient/samwg/spring2004/awmaurb.pdf
Particulate Matter - PM2.5 Speciation and Aethalometer Page 262019 Air Quality Data Summary Figure 18: Annual PM2.5 Black Carbon Particulate Matter - PM2.5 Speciation and Aethalometer Page 27
2019 Air Quality Data Summary

                                                              Ozone

Ozone is a summertime air pollution problem in our region and is not directly emitted by pollutant
sources. Ozone forms when photochemical pollutants react with sunlight. These pollutants are
called ozone precursors and include volatile organic compounds (VOC) and nitrogen oxides (NOx),
with some influence by carbon monoxide (CO). These precursors come from human activities such
as transportation and solvent use, as well as natural sources. Ozone levels are usually highest in the
afternoon because of the intense sunlight and the time required for ozone to form in the atmosphere.
The Washington State Department of Ecology conducts ozone monitoring in our four counties.

People sometimes confuse upper atmosphere ozone with ground-level ozone. Upper atmosphere, or
stratospheric ozone, helps to protect the earth from the sun’s harmful ultraviolet rays. In contrast,
ozone formed at ground level is unhealthy. Elevated concentrations of ground-level ozone can
cause reduced lung function and respiratory irritation and can aggravate asthma. 13 Ozone has also
been linked to immune system impairment. People with respiratory conditions should limit outdoor
exertion if ozone levels are elevated. Even healthy individuals may experience respiratory symptoms
on a high-ozone day. Ground-level ozone can also damage forests and agricultural crops,
interfering with their ability to grow and produce food. 14

Most ozone monitoring stations are located in rural areas of the Puget Sound region in the western
foothills of the Cascade Mountains, while the precursor chemicals that react with sunlight to produce
ozone are generated primarily in large metropolitan areas (mostly by cars and trucks). The
photochemical formation of ozone takes several hours, and the highest concentrations of ozone are
measured in the communities downwind of these large urban areas. In the Puget Sound region, the
hot sunny days favorable for ozone formation also tend to have light north-to-northwest winds. Map
3 shows the ozone monitoring network and the highest concentrations measured in 2019.

13
     EPA, Air Quality Index: A Guide to Air Quality and Your Health; epa.gov/airnow/aqi_brochure_02-14.pdf.
14
     EPA Health and Environmental Effects of Ground Level Ozone; epa.gov/ozone-pollution/ozone-basics.

Ozone                                                                                                         Page 28
2019 Air Quality Data Summary Map 3: Ozone 3-year Average of 4th Highest 8-hr Value for 2019 Ozone Page 29
2019 Air Quality Data Summary

Figures 19 and 20 present data for each monitoring station and the 8-hour federal standard. Figure 19
shows levels with the entire dataset, and Figure 20 shows ozone levels with wildfire smoke impacted
days removed in 2017 and 2018. The federal standard is based on the 3-year average of the annual 4th
highest 8-hour concentration, called the “design value”. The year on the x-axis represents the last
year averaged. For example, concentrations shown for 2019 are an average of 2017, 2018, and 2019 4th
highest concentrations.

The EPA’s 2015 8-hour standard is 0.070 ppm. The highest 2019 site design value (for the entire
dataset, including wildfire smoke impacted days) is 0.075 ppm at the Enumclaw site. This level was
elevated based on a high 4th highest concentration in 2017 of 0.094 ppm. While this level is above the
8-hour federal standard, our area remained in attainment with the federal standard because EPA
completed designations for the 2015 ozone standard in early November 2017, based on data from
2014-2016. If these years with wildfire smoke were included in an ozone standard comparison, they
could qualify as an exceptional event through EPA’s review process.

Statistical summaries for 8-hour average ozone data are provided on page A-14 of the Appendix.

For additional information on ozone, visit https://www.epa.gov/ozone-pollution.

Ozone                                                                                       Page 30
2019 Air Quality Data Summary

Figure 19: Ozone for Puget Sound Region

Figure 20: Ozone for Puget Sound Region with wildfire impacted days removed

Ozone                                                                         Page 31
2019 Air Quality Data Summary

                                                    Nitrogen Dioxide
Nitrogen dioxide (NO2) is a reddish brown, highly reactive gas that forms from the reaction of nitrogen
oxide (NO) and hydroperoxy (HO2) and alkylperoxy (RO2) free radicals in the atmosphere. NO2 can
cause coughing, wheezing and shortness of breath in people with respiratory diseases such as
asthma. 15 Long-term exposure can lead to respiratory infections.

The term NOx is defined as NO + NO2. NOx participates in a complex chemical cycle with volatile
organic compounds (VOCs) which can result in the production of ozone. NOx can also be oxidized to
form nitrates, which are an important component of fine particulate matter. On-road vehicles such
as trucks and automobiles and off-road vehicles such as construction equipment, marine vessels
and port cargo-handling equipment are the major sources of NOx in our region. Industrial boilers and
processes, home heaters, and gas stoves also produce NOx.

Motor vehicle and non-road engine manufacturers have been required by EPA to reduce NOx
emissions from cars, trucks and non-road equipment. As a result, emissions have declined
dramatically since the 1970s.

EPA promulgated a 1-hour national ambient air quality standard for nitrogen dioxide on January 22,
2010. 16 Since then, Department of Ecology added two “near-road” monitoring sites very close to
Interstate 5: one in Seattle (10th & Weller), and one in Tacoma (South 36th St.). To learn more about the
monitoring method visit https://www3.epa.gov/ttn/amtic/nearroad.html

In addition to the near-road sites, the Department Ecology measures nitrogen dioxide at the Seattle
Beacon Hill site. The monitoring method now records NOy instead of NOx, in order to observe all
reactive nitrogen compounds. NOy is NOx plus all other reactive nitrogen oxides present in the
atmosphere. NOy components such as nitric acid (HNO3) and peroxyacetyl nitrate (PAN) can be
important contributors to the formation of ozone and fine particulate matter.

Figure 21 shows NO2 concentrations for Beacon Hill through 2005. In 2006, no data were recorded due
to the relocation of the Beacon Hill monitor to a different location on the same property. From 2007
onward, the concentration of NO2 is represented as NOy – NO, since NO2 is no longer directly recorded,
and NOy = NO + NO2 + other nitroxyl compounds.

The 2010 1-hour standard is 100 ppb and is based on the 98th percentile of 1-hour daily maximum
concentrations, averaged over three years. Nitrogen dioxide levels in the Puget Sound region, as

15
     EPA, Airnow, NOX Chief Causes for Concern; epa.gov/airquality/nitrogenoxides/
16
     EPA. New 1-hour National Ambient Air Quality Standards for Nitrogen Dioxide; epa.gov/airquality/nitrogenoxides/actions.html.

Nitrogen Dioxide                                                                                                     Page 32
You can also read