Environmental Health JSNA: Air Quality - Wirral Intelligence Service June 2018
←
→
Page content transcription
If your browser does not render page correctly, please read the page content below
Environmental
                                           Health JSNA:
                                           Air Quality

                                           Wirral Intelligence Service

                                           June 2018

Wirral Intelligence Service: Air Quality                         June 2018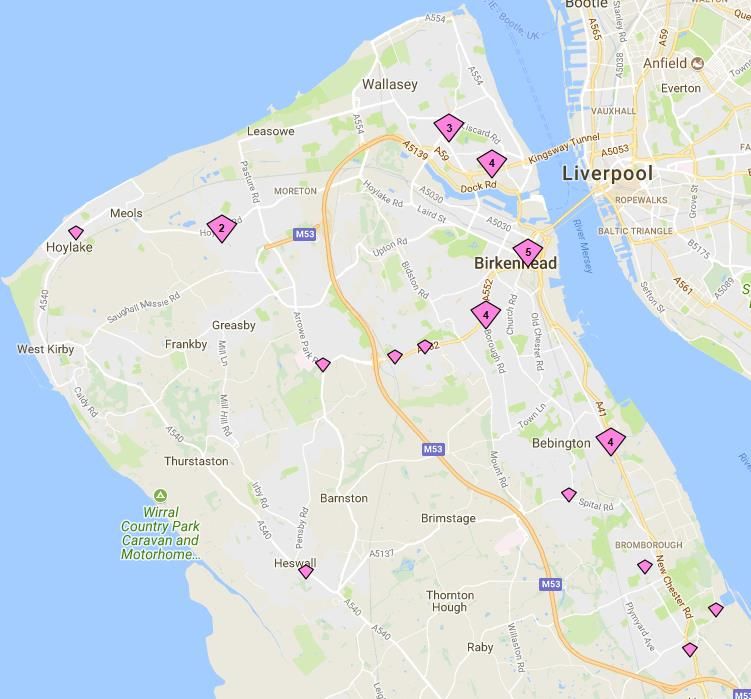
Environmental Health JSNA: Air Quality
For further information please contact:
Author: Sophie Patterson – Specialty Registrar in Public Health – Wirral Council –
sophiepatterson@wirral.gov.uk
Wirral Intelligence Service
Email: wirralintelligenceservice@wirral.gov.uk
Background to JSNA – Joint Strategic Needs Assessment
What is a JSNA?
A Joint Strategic Needs Assessment, better known as a JSNA, is intended to be a systematic
review of the health and wellbeing needs of the local population, informing local priorities,
policies and strategies that in turn informs local commissioning priorities that will improve
health and wellbeing outcomes and reduce inequalities throughout the Borough.
Who is involved?
Information from Council, NHS and other partners is collected and collated to inform the JSNA
and this reflects the important role that all organisations and sectors have (statutory, voluntary,
community and faith) in improving the health and wellbeing of Wirral’s residents.
About this document
This JSNA section looks to contain the most relevant information on the topic and provides an
overview of those related key aspects
How can you help?
If you have ideas or any suggestions about these issues or topics then please email us at
wirralintelligenceservice@wirral.gov.uk or go to https://www.wirralintelligenceservice.org/
Version Number Date Authors
3.0 June 2018 Sophie Patterson, Ken Smith, Victoria Chatterton, John
Highton, Sarah Kinsella, Matthew Saunders
Content overview
Air pollution is the most significant environmental risk to public health. This
Abstract JSNA presents a summary of key air pollutants, challenges and priority actions
in Wirral.
Intended or External
potential Wirral Residents, Businesses, Partner organisations
audience Wirral partners via Health Protection Forum
Public Health Departmental Management Team
Environmental Health Departmental Management Team
Links with Chronic Obstructive Pulmonary Disease and Asthma, Cardiovascular
other topic Disease, Cancer, Health in Children, Older People, ,Diabetes, Obesity,
areas Dementia, and Climate & Health
Wirral Intelligence Service: Air Quality June 2018 Page 2 of 34
Key findings
Air pollution is the greatest single environmental risk to public health.
Air pollution can compromise health outcomes, leading to a range of illnesses,
increases in hospital admissions and premature deaths.
The mortality burden from exposure to outdoor air pollution in the UK is equivalent to
approximately 40,000 deaths per year.
The health problems resulting from exposure to air pollution have a high cost to
individuals, society, businesses, and the health service, amounting to more than £20
billion every year.
Whilst air pollution is harmful to everyone, adverse effects fall disproportionately on the
most marginalised and vulnerable.
Major air pollutants that most significantly impact public health include particulate
matter (PM2.5) and nitrogen dioxide (NO2)
In 2015, the fraction of deaths attributable to particulate air pollution in Wirral (3.5%)
was lower than both North West (4.1%) and England (4.7%).
In 2017, 21 NO2 diffusion tubes monitored air quality across Wirral. Only one monitor
failed to meet objective target levels, but this reading was not deemed to be at a site of
relevant public exposure.
2016 PM2.5 levels in Wirral were below the objective target levels set by the European
Union and the World Health Organisation.
While there are no air quality management areas in Wirral, reducing air pollutants
remains a local public health priority.
In January 2018, the number of NO2 diffusion tubes monitoring air quality across Wirral
was increased from 21 to 31. Check Local Insight for a map of the current locations.
National guidance from DEFRA states the importance of local leadership and
collaborative action between transportation services, planning departments and public
health to improve air quality.
Local action should prioritise co-benefit strategies, which not only improve air quality,
but also improve wider health outcomes.
Wirral Intelligence Service: Air Quality June 2018 Page 3 of 34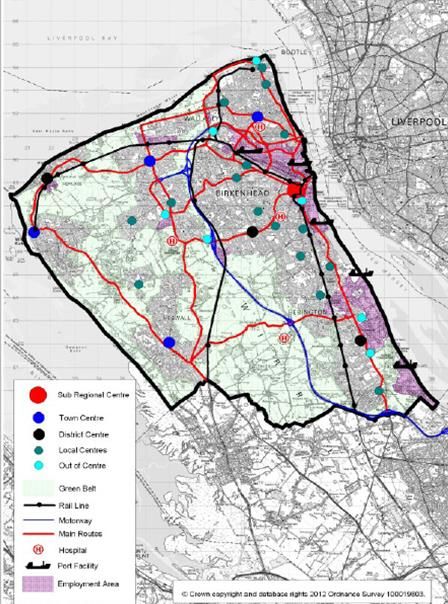
Environmental Health JSNA: Air Quality

Contents
   Key findings ................................................................................................................................ 3
Contents........................................................................................................................................ 4
What do we know? ....................................................................................................................... 6
   Why is this important? ................................................................................................................ 6
      Healthcare Implications ........................................................................................................... 6
      Environmental Implications ..................................................................................................... 7
      Legal Implications ................................................................................................................... 7
      Air Pollution and Public Health ................................................................................................ 8
      Particulate Matter (PM) ........................................................................................................... 8
      Nitrogen Dioxide (NO2) ........................................................................................................... 9
      Indoor Air Quality .................................................................................................................... 9
   Facts, figures and trends (Wirral and beyond) .......................................................................... 11
      Air Pollutants Monitored in Wirral .......................................................................................... 12
   Local, Community and Stakeholder views ................................................................................ 15
   What are we expecting to achieve? (Targets) .......................................................................... 15
   What are we achieving? (Performance) ................................................................................... 17
      Nitrogen Dioxide ................................................................................................................... 17
      PM2.5 ..................................................................................................................................... 20
      Benzene ................................................................................................................................ 21
What is this telling us? .............................................................................................................. 22
   Groups most at risk .................................................................................................................. 22
   Key inequalities ........................................................................................................................ 23
   Key issues and challenges ....................................................................................................... 24
What are we doing and why? .................................................................................................... 25
   Current activity and services..................................................................................................... 25
      Wirral Air Quality Group ........................................................................................................ 25
      Environmental Permitting ...................................................................................................... 25
      Smoke Control Areas ............................................................................................................ 25
      Planning ................................................................................................................................ 26
      Transport............................................................................................................................... 27
      Community Engagement....................................................................................................... 28
      Wirral Climate Change Strategy ............................................................................................ 28
What are the challenges? .......................................................................................................... 29
   Key gaps in knowledge and services ........................................................................................ 29
Wirral Intelligence Service: Air Quality                                   June 2018                                                 Page 4 of 34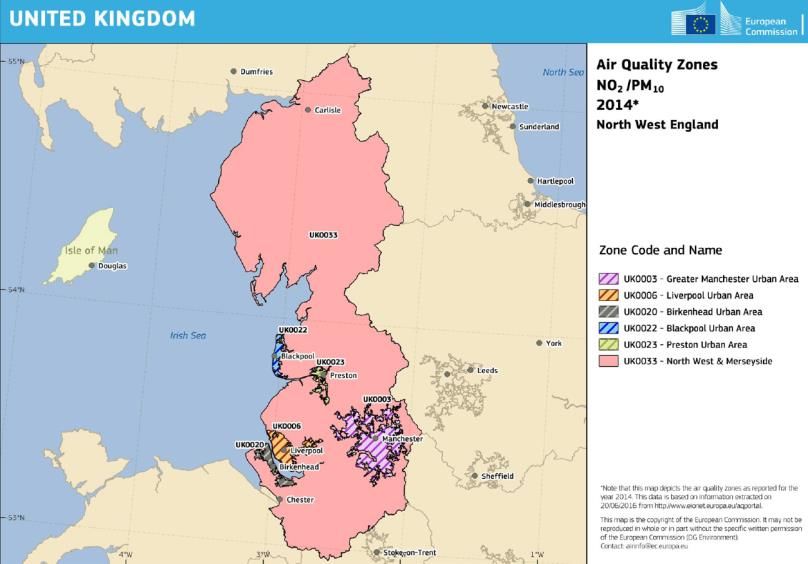
What is coming on the horizon? ............................................................................................... 29
   What does the research suggest as further actions? ................................................................ 29
Key content................................................................................................................................. 30
   Links ......................................................................................................................................... 30
   Relevant and related National and local strategies ................................................................... 30
   References ............................................................................................................................... 31
   Contact details .......................................................................................................................... 34

Wirral Intelligence Service: Air Quality                                    June 2018                                                 Page 5 of 34
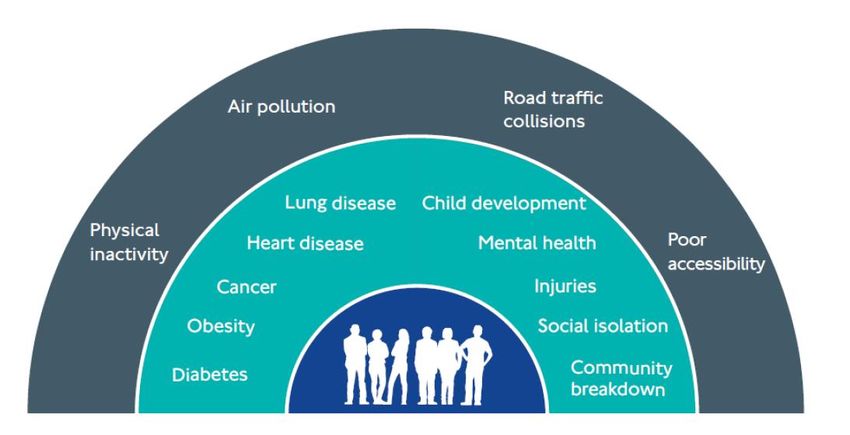
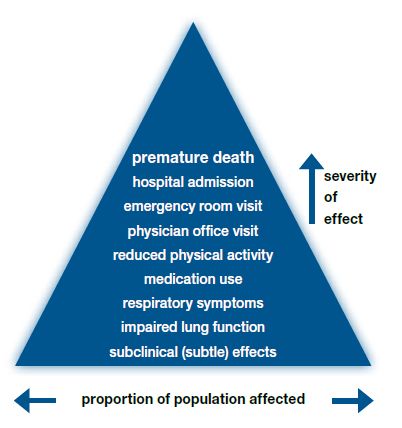
What do we know?

Why is this important?

Industrialisation, technological advancements and modern transportation systems have brought
many benefits, however modern lifestyles continue to fuel the generation of air pollutants, which
have notable health and environmental implications.

Healthcare Implications

The health impacts of pollution were the focus of the 2017 Chief Medical Officer’s annual report
for England. Specifically, air pollution is considered to be the greatest environmental risk to public
health (Landrigan, 2017). It is a major contributor to the global burden of disease, increasing
morbidity and mortality (Cohen et al, 2017). In 2015, ambient particulate matter (PM2.5 – an
outdoor pollutant with notable adverse health impacts) was identified as the fifth greatest
mortality risk factor globally (Cohen et al, 2017). Nationally, air pollution is one of the leading risk
factors contributing to the burden of disease. In 2013, air pollution was estimated to account for
around 2% of disability-adjusted life-years lost in England (Newton et al, 2015) (Figure 1).

Figure 1: Disability-adjusted life-years (DALYs) attributed to key risk factors in England, 2013.

Source: Newton et al. Changes in health in England, with analysis by English regions and areas of deprivation, 1990–2013: a
systematic analysis for the Global Burden of Disease Study 2013. Lancet, 2015

Exposure to air pollutants has been shown to cause health problems across the life course. Short
term exposure to air pollutants can precipitate exacerbations of respiratory conditions and
increased hospitalisation (Figure 2). However, most significant health impacts arise from long-
term exposure to air pollutants, causing increased morbidity and mortality from respiratory and
cardiovascular disease (Royal College of Physicians, 2016). Emerging evidence suggests that
exposure to air pollution can impair cognitive function and increase the risk of diabetes and
obesity (Royal College of Physicians, 2016).

In 2013, the International Agency for Research on Cancer listed both outdoor air pollution and
PM2.5 (a key component of outdoor air pollution) as carcinogens. Furthermore, a report from the
Royal College of Physicians estimated the mortality burden from exposure to outdoor air pollution
in the UK to be 40,000 deaths per year (Royal College of Physicians, 2016). Adverse social,
health and economic costs incurred through exposure to air pollution are wide ranging, and are
estimated to amount to over £20 billion per year in the UK, through absence from work and
school, medication costs, hospitalisation and years of life lost.

Wirral Intelligence Service: Air Quality                         June 2018                                        Page 6 of 34
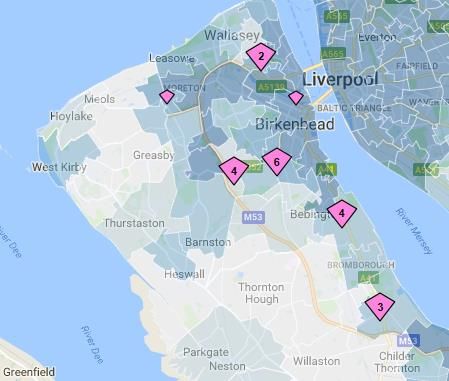
Figure 2: Air Pollution Health Pyramid.

               Source: World Health Organisation, Health risk assessment of air pollution, General Principles, 2016

Environmental Implications
Some air pollutants can also contribute to global climate change, which in turn compromise
health, food and water supplies, and increase the risk of devastating environmental disasters
(Watts et al, 2015). (For more information on climate change in our local area, see our JSNA on
climate and health). Air pollution can damage ecosystems, compromising habitats and
biodiversity. Agriculture and crop production can also be negatively impacted by air pollution,
which has implications for food supply. Mobilising efforts to reduce air pollution would support
national aims to promote sustainability within the Health and Social Care System to ensure
resources are available to future generations (Sustainable Development Strategy for the Health
and Social Care System 2014 – 2020). On a global scale, efforts to reduce air pollution are in line
with a number of key sustainable development goals set by the United Nations (Landrigan,
2017).

Legal Implications
Over the past decade, there has been increasing global awareness of the negative health
impacts of air pollution, necessitating increased regulation and control of air quality. In the UK,
action to manage and improve air quality is regulated by European Union (EU) legislation. The
2008 Ambient Air Quality Directive sets legally binding limits for concentrations in outdoor air of
major air pollutants that impact public health, such as particulate matter (PM10 and PM2.5) and
Nitrogen Dioxide (NO2), the nature and effects of such pollutants are discussed later in this
report.

The 2008 directive replaced nearly all the previous EU air quality legislation and was established
in English law through the Air Quality Standards Regulations, which were updated in 2010. The
Government has also committed to the UNECE Gothenburg protocol and the National Emission
Ceilings Directive, pledging to reduce five key pollutants (nitrogen oxides, fine particulate matter,
sulphur dioxide, non-methane volatile organic compounds, and ammonia) below legally-binding
targets by 2020 and 2030, respectively.
Wirral Intelligence Service: Air Quality                          June 2018                                           Page 7 of 34
The UK is divided into 43 geographical zones in which air quality and compliance with EU targets
are continually assessed (see Maps 1a &1b below showing zones in NW and specifically, the
Birkenhead Urban Area zone, which includes neighbouring borough areas such as Ellesmere
Port). Particular interest is placed on NO2 and PM2.5, deemed to represent the greatest risk to
health in the UK (NICE, 2017). In 2016, EU targets for NO2 were exceeded in 37 out of 43 zones
in the UK based on measured or modelled concentrations, including the Birkenhead Urban Area
(DEFRA, 2017).

Map 1a & 1b: Air Quality Compliance Zones in NW and Wirral (2014)

In recent years, there has been heightened media and public interest in air pollution as the
evidence base of the negative impacts of air pollutants has strengthened.
During the past year, the UK government air quality policy has been successfully challenged in
the Courts by the Environmental Charity Client Earth. Improving air quality has been identified as
a key priority by the UK Government in a policy paper released in July 2017 (DEFRA, 2017). In
this paper, the national government called for local leadership to drive efforts to improve air
quality and mobilise action in this field.

Air Pollution and Public Health
PM2.5 and nitrogen dioxide (NO2) have the largest evidence-base for negative public health
impacts of all outdoor air pollutants (NICE, 2017). Health outcomes are not routinely measured in
assessments of air pollution, thus levels of ambient PM2.5 and NO2 are critical indicators of
exposure to outdoor air pollution (NICE, 2017).

Particulate Matter (PM)
Particulate matter refers to particles of both solid and liquid particles of organic and inorganic
substances suspended in the air. Particles originate from many sources, but the most relevant to
health outcomes are traffic-generated dust (from road, brake and tyre wear) motor vehicle
emissions, fossil fuel combustion and wood burning. With the increasing popularity of wood
burning stoves, domestic wood burning has been recognised as an increasing contributor to
PM2.5 emissions (Hawkes, 2015).Particulates can remain in the air for weeks and travel for
hundreds of miles. PM10 are particles measuring 10 μm or less, whereas PM2.5 is finer particles,
with a diameter of less than 2.5 μm. The small size of PM2.5 means they can be easily inhaled
into the lungs. PM2.5 is used as an indicator to calculate the burden of disease attributable to air
pollution (Landrigan, 2017).

The Committee on the Medical Effects of Air Pollutants (COMEAP) estimates that 29,000 deaths
per year in the UK were attributed to exposure to PM2.5, with a 6% increase in mortality rates per
10 μg m-3 PM2.5 concentration increase (COMEAP, 2010).

Wirral Intelligence Service: Air Quality           June 2018                               Page 8 of 34
In 2014, the Public Health England report ‘Estimating Local Mortality Burdens associated with
Particulate Air Pollution’ presented the numbers of deaths attributed to anthropogenic (man-
made) PM2.5 among those aged 25 and over. In England this figure was suggested to be 25,002
deaths per year, with a total 264,749 life-years lost.

Exposure to PM2.5 has well documented impacts on the respiratory and cardiovascular systems.
PM2.5 increases mortality from respiratory and cardiovascular causes, including stroke, Chronic
Obstructive Pulmonary Disease (COPD), lung cancer and ischaemic heart disease. The
mechanism of action of fine particulates on the respiratory system is believed to be through
triggering inflammatory responses, hyper-responsiveness, and remodelling of the airways, with
impacts being more severe among individuals with pre-existing lung disease (Royal College of
Physicians, 2016). Short term exposure to fine particulates can exacerbate wheeze, bronchitis
and asthma, leading to increased hospitalisation. Particulates may also carry surface-absorbed
carcinogenic compounds into the lungs. In terms of cardiovascular impacts, PM2.5 triggers
deposition of plaques in the arteries increasing the risk of stroke, angina, and heart attacks.

The health impacts of air pollutants are experienced throughout the life course. PM2.5 is small
enough to cross the placental barrier and may influence foetal development (Royal College of
Physicians, 2016). Previous work suggests that exposure to traffic-related air pollution can result
in impaired foetal growth, resulting in low birth weight babies. There is also some evidence to
suggest that long term exposure to PM10 and PM2.5 is associated with increased risk of
developing type II diabetes. Exposure to high levels of PM2.5 may also be associated with
impaired cognitive function (Royal College of Physicians, 2016).

Nitrogen Dioxide (NO2)
NO2 is formed when Nitric Oxide is oxidized by Ozone (O3) or oxygen in the atmosphere.
Alternatively it can be formed directly through combustion. The main source of NO2 is motor
vehicle emissions. Specifically, motor vehicles are responsible for 80% of roadside NO2
emissions (DEFRA, 2017). Diesel light duty vehicles (cars and vans) are a key contributor to the
burden of NO2 in the UK, with the number of diesel vehicles increasing over the past decade.
Short-term exposure to NO2 leads to irritation and inflammation of the airways, which can trigger
a cough, wheeze, asthma or bronchitis, leading to impaired health, work absences or
hospitalisation. More prolonged exposure to NO2 can impair the lung development of children,
reduce lung function in adults, and increase respiratory infections, putting further pressure on
healthcare services (Royal College of Physicians, 2016).

Prolonged NO2 exposure has been shown to lead to increased mortality from respiratory causes.
In 2017, DEFRA estimated that NO2 exposure reduced life expectancy in the UK by
approximately 5 months, representing almost 23,500 deaths per year (DEFRA, 2017). There is
some evidence to suggest that exposure to NO2 during childhood can impair neurocognitive
development, and that long term exposure to NO2 is associated with increased risk of developing
type II diabetes (Royal College of Physicians, 2016).

Indoor Air Quality
Most air quality legislation in the UK is concerned with ambient (outdoor) air quality. However, the
contribution of indoor air pollutants from our homes and workplaces to morbidity and mortality is
also relevant. Estimates suggest that active urban Europeans spent around 85-90% of their time
indoors, including time spent at home, in work and commuting (WHO, 2013). Notably, those who
are most vulnerable to the impacts of air pollution (through ill health, or those who are very
elderly or young) are more likely to spend a larger proportion of their time indoors, whether in
private residences, hospitals, residential homes, care homes or nurseries. It is estimated that
exposure to indoor air pollutants costs more than 204,000 healthy life years in the UK annually,
with impacts manifested through an increased prevalence of asthma, lung cancer, and
cardiovascular disease (National Institute for Health and Welfare, 2013), and annual healthcare
costs amounting to “tens of millions of pounds” (Royal College of Physicians, 2016).
Wirral Intelligence Service: Air Quality           June 2018                              Page 9 of 34
Outdoor air pollutants can move into indoor spaces through air exchange, compromising indoor
air quality. In indoor environments, people can also be exposed to air pollution generated from
tobacco smoke, including ultrafine PM, CO, NO2, naphthalene and benzo[a]pyrene and benzene.
While the ban on smoking in public spaces has reduced exposure to second hand smoke, this
remains an issue in private establishments. Indoor air pollution can also be generated through
the burning of solid fuels, through unvented gas appliances or combustion equipment, releasing
NO2, CO, and particulates. Other sources of indoor air pollution include building materials, textiles
and chemicals or solvents (WHO, 2013).

Poor indoor air quality may be exacerbated in low quality housing, with old appliances, damp and
poor ventilation, where mould, mildew or pests may accumulate. Indoor air quality may be
compromised by efforts to conserve energy in the home, leading to reduced ventilation.
Monitoring and enforcing air quality in private establishments remains a considerable challenge
due to the lack of applicable regulations (Royal College of Physicians, 2016). Building regulations
require minimum standards for ventilation, construction materials and heating appliances in new
build / adapted premises. Housing legislation addresses hazards such as mould, carbon
monoxide etc. in rented property.

In the workplace, employees may be exposed to air pollution or inhaled hazards. The Global
Burden of Disease study estimates that occupational exposure to pollutants was linked to 0.88
million deaths and 18.6 million disability-adjusted life years worldwide in 2015 (Global Burden of
Disease, 2015). In the UK there are regulations in place to protect workers. Specifically, the
Health and Safety at Work Act (1974) and Control of Substances Hazardous to Health (COSHH)
Regulations regulate inhalation of dangerous substances at work.

Various national projects are currently underway to determine the impact of indoor air pollution on
public health in the UK. In July 2017, the All Party Parliamentary Group for Healthy Homes and
Buildings released the report “Building our Future Laying the Foundations for Healthy Homes and
Buildings”, identifying the need to tackle the growing issue of indoor air pollution in building
design and delivery. The National Institute for Health and Care Excellence (NICE) has been
approached by the Department of Health to convene a stakeholder consultation to produce a
report on the health impacts of indoor air pollution at home, with results expected to be published
by February 2019.

Furthermore, in 2017 a new working party was established consisting of representatives from the
Royal College of Paediatrics and Child Health, the Royal College of Physicians, Building
Research Establishment and the Adaptation and Resilience in the Context of Change network to
consider the impact of indoor air pollution in homes on health outcomes.

Wirral Intelligence Service: Air Quality           June 2018                              Page 10 of 34
Facts, figures and trends (Wirral and beyond)
Wirral Council’s area is located on a peninsula, bordered by the River Dee and the River Mersey.
The unique geography of Wirral influences the distribution of key pollutants within the borough.
The east side of the peninsula, adjacent to the River Mersey, is urbanised with a large port area
and numerous industries. The west side of the peninsula is more rural, with large green belt
areas of land. A major motorway runs through the peninsula, and several rail lines and main
roads connect the local population (Map 2).
There are rail and road tunnel links between Wirral and Liverpool. Main urban centres
(Birkenhead, New Brighton, Wallasey, and Prenton) are primarily located towards the East of the
peninsula, centred on the more deprived regions of the borough. Along with five other local
councils, Wirral is part of the wider Liverpool City Region combined authority.
Map 2: Map of Wirral Local Authority
Source: 2015 Updating and Screening Assessment for Wirral Borough Council.
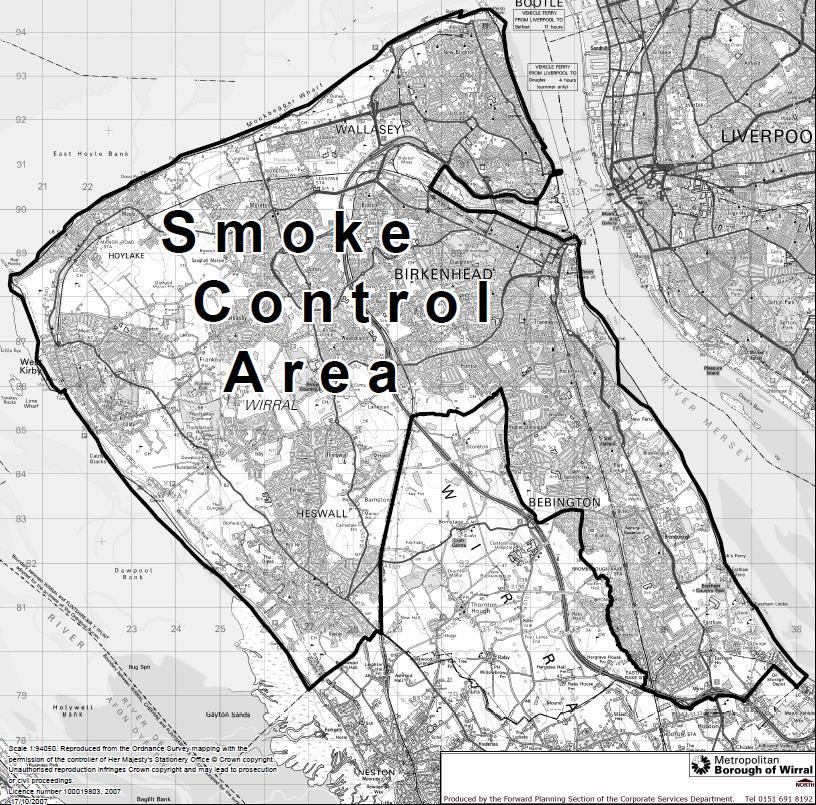
Wirral Intelligence Service: Air Quality June 2018 Page 11 of 34Air Pollutants Monitored in Wirral The Local Air Quality Management programme in Wirral has been tailored to ensure that any site where a relevant exposure is determined is suitably monitored to assess if the concentrations are below the air quality objectives. Four key air pollutants are monitored in Wirral: NO2 PM2.5 Benzene Ozone NO2 is the most closely monitored pollutant, in line with national priorities to reduce NO 2 concentrations below EU targets (DEFRA, 2017). At the time of writing, Wirral Council utilises 31 passive (non-automatic) diffusion tubes and two Urban Background Air Quality Monitors to measure NO2. Prior to January 2018, there were 21 monitoring sites in Wirral, numbered W1 – 21 (Map 3a & 3b). As of January 2018, 13 of the pre- existing monitoring sites were retained (W2, 3, 4, 5, 8, 9, 12, 13, 14, 15, 17, 18 and 21), eight pre-existing sites were discontinued from regular monitoring (W1, 6, 7, 10, 11, 16, 19 and 20), and 18 new monitoring sites were established. Map 3a: Location groupings of 21 NO2 monitors capturing air quality in Wirral in 2017. Source: https://wirral.communityinsight.org Note: For a complete breakdown of monitor locations, see 2017 Air Quality Annual Status Report Wirral Intelligence Service: Air Quality June 2018 Page 12 of 34
Map 3b: Location groupings of 31 NO2 monitors capturing air quality readings in Wirral in 2018.

Source: https://wirral.communityinsight.org

Non-automatic benzene monitoring was reinitiated in the borough in 2015 in order to collect
background benzene levels. Benzene is a volatile organic compound (VOC) and a well-known
carcinogen. It has also been reported to cause central nervous system disorders, liver and kidney
damage, reproductive disorders and birth defects (DEFRA, 2009). Benzene is present naturally in
low concentrations in the environment. It is also a minor constituent of petrol and can be formed
during incomplete combustion of fossil fuels.

The two Urban Background Air Quality Monitors operational in Wirral are automatic, real time
monitors which form part of the Automatic Urban Rural Network (AURN). Both provide
continuous, real time NO2 measurements, and one also monitors PM2.5 and Ozone. Ozone is
generated over time by a reaction between pollutants in the atmosphere, commonly nitrogen
oxides and VOCs, in the presence of sunlight, and can have negative impacts on lung function
and mortality (WHO, 2005). Ozone is excluded from local air quality management as it is
transported across long ranges, meaning emissions fuelling the generation of ozone are mostly
from non-local sources. Wirral discontinued monitoring PM10 in 2009 and SO2 in 2007. In 2006,
the annual maximum SO2 concentration in Wirral was 56 μg/m3, with an annual mean of 6
μg/m3, both well below the recommended targets.

Based on data from the Global Burden of Disease study, 161 deaths in Wirral were attributed to
air pollution in 2015 (Figure 3).
Wirral Intelligence Service: Air Quality          June 2018                           Page 13 of 34
Figure 3: Estimated deaths from risk factors in Wirral, 2015

Source: Wirral Long Term Condition Model 2017
Notes: Based on IHME GBD data for North West of England.

Based on data from the Public Health Outcomes Framework, the fraction of deaths attributable to
particulate air pollution in Wirral (3.5%) was estimated to be lower than both North West (4.1%)
and England (4.7%) in 2015 (Figure 4).

Figure 4: Fraction of mortality attributable to particulate air pollution for Wirral, North West and
England (2010 – 2015)

Source: Public Health England Fingertips, 2017
Notes: Fraction of annual all-cause adult mortality attributable to anthropogenic (human-made) particulate air pollution (measured
as fine particulate matter, PM2.5).

Wirral Intelligence Service: Air Quality                          June 2018                                         Page 14 of 34
Local, Community and Stakeholder views
The Wirral Air Quality Group was established in 2014 and unites representatives from the
Council’s Fleet Management team, and Environmental Health, Public Health, Transport,
Sustainability, Licensing, and Forward Planning departments within Wirral Council. The group
meets three-monthly to engage in multidisciplinary discussions around air quality issues within
the region and to identify key areas for action. On a regional scale, Wirral council is also
represented in the Liverpool City Region and Cheshire Air Quality Group.
The need to encourage engagement and participation with the community and stakeholders has
been recognised. Work is ongoing to utilise opportunities, such as school projects and National
Clean Air Day (discussed below).
What are we expecting to achieve? (Targets)
Understanding and monitoring the composition, levels and key sources of air pollution is
important to inform policy decisions and interventions to improve air quality and public health. Air
pollutants consist of natural or man-made substances that impact the composition of the air we
breathe. Road transport, fuel combustion, industrial processes and agriculture are important
sources of air pollution in the UK. The Air Quality Standards Regulations 2010 mandate national-
level monitoring of outdoor air pollutants in the UK:
Particulate Matter (PM10 and PM2.5)
Nitrogen Dioxide (NO2)
Benzene
1,3 Butadiene
Carbon Monoxide (CO)
Lead
Sulphur dioxide (SO2)
Ozone (O3)
Benzo(a)pyrene
All Local Authorities in the UK have a duty under the Environment Act 1995 Part IV to review and
assess local air quality. The EU’s Air Quality Directive, defines standards by which air pollution
can be assessed.
The air quality objectives are set out in the Air Quality Standards Regulations 2010 (Table 1).
DEFRA Local Air Quality Management Technical Guidance TG16 (updated 2018) advises Local
Authority’s to undertake air quality monitoring in locations of relevant exposure, this would include
residential building facades close to busy roads or junctions and point sources of industrial
emissions.
These locations undergo periodic review and modification. Local Authorities must determine
whether or not the air quality objectives are likely to be achieved. Where exceedances are
considered likely, the local authority must then declare an Air Quality Management Area (AQMA)
and prepare an Air Quality Action Plan (AQAP) setting out the measures it intends to put in place
in pursuit of the objectives.
Wirral Intelligence Service: Air Quality June 2018 Page 15 of 34Table 1: Key Air Quality Objectives within the Air Quality Standards Regulations
Air Quality Objective Date to be
Applies European Date to be
Pollutant achieved
Obligations achieved
Concentration Measured as by
by
3 3
200 µg/m not to 200 µg/m not
Nitrogen UK be exceeded 1-hour mean 31.12.2005 to be exceeded
dioxide (NO2) >18 times/year > 18 times/ year 01.01.2010
3 3
UK 40 µg/m Annual mean 31.12.2005 40 µg/m 01.01.2010
3 3
UK 0.5 µg/m Annual mean 31.12.2004 0.5 µg/m 01.01.2005
Lead 3
0.25 µg/m Annual mean 31.12.2008 - -
UK Maximum daily
running 8 hour
Carbon 3
3 mean/in 10 mg/m
monoxide 10 mg/m 31.12.2003
Scotland as 01.01.2005
(CO)
running 8 hour
mean
UK 3 Running - -
1,3 butadiene 2.25 µg/m 31.12.2003
annual mean
Polycyclic 3
0.25 ng/m Annual 3
aromatic UK 31.12.2012 1.0 ng/m 31.12.2012
B[a]P average
hydrocarbons
3
UK 266 µg/m not to
15 minute
be exceeded > 31.12.2005 - -
mean
35 times/ year
3 3
UK 350 µg/m not to 350 µg/m not to
Sulphur dioxide
be exceeded > 1 hour mean 31.12.2004 be exceeded > 01.01.2005
(SO2)
24 times/ year 24 times/year
3 3
UK 125 µg/m not to 125 µg/m not to
be exceeded > 3 24 hour mean 31.12.2004 be exceeded > 01.01.2005
times/ year 3 times/ year
120 μg/m3 not
to be exceeded
100 μg/m3 not
Ozone UK 8 hour mean by > 25 31.12.2010
to be exceeded 31.12.2005
(O3) times/year,
> 10 times/ year
averaged over 3
years
3
UK (except 3 25 µg/m 2010
25 µg/m 2020
Scotland)
3 3
Scotland 10 µg/m 31.12.2020 25 µg/m 01.01.2015
Particulate 20% reduction
15% reduction in Annual mean
Matter (PM2.5) UK urban areas in
concentrations
2010-2020 concentrations 2010-2020
at urban
at urban
background
background
3 3
UK 50 µg/m not to 50 µg/m not to
be exceeded > 24 hour mean 31.12.2004 be exceeded > 01.01.2005
35 times/ year 35 times/ year
3 3
Particulate UK 40 µg/m Annual mean 31.12.2004 40 µg/m 01.01.2005
3 3
Matter (PM10) Scotland 50 µg/m not to 50 µg/m not to
be exceeded > 7 24 hour mean 31.12.2010 be exceeded > 01.01.2005
times/ year 35 times/year
3 3
Scotland 18 µg/m Annual mean 31.12.2010 40 µg/m 01.01.2005
3 Running - -
16.25 μg/m 31.12.2003
UK annual mean
Annual
3 31.12.2010 3
England and 5 μg/m average 5 μg/m 01.01.2010
Benzene
Wales
Scotland and -
3 Running
Northern Ireland 3.25 μg/m 31.12.2010 -
annual mean
Source: Air Quality Standards Regulations, DEFRA
Wirral Intelligence Service: Air Quality June 2018 Page 16 of 34The Air Quality Standards Regulations 2010 (as amended) require a maximum concentration for PM2.5 of 25µg/m3, with the World Health Organisation target set to 10µg/m3. These regulations also set targets for the reduction in annual mean concentrations of PM 2.5 in urban background locations based on an initial “Average Exposure Indicator” (AEI) for 2010 (calculated using a 3 year rolling average). Percentage reduction targets are then set, according to the AEI. These reductions are applied to the national levels of PM2.5. Current EU and UK Regulations require that NO2 levels should not exceed an average annual mean of 40 µg/m3 at points of relevant exposure. While total emissions of NO2 have been reducing over time, EU targets for NO2 were exceeded in 38 out of 43 zones in the UK in 2013. As a result, the UK government has put increased focus on reducing NO2 emissions. For both Particulate Matter and NO2, no safe level of exposure has been identified (where no negative health impacts occur). As such, continuing to reduce NO2 levels below identified targets remains a key public health priority. What are we achieving? (Performance) Nitrogen Dioxide NO2 diffusion monitors are located at traffic hotspots determined by local intelligence, historical data, and input from transportation services. NO2 readings for 2017 are shown in Figure 5. Figure 5: *Provisional Nitrogen Dioxide Air Quality results for Wirral, 2017 Source: Wirral Council Environmental Health Team. Notes: The Annual Air Quality Objective applies to sites where there is relevant exposure e.g., facades of residential properties. Where, as in this case, monitoring is sometimes carried out at the kerbside, corrections are later applied to determine whether there are exceedances at points where there is relevant exposure to the public. The monitor at site W18 is deemed to be not a site of relevant public exposure. *Finalised figures are published in the Air Quality Annual Status Review once they have been verified by DEFRA. Wirral Intelligence Service: Air Quality June 2018 Page 17 of 34
An Explanation of Adjustments Made to Monitoring Figures:
 Bias:
 NO2 diffusion tubes have a limited accuracy. Therefore there is a national scheme to compare
 the results of tubes placed near real time monitors with the results from those monitors. This
 data is collected and used to produce “bias adjustment” factors which are regularly published.
 This information is used by us to correct the results from our tubes and provide the most
 accurate figure possible.
 Distance Adjustment:
 It is not always possible to monitor at the point where exposure may occur. In these
 circumstances DEFRA provide a tool to allow us to calculate exposure levels at the point where
 exposure occurs. E.g. we may monitor on a lamp post and then adjust the figure to calculate
 what it is estimated to be at the façade of a house.
 Annualisation:
 Where tubes are damaged or go missing for part of the year then DEFRA provide guidance of
 how to estimate an annual figure.

In 2017, annual mean NO2 concentrations were below the national objective in almost all
locations. After bias adjustment one diffusion tube was above the National Air Quality Objective,
recording 44μg/m3. This reading has been constantly elevated in recent years. This monitor is
located in a taxi rank in Liscard, which was determined to be a location whereby there is no
‘relevant exposure’ for the public, i.e., an area where the public would not be regularly present
and thus not likely to be exposed for a period of time appropriate to the averaging period of the
objective.

This is consistent with the DEFRA Technical Guidance: “Authorities should not consider
exceedances of the objectives at any location where relevant public exposure would not be
realistic” (2009, updated 2016).

A comparison between NO2 concentrations in 2012 and 2017 demonstrates an overall decrease
in the concentrations of the NO2 across all monitors (Table 2).

Wirral Intelligence Service: Air Quality          June 2018                             Page 18 of 34
Table 2: Comparison of annual mean NO2 concentrations (bias adjusted and annualised)
between 2012 and 2017
                                                                     Difference between
                                        2012         2017            2012 and 2017
 Site and Reference                     µg/m3        µg/m3           (Provisional)
                                                     (Provisional) (µg/m3)
 Woodchurch Road W14                        18             16                  -2
 New Chester Road W1                        23             17                  -6
 New Chester Road W2                        23             18                  -5
 Woodchurch Road W11                        23             20                  -3
 Stanley Lane W19                           25             21                  -4
 New Chester Road W13                       26             23                  -3
 Singleton Avenue W20                       28             24                  -4
 Four Bridges W10                           30             24                  -6
 Arrowe Park Road W16                       32             25                  -7
 Woodchurch Road W9                         28             26                  -2
 Singleton Avenue W6                        31             26                  -5
 New Chester Road W7                        28             27                  -1
 Arrowe Park Road W15                       32             28                  -4
 Singleton Avenue (151) W3                  37             29                  -8
 St Albans Road W17                         39             31                  -8
 Moreton Cross W8                           34             31                  -3
 Singleton Avenue Lampost W21               36             31                  -5
 Borough Road W4                            36             33                  -3
 Bolton Road East W5                        43             35                  -8
 New Chester Road - Port Sunlight W12       43             39                  -4
 Wallasey Road W18                          47             44                  -3
Source: Wirral Air Quality Monitoring Annual Status Report, 2017 and provisional data provided by Environmental
Health

                        Key
                        Red                      Increase in pollutant concentration
                                                 between 2012 and 2017
                        Amber                    Stable pollutant concentration between
                                                 2012 and 2017
                        Green                    Decline in pollutant concentration
                                                 between 2012 and 2017

A more detailed annual trend in NO2 concentrations across the monitoring sites between 2012
and 2017 is illustrated below (Figure 6). When the trend in NO2 concentration is shown annually
for the past six years, not all sites show clear evidence of a continued decline in annual NO2
concentrations during this period.

However, in all 21 sites the provisional bias-adjusted NO2 concentrations for 2017 were either
lower than or equal to levels seen in 2016.

Wirral Intelligence Service: Air Quality                         June 2018                                        Page 19 of 34
Figure 6: Graph showing change in annual mean NO2 concentration (bias adjusted and annualised) over time at the 21 diffusion monitors across Wirral, 2012-2017* Source: Data obtained from Wirral Air Quality Monitoring Annual Status Report, 2017 and Wirral Council Environmental Health team. Notes: *The Annual Air Quality Objective applies to sites where there is relevant exposure e.g., facades of residential properties. Where, as in this case, monitoring is sometimes carried out at the kerbside, corrections are later applied to determine whether there are exceedances at points where there is relevant exposure to the public. The monitor at site W18 is deemed to be not a site of relevant public exposure. PM2.5 PM2.5 monitoring is undertaken by one AURN based in Victoria Park, Tranmere. From 2012 to 2016, the annual mean concentrations of PM2.5 were 10 µg/m3, 11 µg/m3, 8 µg/m3, 7 µg/m3, 8 µg/m3, respectively (Figure 7). Since 2014, the annual mean concentrations of PM 2.5 have remained below both the WHO and the EU standards. These results are taken from hourly measured data and are not bias adjusted. It is important to acknowledge that this monitoring is undertaken at an urban background site and may not be representative of roadside readings, where PM2.5 concentrations are likely to be higher. In 2010, Wirral had an initial “Average Exposure Indicator” (AEI) of 9.33. The target for the reduction in annual mean concentrations of PM2.5 in urban background locations in Wirral based on this initial AEI was 10%. The 3 year rolling average AEI for 2016 was 7.7ug/m3, demonstrating a reduction of 10%, which met the suggested target. Regulations suggest that once the AEI has reached 8.5 µg/m3 and is maintained at or below this level, the reduction target is 0. Wirral Intelligence Service: Air Quality June 2018 Page 20 of 34
Figure 7: Trend in urban background PM2.5 captured from the AURN at Tranmere, 2012-2016.
                                             30
                                                                      EU air quality standard: 25 µg/m3
   PM2.5 annual mean concentration (μg/m³)

                                             25

                                             20
                                                                    WHO air quality standard: 10 µg/m3

                                             15

                                             10

                                              5

                                              0
                                               2011   2012   2013                2014                    2015   2016          2017
                                                                            Calendar Year

Source: Data drawn from Wirral Air Quality Monitoring Annual Status Report, 2017

Benzene
Benzene monitoring in Wirral resumed in two locations in 2015. There is marked seasonal
variation in outdoor air concentrations of benzene, with concentrations higher in the winter. In
2016, monthly benzene concentrations in the two locations were below 5ug/m3, except for March
concentrations in Eastham, which reached 5ug/m3 (Figure 8). The monitor at Eastham is located
close to a major fuel storage depot, a key source of benzene emissions. However, annual mean
of benzene at both sites is below the 5ug/m3 permitted by the regulations.

Figure 8 – Monitored benzene results in Eastham and West Kirby, 2016.

Source: Wirral Council: Air Quality. Monitoring Results for Benzene, 2016

Wirral Intelligence Service: Air Quality                                         June 2018                             Page 21 of 34
What is this telling us?
Wirral currently has no Air Quality Management Areas (AQMA) and annual NO2 concentrations
have decreased across the majority of diffusion monitors in the Borough over the past year.
However it is important to keep longer term trends under review as weather, roadworks etc. may
affect short term year on year comparisons. PM2.5 levels in Wirral remain below both EU and
WHO recommendations.
Current recommendations from both the EU and WHO suggest there is no safe level of exposure
of PM2.5 and NO2, with negative health impacts reported below the “required” concentrations.
The NO2 monitor at a Liscard taxi rank continues to read levels above the National Air Quality
Objective. Whilst this is not considered relevant exposure under the current regulations, the
Council is working to reduce NO2 pollutant levels in areas such as this through the
implementation of anti-idling legislation and direct work with taxi operators (discussed further
below).
Currently Wirral has only one monitor recording PM2.5 levels, located at an urban background
site. PM2.5 has the strongest evidence-base of negative impacts on health globally (Landrigan,
2017). It is therefore important that PM2.5 continues to be represented within the Council’s work
programme. DEFRA guidance states that action to address PM2.5 should be specifically
discussed with Public Health Teams and addressed in the Air Quality Annual Status Review.
The 2017 Lancet Commission on Pollution and Health stressed the need for collaboration
between departments to tackle the global issue of air pollution (Landrigan, 2017). Local action
needs to be focused on co-benefit strategies, which not only improve air quality, but also
generate sustainable improvements in wider health and social outcomes. For example, through
changing transportation infrastructure we can promote active travel, thereby reducing harmful
emissions, increasing physical activity and reducing obesity.
Groups most at risk
Air pollution doesn’t influence health outcomes in isolation, but interacts with other health
determinants, including socio-economic status, diet and climate (Royal College of Physicians,
2016) (Figure 9). Globally, negative health impacts of air pollution are disproportionately
experienced by marginalised and low income communities (Landrigan, 2017).
Figure 9: Model of the wider determinants of health.
Source: Dahlgren-Whitehead model of health determinants (1991)
Wirral Intelligence Service: Air Quality June 2018 Page 22 of 34A 2016 report from the Royal College of Physicians on impacts of air pollution across the life course identified three groups most vulnerable to the effects of air pollution: 1. Individuals at extremes of age or with pre-existing cardiovascular or respiratory illnesses. While exposure to air pollution can have health impacts across the life-course, previous work suggest that the elderly people and those with pre-existing diseases are more sensitive to the effects of poor air quality (Pye et al, 2006). The Marmot Review (2010) highlighted that individuals in deprived areas experience more adverse health effects at the time level of exposure compared to those from less deprived areas and that this was due, in part, to the higher prevalence of underlying cardio-respiratory diseases including Chronic Obstructive Pulmonary Disease (COPD), bronchitis, emphysema and asthma. These conditions may be exacerbated by poor air quality in certain geographical areas. 2. Individuals living or working in close proximity to main roads. Given that traffic emissions are the greatest source of NO2 in the UK, it is no surprise that individuals living or working close to major traffic thoroughfares are exposed to higher levels of air pollution (DEFRA, 2017). 3. Individuals living in more deprived regions. An examination of the links between air quality and social deprivation in the UK on behalf of DEFRA (Pye et al, 2006) suggested that NO2 concentrations are higher in more deprived areas, largely due to the road transport sources. Further analysis has been undertaken which shows that in deprived areas there was lower car ownership, however such areas still experience high pollution levels, suggesting that deprived areas are suffering further through the actions of the population of car owners. Whilst the research does not further examine this matter in relation to car ownership, it would be fair to assume that car owners are travelling through more deprived areas to access employment, retail etc. Key inequalities Deprived communities are more likely to be located in close proximity to busy roads, congested areas and traffic hotspots; this would indicate that people who live in more built up areas are more likely to suffer negative health effects of air pollution. Similarly, previous work in Wirral has shown that those living in the most deprived communities are more likely to live more years in ill health than individuals from comparatively wealthier areas (Director of Public Health Annual Report, 2017). Individuals most susceptible to negative health impacts of air pollution exposure are likely to be among the most vulnerable people in society, in some cases with limited social power to alter social circumstances or individual-level risk, for example to move house or make changes to their home to limit exposure to air pollution. Current NO2 air quality monitor placement in Wirral is clustered around East Wirral, recording air quality in some of the most deprived areas of the borough, with the highest concentration of main roads and the poorest air quality (Map 3b). Wirral Intelligence Service: Air Quality June 2018 Page 23 of 34
Key issues and challenges

Though there is some movement towards ultra-low emission vehicles, diesel and petrol cars
currently remain an integral part of our transportation infrastructure. Accurately measuring
emissions from vehicles is critical to inform strategies to minimise harmful exposures. Accurate
measurement of real-world emissions to identify the worst sources of emissions has proven
challenging.

In some instances, this challenge was driven by the presence of devices in motor vehicles, which
deliberately and artificially reduced emission readings when tested under laboratory conditions.

Even in vehicles not fitted with such devices, real-world emissions appear to be in excess of
those reported in test conditions, resulting in inaccurate readings and excesses above EU
objectives. In response to this challenge, on 1st September 2017, the European Commission
introduced a more sensitive “real driving emissions” test and more accurate tests under
laboratory conditions ("World Harmonised Light Vehicle Test Procedure") (European
Commission, 2017).

It is hoped that these improved tests will result in a more reliable measure of emissions, and
improve the ability to mitigate the impact of motor vehicle emissions on air quality.

Strategies to improve air quality must be holistic in their scope to ensure changes are
sustainable. Recent national recommendations for improving air quality are largely focussed on
NO2 and roadside emissions (DEFRA, 2017). Monitoring coverage and air quality strategies must
not overlook the importance of PM2.5 as a significant threat to public health.

National guidance from DEFRA has outlined the key role of local authorities in demonstrating
local leadership and innovation in tackling air pollution. However, mobilising the magnitude of
change required in the fields of transportation and planning require significant funding
commitments, which is challenging to obtain in the current economic climate.

Modelled data of key air pollutants are often applied in circumstances where monitoring points
providing precise readings are lacking. While this is a useful tool, it lacks the accuracy of
readings from diffusion monitors, and may be prone to error.

Wirral Intelligence Service: Air Quality           June 2018                             Page 24 of 34
What are we doing and why? Current activity and services Current national recommendations emphasise the need for local leadership and local knowledge to tackle issues of air pollution, setting local authorities at the centre of the air quality improvement initiatives (DEFRA, 2017). As part of its obligations for Local Air Quality Management, Wirral Council has produced its annual air quality monitoring report. The report demonstrates that the authority has made suitable arrangements for local air quality management in the borough and has no AQMAs. Wirral Air Quality Group There are a number of interventions being prioritised within Council Departments that have potential to impact upon local air quality. By measuring the right pollutants in the right places, the Council can create an accurate picture of Air Quality in the Borough, with sufficient baseline data to assist in the consideration of Planning Applications. As previously mentioned, in 2017, the Wirral Air Quality Group reviewed and revised air quality monitor placement in the borough, drawing on traffic data and information from the Merseyside Emission Inventory. Increasing the coverage and improving the placement of air quality monitors in Wirral from January 2018 should ensure more accurate capture of air quality issues within communities most at risk of negative impacts of air pollution. The Air Quality Group led a host of public engagement and education efforts on National Clean Air Day on 21st June 2018 as a mechanism of increasing public awareness around air quality in the local area. Environmental Permitting Environmental Health and the Environment Agency (EA) play a significant role in controlling point sources of pollution nationally. Certain industrial processes whose activities emit pollutants, including dust, into the environment are required to operate under an Environment Permit, granted by Environmental Health and the EA. Under the Environmental Permitting Regulations 2010 Wirral Council has issued and monitors more than 50 permits for industrial activities across the Borough. Environmental Health and the EA ensure that the operators of the permitted processes ensure that their undertakings are done so in accordance with the conditions as described in the Environmental Permit, this includes permitted levels of certain pollutants. Smoke Control Areas Smoke control areas have been established across the majority of Wirral (Map 4). In these areas it is illegal to generate smoke from a chimney, fixed boiler or furnace. Only authorised fuels are permitted to be used in smoke control areas, or residents could face fines of up to £1000. Wirral Intelligence Service: Air Quality June 2018 Page 25 of 34
Map 4: Wirral Council Smoke Control Area

Source: https://www.wirral.gov.uk/environmental-problems/pollution-control/smoke-control-areas

Planning
Planning for both residential and industrial developments have a significant impact in air quality.
Parts of Wirral are densely built up and this has led to increasing congestion at some junctions.
By being involved at the pre planning stages of development, Environmental Health Officers can
scrutinise Environmental Impact Assessments to ensure that the impact of development on Local
Air Quality Management Objectives is considered.

The National Planning Policy Framework (NPPF) provides guidance to local planning authorities
on how to assess the impact of proposed developments. The guidance suggests that the
planning system should “contribute to and enhance the natural and local environment”, it goes on
to state that planning authorities should do this by: “preventing both new and existing
development from contributing to or being put at unacceptable risk from, or being adversely
affected by unacceptable levels of soil, air, water or noise pollution or land instability”.

The NPPF also reiterates the importance of compliance with the European Union (EU) limits
values for pollutants and the cumulative impacts on air quality from individual sites in local areas.

Wirral Intelligence Service: Air Quality                        June 2018                        Page 26 of 34
To assist on the implementation of this framework there is a series of Planning Practice Guidance
Documents, including one specifically on Air Quality. As the Council’s Core Strategy is developed
there are also opportunities to encourage, support and promote actions that will protect or
improve Air Quality.

Transport
With the creation of the Liverpool City Region there was a need to harmonise existing transport
plans, this lead to the development of ‘A Transport Plan for Growth’. Whilst the plan focuses on
transport priories, such as growth and access to opportunity, the wider strategic priorities include
health and wellbeing and air quality, taking into account the wider impacts of road transport on
health (Figure 10).

The plan details action already taken to reduce carbon and improve air quality, including
investments in emission reducing and fuel saving devices. The Liverpool City Region also has
produced a Low Emission Strategy, prioritising the use of low emission fuels and technologies.

Figure 10: Adverse links between road transport and health

               Source: Mayor of London & Transport for London ‘Valuing the health benefits of transport schemes’
                                               Transport for London, 2015

The Electric Vehicle Strategy for the Liverpool City Region is aimed at speeding up the uptake of
electric vehicles across Merseyside. Locally, Wirral council incorporated three electric vehicles in
2016, replacing other fleet vehicles. At the time of writing there are 8 publically available electric
vehicle charging points in Wirral, the locations of which can be seen on the following map.

MerseyTravel currently has 8 hybrid buses in operation and has retrofitted 31 buses to reduce
NO2 emissions with funding from Liverpool City Region. Park and ride schemes are operational at
12 train stations in the borough.

In an effort to reduce vehicle emissions among taxis, the Licensing Team at Wirral council
mandate compulsory 6-monthly MOTs for private taxi cabs aged over 6 years and Hackney
Carriages over 10 years. Anti-idling legislation has been adopted in Wirral, with enforcement
focussed around evidence-based hotspots, including roads around schools and taxi ranks.

This change will help to reduce NO2 concentrations at the Liscard site, which has exceeded EU
NO2 objectives in recent years. In concert with this legislation, the Environmental health team is
leading an educational campaign to raise awareness of the adverse impacts of idling on air
quality.

Wirral Intelligence Service: Air Quality                         June 2018                                         Page 27 of 34
You can also read