Air Quality Action Plan 2019 - 2024 - Westminster City Council

Page created by Rafael Goodwin
 
CONTINUE READING
Air Quality Action Plan 2019 - 2024 - Westminster City Council
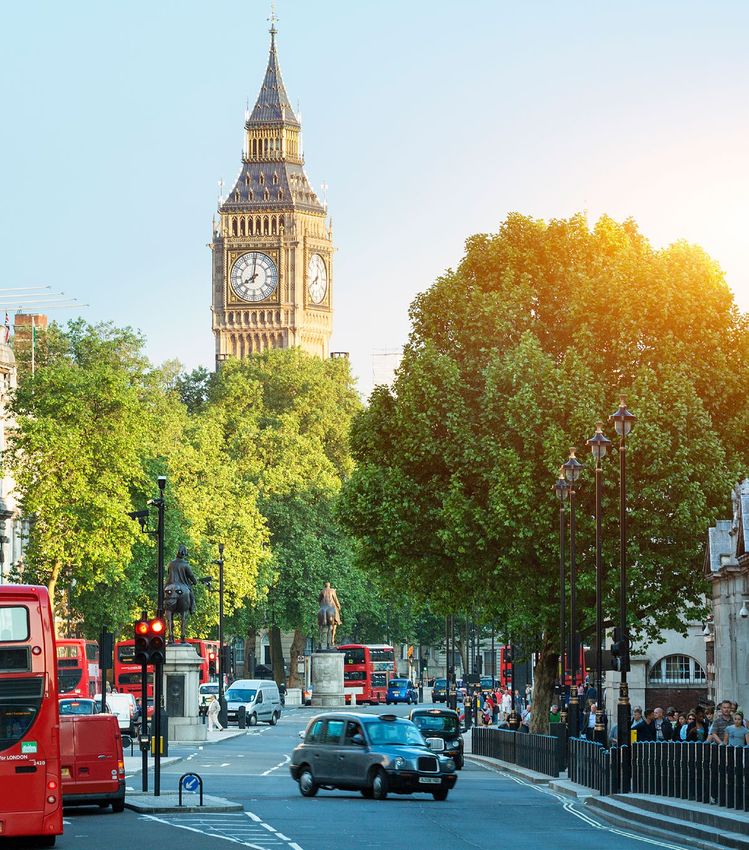
Air Quality Action Plan
2019 – 2024
Air Quality Action Plan 2019 - 2024 - Westminster City Council
Contents                                                       Foreword
           2                                                                                                                                                                                                                3

                                                                                                            Westminster has a long tradition of leading
WESTMINSTER AIR QUALITY REPORT 2019 – 2024

                                             3    Foreword
                                                                                                            the way in tackling air pollution. We were
                                             4    Introduction                                              the first local authority in the UK to officially
                                             5    Format of this Action Plan                                recognise our duties to improve air quality,
                                             6    Air quality in context                                    and we were also the first local authority
                                                                                                            to have an air quality action plan.
                                             6    What is air pollution and why is it a major issue

                                             7    The health impacts of pollution                           We must be ambitious and tenacious in our work in this area
                                                                                                            because, while it is gradually improving, air quality in Westminster
                                             8    Air quality in law: the role of local authorities         remains the worst in London. The health impacts are increasingly
                                                                                                            well understood, and the message comes across loud and
                                             8    The Westminster context                                   clear from our residents: over the last few years air quality
                                             10   Air quality and climate emergency                         has consistently been one of our residents’ top priorities.

                                             10   Air quality in London                                     We have many things to be proud of in our work to date
                                                                                                            on reducing pollution in the city. Our flagship Marylebone
                                             12   Air quality in Westminster                                Low Emission Neighbourhood scheme trialled innovative
                                                                                                            interventions, including London’s first diesel parking surcharge.        Cllr Tim Mitchell
                                             12   Modelled air quality data                                                                                                          Deputy Leader and Cabinet Member for
                                                                                                            Following clear support in a public consultation in 2017, I am
                                                                                                                                                                                     Environment and City Management
                                             14   Monitoring data and trends in Westminster’s air quality   delighted that this parking surcharge has been rolled out across
                                                                                                            Westminster. We continue to be leaders in providing electric
                                             15   Air quality data and World Health Organisation targets    vehicle infrastructure, with the largest number of charging
                                                                                                            points in the country, with more added almost every day. Our
                                             16   Westminster monitoring data                               nationally recognised behaviour change campaign #DontBeIdle
                                             18   Air quality focus areas                                   has seen thousands of motorists pledge to cut engine idling
                                                                                                            to reduce emissions, with major national companies such as
                                             20   Source apportionment                                      National Express and Deliveroo pledging their support.

                                             21   Future air quality in Westminster                         There is however, much more to be done. This plan commits
                                                                                                            Westminster to working towards World Health Organization
                                             22   Perceptions of air quality in Westminster
                                                                                                            guidelines for air pollution, which is over and above our
                                             24   The air quality action plan                               statutory duties. It focuses on how we can show leadership
                                                                                                            as a council in all our actions, as well as recognising that
                                             26   The five themes of our Action Plan                        everyone who is responsible for, and affected by, air pollution,
                                                                                                            must play some part in helping solve the problem.
                                             26   Monitoring air quality

                                             28   Reducing emissions from buildings and new development     Air pollution is something that affects everyone who lives, works
                                                                                                            in, or visits our great city. But pollution disproportionately affects
                                             30   Reducing emissions from transport                         some of the most vulnerable members of our society, including
                                                                                                            our children. That’s why I am particularly proud that this Action
                                             32   Awareness raising                                         Plan includes our commitment to spending over £1m over the
                                                                                                            next three years on reducing pollution levels around Westminster’s
                                             34   Lobbying and partnership working
                                                                                                            schools, the most ambitious scheme of its kind in London.
                                             36   The Action Plan matrix
                                                                                                            Our work with schools is just one part of this Action Plan,
                                                                                                            and I am sure you’ll be struck by the scale and depth of work
                                                                                                            being done on air quality improvement across the council.

                                                                                                            This is a living document and we will listen closely to your
                                                                                                            feedback during the public consultation and beyond, to
                                                                                                            ensure that we continue to set ourselves ambitious but
                                                                                                            achievable targets to improve the air that we all breathe.
Air Quality Action Plan 2019 - 2024 - Westminster City Council
Introduction
           4                                                                                                                                                                                         5

                                             The City of Westminster stretches from Pimlico                            However, it is vital we do not rest on our laurels; this 2019 – 2024
WESTMINSTER AIR QUALITY REPORT 2019 – 2024

                                             and Victoria in the south through the West End,                           Action Plan is designed to keep Westminster at the very forefront of
                                                                                                                       action tackling air pollution not just in London, but across the UK.
                                             Marylebone and Bayswater to Paddington and
                                             Queen’s Park in the north-west. It includes                               Air pollution is also a key concern of our residents.
                                                                                                                       In our annual City Survey, residents consistently rank
                                             London’s principal areas of government,                                   air pollution as one of their top priorities.
                                             shopping, entertainment and tourism and the
                                             headquarters of innumerable commercial                                    Air quality is being embedded across all the work of Westminster
                                                                                                                       City Council. This holds true for our overarching City for All vision
                                             and professional organisations together with                              for everyone living, working and visiting the city, to our 2015 – 2025
                                             extensive residential areas of all types.                                 Greener City Action Plan and the new strategic planning policies of
                                                                                                                       our City Plan 2019 – 2040, to new focused strategies and policies
                                             Approximately 247,000 people call Westminster their                       on topics ranging from electric vehicle charging infrastructure,
                                             home, with another 1 million people setting foot                          walking and our forthcoming Carbon Reduction Strategy.
                                             in the city at some time during every day.
                                                                                                                       It is important to note that air quality is not something we can
                                             This Air Quality Action Plan has been produced as part of                 tackle alone. As well as not respecting borough or even national
                                             our statutory duties as an Air Quality Management Area.                   boundaries, many of the factors contributing to pollution
                                             This Plan contains all the actions we will take to improve                in Westminster are beyond our control. That’s why we’re
                                             air quality in Westminster between 2019 and 2024.                         committed to working with all levels of government, businesses,
                                                                                                                       residents and everyone with a stake in the air we breathe.
                                             Westminster was the first London borough to have an air
                                             quality action plan in 2000. This iteration replaces our previous
                                             2013 – 2018 action plan. Previous action plans, our annual status         Format of this Action Plan
                                             reports highlighting successful actions and policies undertaken,
                                             and other statutory reporting on our work to tackle air quality can
                                             be found on our website: www.westminster.gov.uk/airquality
                                                                        www.westminster.gov.uk/airquality.             This Air Quality Action Plan is
                                                                                                                       split into two key parts.
                                             Some of the key achievements and milestones from across
                                             the lifespan of our 2013 – 2018 Action Plan include:
                                                                                                                       The first provides the context for Westminster’s actions on air pollution,
                                             ●    roviding London’s largest number of Electric Vehicle
                                                 P                                                                     setting out our statutory requirements as an Air Quality Management
                                                 charging points;                                                      Area, summarising the key pollutants of concern, the health impacts of
                                                                                                                       pollution and the key council policies and strategies that this Action Plan
                                             ●    elivering the Marylebone Low Emission Neighbourhood (LEN),
                                                 D                                                                     links to and how our work on air quality fits within the council’s wider
                                                 a three-year partnership programme that delivered schemes             work on creating a healthier and greener City for All. This is followed
                                                 such as London’s first diesel surcharge for pay to park bays;         by a summary of air quality levels in London before a closer look is
                                                                                                                       taken at pollution in Westminster: where pollution is, where it comes
                                             ●    aunching our nationally award-winning awareness raising
                                                 L                                                                     from, and the trends in pollution levels across the city over time.
                                                 campaign to cut unnecessary engine idling, #DontBeIdle;
                                                                                                                       The section part of this Air Quality Action Plan is the action plan
                                             ●    dopting an industry-leading Code of Construction Practice
                                                 A                                                                     itself. The action plan is split into commitments across five broad
                                                 to mitigate and manage emissions from new development;                themes: monitoring, reducing emissions from transport, reducing
                                                                                                                       emissions from buildings and new development, raising awareness,
                                             ●    nd showing leadership on air quality issues, including partnering
                                                 A                                                                     and lobbying and partnership working. Each of these five themes are
                                                 on cutting edge research on best practice across the world            introduced before the action plan matrix sets out all the actions we as
                                                 with research institutes including King’s College London.             a council are committing to taking to meet our statutory requirements
                                                                                                                       and to reduce levels of all pollutants as far as we are able to.

                                                                                                                       Finally, there are a number of appendices to this Action Plan,
                                                                                                                       including a glossary of useful terms, further details on our
                                                                                                                       Air Quality Task Group, details on the statutory consultation
                                                                                                                       undertaken for this document, and references.
Air Quality Action Plan 2019 - 2024 - Westminster City Council
Air quality in                                                                The health impacts of pollution
                                                                                                                           The health impacts of air pollution are increasingly                    Short term impacts of pollution

                                             context
                                                                                                                           well understood, from contributing to asthma
           6                                                                                                               and exacerbating other respiratory conditions to                        Short term health effects occur when weather                     7
                                                                                                                           being a factor in the onset of cancer and heart                         conditions cause pollutant levels to build up above
                                                                                                                           disease. More research is being published all the                       normal background conditions. These weather
WESTMINSTER AIR QUALITY REPORT 2019 – 2024

                                                                                                                           time which increases our understanding of how                           patterns tend to cause air pollution episodes,
                                                                                                                           air pollution can adversely influence disparate                         and these can last for several days. On days
                                                                                                                           topics, including impacting on exam results1,                           when air quality deteriorates more people
                                             What is air pollution and                                                     contributing to brain diseases such as dementia2,                       are admitted to hospital for lung and heart
                                                                                                                           and even influencing crime levels in urban areas3.                      problems while increased numbers of people
                                             why is it a major issue                                                                                                                               visit their GP and need to take more medicine.
                                                                                                                           The Department of Health’s (DH) Committee on
                                                                                                                           the Medical Effects of Air Pollutants (COMEAP)                          Long term impacts of pollution
                                             Air pollution is the release of particles and noxious                         estimated the burden of particulate matter (PM)
                                             gases into the atmosphere; these emissions can be                             air pollution in the UK in 2008 to be equivalent to                     It is now believed that the long term health effects
                                                                                                                           nearly 29,000 deaths and an associated loss of                          of air pollution are larger than the short term
                                             natural or manmade and are considered to have                                 population life of 340,000 life years lost in 20084.                    effects. These effects happen at lower pollution
                                             an effect on human health. Pollution from human                               Defra has made an initial estimate that nitrogen                        levels than the short term effects, and are often
                                                                                                                           dioxide (NO2) contributes to shortening lives by                        not noticed by people at the time the damage
                                             activity is largely the result of the combustion                              an average of around five months – ranging from                         is being done. In addition to the attribution of
                                             of fossil fuels such as coal, oil, petrol or diesel.                          healthy individuals experiencing negligible effects                     premature deaths in London to air pollution,
                                                                                                                           to susceptible individuals whose poor health is                         the long term burden of air pollution in the UK
                                             The main pollutants of concern are carbon monoxide, nitrogen dioxide,         seriously exacerbated by NO2 pollution. This overall                    can be represented as a loss of life expectancy
                                             ground level ozone, and particulate matter (small dust particles made         population burden is estimated to be equivalent                         from birth of approximately six months7.
                                             up of a variety of different chemicals and metals). Each has different        to nearly 23,500 deaths in the UK per year.
                                             sources, health effects and chemical behaviours, making the task of                                                                                   We are committed as a council to tackling all the
                                             understanding and controlling air pollution as a whole very complex.          Each year at least 10,000 premature deaths in                           environmental challenges we face in a holistic
                                                                                                                           London are in part attributable to key air pollutants,                  manner. This includes promoting actions that
                                             While it is we who produce the pollution, it is primarily the weather         and the annual health costs to society of air pollution                 will help tackle both carbon emissions and air
                                             that dictates what will happen once it is released into the air. During       in the UK was estimated to be £15 billion in 2010,                      pollution emissions in order to maximise the
                                             wet or windy conditions pollution concentrations remain low, either           with a £3.7 billion cost to the NHS5. A 2018 study                      benefits of our work on our environment.
                                             blown away, or removed from the air by rain. During still hot weather         estimated that between 2018–2035, the the total
                                             pollution is able to build up to harmful amounts, leading to what are         cumulative cost to the NHS and social care due to
                                             known as pollution episodes. Concentrations also increase in winter           PM2.5 and NO2 combined is estimated at £5.37 billion,
                                             when colder weather leads to increased emissions related to heating           rising to £18.57 billion when costs for diseases for
                                             buildings, and low winds lead to a build-up of traffic pollution in London.   which there is less robust evidence are included6.

                                                                                                                           Children are more likely to be affected by air
                                                                                                                           pollution due to relatively higher breathing and
                                                                                                                           metabolic rates as well as the immaturity of their lung
                                                                                                                           and immune system. The elderly are also vulnerable
                                                                                                                           due to the decline in organ function with age and
                                                                                                                           an increased prevalence of age-related disease.

                                                                                                                           1   https://www.pnas.org/content/115/37/9193 (retrieved 30 October 2019)
                                                                                                                           2   https://www.thelancet.com/journals/landia/article/PIIS0140-6736(16)32399-6/fulltext (retrieved 30 October 2019)
                                                                                                                           3   http://ftp.iza.org/dp11492.pdf (retrieved 30 October 2019)
                                                                                                                           4   The mortality effects of long-term exposure to particulate air pollution in the UK, Committee on the
                                                                                                                               Medical Effects of Air Pollution, Dept of Health, 2010 (https://www.gov.uk/government/uploads/system/
                                                                                                                                                                                       https://www.gov.uk/government/uploads/system/
                                                                                                                               uploads/attachment_data/file/304641/ COMEAP_mortality_effects_of_long_term_exposure.pdf)
                                                                                                                                                                         COMEAP_mortality_effects_of_long_term_exposure.pdf
                                                                                                                           5   Air Pollution: Action in a Changing Climate 2010 – Defra (https://assets.publishing.service.gov.uk/
                                                                                                                                                                                         https://assets.publishing.service.gov.uk/
                                                                                                                               government/uploads/system/uploads/attachment_data/file/69340/pb13378-air-pollution.pdf
                                                                                                                               government/uploads/system/uploads/attachment_data/file/69340/pb13378-air-pollution.pdf)
                                                                                                                           6   Estimating the costs of air pollution to the National Health Service and social care: An assessment and forecast
                                                                                                                               up to 2035, Pimpin et al, PLOS Medicine 15(7) (https://doi.org/10.1371/journal.pmed.1002602
                                                                                                                                                                                https://doi.org/10.1371/journal.pmed.1002602)
                                                                                                                           7   Air Pollution in the UK 2015 – Defra (https://uk-air.defra.gov.uk/assets/documents/annualreport/air_pollution_uk_2015_issue_1.pdf
                                                                                                                                                                     https://uk-air.defra.gov.uk/assets/documents/annualreport/air_pollution_uk_2015_issue_1.pdf)
Air Quality Action Plan 2019 - 2024 - Westminster City Council
network, and expanding our #DontBeIdle campaign.              We will support everyone in Westminster
                                             Air quality in law: the role of local authorities
                                                                                                                                                                                                                                          ●

                                                                                                                                                                                These air quality actions sit alongside other                 to increase recycling and reduce
                                                                                                                                                                                commitments on green spaces, recycling and our                the use of limited resources
                                                                                                                                                                                ActiveWestminster programme to help our residents
                                             Where local authorities suspect they have levels of pollutants exceeding                                                           and visitors lead healthier and greener lives.            ●   We will continue to campaign
           8                                 the National Air Quality Standards and Objectives, they are required                                                                                                                             against engine idling                               9
                                                                                                                                                                                More information on City for All can be found
                                             to investigate potential exceedances with a view to implementing Air                                                               on the Westminster City Council website
                                                                                                                                                                                                                  website.                    We will welcome new green
WESTMINSTER AIR QUALITY REPORT 2019 – 2024

                                                                                                                                                                                                                                          ●

                                             Quality Management Areas (AQMAs), which place on local authorities a                                                                                                                             technology and become a centre of
                                                                                                                                                                                Greener City Action Plan 2015 – 2025                          leadership for green innovation
                                             statutory duty to monitor and take action to reduce levels of pollutants.
                                                                                                                                                                                Westminster City Council’s Greener City Action            ●   We will invite new ideas from around
                                             Summary of National Air Quality Standards and Objectives                                                                           Plan (GCAP) 2015 – 2025 sets out how the City                 the world to help inform our own work
                                                                                                                                                                                of Westminster is leading the way to becoming a               and to influence government
                                              Pollutant                             Objective (UK)                                   Averaging Period   Date1                   more sustainable city. The GCAP delivers a wide-
                                                                                                                                                                                ranging programme of environmental schemes                Some of these actions have been completed,
                                                                                    200 μg m-3 not to be exceeded
                                                                                    more than 18 times a year
                                                                                                                                     1-hour mean        31 Dec 2005             and projects, and maps out a challenging agenda           such as the roll out of the diesel surcharge, while
                                              Nitrogen dioxide - NO2                                                                                                            for the future. Tackling air quality is one of the nine   many others are in progress, such as delivering
                                                                                    40 μg m-3                                        Annual mean        31 Dec 2005             themes of the GCAP, alongside a variety of other          air quality audits to all Westminster schools as
                                                                                                                                                                                workstreams driving forward our work on the               part of our £1m Schools’ Clean Air Fund.
                                                                                    50 μg m-3 not to be exceeded                                                                environment and sustainability within Westminster.
                                                                                                                                     24-hour mean       31 Dec 2004
                                                                                    more than 35 times a year
                                              Particles - PM10                                                                                                                                                                            Westminster’s Air Quality Task
                                                                                    40 μg m  -3
                                                                                                                                     Annual mean        31 Dec 2004             More information on the GCAP, including annual            Group 2016 – 2017
                                                                                                                                                                                progress reports, can be found online
                                                                                                                                                                                                               online.
                                                                                    25 μg m-3                                        Annual mean        2020                                                                              In July 2016, the then Environment and Customer
                                              Particles - PM2.5                                                                                                                 Air Quality Manifesto 2018                                Services Policy and Scrutiny Committee decided
                                                                                    Target of 15% reduction in concentration
                                                                                    at urban background locations
                                                                                                                                     3 year mean        Between 2010 and 2020                                                             to launch an investigation into air quality in
                                                                                                                                                                                In March 2018, we published our Air Quality               Westminster. The Committee knew that air quality
                                                                                    266 μg m-3 not to be exceeded                                                               Manifesto, which sets out our key priorities for work     was an area where the council had shown significant
                                                                                                                                     15 minute mean     31 Dec 2005
                                                                                    more than 35 times a year                                                                   on reducing pollution across the city and beyond. The     leadership for some time, but also knew that it was
                                                                                                                                                                                Manifesto aimed to be a point to mark where we have       one of the top concerns for Westminster residents.
                                                                                    350 μg m-3 not to be exceeded
                                              Sulphur Dioxide (SO2)
                                                                                    more than 24 times a year
                                                                                                                                     1 hour mean        31 Dec 2004             got to as a council, and provide some pledges for what
                                                                                                                                                                                we are going to do during the course of this AQAP.        In response to these concerns and to shape the
                                                                                    125 μg m-3 mot to be exceeded                                                                                                                         policy response from the council and the Mayor
                                                                                                                                     24 hour mean       31 Dec 2004
                                                                                    more than 3 times a year                                                                    Each of the ten priorities of the Air Quality             of London, an Air Quality Task Group (the Task
                                             Note: 1 by which to be achieved by and maintained thereafter
                                                                                                                                                                                Manifesto are represented in one or more of the           Group) was set up with the aim of developing
                                                                                                                                                                                actions in the action plan matrix on page 36.             the council’s understanding of air quality, and
                                                                                                                                                                                The ten priorities outlined by the Manifesto are:         identifying national and international best practice
                                                                                                                                                                                                                                          solutions that could be applied to central London.
                                                                                                                                                                                    We will extend our successful diesel
                                             The Westminster context
                                                                                                                                                                                ●

                                                                                                                                                                                    surcharge on pay and display parking                  As well as hearing from experts and from residents
                                                                                                                                                                                    across the city to help discourage diesel             on their experiences and proposals on how
                                                                                                                                                                                    vehicles from polluting Westminster                   the council could best tackle air pollution, the
                                             Westminster was the first London                                         under Part IV of the Environment Act 1995 and                                                                       Task Group also commissioned evidence from
                                             borough to have an air quality                                           to meet the requirements of the London Local              ●   We will ask those who own more than one               King’s College London (KCL): an independent
                                                                                                                      Air Quality Management statutory process. This                car to pay extra for their parking permits,           review of initiatives to improve air quality in other
                                             action plan in 2000, following                                           action plan sits within the council’s wider work on           unless they are driving low emission vehicles         cities globally, and in other London boroughs,
                                             the declaration of the whole of                                          creating a cleaner and greener city for everyone who                                                                with a view to exploring whether there are
                                                                                                                      lives in, visits or works in Westminster. A number            We will continue to invest in more                    lessons that can be applied for Westminster.
                                             the borough as an AQMA.
                                                                                                                                                                                ●

                                                                                                                      of council plans and strategies complement and                ways to encourage the use of electric
                                                                                                                      support this Air Quality Action Plan, including:              vehicles throughout the city                          The Task Group’s final report, and the
                                             As part of our AQMA duties, Westminster has                                                                                                                                                  commissioned report from King’s College
                                             produced annual status reports updating                                  City for All                                              ●   We will go further in tackling emissions              London, were published in June 2017.
                                             Government and the public on actions taken                                                                                             from all types of buildings, new and
                                             to reduce pollution levels across the borough,                           Creating a healthier and greener city is one                  old, to reduce air pollution
                                             alongside longer five-year action plans. Westminster’s                   of Westminster City Council’s five priorities
                                             previous action plans can be found online
                                                                                  online.                             in our overarching City for All strategy.                 ●   We will create low emission
                                                                                                                                                                                    zones around our schools
                                             As such, this Action Plan has been developed in                          Within the Healthier and Greener City priority
                                             recognition of the legal requirement on the local                        are actions on delivering our Schools’ Clean Air          ●   We will support residents to monitor
                                             authority to work towards air quality objectives                         Fund, expanding our electric vehicle charging                 air quality in their neighbourhoods
Air Quality Action Plan 2019 - 2024 - Westminster City Council
The Task Group made 48 recommendations                  reduced air pollution and carbon emissions,            Nitrogen Dioxide (NO2)
                                             across three themes: the health impacts of              and activities to increase green infrastructure
                                             poor air quality; Transport; and Emissions from         and green space in urban areas helps reduce
                                             Buildings. Over the lifespan of this Action Plan        air pollution as well as reducing the urban heat
                                             there is also the potential for the Task Group to be    island effect and absorbing carbon dioxide.
 10                                          reconvened to track progress of this action plan.                                                                                                                                11

                                                                                                     Air quality in London
WESTMINSTER AIR QUALITY REPORT 2019 – 2024

                                             Air quality and
                                             climate emergency                                       Air quality is a major problem
                                                                                                     across all of London: all of the 33
                                             Air quality is far from the only                        London local authority areas have
                                             environmental issue facing                              declared Air Quality Management
                                             Westminster and London as a                             Areas (AQMA), requiring them
                                             whole. In particular, the Climate                       to take action to improve air
                                             Emergency movement is another                           quality in their local areas.
                                             key challenge we were are facing.                       Air pollution is worse in the centre of
                                                                                                     London, where there is the heaviest
                                             In September 2019 Westminster City Council              concentration of traffic and buildings.
                                             committed to becoming carbon neutral by 2030
                                             and for the whole city to follow suit by 2040 – ten     The London Atmospheric Emissions Inventory
                                             years ahead of national Government targets.             (LAEI) is published by the GLA and TfL on an
                                                                                                     approximately four yearly cycle. Using a variety
                                             Climate change is a key issue for Westminster’s         of source data the latest LAEI estimates ground
                                             residents, and our 8.9 square miles of central          level concentrations of key pollutants NOx, NO2,
                                             London attracts one million visitors each day and       PM10 and PM2.5 across Greater London for the           Source: London Atmospheric Emissions Inventory (published 2019)
                                             produce more carbon emissions than the whole            year 2016, using an atmospheric dispersion
                                             of major cities such as Cardiff or Newcastle.           model. This version of the LAEI, which was             Particulate Matter (PM10)
                                                                                                     published in 2019, is the most established data
                                             We are currently working to produce a Westminster       source for modelling air quality across London.
                                             Carbon Reduction Strategy, which will form an
                                             ambition set of actions to help Westminster meet        Of the two main pollutant types of concern, in
                                             its Climate Emergency commitments and goals             central London, NO2 objectives are consistently
                                             of creating a zero carbon city. This Strategy will      breached, with exceedances in outer London tending
                                             sit alongside this Action Plan as a key pillar of our   to take place at the sides of busy roads. The UK
                                             wider work to create a cleaner and greener city.        national annual PM10 limit value is being met across
                                                                                                     London, but there are still isolated exceedances
                                             Opportunities and synergies                             of short term PM objectives at busy roads.

                                             It is important to note that there are some             The two maps below show the overall picture
                                             key distinctions between reducing carbon                in London for NO2 and PM10. Blues and greens
                                             emissions and improving air quality. Carbon             reflect areas in compliance with standards for
                                             dioxide is not considered an air pollutant, and         these pollutants; oranges, reds and darker
                                             so the actions in this action plan are not directly     represent exceedances of the annual limits.
                                             aimed at reducing CO2 levels in Westminster.

                                             However, climate emergency efforts to reduce
                                             carbon emissions and air quality work to improve
                                             the quality of the air we all breathe can be seen
                                             as two sides of the same coin. Action to reduce
                                             emissions from buildings will often result in

                                                                                                                                                            Source: London Atmospheric Emissions Inventory (published 2019)
Air Quality Action Plan 2019 - 2024 - Westminster City Council
Particulate Matter: PM10
                                             Air quality in Westminster
                                             Modelled air quality data
 12                                                                                                                                                                                                                      13
                                             The following maps essentially reflect ‘zoomed in’ versions of the London-wide maps above. These
                                             allow a greater understanding of the pollution problem in Westminster. As with the rest of London,
WESTMINSTER AIR QUALITY REPORT 2019 – 2024

                                             the highest pollution falls alongside busy roads and in the very centre of London where building
                                             density is highest. This reflects the influence of the two biggest sources of pollution, road transport
                                             and building emissions, which are explored further in the source apportionment section below.

                                             Nitrogen Dioxide (NO2)

                                                                                                                                                       Source: London Atmospheric Emissions Inventory (published 2019)

                                             Source: London Atmospheric Emissions Inventory (published 2019)

                                                                                                                                                       Source: London Atmospheric Emissions Inventory (published 2019)
Air Quality Action Plan 2019 - 2024 - Westminster City Council
Particulate Matter PM2.5                                                                 Automatic monitoring in Westminster
                                                                                                                                          Site Name                    X (m)               Y (m)              Site Type              Pollutants          Monitoring technique
                                                                                                                                                                                                                                     monitored

                                                                                                                                                                                                                                     NOx; PM10;          Chemiluminescent,
                                                                                                                                          Marylebone Road              528125              182016             Kerbside
 14                                                                                                                                                                                                                                  PM2.5; SO2          TEOM, FDMS              15

                                                                                                                                                                                                                                                         Chemiluminescent,
WESTMINSTER AIR QUALITY REPORT 2019 – 2024

                                                                                                                                                                                                                                     NOx; PM10; PM2.5;
                                                                                                                                          Horseferry Road              529802              178962             Urban Background
                                                                                                                                                                                                                                     Heavy Metals1       FDMS, BAM, Partisol

                                                                                                                                          Oxford Street                                                                                                  Chemiluminescent, BAM
                                                                                                                                                                       528276              181065             Kerbside               NOx , PM10
                                                                                                                                          (Selfridges)

                                                                                                                                                                                                                                                         Chemiluminescent
                                                                                                                                          Strand                       530785              180911             Roadside               NOx

                                                                                                                                                                                                                                                         Chemiluminescent
                                                                                                                                          Covent Garden                530444              180903             Urban Background       NOx

                                                                                                                                                                                                                                                         Chemiluminescent, BAM
                                                                                                                                          Cavendish Square             528763              181397             Roadside               NOx , PM10

                                                                                                                                          Oxford Street East                                                                                             Chemiluminescent, BAM
                                                                                                                                                                       529493              181331             Roadside               NOx , PM10
                                                                                                                                          (94 Oxford Street)

                                                                                                                                          Buckingham
                                                                                                                                                                       528709              178773             Roadside               NOx                 Chemiluminescent
                                                                                                                                          Palace Road

                                                                                                                                      Heavy Metals include: As, Cd, Co, Cr, Cu, Fe, Mn, Ni, Pb, Se, V, Zn in PM10.
                                                                                                                                      1

                                             Source: London Atmospheric Emissions Inventory (published 2019)                          Westminster’s automatic monitoring network has over several years expanded to capture
                                                                                                                                      more pollution data across the city: 2018 was the first year of data capture for our
                                                                                                                                      Cavendish Square, Oxford Street East and Buckingham Palace Road monitors.
                                             Monitoring data and trends in Westminster’s air quality
                                             While utilising detailed air quality modelling data such as the LAEI, Westminster also   Air quality data and World Health Organisation targets
                                             has statutory duties to monitor a variety of pollutants across the city.
                                                                                                                                      Air quality data is usually presented                                               The World Health Organisation (WHO) has
                                             Air pollution monitoring can be undertaken in a variety of ways. These range from        in one of two ways:                                                                 published Guidelines for air pollutants which
                                             the most accurate and expensive real-time reference method monitors, which can                                                                                               are more stringent than those set by the EU
                                             provide accurate data every 15 minutes, to the cheapest monitoring of diffusion tubes,   ●     As an annualised figure, reflecting the                                       and UK Government for PM emissions.
                                             which can provide a single figure for NO2 for up to a month of exposure.                       average concentrations of a particular
                                                                                                                                            pollutant at a particular monitoring point.                                   Although Westminster is not legally required to
                                                                                                                                                                                                                          meet WHO Guideline levels for air pollution, this
                                                                                                                                      ●     Or as the number of hours in a year                                           Action Plan commits Westminster to working to
                                                                                                                                            that pollution levels were above a                                            meet WHO Guideline levels, going above and
                                                                                                                                            particular level at a monitoring point.                                       beyond our baseline legal requirements. This
                                                                                                                                                                                                                          sets us more difficult standards to meet for PM
                                                                                                                                      Concentrations of pollutants are usually represented                                emissions; but as there are no safe levels for
                                                                                                                                      as micrograms (one-millionth of a gram) per                                         these pollutants, it is vital that we continue to
                                                                                                                                      cubic meter air, or in shortened form, μg m-3.                                      work to reduce PM emissions as far as possible.

                                                                                                                                      As the air quality in law section above explains, the                               The table below shows the main sets of
                                                                                                                                      National Air Quality Standards and Objectives set by                                Objectives and Guidelines for NO2 and PM
                                                                                                                                      the UK Government are the legal levels for pollutants                               emissions from the UK Government and WHO.
                                                                                                                                      that Westminster is seeking to meet. However,
                                                                                                                                      there is ongoing debate about at what levels
                                                                                                                                      these objectives should be set. This is particularly
                                                                                                                                      the case for Particulate Matter (PM) emissions,
                                                                                                                                      because adverse health impacts from PM have been
                                                                                                                                      documented regardless of the level of the pollutant.
Air Quality Action Plan 2019 - 2024 - Westminster City Council
Pollutant                       Objective (UK)                               Averaging Period   Set by              Legal         Line graph of Nitrogen Dioxide levels (mg m-3 )
                                                                                                                                                                  requirement
                                                                                                                                                                  to meet
                                                                                                                                                                                140
                                                                              200 μg m-3 not to be exceeded                                   EU and UK
                                                                                                                           1-hour mean                            Yes
                                                                              more than 18 times a year                                       Government*
 16                                           Nitrogen dioxide - NO2                                                                                                                                                                                                                                      17
                                                                                                                                              EU and UK                         105
                                                                              40 μg m-3                                    Annual mean                            Yes
                                                                                                                                              Government*
WESTMINSTER AIR QUALITY REPORT 2019 – 2024

                                                                              50 μg m-3 not to be exceeded                                    EU and UK
                                                                                                                           24-hour mean                           Yes
                                                                              more than 35 times a year                                       Government                         70
                                              Particles - PM10
                                                                                                                                              EU and UK
                                                                              40 μg m-3                                    Annual mean                            Yes
                                                                                                                                              Government
                                                                                                                                                                                 35
                                                                                                                                              World Health
                                                                              20 μg m-3
                                                                                                                           Annual mean                            No                                   ● Marylebone Road ● Horseferry Road ● Oxford Street ● Strand ● Covent Garden
                                                                                                                                              Organisation
                                                                                                                                                                                                                     ● Cavendish Square ● Oxford Street East ● BP Road
                                                                                                                                              EU and UK                           0
                                                                              25 μg m-3                                    Annual mean                            Yes
                                                                                                                                              Government                                          2015                                2016                             2017                 2018

                                                                                                                                              World Health
                                              Particles - PM2.5               10 μg m-3                                    Annual mean                            No            Data Trends in PM10
                                                                                                                                              Organisation

                                                                              Target of 15% reduction in concentration                        EU and UK                          Site ID                 Annual Mean Concentration (μg m-3)
                                                                                                                           3 year mean                            Yes
                                                                              at urban background locations                                   Government
                                                                                                                                                                                                         2011           2012           2013           2014       2015         2016   2017          2018

                                             *World Health Organisation NO2 Guideline is the same                                                                                Marylebone Road         41             38             33             31         30           29     27            26

                                                                                                                                                                                 Marylebone
                                                                                                                                                                                                         38             31             29             26         24           26     24            24
                                             Westminster monitoring data                                                                                                         Road FDMS

                                                                                                                                                                                 Horseferry Road         19             18             n/a            19         17           17     17            17
                                             Data trends in NO2
                                                                                                                                                                                 Oxford Street           n/a            n/a            n/a            n/a        n/a          n/a    n/a           281
                                              Site ID                   Annual Mean Concentration (μg m-3)
                                                                                                                                                                                 Cavendish Square        n/a            n/a            n/a            n/a        n/a          n/a    n/a           281
                                                                        2011              2012        2013          2014         2015         2016         2017         2018
                                                                                                                                                                                 Oxford Street East      n/a            n/a            n/a            n/a        n/a          n/a    n/a           281
                                              Marylebone Road           97                94          85            94           88           87           84           85
                                                                                                                                                                                Notes: Exceedance of the PM10 annual mean AQO of 40 μg m-3 are shown in bold.
                                              Horseferry Road           41                39          45            46           39           37           36           31      1. This data has been annualised.

                                              Oxford Street             n/a               n/a         135           143          135          87           72           63      Data trends in PM2.5
                                              Strand                    n/a               n/a         n/a           n/a          122          101          92           88
                                                                                                                                                                                 Site ID                 Annual Mean Concentration (μg m-3)
                                              Covent Garden             n/a               n/a         n/a           n/a          n/a          n/a          37           39
                                                                                                                                                                                                         2011           2012           2013           2014       2015         2016   2017          2018
                                              Cavendish Square          n/a               n/a         n/a           n/a          n/a          n/a          n/a          641
                                                                                                                                                                                 Marylebone
                                                                                                                                                                                                         25             22             20             18         16           16     15            16
                                                                                                                                                                                 Road FDMS
                                              Oxford Street East        n/a               n/a         n/a           n/a          n/a          n/a          n/a          761
                                                                                                                                                                                 Horseferry Road         13             12             12             12         10           10     9             11
                                              Buckingham
                                                                        n/a               n/a         n/a           n/a          n/a          n/a          n/a          52
                                              Palace Road                                                                                                                       Notes: Exceedance of the PM2.5 annual mean AQO of 25 μg m-3 are shown in bold.
Air Quality Action Plan 2019 - 2024 - Westminster City Council
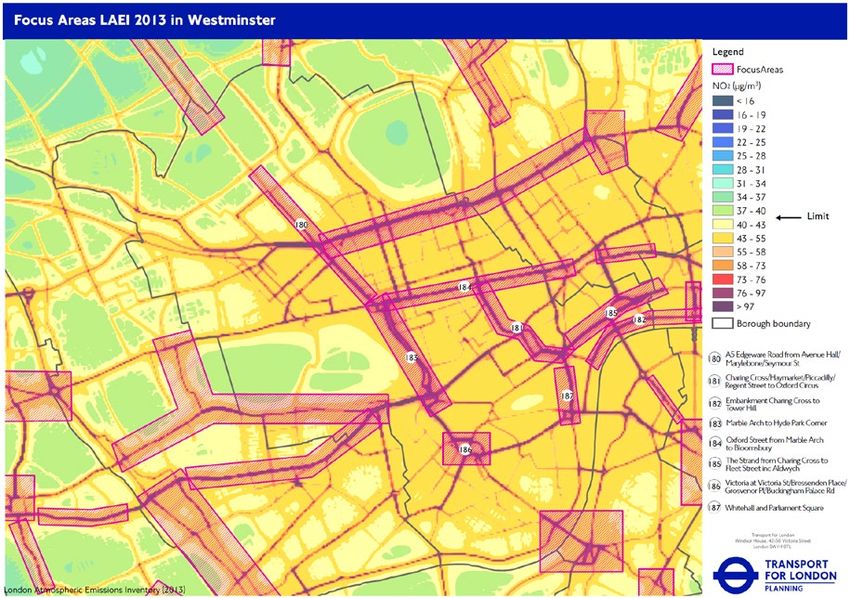
Diffusion tube monitoring                                                                                These focus areas are the subject to more stringent planning regulations for new developments
                                                                                                                                                      in Westminster’s City Plan, and several of the areas have been targeted by major public realm
                                             Westminster does not currently undertake diffusion tube monitoring. However, this                        and air quality related projects, such as the Northbank Business Low Emission Neighbourhood
                                             will be changing from 2020 and adopting a new diffusion tube monitoring network is                       along The Strand and the council’s forward-thinking plans for the Oxford Street District.
                                             one of the actions that can be found in the action plan matrix of this Plan.
 18                                                                                                                                                   While the council has regard for these focus areas, our policies and interventions are not bound by them,     19
                                             Summary                                                                                                  and other monitoring and modelled data helps inform our targeted approach to improving local air quality.
WESTMINSTER AIR QUALITY REPORT 2019 – 2024

                                             Westminster City Council meets all the national AQS objectives other than for the gas nitrogen dioxide   In particular, other key areas of concern for the council which are not GLA designated Focus Areas include:
                                             (NO2). We are currently meeting the current objectives for particulate matter (PM10 and PM2.5) but as
                                             this pollutant is damaging to health at any level, this remains a pollutant of concern. In recognition   ●   Harrow Road and the Westway
                                             that there is no safe exposure limit for particulate matter, this Action Plan commits Westminster
                                             to target compliance with World Health Organization Guidelines for PM10 and PM2.5 by 2030.               ●   West Piccadilly

                                                                                                                                                      ●   Kingsway
                                             Air quality focus areas
                                                                                                                                                      ●   All areas immediately surrounding schools and GP surgeries
                                             An air quality Focus Area is a location that has been identified as having high levels of
                                             pollution and human exposure. There are 187 in London, seven of which are in Westminster.
                                             These areas were designated by the GLA, and while they are not an exhaustive list of
                                             hotspot locations, they are where the GLA believes the problem to be most acute.

                                             Westminster’s seven air quality focus areas are:

                                             ●   Edgware Road / Marylebone Road (focus area 180)

                                             ●   Charing Cross – Piccadilly – Haymarket – Regent’s Street (181)

                                             ●   Embankment (182)

                                             ●   Marble Arch to Hyde Park Corner (183)

                                             ●   Oxford Street (184)

                                             ●   The Strand (185)

                                             ●   Victoria Station and environs (186)

                                             ●   Whitehall and Parliament Square (187)
Source apportionment                                                                                                    Future air quality in Westminster
                                             Updated source apportionment graphs and accompanying narrative                                                          The LAEI provides detailed modelling figures for future air quality levels across London. The following graphs
                                             to be included when data is released by GLA.                                                                            and tables show the modelled emissions forecast for Westminster for 2020, 2025, and 2030. A variety of
                                                                                                                                                                     inputs are included in the modelling to make these projections. For example, projections for road transport
 20                                          Source apportionment graphs below are placeholders from previous                                                        emissions are based on factors including expected uptake of electric vehicles, general technological                                                   21
                                             LAEI and have been superseded by the LAEI 2019 release.                                                                 advancement (and reduced emissions) of petrol and diesel vehicles, overall demand for private cars, and
                                                                                                                                                                     major policy developments such as the ULEZ. While no future modelling scenario is perfect, and there is
WESTMINSTER AIR QUALITY REPORT 2019 – 2024

                                             Nitrogen Dioxide                                                                                                        evidence to suggest that modelled air quality figures tend to be over-optimistic in forecasting reducing
                                                                                                                                                                     emissions levels, these projections give us valuable insight into our long-term planning for tackling air quality.
                                                               Domestic and           Other
                                                       Commercial Other Fuels         0.1%                                                                           PLEASE NOTE: the below projections are from the 2016 LAEI, which has been for some emissions data superseded by
                                                                        1.9%                                                                                         the 2019 LAEI release. We will include LAEI 2019 future projections when made available by the GLA.
                                                                                                                            Diesel LGV
                                                                                                                                  5.1%
                                                                                                                    Petrol LGV                                       NOx Emissions
                                                                                                                           0.1%
                                                                                                                Diesel Car                          TfL Bus
                                                 Domestic and                                                        7.2%                                                                     3,000
                                                                                                                                                    17.7%
                                               Commercial Gas                                                                                                                                                      Other              Emissions (Tonnes) by:         2008     2010      2013     2020     2025     2030
                                                       32.2%                                                                                                                                                       D&C Other Fuels
                                                                                                              Petrol Car                                                                                                              Road Transport                 1,531    1,377    1,135     335       210      165
                                                                                                                   3.5%                                                                                            D&C Gas
                                                                                                                                                                                                                   NRMM               Aviation                        0         0        0        0         0        0
                                                                                                       Road Transport
                                                                                                       57.9%                                         Non-TfL Bus                              2,500                Industry
                                                                                                                      Taxi                                                                                                            River                           14       16       29        29       29        29
                                                                                                                                                     and Coach
                                                                                                                     8.5%                                                                                          Rail
                                                                                                                                                     6.8%
                                                                                                                                                                                                                   River              Rail                            37       37       37        25       25       25
                                                                                                                     Motorcycle                Artic HGV                                                           Aviation
                                                                                                                                   Rigid HGV                                                                                          Industry                        0         0        0        0         0        0
                                                                                                                          0.3%                 1.5%                                                                Road Transport
                                                        NRMM           Rail   River                                                7.2%
                                                         4.6%         1.9%    1.5%                                                                                                            2,000                                   NRMM                           182      135       90        44       43        43

                                                                                                                                                                                                                                      D&C Gas                        823      720       631      453       393      401

                                                                                                                                                                     NOx Emissions (Tonnes)
                                             The graph above shows that nearly 60% of NO2 emissions come from road transport.                                                                                                         D&C Other Fuels                 53       48       37        15        11       10
                                             The largest contributors to this are TfL buses (18%), Taxis (8.5%) and diesel cars (7%).
                                                                                                                                                                                                                                      Other                           2         2        2        2         1        2
                                             Roughly one third of emissions are from Domestic and Commercial Gas sources.                                                                     1,500
                                                                                                                                                                                                                                      Total                         2,642    2,335     1,960     902       712      676
                                             Particulate matter (PM10)
                                                                                                                                                                                                                                      Notes:
                                                                                                                                                                                                                                      (D&C = Domestic and Commercial)
                                                              Resuspension C&D Dust
                                                                       1.7% 0.2%                                                                                                              1,000                                   The summary graph represents emissions from each source stacked on top of
                                                                  Other                                                                                                                                                               each other, with the total height equalling the total emissions from all sources.
                                                                                                                                                       Non-TfL Bus
                                                                   4.9%                                                                  TfL Bus                                                                                      The numbers in the table are those used to plot the graph and represent the
                                                     Domestic and                                                                                      and Coach
                                                                                                                                         6.3%          2.9%                                                                           tonnes of pollution emitted into the atmosphere in that year (T/y).
                                             Commercial Other Fuels                                                 Diesel LGV
                                                                                                    Road Transport                                                                                                                    The emissions are combined into reasonably self explanatory ‘Source Types’.
                                                              2.4%                                                       10.8%                         Artic HGV
                                                                                                    64.9%
                                                                                                                                                       0.7%                                                                           However the categories: ‘Industry’, ‘NRMM’ and ‘Other’ require further explanation:
                                                 Domestic and                                                  Petrol LGV                                                                      500
                                                                                                                                                       Rigid HGV                                                                       • Industry is the total emission from Part A and Part B
                                               Commercial Gas                                                        0.1%
                                                                                                                                                       4.5%                                                                              industrial processes, combined.
                                                       11.5%
                                                                                                                                                       Motorcycle                                                                      • Non-Road Mobile Machinery (NRMM) is the total emissions from construction
                                                                                                              Diesel Car
                                                                                                                                                       1.3%                                                                              and industrial off-road machines, combined.
                                                                                                                  11.5%
                                                                                                                                                                                                                                       • Other is the total emission from a number of small sources including
                                                        NRMM                                                                                                                                     0                                       agriculture, outdoor fires, garden emissions, forests,
                                                         10.0%                                                                                                                                        2008 2010 2013 2020 2025 2030      waste and waste transfer sites, combined.
                                                                                                                                                   Taxi
                                                                  Rail                                                Petrol Car                   17.6%
                                                                 3.3%                                                      9.2%
                                                                     River                                                                                           NOx emissions projections for Westminster - source LAEI 2019
                                                                     1.0%
                                                                                                                                                                     As Fig x shows, NOx levels are predicted to decrease rapidly between 2013 and 2020; reductions in
                                                                                                                                                                     road transport emissions (the blue bar on the graph) constitute the largest area of emissions reduction.
                                                                                                                                                                     This is due to technological advances in combustion engines for road transport vehicles, alongside an
                                             Again, Road Transport contributes nearly two-thirds of emissions, the largest polluters being Taxis                     uptake of zero emission vehicles and major policy interventions such as the Mayor of London’s ULEZ.
                                             (18%), diesel cars (12%) and diesel Light Goods Vehicles (including vans) at 11%, whilst Domestic and
                                             Commercial gas, i.e. boilers contribute 12% and Non Road Mobile Machinery (NRMM) contributes 10%.                       The second largest source of emissions, domestic and commercial gas (the red bar), are predicted
                                                                                                                                                                     to also decrease over the same period, but to a lesser extent. As a result, moving into the 2020s
                                                                                                                                                                     domestic and commercial gas is predicted to become the largest source of emissions in the city.
250                                                                                                                         % of residents citing air-quality as a local concern
                                                                                                             Emissions (Tonnes) by:         2008     2010      2013     2020     2025     2030
                                                                                          C&D Dust
                                                                                                                                                                                                     50%
                                                                                          Resuspension       Road Transport                 106.8    98.0      85.0     65.2      62.0     61.9
                                                                                          Other
                                                                                                             Aviation                        0.0      0.0      0.0       0.0      0.0       0.0
                                                                                          D&C Other Fuels
 22                                                                                                                                                                                                  38%                                                                                                                                      23
                                                                                          D&C Gas            River                           0.4      0.5       1.0      1.0      1.0       1.0
                                                                       200                NRMM
WESTMINSTER AIR QUALITY REPORT 2019 – 2024

                                                                                                             Rail                            3.0      3.0      3.0       1.0      1.0       1.0
                                                                                          Industry
                                                                                          Rail               Industry                        0.0      0.0      0.0       0.0      0.0       0.0      25%
                                                                                          River
                                                                                                             NRMM                           16.8      12.7     8.5       3.1      3.0       3.0
                                                                                          Aviation
                                                                                          Road Transport     D&C Gas                        11.7      10.7     9.2       6.5      5.6       5.7      13%

                                                                                                             D&C Other Fuels                 6.1      6.5      3.5       1.4      1.0       0.7
                                             PM10 Emissions (Tonnes)

                                                                       150

                                                                                                             Other                           4.6      4.7      4.3       5.0      5.4      20.8       0%
                                                                                                                                                                                                               2008          2009         2010          2011          2012         2013          2014         2015       2016   2017   2018
                                                                                                             Resuspension                   40.8     39.6      38.1     38.3     38.5      38.6

                                                                                                             C&D Dust                        1.4      1.3      1.5       1.9      1.9       1.9    Percentage of residents citing air-quality as a problem, 2008 to 2018. Source: Westminster City Council City Survey

                                                                                                             Total                          191.5    176.9    154.0     123.4    119.3    134.6    A review of our past City Surveys reveals that the 2018 level of concern was not
                                                                       100
                                                                                                                                                                                                   unusually low, but that the 2017 survey concerns had been exceptionally high.
                                                                                                             Notes:
                                                                                                             (D&C = Domestic and Commercial. C&D = Construction and Demolition)                    Changes in the perception of “air quality as a problem” cannot be attributed to air pollution levels as
                                                                                                             The summary graph represents emissions from each source stacked on top of             there was only a small reduction in pollution levels between 2017 and 2018. Our analysis suggests
                                                                                                             each other, with the total height equalling the total emissions from all sources.
                                                                                                                                                                                                   that the volumes and messaging in media coverage appear to be the most likely explanators of change
                                                                                                             The numbers in the table are those used to plot the graph and represent the
                                                                                                             tonnes of pollution emitted into the atmosphere in that year (T/y).
                                                                                                                                                                                                   in concerns. National media outlets were producing more coverage that was very local, practical and
                                                                        50                                                                                                                         explicitly linking air quality to health outcomes in 2017. While the level of media coverage has not
                                                                                                             The emissions are combined into reasonably self explanatory ‘Source Types’.
                                                                                                                                                                                                   dramatically decreased in 2018 and 2019, the spike in concern around air pollution in 2017 does
                                                                                                             However the categories: ‘Industry’, ‘NRMM’ and ‘Other’ require further explanation:
                                                                                                                                                                                                   seem to be linked to that year’s large-scale rise in national media attention to air pollution.
                                                                                                              • Industry is the total emission from Part A and Part B
                                                                                                                industrial processes, combined.
                                                                                                              • Non-Road Mobile Machinery (NRMM) is the total emissions from construction
                                                                                                                                                                                                   Our work on the perceptions of air quality amongst Westminster residents helps inform
                                                                                                                and industrial off-road machines, combined.                                         our wider policies and projects around air pollution. National government research and the
                                                                                                              • Other is the total emission from a number of small sources including               impacts of media coverage and campaigns indicate that future policies and projects around
                                                                         0                                      agriculture, outdoor fires, garden emissions, forests,                              environmental issues will have most traction where the issues are grounded in local life, links
                                                                             2008 2010 2013 2020 2025 2030      waste and waste transfer sites, combined.                                          with personal impacts are made explicit and where we emphasise the ability of people to make
                                                                                                                                                                                                   a difference. Air quality is a shared problem and we are committed to helping our residents take
                                                                                                                                                                                                   action to reduce their own emissions and reduce their exposure to harmful air pollution.
                                             PM10 emissions projections for Westminster - source LAEI 2019

                                             A similar picture to NOx can be seen in the projections for PM10 emissions, however the decrease
                                             in road transport PM emissions is predicted to much smaller than for NOx emissions. This is
                                             mainly because while a shift to zero emissions and electric vehicles will result in huge reductions
                                             in NOx emissions due to there being no tailpipe emissions, particulate emissions won’t decrease
                                             as much because tyre wear and brake wear are strong components of road transport PM. This
                                             emphasises the need to not view electric vehicles as a ‘silver bullet’ for air quality; rather, electric
                                             vehicles need to be encouraged as part of a wider road user hierarchy that in the first instance
                                             prioritises modal shift away from private vehicle use to walking, cycling and public transport use.

                                             Perceptions of air quality in Westminster
                                             While the array of monitoring data and modelling outlined above shows that we
                                             have a detailed picture of the air pollution problem in Westminster, it is also worth
                                             noting that our work on this agenda is strongly supported by our residents.

                                             In 2017, concern amongst Westminster residents about air pollution reached the highest
                                             levels we have recorded, with it being the number one concern. This dropped off in 2018,
                                             but air quality remains a top priority for our residents. Compared to national studies,
                                             Westminster residents are more likely to be interested in and concerned about air pollution;
                                             this is not a surprise given the high levels of pollution across central London.
The council’s vision for Westminster’s air quality
                                                               is for everyone who lives, works and visits the city
                                                               to have clean and breathable air. To achieve this,
                                                               we need to work holistically and collaboratively
 24                                                            across the council and with a variety of                                   25

                                                               external stakeholders including residents,
WESTMINSTER AIR QUALITY REPORT 2019 – 2024

                                                               businesses and other levels of government.
                                                               As with previous Action Plans, actions to improve
                                                               air quality are split into five categories:

                                                               ●   Monitoring

                                                               ●   Reducing emissions from buildings and new development

                                                               ●   Reducing emissions from transport

                                                               ●   Raising awareness

                                                               ●   Lobbying and partnership working

                                                               As part of their statutory London Local Air Quality Management
                                                               duties, the GLA has produced an air quality matrix with 38 actions for
                                                               boroughs to consider delivering locally as part of their London Local
                                                               Air Quality Management action planning obligations. Equally, there are
                                                               18 different sets of actions that will be used as criteria by the GLA in
                                                               awarding ‘Cleaner Air Borough’ status, a Mayor of London accreditation
                                                               scheme aimed at recognising local authorities that are working hard
                                                               to improve air quality within their borough. Westminster is committed
                                                               to attaining Cleaner Air Borough status through this action plan and
                                                               subsequent annual progress reports. Westminster is committed to
                                                               taking forward all 38 actions the GLA request boroughs consider taking.

                                                               This section is set out as follows:

                                                               ●   Each of the five themes is introduced, with key achievements
                                                                   over the lifetime of the last action plan highlighted, alongside a
                                                                   ‘closer look’ at one particular project or policy that encapsulates
                                                                   our work in this area. This sections also draw out some of
                                                                   work we will be prioritising through this new action plan.

                                                               ●   The action plan matrix itself sets out all the actions grouped
                                                                   by the five key themes. Additional information is provided for
                                                                   each action, including the areas of the council responsible
                                                                   for delivery, expected costs and benefits of the action,

                                             The air quality
                                                                   timeframes and key performance indicators (KPIs) for delivery,
                                                                   and which of the three Cleaner and Greener themes under
                                                                   our City for All 2020 programme each action sits under.

                                                               ●   The relevant Air Quality Manifesto commitments for
                                                                   each of the five themes are highlighted to enable us

                                             action plan
                                                                   to track our progress on these priority actions.
The five                                              Key actions from
                                                                                                   our Action Plan:
                                                                                                                                                         IN FOCUS:
                                                                                                                                                         20 years of the
 26
                                             themes of                                             ●   Introducing a new city-wide diffusion tube
                                                                                                       monitoring network to supplement our
                                                                                                       existing automatic monitoring stations
                                                                                                                                                         Marylebone Road
                                                                                                                                                                                                           27
WESTMINSTER AIR QUALITY REPORT 2019 – 2024

                                                                                                                                                         automatic monitor
                                             our Action                                            ●   Continuing to trial and test new and
                                                                                                       emerging monitoring technologies, from
                                                                                                       solar powered sensors to smartphone apps

                                             Plan                                                  ●   Creating a new online interactive map of all of
                                                                                                       Westminster’s monitoring locations and data

                                                                                                   ●   Committing to extensive pre- and post-
                                                                                                       project monitoring of the Oxford Street
                                                                                                       District to evaluate our interventions

                                             Monitoring                                            ●
                                                                                                       across this area of the city

                                                                                                       Prioritising the provision of PM2.5

                                             air quality                                               monitoring in new automatic monitors

                                                                                                   Relevant Air Quality
                                                                                                                                                         Westminster’s Marylebone Road monitoring
                                             We will continue to monitor                           Manifesto commitments                                 station has been at the cutting edge of
                                             air quality across the City of                                                                              pollution monitoring in London for over 20
                                                                                                   ●   We will support residents to monitor              years. Sitting opposite Madame Tussauds,
                                             Westminster to continually assess                         air quality in their neighbourhoods               the station was first installed in 1997, and
                                             our compliance with Air Quality                                                                             was rehoused in its current self-contained
                                                                                                                                                         air conditioned timber cabin in 2011.
                                             Limit Values, and against World
                                             Health Organisation targets.                                                                                The site has made an unparalleled contribution
                                                                                                                                                         to air quality research in the UK, and has
                                             We will utilise our air quality monitoring to                                                               been fundamental in our understanding of
                                             support and evaluate our policies and projects,                                                             emissions from traffic sources. It has provided
                                             share our data as part of the London Air                                                                    the widest range of measurements of any
                                             Quality Network, and raise awareness of short                                                               station in the UK, and provides an invaluable
                                             term and long term trends in pollution levels                                                               test location for all kinds of new measurement
                                             to our residents, businesses and visitors.                                                                  techniques. Specific discoveries in the make-up
                                                                                                                                                         of London’s pollution that the data from the
                                             We monitor numerous air pollutants at a variety                                                             Marylebone Rd site helped unearth include
                                             of locations across the city. More details on                                                               the importance of non-exhaust emissions
                                             current pollution levels and trends can be found                                                            from tyre and brake wear, and the discovery of
                                             earlier in this Action Plan. Monitoring air quality                                                         novel sources of pollution – including cooking!
                                             is crucial to assessing our statutory duties as an
                                             Air Quality Management Area. Just as important                                                              As well as capturing a massive range of
                                             is its role in evaluating the short term and long                                                           pollutants as part of our work to monitor
                                             term impacts of policies and projects that we                                                               air quality, it also monitors pollutants
                                             introduce or that impact on the city. Monitoring                                                            as part of the national Automatic
                                             air quality also allows the public to find out and                                                          Hydrocarbon Monitoring Network, the
                                             understand pollution levels across the city, and                                                            Heavy Metals Network and the UK Black
                                             helps us provide awareness raising messaging                                                                Carbon Network, amongst others.
                                             when pollution levels are especially high.
Reducing                                                Managing and mitigating emissions from new
                                                                                                     development is enshrined in a variety of our
                                                                                                     planning policies. In 2016 we introduced a Code
                                                                                                                                                          IN FOCUS:
                                             emissions                                               of Construction Practice for developers, which
                                                                                                     puts stringent requirements on developers across
                                                                                                     of host of areas including air quality. Updating
                                                                                                                                                          Westminster’s Code
                                                                                                                                                          of Construction
 28                                                                                                                                                                                                      29

                                             from buildings                                          this document to ensure we maintain industry
                                                                                                     leading standards for developers in an action in
WESTMINSTER AIR QUALITY REPORT 2019 – 2024

                                                                                                     this Plan. We also require developers to meet        Practice
                                             and new                                                 GLA standards for emissions from Non Road
                                                                                                     Mobile Machinery (NRMM), and are members
                                                                                                     of the industry leading London Low Emission

                                             development                                             Construction Partnership, which is pushing forward
                                                                                                     best practice across the construction industry.

                                                                                                     Key actions from
                                             We will mitigate and minimise
                                             emissions from both existing
                                                                                                     our Action Plan:
                                             buildings and from new development                      ●   Adopting and implementing the
                                             using a combination of policy,                              air quality policies in our ground-
                                                                                                         breaking City Plan 2019 – 2040
                                             partnership working, and specific
                                             projects and interventions.                             ●   Updating our London-leading Code of
                                             We will work towards creating a                             Construction Practice for developers
                                             net zero emission city by 2040.                         ●   Implement local scale solutions such as
                                                                                                         greening our markets and reducing emissions
                                             Emissions from buildings that are in use come               from major events and street works
                                             mainly from gas boilers. Much of the attention in
                                             terms of policy on air quality has focused in recent    ●   Deliver projects based on addressing
                                             years on transport emissions; policies such as our          indoor air pollution and reducing emissions
                                             own diesel parking surcharge and the Mayor of               from buildings with Heritage status
                                             London’s ULEZ mean that as transport emissions
                                             decrease, proportionally emissions from buildings       ●   Publish a holistic Carbon Reduction
                                             will rise. As a result we are committed to reducing         Strategy for the whole city                      In 2016 we introduced a new Code of
                                             emissions from the built environment. Emissions                                                              Construction Practice for developers.
                                             from demolition and construction work are key           ●   Investigating the adoption of a city-wide        The purpose of the new code was to
                                             sources of particulate matter, and can cause highly         definition of valuable green space, looking      monitor, control and manage the impacts
                                             localised spikes in pollution. Our new City Plan sets       at biodiversity, climate resilience, air         of construction on sites throughout
                                             the foundations for how we will approach new                pollution, well-being and social value           Westminster. The Code sets out the standards
                                             development across the city and seek to minimise                                                             and procedures to which developers
                                             and mitigate the air quality impacts of development.                                                         and contractors must adhere to when
                                                                                                     Relevant Air Quality                                 undertaking construction of major projects.
                                             As a result, this section of our Action Plan contains                                                        This helps both the council and developers
                                             commitments to reduce emissions across the              Manifesto commitments                                mitigate and minimise the environmental
                                             lifespan of buildings, from planning to construction                                                         impacts​ of development; for air quality
                                             to operation, and also commits us to help               ●   We will go further in tackling emissions         this ranges from requirements around
                                             reduce emissions from existing, older buildings.            from all types of buildings, new and             the age and emissions of construction
                                             It also includes actions on green infrastructure,           old, to reduce air pollution                     vehicles, to on site measures to minimise
                                             highlighting the connections between the built                                                               dust emissions and requirements for
                                             environment and green space within the city.                                                                 sites to monitor dust generated as part
                                                                                                                                                          of construction and demolition work.

                                                                                                                                                          Updating our Code of Construction
                                                                                                                                                          practice to keep this document at the
                                                                                                                                                          forefront of managing environmental
                                                                                                                                                          impacts of development across the
                                                                                                                                                          city is an action in this Action Plan.
Reducing                                               Key actions from                                    IN FOCUS:
                                                                                                    our Action Plan:
                                             emissions from                                             Continuing to be the leading London local
                                                                                                                                                        Westminster’s diesel
                                                                                                                                                        parking surcharge
 30                                                                                                 ●
                                                                                                                                                                                                         31

                                             transport                                                  authority for the provision of Electric
                                                                                                        Vehicle Charging Infrastructure
WESTMINSTER AIR QUALITY REPORT 2019 – 2024

                                                                                                    ●   Investigate changes to our resident parking
                                                                                                        permit structure to encourage modal shift
                                             We will implement a range of                               away from private vehicle use and discourage
                                             measures to reduce emissions                               the use of older more polluting vehicles

                                             from transport sources throughout                      ●   Updating our own procurement and
                                             the city. We will continue to be                           green fleet policies to ensure that
                                                                                                        emissions are reduced from our own
                                             leading local authority for Electric                       fleet and our major contractors’ fleets
                                             Vehicle charging provisions, and
                                             seek to continue to encourage                          ●   Investigating the potential for major
                                                                                                        changes to parking and the use of
                                             modal shift away from private                              parking bays across the city following
                                             vehicle use. We will also continue to                      our Parking Occupancy Survey 2018
                                             support major policy interventions                     ●   Implement innovative projects to reduce
                                             aimed at reducing emissions from                           emissions from non-road sources of transport,
                                             road transport sources, and also                           including those from rail, river and canal
                                             continue to call for more action
                                             where necessary from regional                          Relevant Air Quality
                                             and national Government.                               Manifesto commitments
                                             Road transport is the biggest single source of
                                             pollutants within Westminster. The geographically      ●   We will extend our successful diesel
                                             specific nature of road-related air pollution              surcharge on pay and display parking            In 2017 Westminster launched London’s first
                                             means that transport emissions also heavily                across the city to help discourage diesel       diesel parking surcharge, a 50% surcharge
                                             contribute to air pollution hotspots across the            vehicles from polluting Westminster             on pre-2015 diesel vehicles paying to park in
                                             city. It is also an area of emissions that we as a                                                         Westminster’s parking Zone F (Marylebone
                                             local authority have only limited control over,        ●   We will ask those who own more than one         and Fitzrovia). The pilot was supported by
                                             on issues ranging from the tax regime for diesel           car to pay extra for their parking permits,     local businesses and residents and was
                                             vehicles (the responsibility of central Government)        unless they are driving low emission vehicles   one of the innovative policies rolled out
                                             to allowed emissions from black taxis and buses                                                            as part of the Marylebone Low Emission
                                             (responsibility of TfL and the Mayor of London).       ●   We will continue to invest in more              Neighbourhood (see the ‘In Focus’ section
                                                                                                        ways to encourage the use of electric           of Lobbying and Partnership working below
                                             In recent years we have taken strides to reduce            vehicles throughout the city                    for more details on the LEN). After a year’s
                                             emissions from transport where we are able to.                                                             trial, where a reduction in surcharge eligible
                                             This includes a first for the UK in retrofitting our                                                       vehicles parking in Zone F decreased
                                             waste vehicle fleet to substantially reduce our own                                                        by 16% with no obvious displacement
                                             emissions, to introducing London’s first diesel                                                            of vehicles elsewhere, we consulted on
                                             parking surcharge as a trial in the Marylebone                                                             rolling this policy out across the city.
                                             area, which we have now rolled out across the
                                             city. Our work in this area links into many other                                                          Over 1,300 responses were received
                                             council policies and strategies, including our                                                             from the 2018 consultation, with a clear
                                             Walking Strategy, ActiveWestminster Strategy, and                                                          two thirds of respondents wanting us to
                                             forthcoming Electric Vehicle Charging Strategy.                                                            roll out the surcharge across the city as
                                                                                                                                                        quickly as was feasible. As a result, a 50%
                                                                                                                                                        diesel surcharge was implemented for the
                                                                                                                                                        whole of Westminster in Summer 2019, a
                                                                                                                                                        clear example of our intent to improve air
                                                                                                                                                        pollution and tackle congestion through
                                                                                                                                                        the powers available to us as a council.
Awareness raising                                        Key actions from                                        IN FOCUS:
                                                                                                      our Action Plan:
                                                                                                                                                              #DontBeIdle
 32                                          We will continue to research and                         ●   Continuing to support and disseminate                                                                  33
                                             implement wide-ranging behaviour                             information on high pollution episodes
                                                                                                          through alert systems such as airTEXT
WESTMINSTER AIR QUALITY REPORT 2019 – 2024

                                             change and awareness raising
                                             projects around air quality. We will                     ●   Raising awareness of indoor air pollution
                                             seek to inform, educate, and work                        ●   Leading on innovative behavioural
                                             with residents, businesses and                               insight projects on issues such as
                                             visitors to help enable small lifestyle                      parking to understand how to maximise
                                                                                                          the impacts of our policies
                                             changes that will both reduce
                                             peoples’ exposure to poor air quality,                   ●   Fostering closer relationships between the
                                             and help reduce their contributions                          council and Public Health professionals
                                                                                                          including GPs to raise awareness of air pollution
                                             to the city’s pollution levels.                              among traditionally hard to reach groups

                                             Informing residents, businesses and visitors
                                             about local air pollution levels can help protect        Relevant Air Quality
                                             those who are most sensitive to its health
                                             impacts. Increasing the public’s understanding           Manifesto commitments
                                             of the sources and effects of air pollution can
                                             also influence changes in behaviour which can            ●   We will continue to campaign
                                             help improve air quality, for example modal                  against engine idling
                                             shift changes away from private vehicle trips
                                             and towards other more sustainable forms of
                                             travel which will result in decreased pollution.

                                             The impacts of awareness raising projects on                                                                     Our #DontBeIdle awareness raising
                                             actual behaviour can be difficult to measure                                                                     and behaviour change campaign is one
                                             and quantify. But many of the messages around                                                                    of Westminster’s most recognisable
                                             increasing public awareness of air pollution tie in to                                                           campaigns and brands. Launched in 2017,
                                             other council behaviour change priorities: a major                                                               #DontBeIdle focuses on the small steps
                                             example is the importance of supporting healthy                                                                  that everyone can take to improve local
                                             lifestyles through increased walking and cycling.                                                                air quality, namely through encouraging
                                                                                                                                                              people to cut engine idling, which is an
                                             Partnering with Public Health is particularly                                                                    entirely unnecessary source of pollution.
                                             important as a way to increase awareness around
                                             air pollution; health professionals are trusted and                                                              The campaign, with its distinctive black
                                             independent voices who are able to help us reach                                                                 branding and celebrity endorsements,
                                             out to those members of the community that are                                                                   has seen over 14,000 individuals sign the
                                             most adversely affected by air pollution, such as the                                                            #DontBeIdle pledge to reduce engine
                                             elderly, and those who are hardest to reach, such                                                                idling. 2019 saw a renewed focus on
                                             as those whose English is not their first language.                                                              businesses signing up to the campaign,
                                                                                                                                                              with Deliveroo and National Express among
                                                                                                                                                              the companies pledging to work with the
                                                                                                                                                              council to reduce idling within their fleets.

                                                                                                                                                              The campaign has been recognised by industry
                                                                                                                                                              peers, from winning a London Transport Award
                                                                                                                                                              2017 to a national PR Moment Award 2018,
                                                                                                                                                              and is an example of Westminster leading the
                                                                                                                                                              way nationally on tackling air pollution through
                                                                                                                                                              emphasising the simple steps members
                                                                                                                                                              of the public can take to reduce their own
                                                                                                                                                              contributions to London’s air pollution.
You can also read