An Economic & Environmental Analysis of the JetBlue Airways Ground Support Vehicles: A Proposed Implementation of a Cleaner-Burning Fleet - Duke ...
←
→
Page content transcription
If your browser does not render page correctly, please read the page content below
An Economic & Environmental Analysis of the
     JetBlue Airways Ground Support Vehicles: A
    Proposed Implementation of a Cleaner-Burning
                                                          Fleet

                                                       Prepared by:
                                                     Sara Lindenfeld1
                                                       Michelle Tran
                             Master of Environmental Management Candidates
                                       Nicholas School of the Environment
                                                     Duke University

                                                       Prepared for:
                                                Dr. Jay Golden, Advisor
                                            Dr. Timothy Johnson, Advisor
                                  Sophia Mendelsohn, Head of Sustainability
                                                     JetBlue Airways

1
 Sara Lindenfeld has been engaged by JetBlue Airways Corporation as a consultant since May 2014, supporting the company’s
Sustainability team on a variety of projects. The data discussed and analyzed in this report were gathered during the course of
that consulting engagement, and used here with permission from JetBlue. The analysis, conclusions, and views expressed in
this report are those of the authors, and do not necessarily reflect those of JetBlue.

                                                                                                                      Page | 1
Masters project submitted in partial fulfillment of the requirements for the Master of
Environmental Management degree in the Nicholas School of the Environment of Duke
                                       University

                                       May 2015

                                                                                   Page | 2
Executive Summary
JetBlue Airways Corporation, a Fortune 500 company based in New York City, is an airline that services
87 destinations across the U.S., Caribbean, and Latin America. From 2010 to 2014, JetBlue has made its
overall operations increasingly more energy efficient, resulting in an 8.3% decline in greenhouse gas
emissions intensity ratio (metric tons CO2-eq per 1,000 revenue ton miles flown), which has also saved
the company millions of dollars in operating costs. As JetBlue continues to enhance its efforts to couple
sustainability with economic value, a logical next step was to evaluate JetBlue’s ground fleet for
potential improvement.
Our analysis focused on ground support operations at JetBlue’s Terminal 5 at John F. Kennedy
International Airport (JFK) in New York. Responsible for 13,800 metric tons of CO2-eq emissions, the
function of ground support equipment (GSE) vehicles is to service the aircraft between flights. Our study
included the three most used vehicle types—bag tug, belt loader, and push back tug—as they offered
the largest opportunity for savings. Our study explored the economic and environmental opportunities
associated with replacing current gasoline and diesel-powered GSE vehicles with electric vehicles, also
called eGSE.
This report first provides background on JetBlue Airways, its environmental impacts, and the airline’s
sustainability program. It provides general emissions trends within the transportation sector before
narrowing in on ground vehicles, where it details their specific function and describes emissions
standards that apply to off-road GSE.
The report then details the first step within our analysis in which we review JetBlue-provided GSE data,
including a system-wide inventory and ground fuel expenditures dataset by airport. This report
summarizes this data by describing the composition of JetBlue’s JFK ground vehicles by function,
quantity, and energy inputs.
We then consider energy reduction strategies for the GSE fleet by describing available alternative fuel
sources and evaluating relevant efforts by other airlines and airports. The next stage of our analysis
consisted of interviews with JetBlue employees and associated business partners and stakeholders,
whose commentary and feedback have been integrated into the report. Data was also recorded on the
ground at JFK to better understand the operation and retrieve accurate daily vehicle usage data.
In the final stage of the analysis, all data was synthesized into a model that estimated how much
gasoline or diesel the average bag tug, belt loader, and push back tug is using, as well as how much
JetBlue spends per vehicle in powering it annually. Based off data from a GSE manufacturer, we
calculated what the energy costs savings would be if all vehicles would run off of electricity instead of
gasoline or diesel. Lastly, we modeled eight scenarios in which JetBlue would change a portion of their
fleet to electric, and for each scenario the model projected fuel costs and emissions savings.
Page | 3Based on the incentives described in this report, we recommend the following for JetBlue’s GSE fleet at
JFK:
1. Pursue push back electrification secondary to bag tug and belt loader
2. Launch pilot to test 1 charger, 2 belt loaders, and 1 bag tug at JFK
3. Apply for the FAA’s Voluntary Airport Low Emissions Program (VALE) funding
4. Set goal of 20% electric bag tugs and belt loaders in 3-year period (by 2019), replacing vehicles
as they retire. In a worst case scenario where JetBlue receives no funding and pays the higher
cost for all new vehicles instead of refurbished, JetBlue will save roughly $1.7 million and 36,500
metric tons of CO2-eq emissions across a 14-year timeline.
5. Set goal of 50% electric belt loaders and bag tugs in a 7-year period (by 2023), replacing vehicles
as they retire. In a worst case scenario where JetBlue receives no funding and pays the higher
cost for all new vehicles instead of refurbished, JetBlue will save roughly $4.3 million and 89,200
metric tons of CO2-eq emissions across a 14-year timeline.
6. Research feasibility of retrofitting 100% electric belt loaders, bag tugs, and push backs, replacing
vehicles are they retire. This can maximize the opportunity to save roughly $7 million in fuel
costs (assuming funding is received) and over 60,000 metric tons of CO2-equivalent emissions
over 14 years.
Page | 4Table of Contents
EXECUTIVE SUMMARY ................................................................................................................................................. 3
LIST OF TABLES ............................................................................................................................................................... 7
LIST OF FIGURES ............................................................................................................................................................ 8
1. INTRODUCTION......................................................................................................................................................... 9
1.1 OVERVIEW OF PROJECT ......................................................................................................................................... 9
1.2 RESEARCH OBJECTIVE............................................................................................................................................. 9
2. CLIENT INTRODUCTION ........................................................................................................................................ 9
2.1 JETBLUE AIRWAYS: AN OVERVIEW ...................................................................................................................... 9
2.2 JETBLUE SUSTAINABILITY PROGRAM ................................................................................................................ 10
2.3 REPORTED EMISSIONS ........................................................................................................................................ 11
2.4 FUEL SAVINGS INITIATIVES ................................................................................................................................. 11
3. METHODOLOGY ..................................................................................................................................................... 12
3.1 LITERATURE RESEARCH ........................................................................................................................................ 12
3.2 INTERNAL AND EXTERNAL INTERVIEWS ............................................................................................................ 12
3.3 GROUND OBSERVATIONS AND DATA ANALYSIS ............................................................................................. 13
3.4 FINANCIAL AND ENVIRONMENTAL MODELING ............................................................................................... 13
4. SUMMARY OF LITERATURE RESEARCH ....................................................................................................... 13
4.1 TRENDS IN TRANSPORTATION EMISSIONS ...................................................................................................... 13
4.2 A GROWING AVIATION INDUSTRY ................................................................................................................... 14
4.3 INCREASES IN ALTERNATIVE FUEL VEHICLES ................................................................................................... 14
4.4 INTRODUCTION TO GROUND SUPPORT EQUIPMENT (GSE)........................................................................ 15
4.4.1 GSE Definition ......................................................................................................................................... 15
4.4.2 Most Common GSE Vehicles ............................................................................................................ 15
4.4.3 Regulations on GSE Emissions: Clean Air Act ........................................................................... 16
4.4.4 Federal GSE Emissions Standards ................................................................................................... 17
Page | 54.4.5 California GSE Emissions Standards .............................................................................................. 17
4.4.6 Health Implications of Diesel and Gasoline Exhaust ............................................................. 17
4.4.7 Reducing GSE Emissions Through Add-On Technologies .................................................. 18
4.4.8 Alternative Fuel Technologies .......................................................................................................... 18
4.4.9 Defining Alternative Fuels .................................................................................................................. 18
4.4.10 Electric GSE (eGSE).............................................................................................................................. 19
4.4.11 Airline Industry Trends in GSE Electrification ......................................................................... 19
4.4.12 Voluntary Airport Low Emissions (VALE) Federal Funding Program ............................ 21
5. BASELINE ANALYSIS ............................................................................................................................................... 22
5.1 JetBlue Current GSE Fleet ...................................................................................................................... 22
5.2 Long Beach Electric Vehicles ................................................................................................................ 23
5.3 GSE by Vehicle Type at JFK Airport .................................................................................................. 24
5.4 Baseline Greenhouse Gas (GHG) Emissions................................................................................... 25
5.5 CO2-eq and pollutants at JFK Airport .............................................................................................. 26
6. FINANCIAL AND ENVIRONMENTAL MODELING APPROACH ........................................................................... 27
6.2 Scenario Analyses ...................................................................................................................................... 28
7. RESULTS ..................................................................................................................................................................... 32
7.1 Scenario Analysis Results ....................................................................................................................... 32
7.2 Summary of Scenario Analysis Results ............................................................................................ 44
8. DISCUSSION ............................................................................................................................................................. 44
8.1 Recommendations .................................................................................................................................... 44
8.2 Additional considerations ...................................................................................................................... 45
8.3 Applicability of recommendations to other locations .............................................................. 47
APPENDICES .................................................................................................................................................................. 50
Appendix A-1: Airport Names and Abbreviations ............................................................................. 50
Appendix A-2: Energy Price Assumptions by Airport location..................................................... 50
Appendix A-4: CO2 Intensity Factors by Airport Location .............................................................. 51
Appendix A-5: GSE Lifetime ......................................................................................................................... 52
Page | 6Appendix A-6: New and Refurbished Purchasing Price .................................................................. 52
Appendix A-7: JetBlue GSE Inventory ...................................................................................................... 52
Appendix B: Other Alternative Fuels Considered ............................................................................... 53
List of Tables
TABLE 1. CO2-EQUIVALENT EMISSIONS PER 1,000 REVENUE TON MILES, 2010-2014. ...................................................... 11
TABLE 2. AIR AND GROUND EMISSIONS (2014) ............................................................................................................................. 26
TABLE 3. EMISSION TYPE BY GLOBAL WARMING POTENTIAL (GWP) ......................................................................................... 26
TABLE 4. ANNUAL EMISSIONS AND CO2-EQ EMISSIONS AT JFK AIRPORT FROM GSE FUEL USE (2014) ......................... 26
TABLE 5. SCENARIO A: TOTAL NUMBER OF VEHICLES TO RETROFIT............................................................................................ 28
TABLE 6. SCENARIO C PURCHASING SCHEDULE .............................................................................................................................. 29
TABLE 7. SCENARIO C: TOTAL NUMBER OF VEHICLES TO RETROFIT ............................................................................................ 29
TABLE 8. SCENARIO E EGSE PURCHASING SCHEDULE.................................................................................................................... 30
TABLE 9. SCENARIO E: TOTAL NUMBER OF VEHICLES TO RETROFIT ............................................................................................ 30
TABLE 10. SCENARIO F: EGSE PURCHASING SCHEDULE ................................................................................................................ 30
TABLE 11. SCENARIO E: TOTAL NUMBER OF VEHICLES TO RETROFIT .......................................................................................... 30
TABLE 12. SCENARIO G PURCHASING SCHEDULE............................................................................................................................ 31
TABLE 13. SCENARIO G: TOTAL NUMBER OF VEHICLES TO PURCHASE....................................................................................... 31
TABLE 14. SCENARIO H PURCHASING DECISION............................................................................................................................. 31
TABLE 15. SCENARIO H: TOTAL NUMBER OF VEHICLES TO PURCHASE....................................................................................... 31
TABLE 16. SCENARIO A: FINANCIAL SUMMARY ............................................................................................................................... 33
TABLE 17. SCENARIO B: FINANCIAL SUMMARY ............................................................................................................................... 35
TABLE 18. SCENARIO C: FINANCIAL SUMMARY ............................................................................................................................... 36
TABLE 19. SCENARIO D: FINANCIAL SUMMARY............................................................................................................................... 38
TABLE 20. SCENARIO E: FINANCIAL SUMMARY................................................................................................................................ 39
TABLE 21. SCENARIO F: FINANCIAL SUMMARY................................................................................................................................ 40
TABLE 22. SCENARIO G: FINANCIAL SUMMARY............................................................................................................................... 42
TABLE 23. SCENARIO H: FINANCIAL SUMMARY............................................................................................................................... 43
TABLE 24. SUMMARY TABLE OF SCENARIO ANALYSIS RESULTS.................................................................................................... 44
Page | 7TABLE 25. SUMMARY OF EMISSIONS REDUCTIONS FROM DIFFERENT FUEL SOURCES. ............................................................ 54
List of Figures
FIGURE 1. U.S. GHG EMISSIONS BY SECTOR. .................................................................................................................................. 13
FIGURE 2. U.S. GHG EMISSIONS IN TRANSPORTATION SECTOR BY MODE. .............................................................................. 14
FIGURE 3. LIGHT-DUTY ALTERNATIVE FUEL VEHICLES (FVS), HYBRID ELECTRIC VEHICLES (HEVS) AND DIESEL MODEL
OFFERINGS, BY FUEL TYPE .......................................................................................................................................................... 15
FIGURE 4: JETBLUE BAG TUG, BELT LOADER, AND PUSH BACK SERVICING AN AIRCRAFT ....................................................... 16
FIGURE 5. JETBLUE GSE ELECTRIFICATION COMPARISON TO NEW YORK AND NATIONWIDE TRENDS................................. 20
FIGURE 6. JFK MOTORIZED GSE BY VEHICLE TYPE......................................................................................................................... 24
FIGURE 7. APPROXIMATE TOTAL ANNUAL FUEL EXPENDITURES AT JFK BY GSE TYPE (2014) .............................................. 25
FIGURE 8. APPROXIMATE PER VEHICLE ANNUAL FUEL SPEND AT JFK BY GSE TYPE (2014) ................................................. 25
FIGURE 9. SCENARIO A: COMPARISON OF ACCRUED OPERATING COSTS, ICE VS. ELECTRIC ................................................. 33
FIGURE 10. SCENARIO A: COMPARISON OF ANNUAL OPERATING COSTS, ICE VS. ELECTRIC ................................................ 33
FIGURE 11. SCENARIO B: COMPARISON OF ACCRUED OPERATING COSTS, ICE VS. ELECTRIC ............................................... 34
FIGURE 12. SCENARIO B: COMPARISON OF ANNUAL OPERATING COSTS, ICE VS. ELECTRIC ................................................. 34
FIGURE 13. SCENARIO C: COMPARISON OF ACCRUED OPERATING COSTS, ICE VS. ELECTRIC ............................................... 36
FIGURE 14. SCENARIO C: COMPARISON OF ANNUAL OPERATING COSTS, ICE VS. ELECTRIC ................................................ 36
FIGURE 15. SCENARIO D: COMPARISON OF ACCRUED OPERATING COSTS, ICE VS. ELECTRIC ............................................. 37
FIGURE 16. SCENARIO D: COMPARISON OF ANNUAL OPERATING COSTS, ICE VS. ELECTRIC ................................................ 37
FIGURE 17. SCENARIO E: COMPARISON OF ACCRUED OPERATING COSTS, ICE VS. ELECTRIC ............................................... 38
FIGURE 18. SCENARIO E: ANNUAL AND TOTAL ANNUAL FUEL SAVINGS ................................................................................... 38
FIGURE 19. SCENARIO F: COMPARISON OF ACCRUED OPERATING COSTS, ICE VS. ELECTRIC ............................................... 40
FIGURE 20. SCENARIO F: COMPARISON OF ANNUAL OPERATING COSTS, ICE VS. ELECTRIC ................................................. 40
FIGURE 21. SCENARIO G: COMPARISON OF ACCRUED OPERATING COSTS, ICE VS. ELECTRIC .............................................. 41
FIGURE 22. SCENARIO G: COMPARISON OF ANNUAL OPERATING COSTS, ICE VS. ELECTRIC ................................................ 42
FIGURE 23. SCENARIO H: COMPARISON OF ACCRUED OPERATING COSTS, ICE VS. ELECTRIC .............................................. 43
FIGURE 24. SCENARIO H: COMPARISON OF ANNUAL OPERATING COSTS, ICE VS. ELECTRIC ................................................ 43
Page | 81. Introduction
1.1 Overview of Project
This analysis describes the energy use associated with JetBlue Airways’ ground support equipment (GSE)
and evaluates options by which the airline may reduce both energy costs and related environmental
impacts. The analysis benchmarks JetBlue Airways’ ground support equipment (GSE) fleet and fuel
consumption, details the technical and regulatory landscape of ground support vehicle emissions and
energy use, provides recommendations for reducing the costs and emissions associated with their GSE
fleet, and presents implementation options for financing the retrofit and updating airport operations to
accommodate alternative fuel vehicles.
Problem Statement
JetBlue seeks to reduce both cost and environmental impact of its ground operations.
1.2 Research Objective
This report seeks to solve a two-fold problem:
1. Reduce the cost of ground operations at JetBlue.
Given the significant operating costs, airlines operate on a thin profit margin and are very receptive to
cost saving measures. Currently, 96% of JetBlue’s GSE are powered by gasoline and diesel, which to date
are more expensive on a per energy unit basis than electricity. Further, electricity is less susceptible to
changing prices, whereas gasoline and diesel exhibit large and uncertain cost variability.
2. Reduce the environmental impact of ground vehicles.
The ground vehicles that constantly drive around airports to service aircraft have a significant
environmental impact. Operating JetBlue’s GSE fleet at JFK results in roughly 13,800 metric tons of CO2-
eq emissions. In addition, reducing ground criteria pollutant emissions from ground vehicles could
lessen the presence of related NOx and particulate matter in the air surrounding the ramp area,
potentially enhancing the working conditions of ground operations crewmembers.
2. Client Introduction
2.1 JetBlue Airways: An Overview
Our client is JetBlue Airways Corporation, a Fortune 500 company that operates out of 87 destinations in
the U.S., Caribbean, and Latin America as of December 2014. Its primary operations, called “Focus
Page | 9Cities”, are New York City, NY; Boston, MA; Fort Lauderdale/Hollywood, FL; Los Angeles (Long Beach),
CA; Orlando, FL; and San Juan, Puerto Rico. JetBlue carries more than 32 million revenue passengers,
with an average of 825 flights per day (JetBlue Airways, 2015).
JetBlue operates three types of narrow-body aircraft, with a fleet comprised of the following aircraft as
of December 31, 2014:
130 Airbus 320 (150 passengers)
13 Airbus 321 (either 159 or 190 passengers)
60 Embraer 190 (100 passengers)
For 2014, JetBlue reported $5.8 billion in operating revenue, with $401 million in net income (JetBlue
Airways). This significant difference is in part due to the high costs of jet fuel and labor, challenges that
all commercial airline carriers face.
2.2 JetBlue Sustainability Program
JetBlue operates a Sustainability program that began publishing an annual responsibility report in 2006.
In 2013, the airline added a full-time Sustainability Manager to direct the program.
As stated on the program’s website www.jetblue.com/green, JetBlue’s Sustainability Program is based
on the concept that their operations and success as a business are dependent upon natural resources,
such as energy, water, metals that create aircraft, and the beautiful natural destinations they serve.
In order to protect the long-term health of these natural resources, JetBlue Sustainability has
established the following initiatives, as detailed on www.jetblue.com/green:
Conserve jet fuel and improve fleet efficiency;
Offset some aircraft emissions (since 2008, JetBlue has offset more tan 350 million pounds of CO2-eq
emissions)
Recycle on all domestic flights;
Compost in JFK’s Terminal 5;
Report and be transparent about environmental impact data;
Provide products onboard and sold in terminals that are local to their focus cities, and are
sustainably sourced;
Reduce energy consumption in ground support centers and corporate offices;
Because 80% of their route network lies along the coast and one-third is to destinations in the
Caribbean, develop an ocean conservation strategy and partner with ocean-focused non-profits.
Page | 102.3 Reported Emissions
In 2014, JetBlue’s operations resulted in over 6.3 million metric tons of CO2-eq emissions (JetBlue, 2015).
JetBlue normalizes this value by calculating GHG emissions divided by Revenue Ton Miles (RTM) where
RTM = weight in tons of revenue traffic transported (customers and cargo) multiplied by miles flown.
Table 1 demonstrates a declining trend in GHG emissions on a normalized basis.
Metric Tons CO2-eq per 1,000 Revenue Ton Miles*
GHG emissions/RTM (Metric tons
Year Revenue ton miles (RTM) CO2e/1,000 RTM)
2010 2,856,971,982 1.68
2011 3,095,234,716 1.67
2012 3,376,303,538 1.65
2013 3,612,193,124 1.65
2014 4,113,747,082 1.54
*Revenue ton miles = weight in tons of revenue traffic transported (customers and cargo)
multiplied by miles flown.
Source: JetBlue 2014 Responsibility Report
Table 1. CO2-Equivalent Emissions per 1,000 Revenue Ton Miles, 2010-2014.
JetBlue’s GHG emissions can also be represented as CO2-eq emissions per passenger mile of the total
fleet through the following calculation:
6,318,653 GHG emissions / 37.8 billion revenue passenger miles
= 0.368 pounds CO2-eq per revenue passenger mile
While the vast majority of the above emissions can be attributed to the emissions associated with the
combustion of the petroleum-based jet fuel that powers all their flights, roughly 0.6% of reported
emissions are associated with ground operations. Approximately 25,200 metric tons of CO2-eq
emissions, or 0.4% are Scope 2 emissions associated with generation of electricity that powers their
terminals, support centers, and offices. Roughly 13,800 metric tons of CO2-eq emissions, or 0.2%, are
emissions associated with the combustion of gasoline and diesel for the ground support vehicles that
JetBlue operates. This last value is the emissions quantity our analysis aims to reduce.
2.4 Fuel Savings Initiatives
Jet fuel remains one of the largest costs to the airline industry. Based on a 2008 survey of 45 major
airlines by the International Air Transport Association (IATA), fuel costs represented roughly one-third of
Page | 11total operating costs (IATA, 2010). A 2013 assessment conducted by Boeing states that fuel costs have
nearly doubled in the past 10 years, with fuel representing up to 30 percent for single-aisle aircraft and
up to 50 percent for wide body (IAA, 2013). As a response to high fuel expenditures and severe financial
pressures, airlines and aircraft manufacturers have significantly increased the fuel efficiency of their
planes and operations on a passenger-mile basis. Since the first jets were developed in the 1960s,
aircraft have become approximately 70% more fuel efficient per seat-kilometer (ATAG, 2011).
In a consolidated effort to further reduce their fuel burn, the airline launched an internal initiative in
2014 called “Fuel Is Everyone’s Business”. Through this effort, JetBlue introduced changes in the way
they purchase, consume, and track fuel. Through the initiative, the airline implemented multiple trials
throughout 2014 that together resulted in $2.5 million in fuel savings, equivalent to roughly 4,900
metric tons of avoided CO2-eq emissions with the assumption of $5 per gallon of jet fuel (JetBlue, The
Blue Review - 2014 Responsibility Report).
To date, this emphasis on fuel savings has not extended to the ground support fleet.
3. Methodology
3.1 Literature research
The first phase of our literature approach consisted of in-depth research into the field of ground support
equipment. We focused on governmental reports, with much information being provided by Report 78:
Airport Ground Support Equipment (GSE) Emission Reduction Strategies, Inventory, and Tutorial by the
Airport Cooperative Research Program (ACRP), sponsored by the Federal Aviation Administration (FAA).
Our research focused on understanding the various GSE functions, how the equipment operates
technically, regulations GSE might be subject to, and opportunities for funding or partnerships. The
second phase of our literature research consisted of a competitive analysis of what other airlines and
airports have done in the space while considering alternative fuel GSE.
3.2 Internal and external interviews
We held informational interviews with employees within JetBlue as well as some of its suppliers and
associated stakeholders. We spoke with JetBlue employees across multiple teams and functions,
including representatives from JetBlue’s JFK Ground Operations staff, General Managers from multiple
airports, and the Sourcing, Finance, and Sustainability teams at JetBlue’s corporate headquarters.
External interviews included conversations with one of JetBlue’s suppliers of GSE vehicles as well as a
representative from the Port Authority of New York and New Jersey.
Page | 123.3 Ground observations and data analysis
We analyzed JetBlue-provided GSE data, including a system-wide inventory and ground fuel
expenditures dataset by airport. This report summarizes this data by describing the composition of
JetBlue’s JFK ground vehicles by function, quantity, and energy inputs. In order to gather additional data,
a day was spent at JFK on the tarmac gathering vehicle usage data and viewing the operations from the
ground.
3.4 Financial and environmental modeling
We developed a model to synthesize all our collected data, develop a baseline calculation, and project
the environmental and financial impact if JetBlue were to pursue alternative fuel options for their GSE
fleet. Specifically, the model estimated how much gasoline or diesel the average bag tug, belt loader,
and push back tug use on an annual basis, as well as how much is spent per vehicle in powering each
GSE unit. Based off data from a GSE manufacturer, we then modeled what the energy costs would be if
the vehicles ran the exact same distance but instead using electricity as an energy input. Further, we
modeled eight scenarios in which JetBlue would change a portion of their fleet to electric, and for each
course of action we projected fuel costs and emissions savings.
4. Summary of Literature Research
4.1 Trends in Transportation Emissions
The transportation sector is the second biggest source of greenhouse gas emissions (GHG) in the United
States, accounting for 33% as of 2009 (Figure 1).
Commerical Other
4% 1%
Residential
6%
Electricity
Industrial Generaton
15% 41%
Transportation
33%
Source: ACRP Report 11 (2009)
Figure 1. U.S. GHG Emissions by Sector.
Page | 13The aviation industry accounts for 11% of transportation emissions (ACRP, 2012). Of total transportation
GHG emissions, ground vehicles (which are mostly on-road but also include airport GSE) comprise 56%
(Figure 2), making it the largest source of transportation GHG emissions. These emissions associated
with ground vehicles use the atmosphere as a sink, which is the most significant sustainability issue
material to the transportation industry.
Commercial Rail Other
airlines 3% 4%
11%
Transit buses
1%
Personal Automobiles
Truck 54%
27%
Source: ACRP Report 11 (2009)
Figure 2. U.S. GHG Emissions in Transportation Sector by Mode.
4.2 A Growing Aviation Industry
The aviation industry is steadily growing, with airlines expecting global passenger demand to increase by
31% - thus an additional 930 million customers - between 2012 and 2017 (IATA, 2013). As the industry
grows to accommodate this demand, we assume growth in associated airline operations on the ground
will be necessary. For the average gate at JetBlue, two belt loaders, one bag tug and one push back (for
description of these vehicle functions, see Section 4.4.2. Most Common GSE Vehicles)) is dedicated to an
aircraft between flights. If JetBlue grows according to IATA projections, then they will have an additional
256 flights per day. While some existing ground vehicles can be used to service these additional flights,
in many airports vehicles are already used to capacity and more will need to be purchased to meet this
growing demand. If current operations remain unchanged, we would thus expect the associated
greenhouse gas emissions from gasoline and diesel-powered GSE vehicles to also increase.
4.3 Increases in Alternative Fuel Vehicles
Due to various incentives, regulations, and concerns about emissions that are outside the scope of this
project, alternative fuel vehicle purchases and offerings have significantly increased. Figure 3 from the
US Department of Energy’s Alternative Fuels Data Center displays the increase of available light-duty
vehicles that are powered off a non-gasoline source in the last 25 years.
Page | 14(Source: http://www.afdc.energy.gov/data/10303)
Figure 3. Light-Duty Alternative Fuel Vehicles (FVs), Hybrid Electric Vehicles (HEVs) and Diesel Model Offerings,
by Fuel Type
Similarly, in recent years, availability of alternative fuel GSE have entered the market.
4.4 Introduction to Ground Support Equipment (GSE)
4.4.1 GSE Definition
Ground Support Equipment (GSE) includes all equipment that services a plane on the ground during its
“turn”, or while it is at the gate between flights. Ground support equipment can be motorized or non-
motorized; our analysis applies only to motorized vehicles, as they require an energy input to operate.
Many activities occur during a plane turnaround that adhere to a strict schedule, including unloading
and loading passengers and luggage, refueling, and cleaning and restocking the plane.
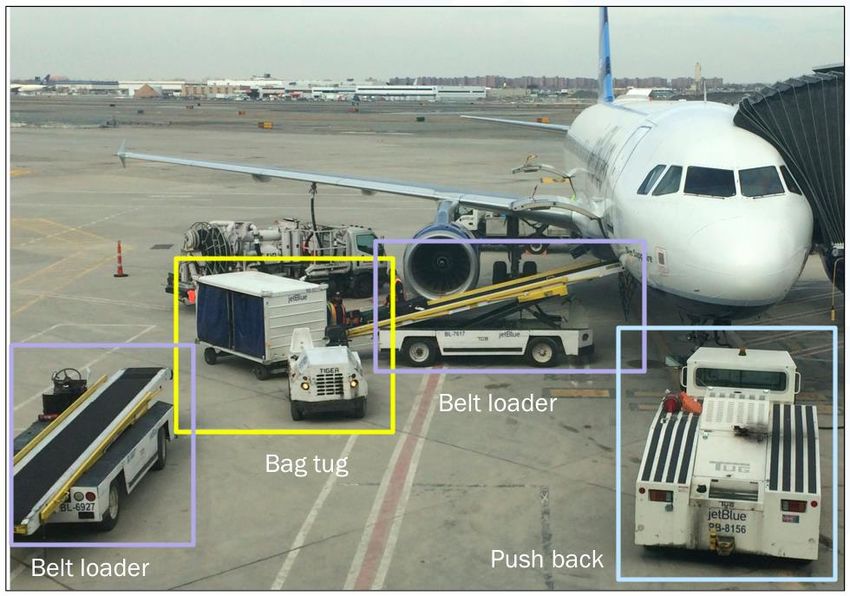
4.4.2 Most Common GSE Vehicles
There are many GSE vehicles that serve a variety of airport needs. The following are the top three
vehicle types (by quantity) that are owned by JetBlue and the average commercial airline:
1. Bag Tug/Tractor
Bag tugs are the most recognizable GSE vehicle, and are used to transport baggage, cargo, mail, or other
miscellaneous items between the airport and aircraft. They do so by connecting to a rolling non-
motorized bag cart that physically holds the goods. When a passenger checks his or her bag at the
terminal, it will be transported to a bag cart, which will be connected to a bag tug, and next driven to
the aircraft to be loaded.
2. Belt Loader
Page | 15Belt loaders are used to load and unload baggage and cargo into and out of an aircraft. A belt loader
consists of a conveyor that can be elevated so the bags are lifted to the belly of the plane.
3. Pushback Tug/Tractor
Pushback tugs are used to reverse aircraft out of a gate before taxiing to the runway. Conventional
pushback tugs have towbars that connect to the airplane’s nose wheel and push it out of the gate. As an
alternative, towbarless pushbacks lift the noise wheel off the ground to reverse the aircraft. Though
airplanes are capable of moving in reverse, doing so would cause a “jet blast” at the rear of the plane,
which could damage the ground equipment and airport infrastructure (ACRP, 2012). Pushback tugs are
often also used to move aircraft around the airport, such as to a hangar for maintenance.
Figure 4: JetBlue Bag Tug, Belt Loader, and Push Back Servicing an Aircraft
4.4.3 Regulations on GSE Emissions: Clean Air Act
One key difference between ground support and aircraft emissions in the United States is that those
generated by GSE are subject to regulation.
The federal Clean Air Act (CAA) grants the US Environmental Protection Agency (EPA) the ability to set
limits on ambient air quality, called National Ambient Air Quality Standards or NAAQS, for the EPA-
specified criteria pollutants as detailed previously.
Regions within the U.S. are designated as to whether they meet the NAAQs by “attainment”,
“nonattainment”, or “maintenance” if in transition. If it is determined that a region is in
Page | 16“nonattainment”, state and local agencies must submit state implementation plans (SIPs) to the federal
government that sets out a course of action for reaching the NAAQS. New York, where JFK is located, is
currently in nonattainment status.
4.4.4 Federal GSE Emissions Standards
The EPA has set emissions standards for stationary and mobile sources of criteria pollutants, where are
as follows:
Ground level ozone (O3)
Carbon monoxide (CO)
Particulate matter (PM2.5 and PM10)
Nitrogen dioxide (NO2)
Sulfur dioxide (SO2)
Lead (Pb)
As moving vehicles, airport GSE would be classified as mobile sources of emissions. GSE are further
classified as non-road vehicles (as opposed to on-road vehicles) as they do not travel on public
roadways. Emissions standards on non-road vehicles are more lenient, meaning higher allowable
emissions. It’s important to note that some airport GSE such as catering trucks and crew vans, are also
used on-road, and are thus subject to on-road standards. However, these vehicles are outside the scope
of this study.
Emissions standards for non-road vehicles differ depending on whether they are compression-ignition
(CI, typically fueled with diesel) or spark-ignition (SI, typically fueled with gasoline). For both categories,
different standards exist depending on the manufacturing date and vehicle horsepower. The
responsibility to meet these standards is largely borne by the manufacturer, though it is also up to the
operators to ensure the vehicles they are using are meeting their respective engine standards.
4.4.5 California GSE Emissions Standards
The Clean Air Act does not allow states to set their own vehicle emissions standards, with California
being the only exception. California is allowed to adopt different emissions standards for mobile
sources, with the stipulation that the standards they adopt are at least as stringent as the federal
standards. Exercising this right, the Air Resources Board within the California Environmental Protection
Agency has introduced the In-Use Off-Road Diesel Vehicle Regulation, which sets more stringent
standards for diesel particulate matter and oxides of nitrogen (NOx) (California Environmental Protection
Agency, 2014).
4.4.6 Health Implications of Diesel and Gasoline Exhaust
A significant motivation for the Clean Air Act’s emissions standards is to reduce the impacts on human
health from diesel and gasoline exhaust that is emitted when the fuel is combusted. Ground operations
Page | 17are a concentrated source of NOx, ozone precursor, and particulate matter. Of particular concern is
diesel exhaust; the California Office of Environmental Health Hazard Assessment notes over 40 toxic air
contaminants in diesel exhaust, including benzene, formaldehyde, and arsenic, which are all suspected
carcinogens. The particles and potentially hazardous substances are suspended in air, and are thus
impossible to avoid breathing in if working on the ground.
4.4.7 Reducing GSE Emissions Through Add-On Technologies
One strategy of reducing GSE emissions is through add-on emission control technologies. Control
devices can collect and treat engine exhaust and convert them to less environmentally harmful
compounds. Examples include oxidation catalysts, three-way catalytic converters, and particulate traps.
For this assessment, we are not considering add-on devices, as it will not allow for simultaneous cost
savings and emissions savings.
4.4.8 Alternative Fuel Technologies
An option to reduce emissions associated with GSE involves using vehicles powered by alternative fuels,
which are GSE using non petroleum-based fuels. Many U.S. airlines have converted a portion (20-30%)
of their ground support fleet to alternative fuel vehicles, proving that it is a working model.
4.4.9 Defining Alternative Fuels
Alternative fuels are fuels that serve as an alternative to gasoline and diesel. The Energy Policy Act of
1992 lists the following as alternative fuels:
Gaseous fuels:
o Hydrogen
o Natural gas
o Propane (Liquefied petroleum gas, LPG)
Alcohols:
o Ethanol
o Methanol
o Butanol
Blends of 85% or more alcohol and gasoline
Vegetable or waste oils
Electricity (US EPA, 2013)
Not all of the above alternative fuels are appropriate or available for ground support equipment. An
overview of the above alternative energy sources and details around their cost and environmental
impact are detailed in Appendix B.
Page | 184.4.10 Electric GSE (eGSE)
Electric vehicles use one or more electric motors to power the car, and do not possess an internal
combustion engine. The vehicles contain a battery that is charged via an outlet and also through
regenerative breaking that stores kinetic energy from braking into potential energy to power the
vehicle.
More GSE units in the United States are electric than any other alternative fuel type. As of 2012,
approximately 10% of all GSE units, or 7,200 units, in the United States are electric (ACRP, 2012). The
following characterize electric vehicles:
Lower operational costs: Electricity price is more stable than fossil fuel prices and the cost to
power an electric vehicle is usually less expensive than that for gasoline or diesel vehicle per unit
of energy provided. Overall, electric vehicles have lower operational costs and less price
volatility.
Lower maintenance costs: Electric vehicles require less maintenance than internal combustion
engine (ICE) vehicles, or vehicles powered by fossil fuels. This is mostly due to fewer moving
parts in an electric vehicle, reducing the need for replacing spare parts, performing oil changes,
or emission testing. Regenerative braking also reduces wear on brake pads.
Performance comparable to ICE vehicle: Electric vehicles have comparable performance (speed
and handling) to that of ICE vehicles. Electric vehicles are much quieter than ICE vehicles,
reducing the health risk associated with noise exposure and helping adhere to U.S. Occupational
Safety and Health Administration (OSHA) Standards 1910.95(a) (OSHA, 2015). However, electric
GSE currently have limited abilities towing and hauling loads up ramps. For this reason, our
study did not include GSE with large towing responsibilities (e.g., towing an aircraft).
4.4.11 Airline Industry Trends in GSE Electrification
By far, the most common alternative fuel GSE vehicles are powered by electricity. As displayed in Figure
5, many commercial carriers have retrofitted their bag tugs, belt loaders, and push backs to roughly 10-
20% electric. Electric GSE are thus a proven working model, as they have been shown across many
regions to function as well as their internal combustion engine counterparts, and thus don’t interfere
with GSE operations.
Page | 1920%
15% JetBlue
10% NY area
(2014)
5% Nationwide
(2011)
0%
Bag tug Belt loader Push back
tug
Source: Port Authority of New York and New Jersey
Figure 5. JetBlue GSE Electrification Comparison to New York and Nationwide Trends
Figure 5 compares the portion of JetBlue’s bag tugs, belt loaders, and push back tugs that are electric
powered, compared to commercial carriers across the New York and New Jersey area (John F. Kennedy
International Airport, LaGuardia Airport, Newark Liberty International Airport, Stewart International
Airport) and the U.S.. Note that the nationwide eGSE averages across all commercial carriers, as
provided by ACRP Report 78 previously referenced, are from 2011. We expect this number to now be
higher given the many eGSE projects that have been pursued since 2011.
Based on the fact that eGSE are already widely adopted across multiple airlines and airports – far more
than any other source of alternative fuel – our study chose to only look at electric vehicles as an
alternative fuel source for JetBlue’s JFK GSE fleet.
The majority of airlines who have retrofitted their GSE to alternative fuel use electricity as the
alternative energy source, though there also exist some GSE vehicles powered by compressed natural
gas, and liquid petroleum gas (propane). Airlines who use eGSE include Alaska Airlines, American
Airlines, Continental Airlines (pre-United), Delta Airlines, Horizon Air, Southwest Airlines, US Airways,
United Airlines, and United Parcel Service. Appendix X provides a list of U.S. airlines’ alternative GSE
efforts that have been made public, with two airports exhibiting significant eGSE action described
below.
Alaska Airlines and Seattle-Tacoma International Airport (Sea-Tac)
Alaska Airlines and their regional carrier, Horizon Air, are one of the leaders in the United States for
ground support electrification. In 2013, Alaska set a goal to increase the percent of their ground support
fleet electrified to 30% across their system (Alaska Air Group, 2013). They started this by undertaking a
project to replace over 200 GSE vehicles to electric over a two-year period. Alaska estimated this
initiative would save roughly $800,000 annually in fuel, as well as 2,000 metric tons of CO2. Horizon Air
reports that roughly 60% of their ground support fleet is electric, making them the airline with the
highest percent of electric GSE in the United States. Since 2010, Sea-Tac has received four Voluntary
Airport Low Emissions (VALE) grants (more information in “Voluntary Airport Low Emissions (VALE)
Page | 20Federal Funding Program” section below) from the FAA totaling $27.6 million to reduce airport
emissions (Highline Times, 2010).
In March 2014, Sea-Tac announced plans to further increase their electric GSE projects. With the
assistance of VALE and additional state funding, they plan to convert most of the remaining bag tugs,
belt loaders, and pushback vehicles to electric. They will be purchasing 600 charging stations to support
this. The project is estimated to save $2.8 million in GSE fuel costs and avoid 10,000 tons of greenhouse
gas emissions.
Los Angeles International Airport (LAX)
As described in Section 4.4.3., Regulations on GSE Emissions: Clean Air Act (California Environmental
Protection Agency, 2014), California is subject to the In-Use Off-Road Diesel Vehicle Regulation that sets
tighter emissions standards around NOx and particulate matter for off-road vehicles, including airport
GSE. Among other requirements, airlines cannot add older vehicles into their fleet starting in 2014, and
are required to reduce fleet average emissions by retrofitting or replacing existing vehicles.
Requirements and compliance dates vary by fleet size, and specific regulations are enforced at different
times, with restrictions already in place for idling, reporting, and adding emissions control strategies for
older vehicles.
As a result, many California airports, including Los Angeles International Airport (LAX), have worked with
the airlines and their various tenants to meet these standards. In the Los Angeles World Airports (LAWA)
2008 Sustainability Plan, LAWA set a goal to convert 100% of diesel GSE to electric or the cleanest
available technology by 2015.
4.4.12 Voluntary Airport Low Emissions (VALE) Federal Funding Program
In 2004, the Vision 100 - Century of Aviation Reauthorization Act led to the creation of the Federal
Aviation Administration (FAA) Voluntary Low Emissions Program (VALE, 49 U.S.C. §§ 40117, 47139 and
47140), with the purpose of offering funding for voluntary efforts to reduce criteria emissions at
commercial service airports in regions that are in either non-attainment or maintenance status with the
National Ambient Air Quality Standards (NAAQS) of the Clean Air Act.
Projects eligible for funding include emissions reduction efforts for vehicles or airport infrastructure.
This report explores the possibility of utilizing the VALE program to help offset costs from switching to
an electric GSE fleet. In this case, VALE funding can cover 100% of infrastructure costs (e.g., charging
station purchase and installation costs).
Airport sponsors, typically a region’s Port Authority or a local governmental agency, can receive funding
through two tracks: either through Passenger Facility Charges (PFCs) or Airport Improvement Programs
(AIP) grants. Approved VALE projects generate Airport Emission Reduction Credits (AERCs) that can be
used to meet future emission regulation requirements.
Page | 21Typical VALE projects include providing preconditioned air and gate power; remote ground power;
installing hydrant fueling stations; geothermal power; and GSE electrification (FAA). In 2014, nine VALE
grants were awarded, ranging from $102,456 for four compressed natural gas (CNG) vehicles in Atlanta,
Georgia to $3,687,168 for preconditioned air and gate power for 7 gates at Yeager Airport in Charleston,
West Virginia (FAA, 2015). In 2014, AIP VALE funding totaled $16.6 million.
Airport sponsors must agree to four conditions upon accepting VALE funding:
1. All VALE-provided equipment must stay at the airport for the entirety of its useful life
2. The airport sponsor must track VALE-provided use
3. The airport sponsor must maintain the VALE-provided equipment throughout its lifetime by
fixing damaged equipment
4. The airport sponsor must put an emblem on any VALE-provided equipment that reads “Funded
with the Voluntary Airport Low Emissions Program” (FAA)
5. Baseline Analysis
To begin our baseline analysis, we considered the following criteria to narrow the scope of GSE for our
study:
1. Where does JetBlue spend the most money on GSE?
2. Is the region of interest eligible for VALE funding?
3. Which vehicles demand the most fuel/incur the most costs?
4. Which vehicles are offered in alternative fuel versions (e.g., electric)?
5.1 JetBlue Current GSE Fleet
JetBlue owns 2,936 units of ground support equipment across 76 airports. In many airports where
JetBlue operates just a few flights a day, the airline contracts GSE work to a third party. In these
locations, JetBlue owns just a few or no GSE.
Among the 2,936 GSE units JetBlue owns, 1,253 are motorized. These vehicles are found across 35
airports. Figure 4 demonstrates the distribution of GSE across airports owning at least 20 units of GSE.
This highlights the fact the JFK Airport is JetBlue’s largest operation, has the largest concentration of
owned motorized GSE vehicles, and, thus, has the greatest opportunity for fuel cost and greenhouse gas
emission savings from an alternative fuel GSE retrofit. Note that additional GSE units leased or operated
by business partners are excluded from the scope of this study.
Page | 22Airports with 20+ Owned GSE as of Dec. 2014
400
300
200
100
0
Source: JetBlue GSE Inventory
Figure 6. Quantity of owned motorized GSE units by airport (2014)
Across the entire system of JetBlue-owned motorized GSE, 96% of vehicles are gasoline or diesel
powered, with the remaining 4%, or 48 vehicles, built with electric motors.
5.2 Long Beach Electric Vehicles
Most of the 48 electric vehicles across the system can be found in Long Beach International Airport
(LGB); they currently possesses 6 electric belt loaders, 9 bag tugs, 4 golf carts, and 5 A/C carts. As part of
the City of Long Beach’s efforts to reduce energy consumption and air pollution, in 2008 the Long Beach
Airport installed 5 Dual Port SuperCharge stations for JetBlue and US Airways to use for electric bag tugs
and belt loaders. The City of Long Beach’s Office of Sustainability estimated that this would provide
charging for up to 40 GSE vehicles. They state that electric GSE can reduce annual fuel costs by 70 - 80%
and can lower total operating costs by 30 - 40% when compared with conventional GSE (City of Long
Beach, 2015). The remaining eGSE are electric scissor lifts, golf carts, and forklifts at JFK and Boston
Logan International Airport.
Electric
4%
Diesel Gasoline
45% 51%
Source: JetBlue GSE Inventory
Figure 7. GSE Vehicles by Energy Type (2014).
Page | 235.3 GSE by Vehicle Type at JFK Airport
Figure 6 illustrates the breakdown by vehicle function of the 352 motorized GSE units at JFK. Here we
again narrow the study scope to include only the three vehicle types JetBlue has the most of:
Bag tug
Belt loader
Push back tug
JFK Motorized GSE By Type (352 total)
78
61
34
24
17 16 15 13 13
11 11 8 7 7 6 5 4 4
Source: JetBlue GSE Inventory
Figure 6. JFK Motorized GSE by Vehicle Type.
We selected these three vehicle types for three primary reasons:
1.) An electric version of the existing vehicle model is available;
2.) They are the most used vehicles so have the highest energy savings potential;
3.) Based on our competitive analysis, they are the most common vehicle types other airlines have
chosen to retrofit.
In 2014, JetBlue spent over $2 million on diesel and gasoline fuel for GSE at JFK Airport. Consequently,
the focus of the study is restricted to JFK International Airport, since this is where the most money on
GSE fuel is spent. Additionally, this location is eligible for VALE funding, thus elevating the business case.
We estimate JetBlue spends over $1.5 million annually powering their 34 push backs, 61 belt loaders
and 78 bag tugs at JFK. The breakdown of total fuel cost per vehicle type at JFK is illustrated below
(Figure 7). The values listed are based off our recorded vehicle run hours multiplied by vehicle energy
efficiency data (for example, gallons consumed per hour of running) multiplied by the cost of the
respective fuel (gasoline or diesel). Bag tugs consume the most fuel by GSE type, and account for
roughly half of the total GSE fuel expenditures at JFK. Combined, we estimated that bag tugs, belt
loaders and push backs make up over three-quarters of total GSE fuel expenditures at JFK Airport.
Page | 24However, because there are more baggage tractors than there are belt loaders, pushbacks and lavatory
trucks, we also considered the fuel cost of GSE on a per-vehicle basis (Figure 8).
$1,200,000
$1,000,000
$800,000
$600,000
$400,000
$200,000
$0
Bag tugs (78) Belt loaders (61) Push backs (34)
Figure 7. Approximate Total Annual Fuel Expenditures at JFK by GSE Type (2014)
$15,000
$10,000
$5,000
$0
Bag tug Belt loader Push back
Figure 8. Approximate Per Vehicle Annual Fuel Spend at JFK by GSE Type (2014)
5.4 Baseline Greenhouse Gas (GHG) Emissions
We consider the following pollutants material to JetBlue’s operations and sustainability commitments:
Carbon dioxide (CO2)
Methane (CH4)
Nitrous Oxides (N2O)
From JetBlue’s total operations (aviation and ground), JetBlue’s 2014 greenhouse gas footprint was
roughly 6.3 million tons of CO2 equivalent (CO2e) (Table 2). The CO2 equivalent of CH4 and N2O was
calculated using emissions factors from the EPA (US EPA, 2015) and the Climate Registry (The Climate
Registry, 2015) and their respective GWPs, or Global Warming Potentials (US EPA, 2012). These
emissions factors and GWPs are summarized in (Table 3).
Total Emissions (metric tons) CO2 Equivalent (CO2e) Emissions (metric tons)
CO2 CH4 N2O Total CO2 CH4 N2O Total
Air Fleet 6,218,650 0 198 6,218,650 6,218,650 0 61,294 6,279,944
Page | 25You can also read