Building a Carbon-free Future - CARBON REPORT - Xcel Energy
←
→
Page content transcription
If your browser does not render page correctly, please read the page content below
CARBON
Building a Carbon-free Future         REPORT

 1 | Xcel Energy Carbon Report 2019
Xcel Energy is committed to serving customers, and that includes
responding to the concerns of many customers around the risk of climate
change. National and international studies paint a sobering picture about
this risk and call for nothing less than a transformation of our industry to
help address it. While that transformation will be challenging, we see an
opportunity for our company and those we serve to significantly reduce
greenhouse gas emissions reliably, safely and at a low cost.
In 2018, we reduced carbon emissions from the electricity that serves
our customers by 38 percent compared to 2005 levels and plan to do
even more. As technologies have improved and costs have fallen, we are
making significant changes — more than we imagined possible a decade
ago — without compromising the reliability or affordability that our
customers expect. We need all three components — clean, reliable and
affordable — to make this transition work.
As we carry out Xcel Energy’s vision to be a preferred and trusted energy
provider, leading the clean energy transition continues to be a strategic
priority for us. It’s helping to achieve our other two strategic priorities as
well — to keep customer bills low and enhance the customer experience.
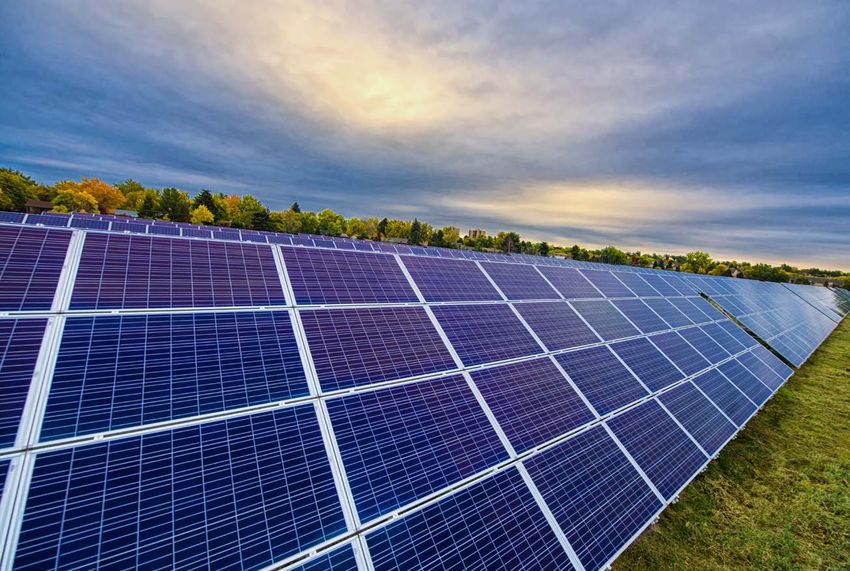
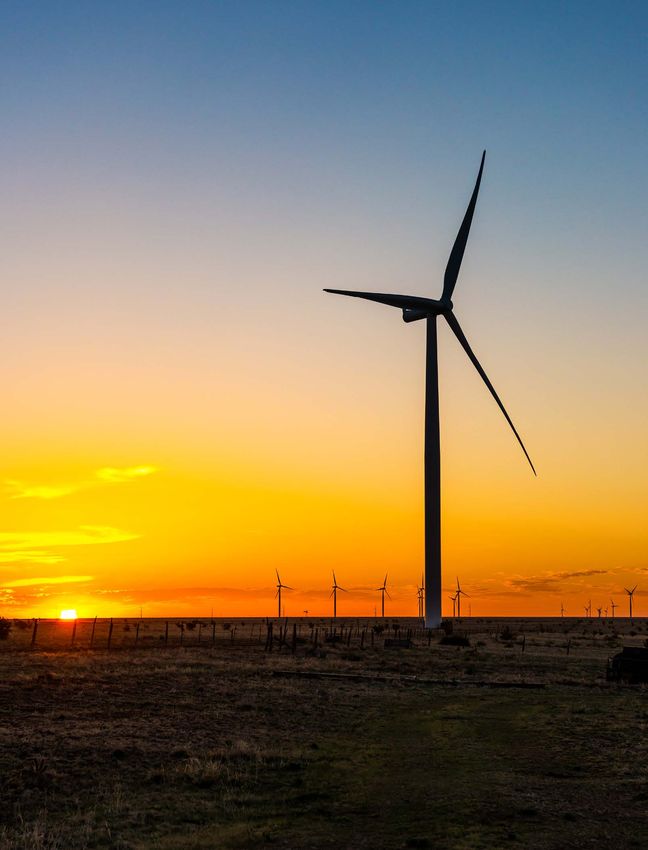
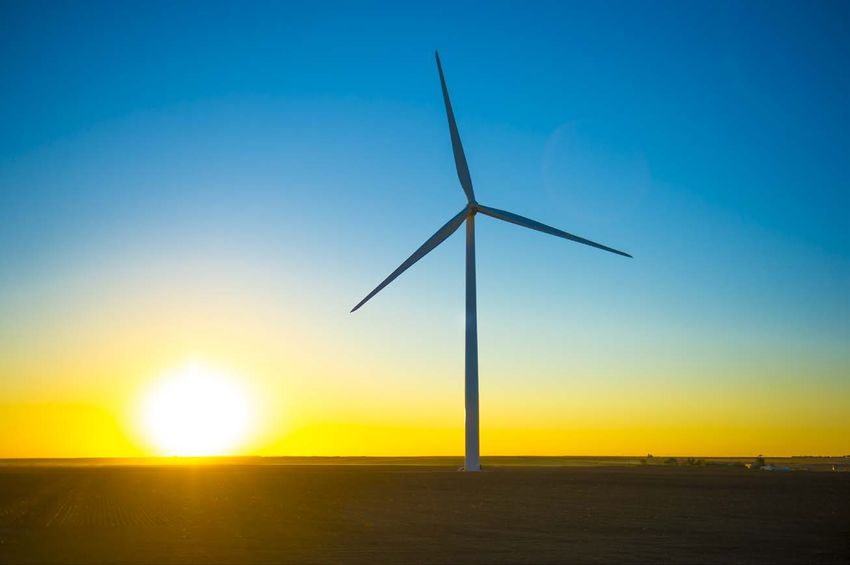
We’re a national leader in wind energy and are harnessing it through our
Steel for Fuel strategy, which we expect to reduce costs for customers.
We also offer a leading portfolio of energy efficiency and renewable
choice programs because an increasing number of customers want to
power their homes and businesses with clean energy and take steps to
To our
reduce their own carbon footprints.
While our existing efforts are significant, we want to do even more and do
Stakeholders:
it sooner than anticipated. That is why I set an ambitious vision to reduce
our carbon emissions 80 percent from 2005 levels by 2030. Longer term,
we aspire to serve our customers with carbon-free electricity by 2050.
The technology to achieve this aspiration isn’t commercially available yet,
but I believe it can be available if we make it a priority today.
In this report, we discuss our vision, including the opportunities, risks and
challenges we face getting there. We describe how our carbon transition
can have an even larger impact in other sectors, such as transportation.
We also show how our commitment compares to the targets of
international climate agreements.
Xcel Energy is leading the clean energy transition. We know from
experience that our goals are ambitious. This change will require
collaborative, long-term solutions that are cost effective as well as
advanced clean energy technologies. Broad stakeholder support, smart
public policy and favorable economics are essential factors in this
ongoing transformation.
We can’t achieve this transition alone — it will take all of us working
together. I look forward to your partnership.
Sincerely,
Ben Fowke
Chairman, President and CEO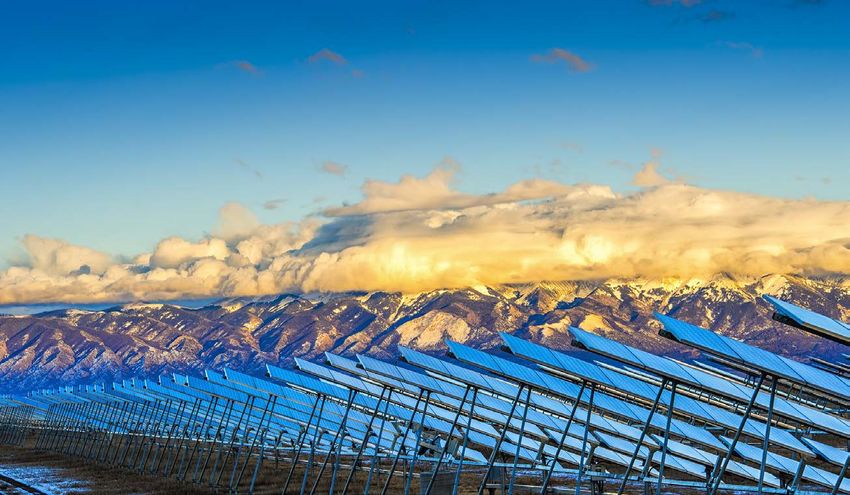
Contents
Aspiration for a Carbon-free Energy Future............................................................................................................... 4
Analysis Related to Our Vision....................................................................................................................................... 7
Reporting and Measuring Progress........................................................................................................................... 15
Managing the Risks Associated with Climate Change........................................................................................ 16
Opportunities to Lead the Carbon Transition........................................................................................................... 18
Driving Change..................................................................................................................................................................22
Conclusion..........................................................................................................................................................................25
References.........................................................................................................................................................................26

About Us
Xcel Energy is a major U.S. electricity and natural gas company with annual revenues of $11.4 billion. Based in
Minneapolis, we operate in eight states and provide a comprehensive portfolio of energy-related products and
services to 3.6 million electricity customers and 2 million natural gas customers.
Addressing climate change is a priority for many of our customers, investors and key stakeholders, and is a priority
for us as well. In delivering on our strategic focus to lead the clean energy transition, we are successfully reducing
carbon emissions and providing clean energy solutions from a variety of renewable sources, reliably and affordably
for customers.
More information on our clean energy strategy, corporate governance and risk management is available
at xcelenergy.com in our corporate reports, including Xcel Energy’s Annual Report, Proxy Statement,
Corporate Responsibility Report and EEI Environmental, Social, Governance and Sustainability Report.

Forward Looking Statements
The material in this report contains forward-looking statements that are subject to certain risks, uncertainties and assumptions. Such forward-looking statements
include projections related to emission reductions, changes in our generation portfolio, planned retirements, and planned capital investments and are identified in
this document by the words “aim”, “aspire”, “assuming”, “believe”, “could”, “expect”, “may”, and similar expressions. Actual results may vary materially. Factors
that could cause actual results to differ materially include, but are not limited to: general economic conditions, including the availability of credit, actions of rating
agencies and their impact on capital expenditures; business conditions in the energy industry: competitive factors; unusual weather; effects of geopolitical events;
including war and acts of terrorism; changes in federal or state legislation; regulation; actions of regulatory bodies; and other risk factors listed from time to time by
Xcel Energy in its Annual Report on Form 10-K for the fiscal year ended Dec. 31, 2018 (including the items described under Factors Affecting Results of Operations)
and the other risk factors listed from time to time by Xcel Energy Inc. in reports filed with the SEC.

3 | Xcel Energy Carbon Report 2019
Aspiration for a
Carbon-free Energy Future
For more than a decade, Xcel Energy has demonstrated leadership on clean energy — proactively reducing carbon
emissions at levels that currently surpass state and federal goals. This environmental commitment is woven into our
company’s strategy, governance, executive compensation and daily operations.
To respond to growing stakeholder expectations, we have regularly established and achieved increasingly ambitious
carbon reduction goals.

Where We Aim to Be
       %
             20
      % Reduction in Carbon Emissions

Our vision for the future includes industry-leading goals shown in Figure 1. In this report, we demonstrate how our
goals align with
               0% an emissions trajectory needed for the electric power sector to meet the goals of the Paris climate
agreement.         2005
                   Baseline
                            2010             2020            2030              2040             2050

                                                              Year                       2017
By 2030, we-20  %
              aim  to reduce carbon dioxide
that by 2030, our annual carbon emissions
                                                                                         35
                                             %emissions 80 percent below 2005 levels company-wide. This means
                                            from the electricity that serves our customers will be about 17 million
                                        Achieved
tons, or 80 percent
             -40% lower than in 2005. We believe these emission reductions can be achieved cost effectively with
continued fleet transition and operational changes, and with2030
                                                               the renewable, carbon-free generation and energy
storage technologies
             -60%      available today.                             %
                                                                Goal with 100 percent carbon-free electricity. In
                                                                                                                        80
By 2050, we aspire to provide our customers across all states
             -80%
the next 30 years, we will transition to serve our customers with electric resources that emit zero carbon dioxide
emissions. To fulfill this aspiration, we will continue to increase renewable energy sources on our system, as well
            -100%that enable renewable integration. We will need new carbon-free dispatchable technologies —
as technologies
                                                                                            2050
technologies not yet commercially available at the cost and scale needed to achieve our 2050 aspiration. Because of
this, there needs to be significant research and development to ensure we have these technologies to deploy in the
                                                                               Carbon Aspiration
                                                                                                                                                   ZERO
coming decades.

                                                              Xcel Energy Carbon Reduction Trajectory

                                                              2005        2010                  2020                    2030                2040               2050
                                                        0%
                                                              Baseline
                                                              Year
                  Percent Carbon Emission Reduction

                                                      -20%

                                                      -40%

                                                      -60%

                                                      -80%

                                                      -100%
                                                                         2018                          2030                    2050

                                                                         38
                                                                         Achieved
                                                                                 %
                                                                                                       80
                                                                                                       Goal
                                                                                                              %
                                                                                                                               100%
                                                                                                                               Carbon-free Electricity Aspiration

                                                              Figure 1: Our vision for the clean energy transition 2030 and 2050

4 | Xcel Energy Carbon Report 2019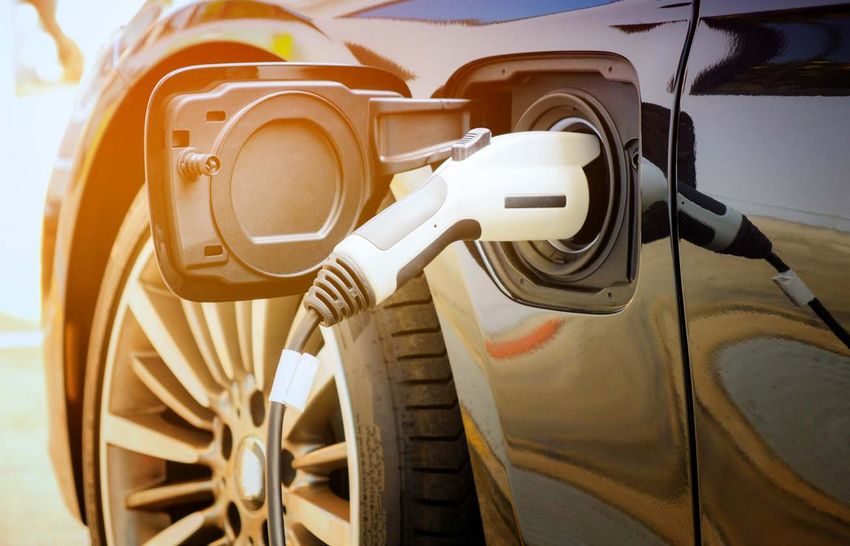
The Path to Get There
We know that climate change is an urgent issue for many of our policy makers and a growing concern of our
customers who want to help make a difference. Planning for the transition to a clean energy future today will allow us
to deliver the product our customers want and achieve reductions that our policy makers are increasingly demanding.
By acting now, we increase our chances to achieve these goals while assuring that our system remains reliable and
our prices affordable. These last two points are critical to our success. The electricity we deliver is an essential
service that powers the economy and keeps our customers comfortable and safe.
While we move through this transition, we need to make sure that power will be there when our customers need it
and that the prices we charge are affordable to all customers , both residential and commercial. To accomplish this,
we will build upon four focus areas that are transforming our system and delivering clean, reliable, low-cost power to
customers today.
These focus areas include:
• Investing in wind and solar under our Steel for Fuel strategy and offering customers more renewable
energy options
• Helping customers manage their energy usage and bills through efficiency and rebate programs and
encouraging strategic electrification of other sectors, such as transportation
• Maintaining our carbon-free nuclear plants in the Upper Midwest
• Transforming the energy grid by retiring or reducing the operation of aging coal plants and replacing their
energy with low-carbon natural gas, renewables and advanced technologies
Looking ahead to 2030 and 2050, we plan to continue this progress. Our vision is not a single plan or initiative.
Instead, it will guide the policies that we support and the resource plans that we expect to file in our states over the
coming decades. As we advance these efforts, stakeholders are essential and will help to influence the outcomes.
Because of this, we plan to continue working collaboratively with customers, nongovernmental organizations, policy
makers and others to identify and implement pragmatic solutions to make our goals possible.
In setting our goals, we did sensitivity analysis to identify key elements and variables that could affect our plans.
There are a variety of cost-effective pathways to an 80 percent carbon reduction by 2030, and resource plans in our
jurisdictions will determine the exact resource mix. However, through the pathways we explored, we have identified
the following common elements that we know will be part of the plans:
• We anticipate adding thousands of megawatts of wind and solar power to our system and incorporating both
natural gas and storage resources to help balance high levels of renewables
• Strategic electrification of certain end uses will help create flexible demand
• We will seek to operate our nuclear plants through at least the remainder of their licenses, and we will need to
retire additional coal units or change their operations to minimize emissions affordably and reliably
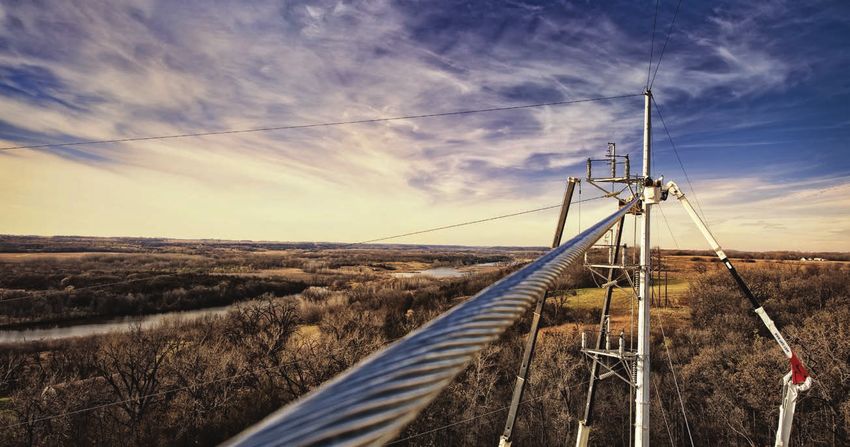
• In addition, we will need to make critical investments in supportive infrastructure, such as transmission
As we transition our system and retire plants, we will need to assure that we do so in a way that our company
remains financially healthy and that acknowledges the financial impacts of plant retirements and the replacement
investment on our investors. Just as we serve other stakeholders, we must provide our investors with value to
encourage them to provide the capital necessary to support these plans. There are many ways to accomplish our
carbon vision, but the ability to own these replacement resources is clearly an important consideration, as investors
support companies that grow their earnings power. This ownership also helps to reduce risk to customers and is
fundamental to ensuring our financial viability and ongoing ability to efficiently invest in day-to-day infrastructure
needs as well as clean energy.
5 | Xcel Energy Carbon Report 2019
To reach our 2050 aspiration, there must be more action around the research, innovation and demonstration of
advanced technologies. We need, clean technologies that can be dispatched to balance the peaks when customer
use exceeds renewable generation and valleys when renewable generation exceeds customer use. Cost-effective,
low-carbon and carbon-free dispatchable resources will be required to remove the remaining carbon from the
system to serve customers with carbon-free electricity. Technology advancement is key to the long-term success
of our strategy.

6 | Xcel Energy Carbon Report 2019

Analysis Related to Our Vision
In planning our future carbon transition, we have reviewed the research on climate science to confirm the
effectiveness of our goals. A trio of climate reports — from the Intergovernmental Panel on Climate Change (IPCC),
the U.S. Global Change Research Program and the UN Environment Program — examine potential climate change
impacts and the greenhouse gas reductions needed to meet the targets of the Paris climate agreement. While
providing broad context for our analysis, none of these reports includes actionable guidance for utility decision making
or for individual company greenhouse gas goals.
We also participate in an Electric Power Research Institute (EPRI) project that is analyzing the science around climate
scenario analysis and emission goal setting. While providing useful insights about global, regional and electric sector
emissions consistent with limiting temperature increases to 2 C, the EPRI project does not provide company-specific
comparisons to the Paris climate targets.
To bridge this gap, we hired experienced climate modelers at the University of Denver to compare Xcel Energy’s goals
to the Paris climate targets. We compared our goals to electric power sector emissions in industrialized countries,
in IPCC scenarios consistent with a high probability of achieving the 2 C and 1.5 C temperature goals in the Paris
climate agreement.

The Paris Climate Agreement
In December 2015, the international negotiations of the United Nations Framework Convention on Climate Change
(UNFCCC) produced the Paris climate agreement, with the goal of “holding the increase in the global average
temperature to well below 2 C above preindustrial levels and pursuing efforts to limit the temperature increase
to 1.5 C above preindustrial levels, recognizing that this would significantly reduce the risks and impacts of
climate change.”1
The Paris climate agreement does not establish goals, mandates or even guidance for individual economic sectors
or companies. This makes it challenging to address the relationship between the agreement’s goals and company-
level targets. Its temperature goals represent a global ambition, pursued through nationally determined contributions
and subsequent national and sub-national (e.g., state) policy decisions about how to allocate the emission reduction
burden across sectors, industries and individual companies.

IPCC Special Report
The IPCC in October 2018 published a Special Report on Global Warming of 1.5 °C. The IPCC estimates that warming
to date is about 1 C above average preindustrial temperatures and that warming is likely to reach 1.5 C between 2030
and 2052.2 The report evaluates human and natural impacts of climate change associated with global warming of
1.5 C and compares these to impacts at 2 C or more. The IPCC then explores what global greenhouse gas reductions
would be needed, on what timeframe, to limit warming to 1.5 C. It estimates that global net human-caused carbon
dioxide emissions would need to peak within the next few years, then fall dramatically, reaching net zero by around
2050 (meaning that after that point, carbon emissions are balanced by carbon removal.) The report indicates that
allowing global temperatures to temporarily overshoot 1.5 C, but return below 1.5 C by 2100, would require greater
reliance on negative emission technologies after mid-century. To stay below or only temporarily exceed 1.5 C, global
emissions in 2050 would have to be between 71 percent and 129 percent below 2010 levels.3

7 | Xcel Energy Carbon Report 2019
US Fourth National Climate Assessment (NCA4)
The U.S. Global Change Research Program in November 2018 released its Fourth National Climate Assessment,
summarizing the latest scientific understanding of climate change impacts, risks, mitigation and adaptation, both
nationally and by regions of the United States. The report finds that climate change is having significant impacts on
U.S. communities, the economy, trade, water, public health, ecosystems, infrastructure, energy systems, agricultural
productivity, oceans and coastlines. Potential impacts on the electric sector include reduced generation efficiency at
thermal plants, power outages, grid reliability challenges, fuel transport, changing wind patterns, increased electricity
demand for cooling and reduced natural gas demand for heating.
Under a high emissions future, NCA4 finds that “climate change is projected to impose substantial damages on the U.S.
economy, human health and the environment. Under scenarios with high emissions and limited or no adaptation, annual losses
in some sectors are estimated to grow to hundreds of billions of dollars by the end of the century.”4 However, NCA4 also finds
that greenhouse gas reductions sufficient to keep the world on a lower warming pathway could still avoid or significantly
reduce these damages — and that the earlier the reductions, the greater the chance of avoiding the worst impacts.

UN Emissions Gap Report
The U.N. Environment Programme (UNEP) in November 2018 released its annual Emissions Gap Report, which
assesses the status of countries’ “nationally determined contributions” under the Paris climate agreement. The report
finds that global carbon dioxide emissions increased in 2017 after staying relatively flat for three years, reaching 53.5
billion metric tonnes CO2e (GtCO2e) and show no signs of peaking in the near term. Without additional efforts, UNEP
predicts global warming of about 3 C by 2100. UNEP estimates a gap of 13 GtCO2e per year by 2030 between global
emissions under the nationally determined contributions and the annual emissions needed to achieve the 2 C target
(for the 1.5 C target, a gap of 29 GtCO2e.) UNEP finds it is still possible to bridge the gap and contain warming below
2 C and 1.5 C, but this will require aggressive reductions by 2030, particularly in emission scenarios that are more
pessimistic about the potential for negative emissions (i.e., carbon removal technologies) later on.

EPRI Research
Because the reports summarized above do not include guidance specific to electric utilities or other industries, Xcel Energy
also participates in a multi-utility project convened by EPRI to examine the current state of the science around climate
scenario analysis and company greenhouse gas goals.5 EPRI released a report in fall 2018 that takes stock of current
scientific understanding and provides analytical guidance, titled Grounding Decisions: A Scientific Foundation for Companies
Considering Global Climate Scenarios and Greenhouse Gas Goals. We outline here a few key findings from the report.
Figure 2 illustrates the many variables defining the relationship between global temperature goals and company-
level greenhouse gas emissions. Uncertainties in the relationships between each variable result in ranges of global,
country, sector and individual company emissions consistent with a temperature goal. This means there is no single
or uniform target that can be applied to all companies and is appropriate in all plausible futures. Nonetheless, ranges
can be identified that are consistent with achieving the temperature goals.
                                                Climate Goals
                                        10
                                                (e.g., limit
EPRI draws on the IPCC Fifth Assessment Report (AR5) emission scenario database and other scenarios to
characterize current understanding of these relationships. Among other things, the EPRI study identifies sets of
global, regional and electric power sector emission scenarios consistent with different probabilities of limiting
global average temperature increase to 2 C.6
Figure 3, reproduced from the EPRI report, shows the range of global carbon dioxide scenarios consistent with a
40 percent or greater chance of limiting global warming to 2 C. The left-hand chart shows that a broad range of
scenarios, rather than a single scenario, is consistent with this temperature goal. It also shows that scenarios that
increase emissions in the near term generally require significant negative emissions after mid-century to offset
the near-term increase and achieve the temperature goal.7 The right-hand chart shows the much smaller range
of scenarios that can achieve the temperature goal with the same 40 percent probability, if negative emissions
technologies are unavailable.
The EPRI study also presents sets of regional and electric sector emissions pathways consistent with 2 C. However,
as discussed by EPRI, these results are dependent upon global assumptions — in particular, global economy-wide
policy design and technology availability assumptions that facilitate reducing carbon with electricity. These are
important uncertainties for electric power companies to evaluate, and sub-global scenario results should be used
with caution and with these uncertainties in mind.
60 60
Billion Metric Tons Carbon Dioxide (GtCO2)/year
Billion Metric Tons Carbon Dioxide (GtCO2)/year
40 40
20 20 range w/o
negative
emissions (n=37)
0 0
range w/ and
w/o negative
-20 range and select -20 emissions
scenarios shown (n=408) (n=408)
-40 -40
-60 -60
2010
2020
2030
2040
2050
2060
2070
2080
2090
2100
2010
2020
2030
2040
2050
2060
2070
2080
2090
2100
Figure 3:Global net carbon dioxide pathway ranges consistent with a 40 percent or greater chance of limiting warming to less than 2 C. Reproduced from EPRI 2018
and supporting material.
9 | Xcel Energy Carbon Report 2019EPRI’s report provided key insights for our subsequent work with the University of Denver. First, there is a broad range
of emissions pathways consistent with a given probability of achieving a temperature goal. We need to consider our
carbon goals relative to this range and the uncertainties it represents, including uncertainties about policy, technology
availability and reductions assumed to be achieved in sectors other than electricity. Second, we can choose to
compare ourselves to pathways with higher likelihood of achieving temperature goals, as well as compare to
Xcel Energy to sub-global pathways such as electric power sector emissions. However, in doing so, it is important
to recognize the assumptions, challenges and uncertainties embedded in such an analysis and their implications for
our goals.
Finally, many IPCC scenarios assume the availability of significant negative emissions after mid-century, in some
cases offsetting emission increases in the near term, to achieve the temperature goal. This is particularly true of
the 1.5 C scenarios. Because negative emissions electricity technologies are not commercially available today, to be
conservative we compared ourselves only to carbon scenarios that do not include negative emissions technologies
within the electric power sector in industrialized countries (but may include negative emissions in other regions
and sectors.) If negative emissions electricity technologies become available, we would consider them along with
other options for providing customers reliable, affordable clean energy. Because our analysis does not rely on these
technologies to reach our goals, we plan to continue to reduce carbon emissions aggressively in the near term,
consistent with cost (which is also influenced by need) as well as reliability.
Comparing Xcel Energy to the Paris Climate Agreement Goals
EPRI did not attempt to identify company-specific emission trajectories corresponding to the global temperature
goals because of the increasing uncertainty at higher levels of resolution. However, investors and others routinely
ask Xcel Energy to compare company-specific emissions to the temperature goals, so we needed to go a step further.
We commissioned an analysis by experienced climate modelers at the University of Denver, including a lead author
on the IPCC’s forthcoming Sixth Assessment Report, to compare our goals to electric sector carbon dioxide emission
scenarios consistent with limiting warming to both 2 C and 1.5 C. We provided the modelers our carbon emission
forecast and goals, and had them compare these to electric sector carbon emission scenarios consistent with
2 C and 1.5 C. We set three constraints on their analysis:
• Focus on scenarios categorized by the IPCC as having a high probability of achieving the temperature goals
• Compare Xcel Energy to the electric power sector in industrialized countries
• Exclude scenarios that rely on negative emissions technologies within the electric sector
On pages 11 to 13, the University of Denver modelers summarize briefly their approach and findings.
10 | Xcel Energy Carbon Report 2019Xcel Energy targets and limiting
warming to less than 2 C and 1.5 C
By Dr. Brian O’Neill and Steve Hedden
Climate researchers have carried out a large number of studies of how much and how fast greenhouse gas
emissions would have to be reduced in order to achieve the Paris climate targets of limiting warming to less
than 2 C, or even to below 1.5 C. We drew on the results of those studies to compare Xcel Energy’s emissions
reduction goals to emissions pathways consistent with the Paris climate targets. In those pathways, global
carbon emissions generally decline to zero (in net terms) by around 2070 or later to stay below 2 C and by
around 2050 to stay below 1.5 C.
However, emissions associated with one company in one country are just a fraction of global emissions, so we
compared Xcel Energy’s goals to a more detailed and more relevant set of results from these studies: net carbon
emissions from the electric power sector in industrialized countries. We found that Xcel Energy’s goals represent
reductions that are consistent with, and in most cases larger than, those that occur in this sector in scenarios
that achieve the Paris climate targets.
Approach
The Intergovernmental Panel on Climate Change report from October 20188 assessed the scientific literature on
emissions scenarios consistent with the Paris climate targets. To support that assessment, researchers created
a database of 416 published emissions scenarios.9 The scenarios were developed using computer models that
calculate the greenhouse gas emissions and warming that would result from the production and consumption of
energy, food, transportation and other goods in regions around the world over the coming decades. The future is
uncertain, so these scenarios investigate a wide range of possibilities about how fast population, incomes and
energy demand may grow and what kinds of climate policies may be pursued to achieve the Paris climate targets.
We compared the Xcel Energy goals to a subset of these scenario results. First, we selected two sets of global
greenhouse gas emission scenarios from the database: those that would be likely (defined as having a greater
than 66 percent chance) to stay below 2 C, and those that would be more likely than not (defined as having a
greater than a 50 percent chance) to stay below 1.5 C or to only slightly (and temporarily) exceed that level.10
Next, we extracted results from these scenarios for carbon dioxide emissions from the electric power sector
in industrialized countries.11 These outcomes from the scenario database are the best comparison available to
Xcel Energy goals. Models that produce emissions scenarios do not represent individual companies, nor even
individual countries. Results are reported in the database as totals for groups of countries for different sectors
of the economy. By using results for the electric sector in industrialized countries, we can compare Xcel Energy
goals to emissions pathways that occur on average across the same sector of countries at similar levels of
economic development to the United States.
Finally, we excluded scenarios in which net carbon dioxide emissions from the industrialized country electric
sector are negative at any time in the future, through 2100. (Note that these scenarios could still include
negative emissions in other sectors and regions.) In the electric sector, net negative emissions could result
from technologies like biomass energy with carbon capture and storage (BECCS) that generate electricity
while removing carbon from the atmosphere. Scenarios with these technologies often allow for higher global
emissions in the first few decades that are compensated for by negative emissions later in the century. However,
these technologies are unproven at large scales and involve possible risks to biodiversity and food prices due to
the large amount of land that may be required for growing biofuels.
Our selection process left us with 17 scenarios consistent with the 2 C target and five scenarios consistent with
the 1.5 C target, a reflection that achieving the lower target without net negative emissions in the electric power
sector is relatively uncommon in the scientific literature.
11 | Xcel Energy Carbon Report 20190.0 0%
Percent Emission Reduction
Percent Emission Reduction
-20% -20%
-40% -40%
-60% -60%
Results
-80% -80%
The comparison in Figure 4 shows that Xcel Energy’s 2030 and 2050 goals represent emissions reductions that
-100% -100% countries in most of the global emissions
are larger than those that occur in the electric sector of industrialized
scenarios likely to limit warming to below 2 C. Xcel Energy’s goals are also within the range of reductions that
-120%
occur in the
2018
limited number
2030
of scenarios
2050
achieving the 1.5 C target. These2018
figures show scenario results to 2050.
2050
the century.
% scenarios
Beyond 2050, these
Achieved Goal
39
Carbon-free
80
Electricity Aspiration
100%
% generally indicate low or zero net carbon emissions %
Achieved
continuing through the end of
Carbon-free Electricity Aspiration
38 100%
Xcel Energy’s Carbon Emission Reduction Trajectory
rbon Emission Reduction XcelXcel
Energy's Carbon
Energy's Emission
Carbon Reduction
Emission Reduction Xcel Energy's Carbon Emission Reduction
ared to 2 C Scenarios Trajectory Compared
Trajectory toto
Compared
Compared 1.5to
2CC
2Scenarios
CScenarios
Scenarios Trajectory Compared
Compared to 1.5
to 1.5 C Scenarios
C Scenarios
20%
BaselineBaseline Baseline
Year Year Year
20 2030 2040 2050 2005 2010
2005 2010 2020 2020 2030 2030 2040 2040 2050 2050 2005 2010 2020 2030 2040 2050
0.0 0% 0%
Percent Emission Reduction
Percent Emission Reduction
Percent Emission Reduction
-20%-20% -20%
-40%-40% -40%
-60%-60% -60%
-80%-80% -80%
-100%
-100% -100%
2030 2050
-120%
2018 2050 2018 2050
80
Goal
%
100%
Carbon-free Electricity Aspiration
38
Achieved
%
100% Carbon-free Electricity Aspiration
38 %
Achieved
100%
Carbon-free Electricity Aspiration
arbon Emission Reduction Figure 4: X celXcel
EnergyEnergy's Carbon
carbon emissions Emission
reduction goals (in blue,Reduction
with historical emissions in dark gray) compared to scenarios of emissions from the
pared to 1.5 C Scenarios Trajectory
industrialized countryCompared to 1.5
electric power sector (in C Scenarios
light gray). Emissions scenarios are from global scenarios likely to remain below 2 C warming
(left) or more likely than not to avoid 1.5 C warming (right) without significantly exceeding that level. Emissions expressed as a percent reduction
relative to levels in 2005.
Baseline
Year
020 2030 2040 2050 2005 2010 2020 2030 2040 2050
0%
Caveats to this analysis
Percent Emission Reduction
To date,
-20%most company-level greenhouse gas scenario analysis has focused on 2 C rather than 1.5 C, in part
because of the much greater uncertainty about the attainability of limiting warming to 1.5 C. The IPCC notes that
limiting warming to 1.5 C may involve unprecedented actions.12 Without taking a position on the attainability
-40%
of 1.5 C, in this analysis we have assessed Xcel Energy’s goals in relation to both temperature goals. We have
chosen to include the 1.5 C scenarios because while that goal is unquestionably harder to attain than 2 C,
-60%
experience shows that the scale and pace of technological change often outpaces our expectations today.
Because
-80%of this — and because the IPCC Special Report makes clear that climate risks and damages, while not
zero at 1.5 C, are substantively less than at 2 C — we believe it makes sense to include it in our analysis.
-100%
2018 2050
38
Achieved
%
100% Carbon-free Electricity Aspiration
12 | Xcel Energy Carbon Report 2019Any multi-decade analysis of company- or sector-level carbon dioxide emission trajectories relative to the global
temperature goals involves inherently uncertain assumptions about economic growth, technologies, policy
and global coordination or lack thereof. If those assumptions are not borne out — e.g., technologies do not
develop as expected, economic growth is more carbon intensive than assumed, emission reductions (or negative
emissions) assumed to occur in other sectors or regions do not materialize, etc. — then the industrialized country
electric sector emissions consistent with a given probability of achieving the temperature goals could change.
We have endeavored to make conservative assumptions in this analysis. For example, we focus only on
scenarios with relatively high likelihoods of achieving the temperature goals and exclude scenarios that rely on
net negative emissions technologies within the electric sector. Also, we examined our conclusions to ensure that
they do not change fundamentally when varying key assumptions, such as allowing net negative emissions in the
electric sector, and that they do not rely on unreasonably large assumed reductions in other regions. For a fuller
discussion of these issues, see our full report.13
Brian O’Neill is professor at the Josef Korbel School of International Studies at the University of Denver
and director of Research at the Korbel School’s Frederick S. Pardee Center for International Futures, whose
mission is to explore, understand and shape alternative futures of global change and human development. He
is currently a convening lead author for the IPCC’s Sixth Assessment Report and was an author on the United
States’ Fourth National Climate Assessment.
Steve Hedden is lead system administrator at the Pardee Center and is a coordinating lead author of the
United Nations Environmental Programme’s (UNEP) sixth Global Environmental Outlook (GEO6.)
Our Conclusions on the Analysis
Participating in the EPRI research, and subsequently engaging University of Denver climate modelers to compare our
carbon vision against the Paris climate targets, helped to validate that our goals are consistent with electric sector
emissions in scenarios likely to achieve the targets. Our goal to reduce carbon emissions 80 percent by 2030 and
aspiration to serve customers with carbon-free electricity by 2050 appear largely consistent with the industrialized
country electric sector carbon reductions in scenarios that achieve the Paris climate targets, even acknowledging the
many uncertainties and embedded assumptions in any such analysis.
More specifically, Figure 4 shows that our carbon dioxide reductions achieved to date (shown by the dark gray line)
fall below all the scenarios corresponding to a high probability of achieving the 2 C and 1.5 C goals. Our trajectory
from today to 2030 falls below all but one of the scenarios for both temperature goals. Our aspiration for 2050 lies
well within the range of emission scenarios for both temperature goals. In addition, we note that our carbon dioxide
emission reduction trajectory from 2030 to 2050 is represented as a simple straight-line projection since we have no
resource plans that extend to 2050. Our actual reductions will not likely follow that smooth line and depending on
cost and technology developments, and the future of our nuclear plants, could either decline or increase from the
line in any given year.
Any climate scenario analysis has embedded assumptions and necessary simplifications. For our analysis,
these include:
• Our actual carbon emissions will depend on our resource mix, renewable energy and natural gas prices, total
load, degree of electrification of end uses currently reliant on other fuels, and many other factors. We typically
run sensitivities for these and many other variables in our resource plans.
13 | Xcel Energy Carbon Report 2019• Depending on the amount of electrification assumed, a very low-carbon electric power sector may
enable significant greenhouse gas reductions in transportation, buildings and other sectors. Our strategy
contemplates significant electrification of the economy. The scenarios shown here virtually remove carbon
from the electric sector, but there could be scenarios in which it is cost effective for the electric sector to emit
slightly more carbon while reducing carbon in other sectors and still achieving the economy-wide reductions
necessary for the temperature goals.
• The cost effectiveness of any greenhouse gas reduction pathway depends to some extent on climate policy,
which is not addressed here. If adopted, climate policy frameworks will determine costs to our customers,
flexibility in achieving greenhouse reductions, and linkages to or coordination with other emitting sectors.
Xcel Energy will continue to advocate for climate strategies that achieve greenhouse gas reductions at
the lowest possible cost to customers while maintaining reliability. Since many IPCC scenarios envision
significantly increased electricity use in transportation, buildings and industry in order to achieve economy-
wide reductions, keeping electricity affordable will be crucial.
• The achievability and cost effectiveness of any greenhouse gas goal will also depend on how technology
evolves, which we cannot predict for 2050 or even 2030. Our carbon transition will depend on a mix of
renewable energy, energy storage, carbon-free dispatchable technologies and flexible demand that
could enable us to achieve deep carbon reductions affordably and reliably.
14 | Xcel Energy Carbon Report 2019Reporting and Measuring Progress As an energy provider, we emit greenhouse gases as we provide electricity to our customers. The primary source of these emissions is from the combustion of fossil fuels to generate electricity, which makes up 99 percent of our total greenhouse gas emissions. Nearly all of our generation-related emissions are carbon dioxide. Because of this, it makes sense that we focus our strategy, goals and reporting on reducing carbon emissions. The carbon emissions discussed in this report and other Xcel Energy reporting are from electric generating plants that we own and from electricity that we purchase from others. Xcel Energy sells a small portion of the electricity we generate into the market, and the carbon emissions from these off-system sales are excluded from our goal and goal reporting because the energy does not serve our customers. Also, it is likely that many companies purchasing the energy account for the emissions in their reporting, so including them in our reporting could result in double counting. Our goal to reduce carbon emissions 80 percent by 2030 is based on absolute, company-wide emissions from the electricity that serves our retail and wholesale customers, measured from a 2005 baseline. Likewise, our aspiration to serve customers with carbon-free electricity by 2050 is company-wide. Xcel Energy supports timely, transparent public reporting of carbon dioxide and other greenhouse gas emissions. Our comprehensive greenhouse gas reporting, from all parts of our business, is based on The Climate Registry and its Electric Power Sector Protocol, which aligns with the World Resources Institute and ISO 14000 series standards. Our company joined The Climate Registry as a founding member in 2007 to help establish a consistent and transparent standard for calculating, verifying and reporting greenhouse gases. Through The Climate Registry, we annually third- party verify, register and publicly disclose our greenhouse gas emissions. 15 | Xcel Energy Carbon Report 2019
Managing the Risks Associated
with Climate Change
Over the next several decades as we make our carbon transition, we will continue to monitor and take steps to mitigate
any risks along the way. Changing weather patterns, extreme weather conditions and other events, such as flooding,
droughts, wildfires and snow or ice storms, can all impact our system in terms of system operability, customer demand,
revenues, cost recovery and the health of regional economies.
We rely on routine business processes to identify and address these types of risks and emerging challenges. These
include our risk management, resource planning and daily operations, as well as our continuous improvement and
innovation initiatives.

Integrated Risk Management
Our integrated, multi-disciplinary risk management process creates accountability for managing risk across the company
— from employees who are responsible for business compliance and adhering to our Code of Conduct, to senior executives
and the board of directors who oversee risk management. Annually, executive leadership conducts a key risk assessment,
considering materiality, timing and likelihood and controllability of risks. Management also identifies and analyzes risk
through its business planning process and development of goals and key performance indicators, which include risk
identification to determine barriers to implementing our strategy. While the assessment is broad, it includes the operational,
policy and weather-related risks potentially associated with climate change. Findings are presented to the board of directors,
which assigns oversight of critical risks among the board’s four standing committees to ensure they are well understood
and managed on an ongoing basis. We provide more information on our risk management process, including discussion of
climate-related risks, in Xcel Energy’s annual form 10-K.

Resource Planning
Our resource planning process is designed to manage capital-intensive investments over decades-long time horizons.
Through this regulated process, we evaluate a range of scenarios and stress test our energy portfolio against important
variables, including fuel prices, renewable energy and storage costs, transmission constraints and a variety of others.
We use load forecasts to account for changing weather patterns, a key variable in explaining actual loads and in
forecasting future loads. Load forecast sensitivities can also ensure our portfolio is sufficient to meet different needs
created by electrification, which is likely to become more prevalent in a carbon-constrained future. Our resource
planning also considers the costs and risks of potential carbon regulation and potential damages from climate change
by applying a carbon proxy, allowing regulatory costs, and in some cases, externality damages to be considered in
selecting resources.14

Operations
Maintaining reliable and resilient operations across generation, transmission and distribution means we constantly prepare
for the unexpected. We use a suite of techniques to maintain a resilient system from water management to emergency
preparedness. For example, our Monitoring and Diagnostics Center watches the operation of major generating units in
real time, identifying potential issues before they occur. We also have predictive analytics and software tools that help
avoid plant failures and can even address issues which may result in higher emissions or compromise reliability. Further,
we have specific procedures in place to deal with extreme weather, flooding, drought or other conditions that may impact
the operability of our plants. To better understand and address climate-related vulnerabilities on our system, we joined the
Department of Energy’s Partnership for Energy Sector Climate Resilience to work with others in the industry.

16 | Xcel Energy Carbon Report 2019
A Focus on Grid Resiliency
                       We continually invest and innovate to maintain and improve the resiliency of our energy grid. The following are several
                       highlights from the many programs we are implementing to address potential system risks.

                                           Under our Advanced Grid Intelligence and Security (Advanced Grid) program, we are upgrading
                                           the energy grid to better serve customers and enhance our ability to efficiently restore power and
                                           improve reliability. The program builds a platform that provides enhanced visibility and control of
                                           the energy grid through the integration of modern information system technology and traditional
                                           distribution systems.

                                           In addition to maintaining emergency plans at all of our power plants and planning for extreme weather,
                                           we are also focused on successfully managing major storm events, responding quickly and providing
                                           information to customers as we restore service. The Edison Electric Institute has recognized
                                           Xcel Energy multiple times with its Emergency Recovery Award for outstanding storm response.
                                           These efforts extend beyond our service territory, with our crews on standby to help with recovery
                                           efforts across the country when hurricanes or other natural disasters strike.
                       Extreme weather                Wildfires              Vegetation management                 Drone/Technology                   Wind and S

                                           To better integrate high levels of renewable energy, we have deployed sophisticated modeling tools to
                                           better dispatch our system. Working with the National Center for Atmospheric Research and its affiliate
                                           company Global Weather Corp., we helped develop the Wind WX system that utilities around the globe
                                           now use to make better commitment and dispatch decisions. It uses real-time, turbine-level operating
                                           data and applies sophisticated algorithms to forecast the amount of wind power that will be produced.
                                           Forecasts for a 168-hour period are provided every 15 minutes across Xcel Energy’s entire service
                                           territory. As we integrate more solar on our system, we are working on similar innovations for
Drone/Technology          Wind and Solar
                                           solarDrought/Water
                                                 forecasting. Management

                                           Our vegetation management program is generally performed on a four- to five-year cycle for our
                                           distribution and transmission lines. In Colorado, we have established a Mountain Hazard Tree
                                           Program that helps us stay ahead of the tree mortality caused by Mountain Pine Beetles.

 Wildfires          Vegetation management                Drone/Technology                  Wind and Solar           Drought/Water Management
                                           Since we provide electricity in drought-prone areas, water is a precious resource that we must carefully
                                           manage. A co-benefit of our transition to renewable energy is that we are also lowering our water
                                           footprint. Beyond this, we have a comprehensive water management program to minimize the risks
                                           of continued water usage, including innovative partnerships to access water during extreme drought
                                           periods. For example, we use treated effluent to cool power plants in Texas and New Mexico. This
                                           effluent is water that would otherwise not be used and is available during drought.
Wind and Solar       Drought/Water Management

                   17 | Xcel Energy Carbon Report 2019
Opportunities to Lead the Carbon Transition Utilities can play a key role in helping solve the challenges of climate change. According to the Energy Information Administration, the electric power industry collectively reduced carbon emissions 28 percent from 2005 to 2017.15 This includes Xcel Energy’s progress — having reduced emissions 38 percent already, we have plans underway to achieve more, as explained in this report. As an industry leader in renewable energy and reducing carbon emissions, we have a strategic advantage in continuing to lead this transition. We have been able to provide scalable solutions to reduce the carbon footprint of the energy we provide, while continuing to deliver energy in a manner that is safe, reliable and affordable. As we continue to implement solutions to address emissions across our system, we can also provide customers with options to reduce their carbon emissions and help other sectors reduce carbon through strategic electrification. Investing for the Future to Reduce Emissions We must achieve our carbon transition while maintaining a modern, viable electric system, which is dependent on our ability to attract capital and investors. Transitioning to cleaner sources of energy to achieve our carbon reduction goals should consider utility ownership of replacement resources, as we need our investors to support this transition. Our capital plans also envision the need for additional transmission and advanced grid technology. By investing in these assets, we can improve service to our customers, introduce new options and support greater reliability and flexibility in the way energy is delivered. This financial component is important to our plans. Xcel Energy operates in regions with some of the best wind and solar resources in the United States, and we are capitalizing on this. Our Steel for Fuel strategy calls for adding renewable resources at a net savings because the capital costs of projects are more than offset by future avoided fuel costs. Customers benefit from the clean energy that also helps to keep their electricity bills low. These renewable projects are just one component of the resource plans that determine new investments. Through the resource planning process with state regulators, we develop comprehensive, cost-effective plans to transform our system, serve customers and advance our transition to clean energy. Empowering Customers to Reduce Carbon Emissions We know customers want cleaner energy and more renewable options, but also expect electricity that is affordable and reliable. The great advantage of our system-wide clean energy transition is that all customers are receiving lower-carbon electricity over time — our reductions are their reductions — at an affordable cost. Some of our customers — from residential customers to corporations and cities — desire to go further faster, accelerating the system transition by setting goals to meet up to 100 percent of their own demand with renewable electricity or to reduce their overall emissions. To meet this demand from customers, we provide an increasing array of voluntary renewable choice products, including cost-effective options to procure up to 100 percent renewable electricity and a comprehensive portfolio of industry-leading energy efficiency programs. Through our 2030 and 2050 carbon reduction vision, we can further help customers achieve their goals. They will continue to reduce the portion of emissions from their electricity consumption, while we transition our overall system to a diverse mix of cost-effective, low-carbon and carbon-free generation resources. In addition, we expect that our planned investments in technologies to modernize the energy grid will enable us to deliver new solutions for customers and create a flexible energy grid that allows for two-way power flows from customer-connected devices or distributed energy resources. 18 | Xcel Energy Carbon Report 2019
Electrification of our Economy
As the nation’s electricity supply becomes cleaner, attention has increasingly turned to other sectors of the economy
to address climate change.
The transportation sector is now the nation’s leading source of greenhouse gas emissions according to the Energy
Information Administration.16 This also applies to the states Xcel Energy serves. For example, data from Minnesota
indicates transportation has surpassed electricity as the leading carbon emitter, and that carbon emissions from
transportation are declining far slower than electricity — a clear indicator of the opportunity for transportation
electrification.17
We believe that strategic electrification of certain end uses will be a key component — though not the only solution
— for achieving economy-wide greenhouse gas reduction goals. If we continue to electrify transportation and power
vehicles with carbon-free electricity by 2050, we can help address the climate challenge for that sector.

19 | Xcel Energy Carbon Report 2019
Low-carbon electricity and electrification: a Minnesota example
    Removing carbon from electricity and electrifying other parts of the economy can be mutually reinforcing. Low-carbon
    electricity allows transportation, buildings and other major emitting sectors to reduce emissions. At the same time, flexible
    loads, such as electric vehicles and appliances that can charge at times of high renewable generation, may allow us to
    integrate more renewable resources than we could otherwise.
    Xcel Energy engaged Energy+Environmental Economics (E3) to explore the feasibility of deep carbon reductions, both for the
    Xcel Energy system and for Minnesota statewide. E3 created a Minnesota PATHWAYS model looking at how the state could
    achieve its statutory economy-wide goal to reduce greenhouse gas emissions 80 percent from 2005 levels by 2050, with a
    primary focus on electricity, transportation and buildings.
    The chart below illustrates this potential, focusing on 2050. It compares a business-as-usual scenario in which carbon is
    not reduced from electricity, and there is little or no electrification of other sectors, to what could be achieved in a “high
    electrification” scenario designed to meet the state’s economy-wide 80 percent reduction goal. In this scenario, virtually
    all vehicles, space heating and water heating switch to electric alternatives by 2050. To supply these new loads, total
    statewide electricity demand in 2050 is 60 percent higher than 2015. Meanwhile, the electric sector reduces carbon,
    supplying over 90 percent carbon-free electricity in 2050. As a result, direct carbon emissions from electricity are reduced
    by about 40 million tons, as shown by the blue bars. Emissions from buildings, transportation and other sectors also
    decrease dramatically, with electrification enabling 35 million tons of that reduction through low-carbon electricity. Just
    as electricity is an essential service, natural gas service is as well, as it plays a critical role in keeping our customers
    comfortable and safe. When we review these options, we need to keep the affordability of space heating a primary
    objective along with the affordability of our electric business.

       Carbon Reductions in the Electric Sector Drive Compounding Reductions throughout the Economy
                                                              140
                                                                                                                                 Carbon-free electricity
                                                                                                                                 contributes significantly to
                                                              120                                                                reductions, and allows for
    2050 Greenhouse gas emissions (million short tons CO2e)

                                                                                                                                 additional reductions in
                                                                                                                                 buildings and transportation
                                                              100
                                                                                                                                 through clean electricity.

                                                                                                                                    Other
                                                              80
                                                                                                                                    Transportation

                                                                                                                                    Buildings
                                                              60
                                                                                                                                    Electric Generation

                                                              40

                                                              20

                                                                0
                                                                                   Business as Usual      High Electrification
                                                                Credit: Energy+Environmental Economics.

20 | Xcel Energy Carbon Report 2019
Xcel Energy’s Electric Vehicle Strategy
The future of transportation is dramatically changing to include more electric-powered transportation options than
ever before — as well as more autonomous features in vehicles and new (often shared) mobility services. Utilities are
uniquely positioned to work with customers, communities and electric vehicle (EV) stakeholders to ensure this change
benefits all customers, the environment and the energy grid that we all rely upon.
Through our current EV strategy, we are focused on:
• Making it easier for customers — from individual households to public and private sector fleets
— to adopt EVs
• Creating the infrastructure needed to charge EVs
• Establishing time-varying rates and technological controls to ensure that EVs can charge as much
as possible on low-cost, low-carbon energy
While EVs create a significant opportunity for drivers and fleet operators to save on fuel and other costs, barriers
exist to wider-scale adoption, such as customer awareness, high up-front costs and the availability of charging
infrastructure. Our plans will help overcome these barriers by developing new services, piloting them and then
rolling out our most successful ideas to customers on a broader scale.
In Minnesota, we are engaging customers who are interested in adopting electric vehicles and buses. We hope to
better understand their needs and barriers to adoption so we can work collaboratively toward solutions that could
benefit all customers down the road. We expect these discussions will provide opportunities for us to pilot a variety
of solutions that will inform our stakeholders and policy makers so we can scale solutions best suited to benefit all
Minnesotans in the coming years.
As we pursue our EV Plan, we are focused on these objectives:
• Empower customers with information, tools and options
• Increase access to electricity as a transportation fuel in an equitable manner
• Encourage efficient use of the power grid and integrate renewable energy
• Improve air quality and decrease carbon emissions
• Ensure reliability, interoperability and safety of equipment
• Leverage public and private funding opportunities
• Provide benefits to all customers, both EV drivers and non-EV drivers
• Ensure transparency and measure results
21 | Xcel Energy Carbon Report 2019You can also read