Water Scenarios Modelling for Renewable Energy Development in Southern Morocco
←
→
Page content transcription
If your browser does not render page correctly, please read the page content below
ISSN 1848-9257

                         Journal of Sustainable Development of Energy, Water                             Journal of Sustainable Development
                                                                                                          of Energy, Water and Environment
                                                                                                                                     Systems

                                       and Environment Systems

                                          http://www.sdewes.org/jsdewes
                                                                                                      http://www.sdewes.org/jsdewes

                                         Year 2021, Volume 9, Issue 1, 1080335

      Water Scenarios Modelling for Renewable Energy Development in
                            Southern Morocco

       Sibel R. Ersoy*1, Julia Terrapon-Pfaff 2, Lars Ribbe3, Ahmed Alami Merrouni4
1
  Division Future Energy and Industry Systems, Wuppertal Institute for Climate, Environment and Energy,
                                 Döppersberg 19, 42103 Wuppertal, Germany
                                      e-mail: sibel.ersoy@wupperinst.org
2
  Division Future Energy and Industry Systems, Wuppertal Institute for Climate, Environment and Energy,
                                 Döppersberg 19, 42103 Wuppertal, Germany
                                  e-mail: julia.terrapon-pfaff@wupperinst.org
          3
            Institute for Technology and Resources Management, Technical University of Cologne,
                                   Betzdorferstraße 2, 50679 Köln, Germany
                                         e-mail: lars.ribbe@th-koeln.de
        4
          Materials Science, New Energies & Applications Research Group, Department of Physics,
         University Mohammed First, Mohammed V Avenue, P.O. Box 524, 6000 Oujda, Morocco
      Institut de Recherche en Energie Solaire et Energies Nouvelles – IRESEN, Green Energy Park,
                               Km 2 Route Régionale R206, Benguerir, Morocco
                                     e-mail: alami.univ.oujda@gmail.com

    Cite as: Ersoy, S. R., Terrapon-Pfaff, J., Ribbe, L., Alami Merrouni, A., Water Scenarios Modelling for Renewable
       Energy Development in Southern Morocco, J. sustain. dev. energy water environ. syst., 9(1), 1080335, 2021,
                                      DOI: https://doi.org/10.13044/j.sdewes.d8.0335

ABSTRACT
            Water and energy are two pivotal areas for future sustainable development, with complex
            linkages existing between the two sectors. These linkages require special attention in the
            context of the energy transition. Against this background, this paper analyses the role of
            water availability in the development of solar thermal and photovoltaic power plants for
            the case of the Drâa Valley in southern Morocco. Located in a semi-arid to arid
            mountainous area, the Drâa Valley faces high water stress – a situation expected to
            worsen due to climate change. At the same time, the region has one of the greatest
            potentials for solar energy in the world. To examine whether limited water availability
            could accelerate or delay the implementation of solar thermal and photovoltaic power
            plants, this paper compares regional water availability and demand in the Drâa Valley for
            different scenarios, paying particular attention to potential socio-economic development
            pathways. The Water Evaluation and Planning System software is applied to allocate the
            water resources in the study region. The water supply is modelled under the
            Representative Concentration Pathway 8.5 climate scenario, while the water demand for
            the Drâa Valley is modelled for a combination of three socio-economic and two energy
            scenarios. The climate scenario describes a significant decrease in water availability by
            2050, while the socio-economic and energy scenarios show an increase in water demand.
            The results demonstrate that during a sequence of dry years the reservoirs water
            availability is reduced and shortages in water supply can result in high levels of unmet
            demand. If this situation occurs, oasis farming, water for drinking and energy production
            could compete directly with each other for water resources. The energy scenarios indicate
            that the use of dry cooling technologies in concentrated solar power and photovoltaic
            hybrid systems could be one option for reducing competition for the scarce water

       *
           Corresponding author

                                                           1
Ersoy, S. R., et al.                                                                            Year 2021
 Water Scenarios Modelling for Renewable Energy ...                             Volume 9, Issue 1, 1080335
        resources in the region. However, given that energy generation accounts for only a small
        share of the regional water demand, the results also suggest that socio-economic demand
        reduction, especially in the agricultural sector, for example by reducing the cultivated
        area, will most likely become necessary.

KEYWORDS
        Water evaluation and planning, Water demand modelling, Hybrid concentrated solar
        power-photovoltaic systems, Scenario, Socio-economic development, Morocco.

INTRODUCTION
    Concentrated Solar Power (CSP) is a promising renewable energy technology with
the potential to become mainstream, like wind, hydro and Photovoltaic (PV) technologies
[1]. Although, compared to an installed solar PV capacity of 300 GW the installed
capacity of CSP worldwide is still low with 4.8 GW in 2016, but the International Energy
Agency (IEA) expects that the capacities will be doubled by 2022 [2]. As consulted by
Gauché et al. [3] or Brand et al. [4], CSP technology combined with thermal storage has
the ability to become dispatchable, enabling to store solar energy during the day and to
deliver electricity during the night compared to other technologies. Furthermore, thermal
energy storage systems permit a flexible operation at high efficiencies and capacity
factors while having the lowest storage costs as shown by Trieb et al. [5] who analysed
the efficiencies and capacity factors of the CSP technology, by DLR [6] which likewise
focused on innovative techniques for power generation and by experts for solar thermal
electricity [7]. However, a key challenge for the development of CSP technology is its
high level of water consumption compared to other renewable energy technologies [8].
    Water consumption is particularly relevant in arid to semi-arid regions like
Souss-Massa-Drâa and Tata in southern Morocco. On the plus side, however, these areas
are characterised by high Direct Normal Irradiation (DNI) conditions that exceed
2,400 kWh/m2 annually making them highly suitable for the implementation of CSP
plants [9]. Morocco’s CSP potential is estimated to amount to 20,000 TWh/y [10].
According to the Moroccan Ministry of Energy, Mines, Water and Environment [11] and
official policy papers [12], CSP has been identified as a promising element in Morocco’s
ambitious strategy to increase its renewable share in the electricity mix from 8.7% in
2012 to 42% by 2020 and 52% by 2030, to achieve a ‘low-carbon and climate change
resilient development’ [13]. Renewable energy technologies will also help to meet the
country’s increasing electricity demand (16 TWh in 2002 and 31 TWh in 2012 [13]),
caused by a growing population and continued industrial development. Being an
intermittent technology, solar energy technology only produces electricity during
sunshine hours. To cover the country’s peak demand hours, large storage systems such as
molten salt can ensure the electricity supply. CSP with thermal storage is especially
suitable to provide energy during the country’s peak demand in the evenings and the
annual peak, which has changed from winter peak to a summer peak due to air cooling
demands according to the energy policy analysis conducted by IEA [13], the background
paper of Morocco elaborated by Schinke et al. [12] and by the Moroccan Agency for
Solar Energy (MASEN) [14]. Yet, despite these advantages the high water demand and
the higher costs compared to PV lead to the question, if, to what extent and in which
combination CSP can be implemented at specific sites in Morocco. According to some
experts, the combination of PV and Solar Thermal Energy (STE) is the clear solution to
provide base load in most days of the year [7].
    According to the Moroccan Solar Plan (MSP), launched in 2009, MASEN plans to
implement a sufficient number of large-scale utility solar complexes to produce
2,000 MW solar energy by 2020 [15]. One of the project sites is Akka Ighane, located in
the region of Tata, where a 600 MW solar facility (NOOR Tata) is planned as stated by

Journal of Sustainable Development of Energy, Water and Environment Systems                                  2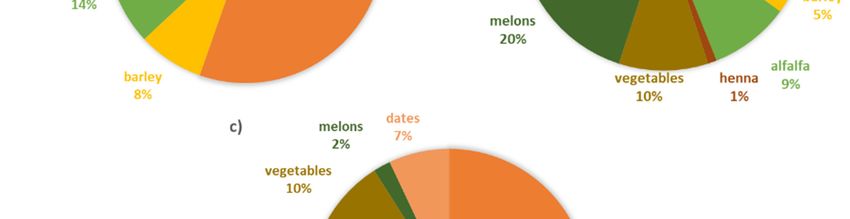
Ersoy, S. R., et al.                                                                                   Year 2021
    Water Scenarios Modelling for Renewable Energy ...                                    Volume 9, Issue 1, 1080335

MASEN [14], the German Chamber of Industry and Commerce Abroad (AHK) [16] and
the Moroccan-German Energy Partnership (PAREMA) [17]. As it is sited in one of the
regions of greatest water scarcity in Morocco, the linkages between energy generation
and water resources need to be carefully considered in the development of the NOOR
Tata project. This paper therefore addresses the question how different solar technology
development pathways can influence the sustainability in regards to water resources in
the region.
    To date, a number of studies have addressed water consumption in the energy sector
using an integrated approach in an attempt to find potential solutions by coupling the
power and water generation sectors. Agrawal et al. [18], for example, analysed Long-range
Energy Alternatives Planning System and Water Evaluation and Planning System
(LEAP-WEAP) software climate change scenarios by forecasting water consumption and
Greenhouse Gas (GHG) emissions from the power sector in Canada, while Valenzuela
et al. [19] studied the integration of CSP and PV hybrid solar systems and seawater
desalination in Chile and Bazilian et al. [20] presented a modelling framework that
addresses the nexus with a focus on developing countries. Likewise, the literature has
analysed water systems in arid to semi-arid mountainous regions in the Middle East and
North Africa. Johannsen et al. [21] analysed the future of water supply and demand in the
Middle Drâa Valley under the conditions of climate change and land use change, while
Karmaoui et al. [22] applied a multidisciplinary approach to assess environmental
vulnerability in the Upper Drâa Valley and Ben Salem et al. [23] modelled the Ziz basin in
south-eastern Morocco under various water allocation scenarios. Droogers et al. [24]
demonstrated that water shortages are mainly attributed to socio-economic factors, while
López-Gunn et al. [25] found that water-saving measures can lead to rebound effects and
increase the overall local water consumption. Yet, what is, however, still missing are
integrated assessments that address the question of renewable energy development options
and water resources in arid regions, which also take into account the potential
socio-economic development pathways. This is especially critical as more and more
renewable energy projects are deployed in water-scarce regions. This paper addresses this
research gap by discussing potential technical configurations for NOOR Tata, considering
the most sustainable development path regarding water resources for the region.
    The analysis of these types of complex systems, combining energy, hydrological,
cultural and socio-economic aspects, requires an appropriate system model. WEAP
software developed by the Stockholm Environment Institute is such a model, that has
been used successfully for the simulation of climate, land use, population growth change
and different management strategies as shown by Amin et al. [26] who applied the
WEAP model to the Upper Indus Basin and by Rochdane et al. [27] who studied the
Rheraya Watershed in Morocco. In this paper, the WEAP software is used to model
different socio-economic development scenarios in combination with different energy
technology options under the worst-case climate change scenario Representative
Concentration Pathway (RCP) 8.5. The objective of this paper is to study the impact of
climate change on the water availability and water demand in the Drâa Valley under
different socio-economic and energy scenarios to see how adequate energy system
configurations or changes in crop shares and better irrigation techniques could positively
influence the local water system. The results may rise awareness of the water-energy
demand and supply relationship among decision makers, thereby contributing to a
sustainable development in southern Morocco.

METHODS
   Scenario modelling has become a state-of-the-art tool to properly assess
environmental issues that include social, technological, economic and demographic
changes [28]. A scenario describes a possible future situation of a complex system with

3                                             Journal of Sustainable Development of Energy, Water and Environment Systems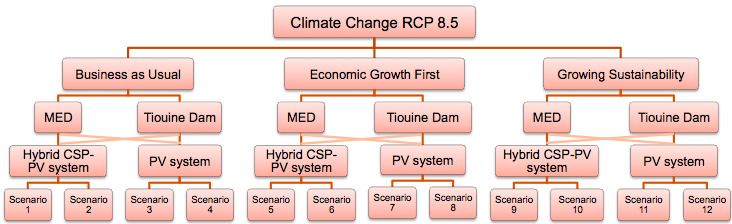
Ersoy, S. R., et al. Year 2021
Water Scenarios Modelling for Renewable Energy ... Volume 9, Issue 1, 1080335
different development pathways [29]. Scenarios can combine qualitative and quantitative
analyses. This research makes use of scenarios to describe the potential developments of
the water supply and demand in the Drâa Valley. By combining expert interviews and a
modelling tool, qualitative and quantitative results are generated.
In this paper, WEAP is used as an allocation tool for modelling future water supply
and demand scenarios under the development of renewable energies. WEAP is an
integrated tool that helps in water resources planning and supports management
decision-making strategies [30]. Its integrated approach makes it possible to simulate
water demand and supply for a specific region under certain assumptions, such as, e.g.,
climate change. WEAP can address demand-side patterns such as water use, efficiencies
and consumption for energy generation, and combine these with the supply-side such as
groundwater and reservoir availability, water runoff, climate and water management
priorities. The energy production and its water consumption have to be added to the
model exogenously. To calculate the energy production of the CSP plant, the following
equation has been used [3]:
=×× (1)
where E is energy (kWh/y), I is irradiation (kWh/m2y), A is effective aperture area (m2)
and η is overall efficiency.
To calculate the PV energy production, eq. (2) has been used [31]:
×
= (2)
×
where E is energy (kWh/y), P is power (kW), G is global irradiation (kWh/m2y),
I is irradiation at Standard Test Conditions (STC) (kW/m2) and Q is quality factor.
The WEAP model is a useful tool for water modelling purposes, however, it must be
considered that it has some limitations [26]. Lack in accuracy is encountered for the
groundwater budgeting, the linkage between other models such as MODFLOW to
WEAP could help to obtain certain quantitative results [21]. The applied discharge cycle
approach is subject to uncertainties, but offers the advantage of a simple application that
corresponds to the scope of the work presented here. WEAP shows as well a limiting
function in the water-energy-forecast, because important parameters such as, e.g.,
efficiencies, specification in the dry cooling technologies, capacity factors cannot be
taken into consideration. Thus, the study results regarding the water consumption in
NOOR Tata are bonded with high uncertainties. A solution presents the combination of
results from energy models such as System Advisor Model (SAM) from National
Renewable Energy Laboratory (NREL) or ColSimCSP (Fraunhofer in-house tool) to
allow more accuracy. Due to time constraints and limited access to these tools, the
application of them could not be used for the present study purpose. However, despite
these uncertainties, which exist in all approaches modelling the future, the results allow a
more profound understanding of possible developments and potential critical trends
associated with them.
STUDY AREA
The Drâa catchment comprises an area of about 34,609 km2 in the south east of
Morocco [32]. Figure 1 shows the administrative context of the Drâa catchment showing
the city of Ouarzazate, Akka Ighane in the province of Tata, the Tiouine and Mansour
Eddhabi dam and the oases along the Wadi Drâa {own Geographic Information System
(GIS) creation – data based on [33-35]}. The Drâa catchment is classified as an arid and
hot desert climate zone [36]. Precipitation is erratic, however, heavy rainfalls typical of
Journal of Sustainable Development of Energy, Water and Environment Systems 4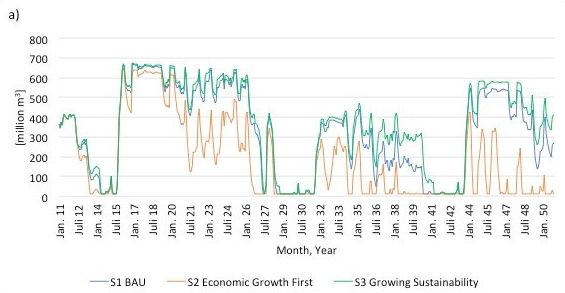
Ersoy, S. R., et al.                                                                                   Year 2021
    Water Scenarios Modelling for Renewable Energy ...                                    Volume 9, Issue 1, 1080335

desert and steppe climates occasionally occur [37]. The actual evapotranspiration (ET0)
sums up to 1,700 mm/y [38]. Akka Ighane, the proposed site for NOOR Tata located in
the southern province of Tata, is characterised by an arid and hot climate with high levels
of irradiation [9]. Figures 2a-c show climate diagrams of Ouarzazate (mean annual
temperature of 22.3 °C and mean annual precipitation of 58 mm), Zagora (mean annual
temperature of 22.2 °C and mean annual precipitation of 46 mm) and Tata (mean annual
temperature of 23 °C and mean annual precipitation of 42 mm). DNI in Tata with daily
average values of 6.7 kWh/m2 and Global Horizontal Irradiation (GHI) with daily
average values of 5.9 kWh/m2 (2008) are shown in Figures 2d-e [9, 39]. Water
availability is strongly dependent on the snow-covered High Atlas mountains [37], where
the perennial river Wadi Dades originates, the river converges at the reservoir Mansour
Eddhabi with the periodic river Wadi Ouarzazate into the river Wadi Drâa [36].
The hydrology in the Drâa catchment is controlled by ‘lâchers’ (releases) of the Mansour
Eddhabi dam, feeding the agricultural sites at the six oases of Mezguita, Tinzouline,
Ternata, Fezouata, Ktaoua and Mhamid [37]. As the Mansour Eddhabi dam loses 0.7% of
its storage capacity per year compared to its initial capacity in 1972 (583 million m3), its
actual capacity is currently around 390 million m3 [40]. Due to strong siltation and high
evaporation losses, an additional dam, the Tiouine dam, with a storage capacity of
270 million m3 was built and has been in operation since 2015. The Tiouine dam mainly
provides the city of Ouarzazate with drinking water, but also supplies water for
agricultural irrigation in the region as well [40].

                             (a)                                                         (b)

       Figure 1. Administrative context of the Drâa catchment (a) and system graph of the Drâa
                                       catchment in WEAP (b)

    The Middle Drâa Valley has a population of 306,905 and about 113,197 people live in
the city of Ouarzazate [41]. The water availability per capita in the Drâa Valley is around
360 m3/y, which is significantly lower than the national average of 700 m3/y [42].
The Drâa Valley and its southern oases are economically marginalised [28].
Economic activities rely mainly on agriculture and farming, the only other industry in the
region apart from tourism is mining [43]. Farmers in the oases cultivate crops such as
wheat, barley, date palms, alfalfa, melons, henna and vegetables, 26,118 ha are irrigated
area [21, 37, 44].
    The cultivation of crops depends heavily on water availability from the Mansour
Eddhabi dam. In years of drought, farmers use mostly groundwater as compensation for
surface water irrigation. This has resulted in a drop of the groundwater table and has

5                                             Journal of Sustainable Development of Energy, Water and Environment Systems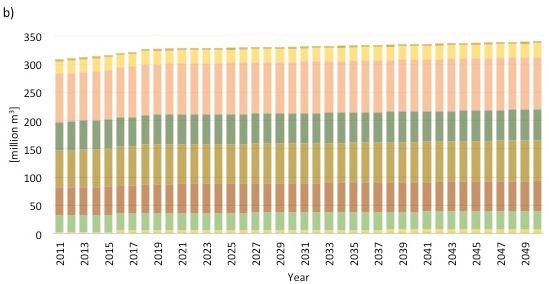
Ersoy, S. R., et al.                                                                          Year 2021
 Water Scenarios Modelling for Renewable Energy ...                           Volume 9, Issue 1, 1080335

caused the water quality to decline due to salinization [45]. Livestock farming consists of
cattle, sheeps, goats and camels which serve mostly for self-consumption [46].
Tourism attracts 411,232 visitors per year (2010) and is economically important for the
region [46].

       Figure 2. Climate diagram: Ouarzazate (a); Zagora (b); Tata (c); DNI in Tata (d) and
                                        GHI in Tata (e)

Journal of Sustainable Development of Energy, Water and Environment Systems                                6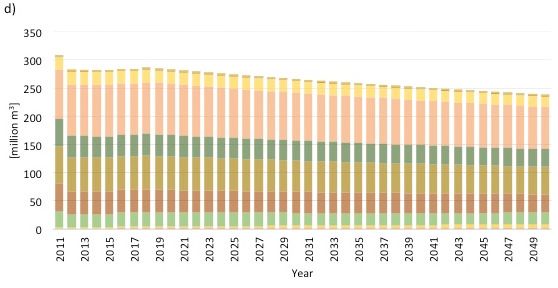
Ersoy, S. R., et al.                                                                                   Year 2021
    Water Scenarios Modelling for Renewable Energy ...                                    Volume 9, Issue 1, 1080335

SCENARIO INITIALIZATIONS AND MODELLING
    In this research, scenarios are applied to describe the potential developments of the
water supply and demand in the Drâa Valley. The scenarios have been generated by:
combining expert interviews to generate qualitative storylines and a WEAP model that
simulates the impacts of certain driving forces under the assumptions of the given
storylines that results in quantitative responses.
    To support the development of the scenarios narratives a total of 10 expert interviews
have been conducted that had a semi-structured form. The experts are relevant
stakeholders from the water and energy sector or work for development or research
institutions in Morocco and Germany. A representative from the province of Tata was
also interviewed to identify strategic development pathways on the political level.
Some information was also gathered through informal background talks during a
two-month research stay in Morocco.
    The WEAP model baseline scenario comprises the years 1984-2011, which is the
current account year. From the baseline scenario, three main scenarios for the period from
2012-2050 are constructed. The scenarios include different socio-economic changes under
the assumption of climate change and the development of renewable energy (Figure 3). In
the following, the different scenario components are described in detail.

         Figure 3. Scenario overview for this research study [Mansour Eddhabi Dam (MED)]

 Climate scenario
    The model refers to the assumption of climate change according to RCP 8.5 adopted
by the Intergovernmental Panel on Climate Change (IPCC) in the fifth Assessment
Report (AR5). The RCP describes the GHG concentration in the atmosphere in
accordance with possible anthropogenic changes in the future. RCP 8.5 is the worst-case
scenario and it assumes a steady rise of GHG emissions until 2100 and a radiative force
of 8.5 W/m2. According to RCP 8.5, under regional extremes it is assumed that the study
region will be characterised by a temperature increase of 1.8 °C and a reduction in
precipitation of 12% by 2050 compared to the base year 2010 [47]. In the model, the
statistical analysis shows that by 2050 the region is characterized by more extremes.
Less normal years will occur, instead dry and very dry years will increase with unusual
short wet periods.

 Socio-economic scenarios
    Three socio-economic scenarios have been adapted from the Moroccan case study of
the Wuppertal Institute for Climate, Environment and Energy (WANDEL) project [48]
and then adjusted based on the evaluation of the expert interviews. Agricultural
development, demographic and social changes, economic and political transformations
are considered in the different scenarios. Table 1 summarises the characteristics of the
socio-economic scenarios.

7                                             Journal of Sustainable Development of Energy, Water and Environment Systems
Ersoy, S. R., et al.                                                                                     Year 2021
 Water Scenarios Modelling for Renewable Energy ...                                      Volume 9, Issue 1, 1080335
                            Table 1. Summary of the socio-economic scenarios

     Topic            S1 – Business as Usual          S2 ‒ Economic Growth First      S3 – Growing Sustainability
                      Urban: 2.25% increase               Urban: 3% increase              Urban: 3% increase
  Population
                      Rural: 0.45% decrease               Rural: 1% increase              Rural: 1% increase
                     Cultivated area remains                 Cultivated area:           Cultivated area remains
  Agriculture
                            the same                          2% increase                      the same
   Livestock
                    Annual decrease: 0.25%               Annual decrease: 2.5%           Annual decrease: 0.5%
    farming
   Irrigation     Irrigation efficiency remains      Irrigation efficiency increases Irrigation efficiency increases
   efficiency            constant at 65%                        up to 85%                       up to 95%
   Reservoir            Storage capacity:                   Storage capacity:               Storage capacity:
    siltation            0.7% decrease                       1.5% decrease                   0.5% decrease

    Scenario 1: Business as Usual. Scenario 1 (S1), Business as Usual, describes the
current socio-economic situation of the Drâa Valley and assumes it will remain constant
in the future. As work is scarce, there is constant migration. Many people continue to live
off money sent from family members who live abroad. The cities remain as areas of
population concentration where the population continues to grow, whereas in the oases
the population declines. People’s behaviour and awareness of water issues does not
change significantly according to Agueniou [49] and Dahan and Grijsen [50].
The tourism sector is concentrated in a few areas and hence, water exploitation remains
high and uncontrolled [51]. With respect to agricultural development, the cultivated areas
remain constant until water scarcity limits their expansion. The selection of cash crops
leads to low water productivity (Figure 4a). As farmers continue to use groundwater for
irrigation and the number of groundwater pumps increases moderately, the water quality
– which is already low – continues to deteriorate. The irrigation techniques remain the
same and, due to a lack of financial opportunities, the efficiency does not change.
Livestock farming level, which is analysed as well by FAO [52] and Gleitsman et al.
[53], decreases reducing alternative income generating activities and food security.
Supportive policies and programmes do exist, but are not accessible to the majority.
Reasons for this include a lack of funding, unresolved land right questions and a lack of
technical know-how. Regional plans continue and the storage volume of the reservoirs
continues to decrease at the same rate.

    Scenario 2: Economic Growth First. In contrast to S1, Scenario 2 (S2), Economic
Growth First, describes a situation of a strong, but unsustainable economic growth.
The government and regional authorities invest in supportive programmes where the cash
crop production and the tourism sector are prioritised. Due to increased employment
opportunities, migration reduces and the rural areas experience a low level of steady
growth. The urban areas continue to grow. The cultivation of cash crops leads to higher
income for farmers. As a result, multiplier effects such as the services sector start to
develop. Higher incomes lead to lifestyle changes, which in turn lead to higher water
consumption per capita. Tourism continues to reach its peak in both the urban and oases
areas. Water consumption in the tourism sector is high. The agricultural areas increase
until water scarcity limits their expansion. The extension of drip irrigation is
implemented, resulting in higher irrigation efficiencies. The crop share favours
water-intensive cash crops for export, such as watermelons and dates (Figure 4b).
This means that the water productivity increases, but the rapid exploitation of
groundwater resources also grows significantly. In addition, the groundwater salinity
levels become very high, leading in the long term to decreased yields. Livestock farming
decreases, because the cash crop market generates more income. The storage volume of

Journal of Sustainable Development of Energy, Water and Environment Systems                                            8
Ersoy, S. R., et al.                                                                                   Year 2021
    Water Scenarios Modelling for Renewable Energy ...                                    Volume 9, Issue 1, 1080335

the reservoirs decreases faster than in S1, because regional funds now invest more in soil
activities that favour the cash crop production rather than in siltation prevention.

    Scenario 3: Growing Sustainability. Scenario 3 (S3), Growing Sustainability,
describes a scenario that emphasises the valorisation of the local culture and regional
heritage. It assumes that the governmental strategy creates programmes and funds to
protect the oases and forests. New initiatives boost the productivity, and the region is
characterised by less migration due to improved living conditions and information
centres. The agricultural sector focuses less on water-intensive crops (Figure 4c) and the
government introduces laws for the mandatory introduction of efficient irrigation
techniques. Livestock becomes an integrated part of farming, animals provide fertilizer in
form of manure. The concept of sustainability becomes an important lifestyle component
with the result that water consumption is decoupled from lifestyle changes and remains
stable. Water saving measures are an element of a strong resources management strategy,
which enhances the water quality in households and in the hotel industry. The tourism
sector embraces eco-friendly tourism focusing more on environmentally-sensitive
tourists who come to the region to visit, e.g., the solar power plants NOOR.
The sedimentation of the reservoir decreases less than in the other two scenarios, because
policies invest strategically into sedimentation removal such as, e.g., hydrosuction [54]
or inflated dams.

     Figure 4. The crop share of the different socio-economic scenarios: S1 (a); S2 (b) and S3 (c)

 Energy scenarios
    The two energy scenarios: Hybrid CSP-PV system, and PV system – describe
hypothetical developments in the study catchment. Different technical configuration
options are examined and analysed.

9                                             Journal of Sustainable Development of Energy, Water and Environment Systems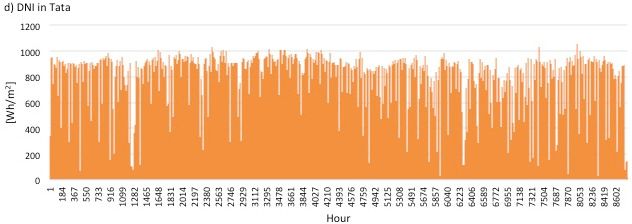
Ersoy, S. R., et al.                                                                          Year 2021
 Water Scenarios Modelling for Renewable Energy ...                           Volume 9, Issue 1, 1080335

    Hybrid CSP-PV system. The hybrid CSP-PV system designed for NOOR Tata
consists of a 180 MW CSP and 420 MW PV power plant. According to MASEN, future
CSP projects in Morocco are obliged to use air-cooled technologies, owing to lessons
learnt from NOORo Ouarzazate and the water scarcity in Morocco. Hence, the design of
the CSP plant uses an indirect dry cooling system (Heller system). The design opts for a
solar tower, as the power block has higher efficiencies and lower specific water
consumption (m3/kWh) than parabolic trough technologies. According to experts, it also
has advantageous life cycle costs compared to other CSP technologies.
    As the DNI for Tata is 2,488 kWh/m2 (in 2008) [9], by applying the eq. (1) the annual
energy production of NOOR Tata CSP is 788 GWh. The overall efficiency for this
configuration is set to 20% considering thermal storage. The PV power plant produces
around 1,313 GWh annually, according to eq. (2). It is assumed that NOOR Tata PV uses
polycrystalline silicon modules with an efficiency of 18% [55].

    PV system. The PV system energy scenario assumes that NOOR Tata will have a
capacity of 600 MW, consisting solely of a PV complex. The same modules and
efficiencies are used as in the hybrid system scenario. In this configuration, the PV power
plant produces with 2,171 kWh/m2 of GHI (in 2008) [9] 1,875 GWh annually.

 Model input data
    The WEAP schematic is based on the imported shapefile that has been generated in
ArcGIS. Products from SRTM 90m Digital Elevation Model have been projected and
masked over the Drâa catchment in southern Morocco [33-35]. The WEAP model
consists of seven demand sites for Ouarzazate city and other households in the oases, six
agricultural and husbandry sites in the oases and two solar complexes – NOORo
Ouarzazate (active from 2016 on) and NOOR Tata (active from 2020 on). Seven main
crop types are farmed in the oases. The water is supplied by the upstream reservoirs of
Tiouine and Mansour Eddhabi and six aquifers at the oasis sites. The six oasis household
sites are solely supplied by the aquifers, whereas the city of Ouarzazate is exclusively
supplied by the reservoirs. The solar power plant NOORo Ouarzazate is supplied by the
Mansour Eddhabi dam. NOOR Tata is supplied for different scenarios either by the
Mansour Eddhabi or the Tiouine dam. It is assumed that all the water is consumed by the
demand sites and does not return into the system. The simulations are run on a monthly
basis. The current account year is 2011 and the historical dataset from which the
scenarios are created is from 1984-2011.

    Climate data. Daily temperature and precipitation data between 1980-2018 for the
site of Zagora has been taken from NASA’s MERRA 2 Re-Analysis (Modern-Era
Retrospective analysis for Research and Application) with a spatial resolution of 50 km
[39]. According to RCP 8.5 [47], compared to the base year 2010 by 2050 the
temperature will increase by 1.8 °C and precipitation will decrease by 12% for the region
of south Morocco which was analyzed as well by De Jong et al. [32] and Busche [36].
The data for long-term mean precipitation has been calculated for 2030 and 2050 and
then interpolated in WEAP. By applying the Water-Year-Method embedded in the
WEAP software [30], a statistical analysis of precipitation data has been carried out to
identify the sequence of dry and wet years. The same climate scenario is applied to all
socio-economic and energy scenarios.
    It must be considered that MERRA 2 is a global reanalysis product that leads to lower
climate data accuracies for the study region in this paper.

   Households. Population data has been obtained from Haut Commissariat au Plan
(HCP) [41]. The data has been extrapolated in a linear manner until 2050. The annual

Journal of Sustainable Development of Energy, Water and Environment Systems                            10
Ersoy, S. R., et al. Year 2021
Water Scenarios Modelling for Renewable Energy ... Volume 9, Issue 1, 1080335
households water demand is defined per capita as 20 litres per day in rural areas and
50 litres per day in urban areas [21].
Agriculture and irrigation. A total irrigated area of 26,118 ha distributed across the six
oases has been simulated (Figure 5) [46]. Seven different crop types – wheat, barley,
alfalfa, henna, vegetables, melons and dates – are planted on the agricultural sites. The
crop factors (Kc values) are taken from Busche [36] and FAO [56].
The irrigation efficiency in the current account year is 65%. According to experts, the
Drâa Valley uses in big extension flood irrigation. 35% of the irrigated water cannot be
used by the crops and evaporates. In WEAP, the transmission links from the river to the
oases represent the irrigation channels and the links from the groundwater nodes to the
oases represent the household water supply. The flow requirements reflect the oases in
which the oases receive irrigation water. Mhamid, as the last oasis, has top priority and
consequently Mezguita, as the first oasis, has the last priority.
Figure 5. Agricultural area by crop type and six different oases [21]
Hydrologic parameters. As a baseline serves historical data from 1984-2011 provided
by Agence du Basin Hydraulique (ABH), Ouarzazate [40] and University of Bonn
(IMPETUS project) [28] on river discharge, groundwater resources, reservoir inflow,
reservoir evaporation, reservoir volume and dam capacity. The data was used on a
monthly basis as a cycle projection until 2050 by assuming a discharge reduction of 20%
[57] and an increase in reservoir evaporation of 6%. The reference ETo was taken from
the Food and Agriculture Organization’s (FAO) Wapor [38]. By using the
Blaney-Criddle-Method [56], the future increase in ETo could be defined as 6% in 2050
compared to the base year 2010. For simplicity reasons and missing data all catchments
are assumed to have the same climate data. For all scenarios the yearly groundwater
recharge is set by a reduction of 1% as a consequence of climate change [58].
The reservoir capacity decreases in all scenarios (Figure 6). Compared to a storage
capacity in 1972 of 560 million m3, the Mansour Eddhabi dam will have by 2050 in
Scenario 1 (Business as Usual) a capacity of 316 million m3, in Scenario 2 (Economic
Growth First) 216 million m3 and in Scenario 3 (Growing Sustainability) 347 million m3
(parameters based on [43, 54, 59, 60]). To guarantee drinking water supply a minimum
threshold of 35 million m3 is assumed in all scenarios [21]. The Tiouine dam, which
started its operation in 2015, has an initial storage capacity of 270 million m3, by 2050
this decreases in Scenario 1 (Business as Usual) to 211 million m3, in Scenario 2
11 Journal of Sustainable Development of Energy, Water and Environment SystemsErsoy, S. R., et al. Year 2021
Water Scenarios Modelling for Renewable Energy ... Volume 9, Issue 1, 1080335
(Economic Growth First) to 159 million m3 and in Scenario 3 (Growing Sustainability) to
226 million m3.
Figure 6. Reservoir storage capacity by number of years: Mansour Eddhabi dam 1972-2050 (a)
and Tiouine dam 2015-2050 (b)
Energy parameters. Two power plant demand sites are integrated into WEAP.
MASEN’s solar complex NOORo (Ouarzazate) consists of four power plants: NOORo I
and II use parabolic troughs, NOORo III uses a solar tower and NOORo IV is a PV
complex. The power plant’s capacity is 580 MW. NOORo comes into operation in 2016
and is linked to the Mansour Eddhabi dam, which supplies the power plant with 2.19
million m3 of water annually for cooling and cleaning purposes according to MASEN’s
[61] and Capitals 5’s [55] information.
The configuration of NOOR Tata is still not defined and the supply source is also in
the evaluation phase. The model is based on two possible configurations and two supply
sources. The configurations assumed are: a hybrid CSP-PV system with 180 MW CSP
and 420 MW PV capacity and a 600 MW PV complex. The supply sources assumed are:
the Mansour Eddhabi dam and the Tiouine dam. For both power plants, the supply
priority for the energy production comes after drinking water (top priority) and irrigation
(second priority).
RESULTS AND DISCUSSION
The results section has been separated into five parts: reservoir and groundwater
storage, water demand in the oases, households and for potential solar energy system
NOOR Tata and the unmet water demand in the oases, households and in NOOR Tata.
Journal of Sustainable Development of Energy, Water and Environment Systems 12Ersoy, S. R., et al. Year 2021
Water Scenarios Modelling for Renewable Energy ... Volume 9, Issue 1, 1080335
Reservoir and groundwater storage
The graph in Figure 7a shows the accumulated monthly storage volume of both
reservoirs by scenario. The graph shows a general negative trend, which fits with
assumptions made about changing precipitation patterns, discharge reductions and
sedimentation in the reservoirs. Although, less precipitation is expected in the future, the
variability of precipitation will be more extreme [24].
In the first model decade 2011-2020, the reservoirs’ storage is low to empty in the first
half – for a simulated drought – and refills after two very unusually wet years. By end of
the second model decade (2021-2030) the reservoir’s storage is again low to empty due to a
simulated sequence of two dry and very dry years that occur in model year 2028 and 2029.
Although, the following model year is a normal year, the reservoirs are not able to recover
immediately and cannot meet the water demand. The lower storage levels in the reservoir
in S2 reflect its higher water demand. The third model decade (2031-2040) is characterised
by more normal years where the reservoirs are able to refill, but do not reach peaks such as
in the first decade, as wet years do not occur in a sequence. The end of the third model
decade and the beginning of the last model decade (2041-2050) are characterised by a
simulated drought of four years. S2 with an overall higher water demand shows here the
worst conditions regarding the reservoirs’ storage: the storage volume remains at lower
levels for several years. Only S3, with its more sustainable water use (higher irrigation
efficiencies and lower water use per capita), maintains steady storage levels a few longer.
The last model decade is characterised by two consecutive wet to very wet years, which are
indicated by peaks in the storage graph. These peaks enable the reservoirs to store water,
which will then be depleted over the subsequent dry years. S2 shows also in the last model
decade the worst conditions due to overall water stress caused by large cultivated areas and
high household water demand, whereas the highest storage capacity is simulated in S3.
Figure 7b illustrates the monthly groundwater storage by socio-economic scenario.
It shows a negative trend which is found as well in Johannsen et al. [21] for the Middle
Drâa Valley and in Droogers et al. [24] within the whole Middle Eastern and North African
region. After a drought period from model years 2014-2015, the water levels in the aquifers
decline followed by an improvement in the subsequent wet model years in 2016 and 2017.
The model shows that groundwater resources act as a buffer for irrigation purposes when
low reservoir inflow impedes irrigation, as found by Johannsen et al. [21] as well. The high
fluctuations reflect the reservoirs’ filling during the wet years. In wet years the aquifers
recover well, because the outflow from the Mansour Eddhabi dam enables water
infiltration into the aquifers [21]. A sequence of two wet or very wet years, as shown in
model years 2016-2017 and 2044-2045, favourably affects the following years: the water
levels in the aquifers remain stable for longer compared to the impact that one wet year has
(such as in model year 2024 or 2034). S2 puts the greatest pressure on the aquifers,
showing them to be depleted by model year 2039, followed by a light recovery before they
are finally and fully depleted in model year 2049. In S3 the aquifers reach their limit by
model year 2050, whereas in S1 there is still water stored in the aquifers by then. S3, which
is supposed to describe the most sustainable socio-economic development, shows a less
positive result than S1 for the long-term future. The reasons for this might be found in the
geographical conditions [21]. Higher irrigation efficiencies and lower water demand lead
to a slower aquifer recharge, because in arid or semi-arid regions the recharge from
precipitation is very low. The aquifers mainly recharge through river-bed infiltration or by
channel/flood irrigation infiltration. S3 needs in absolute numbers less water, which
explains the lower groundwater storage compared to S1, because of lower infiltration rates.
In the first half of the second model decade, the aquifers recover the best in S2, because
irrigation fields are extended leading on one hand to more water use, but on the other hand
to higher infiltration rates. This scenario shifts in the middle of the second decade, as the
13 Journal of Sustainable Development of Energy, Water and Environment SystemsErsoy, S. R., et al. Year 2021
Water Scenarios Modelling for Renewable Energy ... Volume 9, Issue 1, 1080335
exploitation of water is higher than the recovery of the groundwater table. S3 shows the
best aquifer storage in the second half of the same decade, as the impact of the wet model
year 2024 lasts for longer. S1 shows the worst conditions at first, but from the third model
decade, the aquifers have the greatest capacity in response to low irrigation efficiencies and
low or declining population growth in rural areas, which are supplied by groundwater.
Figure 7. Monthly storage volume by scenario: in the reservoirs (a) and in the
groundwater (b)
In summary, none of the scenarios indicate the sustainable use of water. In all
scenarios, the aquifers will be depleted in future. To achieve water savings, methods should
focus on efficiency in order to cope with dry years in the Drâa Valley. Johannsen et al. [21]
suggest using only the groundwater in dry years, to give the aquifers time to recover. This
could, however, intensify water stress because the given water demand cannot be met by
surface water. A measure to tackle this problem, could be cultivated area reduction, as the
largest proportion of the water is used by this sector and reasons for the water storage
decline are found mainly in the agricultural sector. Also, the crop choice is an important
factor to consider. Crops such as watermelons and dates require the most water, however,
these crops are intended mostly for the export market. The declining water quality is a
decisive factor on the crop choice and dates being highly salt tolerant are being prioritized
Journal of Sustainable Development of Energy, Water and Environment Systems 14Ersoy, S. R., et al. Year 2021
Water Scenarios Modelling for Renewable Energy ... Volume 9, Issue 1, 1080335
for the crop cultivation. The crop choice should focus on the one hand on the water
productivity and on the other hand on the guarantee of the farmer’s income [21]. However,
with the majority of farmers being subsistence farmers or rely on their farm to provide for
their livelihoods [21], this could have extensive socio-economic consequences, which
would need to be assessed by in detail by further research. The integration of farmers in the
energy sector by employment in upcoming energy industries could be a measure. The
energy sector itself has a low overall impact on the reservoir or groundwater storage levels.
However, as the potential for water shortages is high, impacts on the power sector can be
expected in the form of unmet demand for cooling or cleaning purposes.
It must be considered that WEAP lacks in groundwater modelling accuracy and is,
therefore, bonded with high uncertainties. It cannot be taken into account important
parameters such as aquifer characteristics, interactions, soil properties, etc. Thus, in
future studies, other models like MODFLOW could be linked to WEAP in order to
achieve more certain quantitative analysis which is also suggested by Johannsen et al.
[21] and by Amin et al. [26].
Water demand in the oases and households
The total annual water demand of the Drâa Valley and the city of Ouarzazate by
scenario and demand site is shown in Figure 8. Figure 8 points out the future trend of the
water resources demand in the Drâa Valley which is similar for the different scenario
combinations. Figure 8a shows solely the results for the CSP-PV NOOR Tata system
supplied by the Mansour Eddhabi dam, as the water demand percentages of the different
sectors show negligible differences in the different scenario combinations. In the model
year 2011, around 306 million m3 of water is required to meet the demand of the Drâa
Valley and the city of Ouarzazate. In the first operational year of NOORo Ouarzazate
(model year 2016) the total water demand is around 318 million m3 in S1. Of the total water
demand, 0.94% is required for domestic use and livestock farming needs 0.2%.
The largest proportion (98.18%) of the water demand is used for agricultural purposes
other than livestock farming. The energy sector consumes in 2016 0.69% (S1), 0.58% (S2)
and 0.78% (S3) of the total water demand. Until model year 2050, the water demand differs
hugely in the three different socio-economic scenarios. The largest water demand is shown
in S2 where, due to the annual increase in cultivated land, the water-intensive sector
consumes 458 million m3 (out of 467 million m3 of total water demand) in model year 2030
and 630 million m3 (out of 643 million m3 of total water demand) in model year 2050. S1
shows a slight increase in total water demand, because population growth increases at a
lower rate in the urban areas and declines in the rural areas. Furthermore, S1 assumes
constant irrigation efficiency in the agricultural sector. Hence, in S1 by model year 2050
the total water demand is expected to be almost 340 million m3. Only S3 shows a steady
decline in the total water demand, reducing to 238 million m3 in model year 2050. This is
due to the implementation of irrigation technologies with high efficiencies assuming an
annually overall increase in irrigation efficiency of 0.75%. In addition, the crop share in S3
reduces water demand in general, as fewer water-intensive crops are planted (Figure 4).
The reduction in date cultivation, which needs more than twice the amount of water than
wheat, combined with a significant reduction in watermelon cultivation, reduces the water
demand in agriculture. Population growth in the cities has greater impact on water use than
in the rural areas. The urban population consumes 50 L/day in S2 and S3, in rural areas the
water use is 30 L/day in both scenarios. Nevertheless, the water consumption per capita
remains lower in southern Morocco compared to other regions of the country [50] and also
lower or at the threshold of 50 and 100 litres of water per person per day which are needed
to ensure that most basic needs are met according to the World Health Organisation
(WHO) [62].
15 Journal of Sustainable Development of Energy, Water and Environment SystemsErsoy, S. R., et al. Year 2021
Water Scenarios Modelling for Renewable Energy ... Volume 9, Issue 1, 1080335
Figure 8. Annual total water demand by scenario (a); water demand by demand sites for: S1 (b);
S2 (c) and S3 (graphs by demand sites do not include demand for NOOR Tata) (d)
Journal of Sustainable Development of Energy, Water and Environment Systems 16Ersoy, S. R., et al. Year 2021
Water Scenarios Modelling for Renewable Energy ... Volume 9, Issue 1, 1080335
Water demand for potential solar energy system NOOR Tata
With regards to the water demand in the energy generation systems, the results show
that the proportion of water used in this sector is in general very low, amounting on
average to between 0.58% (S1), 0.4% (S2) and 0.74% (S3) of the total water demand.
The water authorities have already assigned 1 million m3 for the water use per year for
NOOR Tata to MASEN. In this paper, the system design calculates the water
consumption for the average case. However, the power plant’s capacity is set in the way
that even with higher water consumption the assigned threshold is not passed.
Considering the water demand of the different solar technology option, a solar tower
with Air Cooled Condensers (ACC) cooling technology uses around 80% (0.7 L/m2) of
the total water consumption for mirror cleaning [63]. It is assumed that the CSP plant has
61 cleaning cycles and the PV plant 24. The proposed hybrid CSP-PV system with ACC
would use 597,434 m3 of water, which would still be within the assigned threshold.
According to experts, the water use range for a solar tower with dry cooling technology in
southern Morocco lies between 0.2-1 m3/MWh with simulation uncertainties of +/−20%.
In comparison, a wet cooling technology in CSP plants consumes approximately 90% of
the total water consumption only for cooling purposes. Specifically, the water rate in wet
cooling technologies ranges between 1.8-5 m3/MWh depending on the site and CSP
technology [1].
The option to implement a PV only complex would save almost 520,000 m3 of water.
The total annual water consumption for cleaning purposes at the PV complex amounts to
80,640 m3 with the same cleaning cycle assumed. Figure 9 compares annual water
consumption and energy production for both hypothetical solar power plant
configurations: hybrid CSP-PV system with 180 MW CSP and 420 PV capacity and
600 MW PV system.
Figure 9. Annual water consumption and energy production of different power plant configurations
17 Journal of Sustainable Development of Energy, Water and Environment SystemsErsoy, S. R., et al. Year 2021
Water Scenarios Modelling for Renewable Energy ... Volume 9, Issue 1, 1080335
The results show that the water demand for the energy production sector has a very
small impact on the water demand in the Drâa Valley, compared to the agricultural sector.
However, differences are visible in the different cooling technologies of the CSP plants.
These differences may seem negligible at first sight, but the implementation of the most
water-saving CSP cooling technology can make an impact in very water-scarce regions.
Unmet water demand in the oases and households
Unmet demand is defined as the water amount that cannot be satisfied by water supply
sources to cover a water demand site properly. The model results show that the way that
water is used now and in the future could result in high unmet demand which can lead to
water stress and water scarcity which was found for the region as well in Johannsen et al.
[21] and in Droogers et al. [24]. Figures 10a-d show the results for the case of the hybrid
CSP-PV NOOR Tata system and a Mansour Eddhabi dam supply while Figures 10b-d do
not include the results of the unmet water demand in rural households and NOOR Tata. In
all the model decades, the reservoirs cannot cope with long droughts as their storage
volume steadily declines which results in unmet demand (Figure 10). The groundwater
reserves are the highest by end of the first model decade and at the beginning of the second
model decade, and are capable to buffer water demand for the oases. By the middle of the
first model decade (2011-2020) and by end of the second model decade (2021-2030), the
unmet demand increases as a consequence of a lack of surface water. The greatest impact
can be seen in S2, due to its higher water demand throughout all model decades and its
increasing size in irrigation area. The model decade between 2031-2040 is characterised by
unmet water demand mainly in S2, in S1 and S3 the last years of the same decade and the
beginning of the last decade show some peaks in unmet demand as a result of consecutive
dry years that cause stress, in particular in S2.
Figure 10. Total unmet demand by scenario (a); unmet demand by demand site for: S1 (b); S2 (c)
and S3 (d)
The highest unmet demand (487 million m3) is in model year 2042 for S2, caused by
an extremely low inflow into the reservoir. In this model year, both the groundwater and
reservoirs storage areas are empty in S2. After a refill of the reservoir by the middle of the
Journal of Sustainable Development of Energy, Water and Environment Systems 18Ersoy, S. R., et al. Year 2021
Water Scenarios Modelling for Renewable Energy ... Volume 9, Issue 1, 1080335
last decade due to large precipitation events, the unmet demand is reduced in all other
scenarios, but in S2 the unmet demand shows peaks again.
The unmet demand reflects the high demand in the cities and in the oases. The highest
unmet water demand is in the Ktaoua oasis, which is the largest and requires more water
for irrigation. Mhamid is the southernmost oasis and its cultivated area is the smallest due
to climatic conditions. As a result, it has the lowest unmet water demand in all scenarios.
Comparing the ratio between water demand and unmet water demand, for S1 shows 27%
of water demand being unmet, for S2 63-66% and for S3 22-24%.
In summary, high unmet demand can be attributed mainly to irrigation in agriculture.
The greatest impact is shown by the cultivated area size and its crop share which was
found as well in Johannsen et al. [21]. In order to tackle the high unmet demand in
agriculture, subsidies for the introduction of better irrigation techniques could help to
reduce the overall water demand, as seen in S3. El Hwary and Yagoub [64] suggest
skipping irrigation at certain plant growth stages and this option should also be studied
for the Drâa Valley.
Unmet water demand in NOOR Tata
In the case of the power plants unmet demand would have to be compensated by lower
water use in agriculture. In examining the energy scenarios more closely it becomes clear
that the probability of unmet water demand differs mainly due to the different solar
technologies options. In the assumptions, NOOR Tata could be either a hybrid CSP-PV
power plant or a PV only power plant. The supply sources also vary: the power plant is
supplied by either the Mansour Eddhabi dam or the Tiouine dam. The results show that
there is a negligible difference in unmet demand by supply source. However, variations are
clearly shown for the use of different solar energy technologies. The worst-case scenario
would be a hybrid CSP-PV system with water supplied by the Tiouine dam.
Figure 11 allows for greater examination of the different supply sources and solar
energy technology options. It compares the unmet water of the potential hybrid CSP-PV
system (Figure 11.1) for the two different supply sources Mansour Eddhabi or Tiouine dam
and three socio-economic scenarios S1 (Figure 11.1a), S2 (Figure 11.1b) and S3
(Figure 11.1c), and the unmet water demand of the PV system under the different supply
sources and socio-economic scenarios (Figure 11.2a-c). The blue lines stand for the
Mansour Eddhabi dam supply source, the red lines for the Tiouine dam.
The highest unmet demand for NOOR Tata occurs in S2 with 59% when the Tiouine
dam supplies the water, whereas a supply by the Mansour Eddhabi dam can lower the
unmet demand to 56%. In S1, 22% of the water demand is being unmet for NOOR Tata in
both supply source cases. In S3, 20% of the water demand is being unmet in all cases and
combinations, except for an implementation of a PV only system and a supply source of the
Mansour Eddhabi dam which lowers the unmet demand to 17% and presents itself the best
solution. The results show that there will be supply shortages for the energy sector in
particular in years where the surface water is low. This is the case for some years in the
second and last model decade, which are visible in all three socio-economic scenarios.
In addition, a supply by the Tiouine dam increases the number of years of unmet demand as
shown in the model years 2033 in S2 and 2028 in S3 for the case PV system and Tiouine
dam supply.
The unmet demand for all demand sites, including households, agriculture and energy
sector, in S1 is 27%, when NOOR Tata is supplied by the Tiouine or the Mansour Eddhabi
dam, in S2 66% of the water demand cannot be met for all demand sites, when the Tiouine
dam is the supply source, in S3 24% of the water demand is unmet demand, when NOOR
Tata is supplied by the Tiouine dam. If the Mansour Eddhabi dam supplies the water for
NOOR Tata, S2 has 63% of unmet demand for all demand sites and S3 22% of
unmet demand.
19 Journal of Sustainable Development of Energy, Water and Environment SystemsErsoy, S. R., et al. Year 2021
Water Scenarios Modelling for Renewable Energy ... Volume 9, Issue 1, 1080335
Figure 11. Different water supply options and socio-economic scenarios: 11.1 ‒ Unmet demand
for NOOR Tata as a hybrid CSP-PV system and 11.2 ‒ Unmet demand for NOOR Tata as a
PV system
From a technology standpoint, the best-case scenario would be the application of a
PV only system. However, with the application of a PV system the unmet demand will
still occur according to the model results. To tackle water shortages, particularly in dry
years, alternative supply sources should be taken into account. According to some
experts, one measure could be the transportation of water in tanks from the coast. As the
construction of seawater desalination plants are already an element of the Moroccan
water strategy, water tanks from these desalination plants could be an option to supply
energy sites in water-scarce regions. However, this strategy could generate conflicts as
other sectors and, for instance, farmers would also suffer from the water shortages.
Therefore, further research in form of a cost-benefit analysis could help to evaluate this
option and as well the question, if desalinated water could supply all other remaining
sectors as well, could be studied. Further options could be to build PV panels on the
reservoirs which could lower evaporation losses of the dams and increase the PV cells
efficiency due to a cooling effect of the water or to combine PV with agriculture in form
of agrivoltaics which is emphasized as well by Dinesh and Pearce [65], who studied the
potential of agrivoltaic systems, by Majumdar and Paqualetti [66] who applied this
approach to Phoenix and by Malu et al. [67] who analysed this system for an Indian case
study. Apart from that agrivoltaic systems have the capacity to increase the land
productivity, PV arrays could act as rainwater and irrigation runoff channel. Using PV in
conjunction with a sprinkle irrigation system, the water sprinkled on the PV modules
could have a cleaning effect and drain off on the crops for irrigation and increase the
Journal of Sustainable Development of Energy, Water and Environment Systems 20You can also read