Marginal Abatement Cost Curves for U.S. Net-Zero Energy Systems - A Systems Approach
←
→
Page content transcription
If your browser does not render page correctly, please read the page content below
Marginal Abatement Cost Curves for
U.S. Net-Zero Energy Systems
A Systems Approach

PREPARED FOR

Environmental Defense Fund

PREPARED BY

Jamil Farbes
Ben Haley
Ryan Jones

 August 2021
About Evolved Energy Research

Evolved Energy Research is a research and consulting firm focused on questions posed by transforming
the energy economy. Their consulting work and insight, supported by complex technical analyses of
energy systems, are designed to support strategic decision-making for policymakers, stakeholders,
utilities, investors, and technology companies. They have developed models to simulate and optimize
economy-wide energy systems, bulk power systems operations, and utility distribution systems.

About Environmental Defense Fund

Environmental Defense Fund (EDF) is one of the world’s leading environmental nonprofit organizations.
Guided by science and economics, EDF finds practical and lasting solutions to the most serious
environmental problems.

 Copyright © 2021 Evolved Energy Research LLC. All rights reserved.
Table of Contents
 Executive Summary......................................................................................................................... 2

 Introduction .................................................................................................................................... 8

 The Power of MAC curves ............................................................................................................... 9

 Traditional MAC Curve Limitations ............................................................................................... 11

 A MAC Methodology for Deep Decarbonization .......................................................................... 14

 MAC Curve 2.0 .............................................................................................................................. 17

 Insights by Marginal Abatement Cost Range ............................................................................ 18

 Key Takeaways from the New Curve for Policymakers ............................................................ 24

 Additional Results and Insights ................................................................................................. 25

 Technical Appendix ....................................................................................................................... 31

 Measure Descriptions ............................................................................................................... 31

 Overview of Key Modeling Inputs ............................................................................................. 34

 Supplemental Results for 2030 ................................................................................................. 35

 Methodology Details: Modeling the Range of Least-Cost Systems .......................................... 37

 Methodology Details: Allocating Measure Emission Reductions ............................................. 39

 Overview of Energy System Modeling Tools ............................................................................ 47

© 2020 by Evolved Energy Research 1
Executive Summary
 Traditional marginal abatement cost (MAC) curves have become the de facto starting point for
 comparing emission reduction measures since being popularized by McKinsey & Company more
 than a decade ago. However, traditional MAC methodologies are ill-suited to the task of today
 — analyzing the coordinated deployment of low- and zero-carbon measures required to reach
 net-zero energy systems by 2050. Prior methodologies have failed to assess cross-measure
 interactions and measure deployment across a range of marginal abatement costs, and they have
 relied on a comparison of measures to a counterfactual that does not reflect the dynamics of a
 decarbonizing energy system. This paper presents a new methodology that embraces the aspects
 of traditional MAC curves that make them so compelling (e.g., simplicity and accessibility) while
 also addressing their limitations. By utilizing the latest energy optimization models and systems-
 level analysis, our new approach produces a MAC curve that is more sophisticated and better
 suited for informing policy decisions around achieving net-zero.
 Our approach models changes in the U.S. energy system between today and 2050 as marginal
 abatement costs increase. It produces a MAC curve that is more relevant for analyzing the trends
 and interactions associated with net-zero by making three critical improvements:
 1. Capturing critical interactions between measures and across sectors, including how the
 order of deployment influences the cost and emissions reductions of subsequent
 measures. A classic example of this type of interaction is how the emissions reduction
 potential and marginal abatement cost of electric vehicles (EVs) depend on their
 adoption as well as the simultaneous deployment of clean electricity resources (i.e.,
 emissions reductions from EVs are greater when the grid has cleaner electricity). This
 interdependency of measures is integrated into the analytical framework used to
 produce our MAC curves, resulting in more accurate estimates of measure emission
 reductions and cost.

 2. Using a systems-level methodology to provide insights into the differing costs of
 deploying an individual measure under different contexts. The marginal abatement cost
 of a given measure can vary considerably depending on its level of deployment and the
 deployment of other measures in the energy system. For example, while solar PV might
 be a low or even negative cost measure in many areas of the country today, increasing
 its deployment will eventually require supporting resources (e.g., new transmission
 lines, batteries, or hydrogen electrolysis) to enable its integration — increasing its
 relative cost. Whereas traditional MAC curves generally depict the average cost of each
 measure, our approach shows how each measure could be deployed across a range of
 marginal abatement costs. By highlighting the importance of context and interactivity,
 our approach illustrates there is no single silver bullet solution for deep decarbonization
 and underscores the importance of coordinated measure deployment.

© 2020 by Evolved Energy Research 2
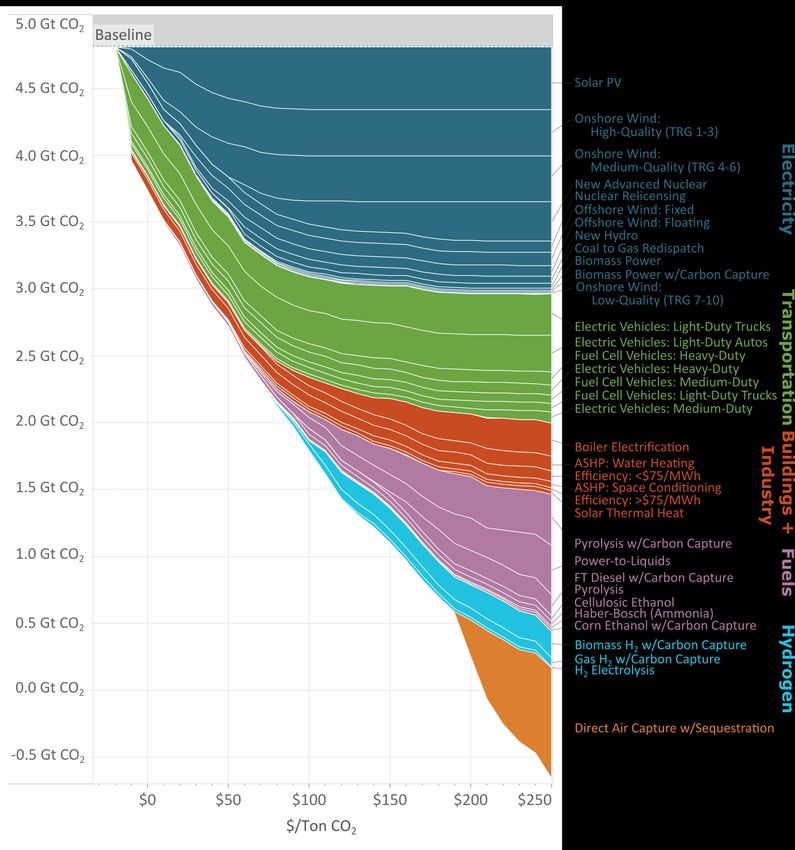
3. Expanding the array of relevant measures to include those that only become cost-
 effective once there is significant deployment of other measures. For instance, electric
 boilers would not be included as an emissions reduction measure using a traditional
 MAC curve because deploying the measure today tends to increase emissions, even
 though it has the potential to decrease emissions if the electricity grid becomes cleaner.
 Since traditional MAC curves are primarily developed by assessing measures against a
 fossil-dominated counterfactual, they do not address how measures perform in an
 energy system with much lower emissions. This in turn limits what these approaches
 can say about when and which measures become cost-effective, as well as, how
 changes in the energy system drive these economics. By evaluating all measures over
 many marginal abatement costs, our new methodology can show the contexts in which
 measures like electric boilers become important, thereby offering deeper insights into
 the ultimate scale of measure deployment for deep decarbonization.
 Figure 1 shows the results of our new methodology, a MAC curve of measures to reduce CO 2
 emissions from the U.S. energy and industry system in 2050. The curve shows annual emission
 reductions from measures relative to a baseline scenario1 as a function of marginal abatement
 cost. At the high end of the cost range in the figure,2 the measures included in this analysis could,
 if deployed in coordination, collectively achieve net-negative CO2 levels in line with net-negative
 greenhouse gas emissions across the whole economy.3

 1
 The baseline reflects estimated measure deployment based on existing policy through the beginning of 2020.
 2
 This range of marginal abatement costs fits with recent studies of achieving net-zero energy and industry CO2
 emissions for the U.S. by 2050 at modest cost, where annual energy system costs as a percentage of GDP are
 comparable or lower than recent energy system costs, including a paper on US Carbon-Neutral Pathways, and the
 Princeton University Net-Zero America study. As a specific example from the Princeton study, several scenarios
 achieve net-zero greenhouse gas emissions by 2050 at a modest incremental cost in the range of 1-3% of GDP. All
 these scenarios have 2050 marginal abatement costs in the range of $250 to above $350 per ton, with the
 differences driven by assumptions about the availability of key technologies.
 3
 See the net-negative emission scenario in the recent US Carbon-Neutral Pathways study, where 2050 CO2 net-
 emissions from industry and energy are -500 million tons.

© 2020 by Evolved Energy Research 3
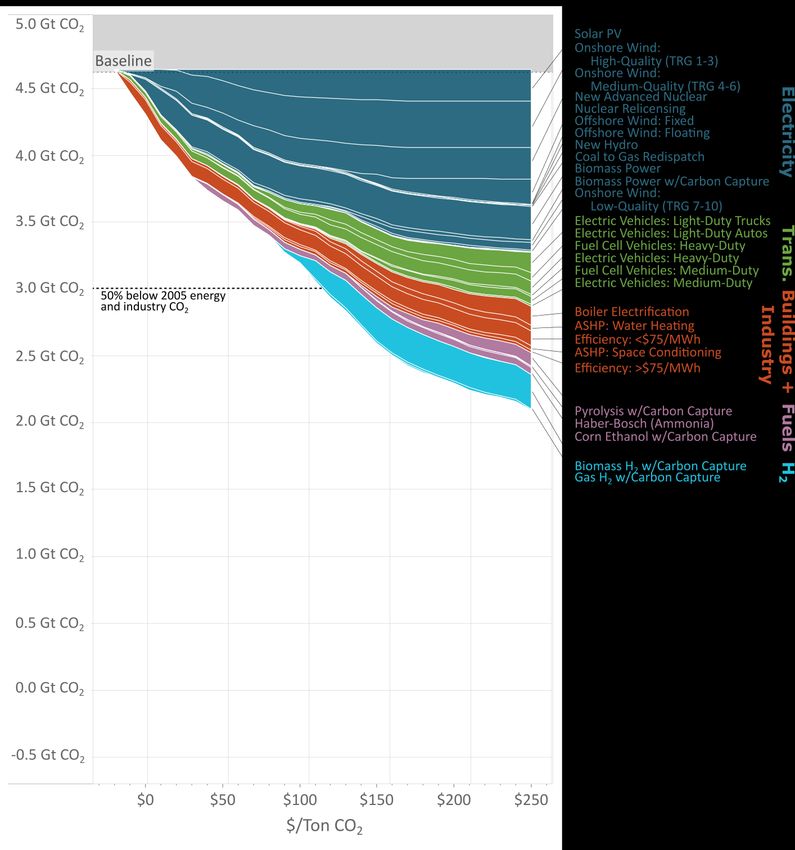
Figure 1 – A 2050 MAC curve developed using the new approach, shows annual reductions from measures
 for U.S. energy and industry CO2, where reductions are relative to 2050 emissions for a baseline scenario.
 Each segment represents an individual measure, and colors correspond to related groupings of measures.

 Click on the text for a
 description of the
 underlying measures.

 This new approach offers key measure-specific insights in terms of deployment levels and
 emissions reductions by 2050. These are organized by ranges of marginal abatement cost:

 • Less than or equal to $0 per ton
 Several measures are cost-effective at marginal abatement costs of $0 per ton or less —
 including several electric vehicle classes, electric efficiency, high-quality solar PV and
 onshore wind resources, and nuclear relicensing. Together, the measures in this range

© 2020 by Evolved Energy Research 4
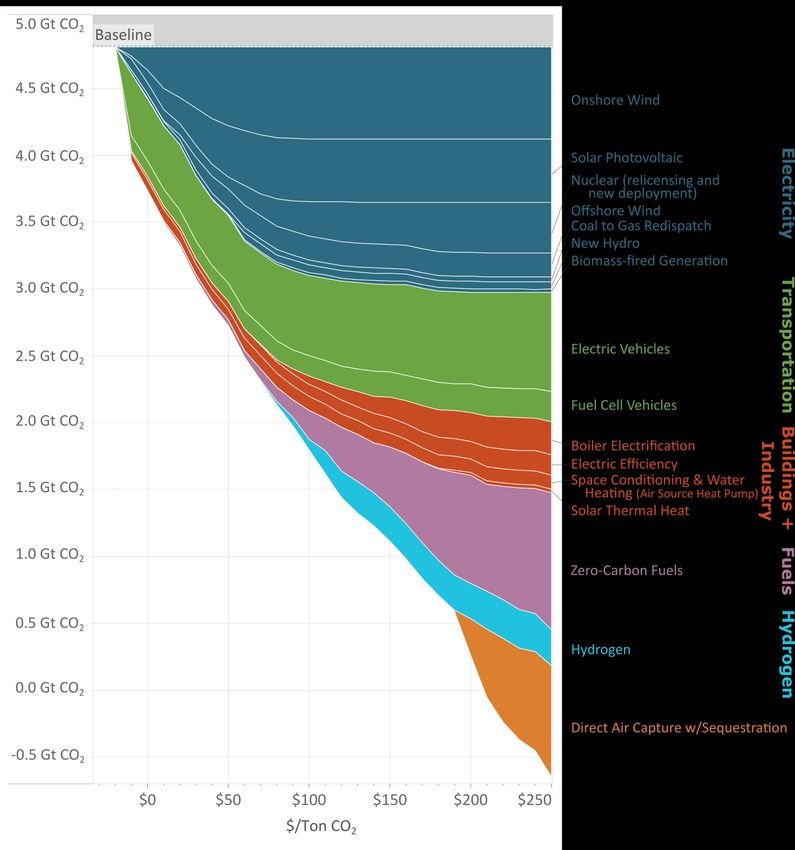
represent more than a gigaton of potential annual emission reductions by 2050. However,
 achieving these reductions will require addressing several non-cost barriers limiting
 deployment, including the slow rate of change of consumer awareness and market
 structures that would incentivize their deployment.

 • $0 to $60 per ton
 In this range, an additional gigaton of annual reductions could be achieved, primarily
 driven by electricity measures including solar PV, onshore wind, and offshore wind.
 Among all measures in our analysis, these renewable generation measures offer the
 greatest opportunity for dramatic emissions reductions at a modest cost — reinforcing
 the policy imperative to support ongoing electricity decarbonization.

 • $60 to $90 per ton
 As marginal abatement costs rise to $60-$90/ton, diminishing marginal returns begin to
 materially impact the cost-effectiveness of deployed measures. Incremental deployment
 of renewables continues in this range but at a much slower rate, involving resources with
 higher integration costs (e.g., new transmission lines, energy storage) and lower energy
 generation for the same installed capacity. Several measures to support the integration
 of variable renewable generation start to become cost-effective in this range, including
 electric boilers, hydrogen electrolysis, and power-to-liquids. New advanced nuclear
 power deployment also becomes cost-effective and represents significant annual
 emission reduction potential by providing zero-carbon electricity for regions with
 constrained renewable resources.4

 • $90 to $150 per ton
 Zero-carbon fuel measures, particularly those derived from biomass, become a significant
 driver of emission reductions in the $90-$150/ton cost range. Biomass-derived fuel
 measures (e.g., biomass pyrolysis and fischer-tropsch diesel) that capture their carbon
 emissions also interact with power-to-liquids measures and begin enabling the
 deployment of synthetic fuel technologies by providing them with required carbon
 feedstocks. Increases in the scale of low carbon hydrogen production also drive
 meaningful emission reductions as both biomass H2 with carbon capture and gas H2 with
 carbon capture become cost-effective. Electric boilers come online as an industrial heat
 alternative and enable substantial emission reductions, both by displacing natural gas
 boiler emissions and by interacting with the electricity sector to support renewable
 integration.

 • $150 to $180 per ton
 As marginal abatement costs rise to the $150-$180/ton range, zero-carbon fuel measures
 become the major emission reduction driver. Deployment of biomass pyrolysis and

 4
 The MAC analysis behind the curve represents the U.S. as 14 regions, which enables this approach to offer
 insights on when regional resource potential constraints drive the deployment of particular measures in a region.

© 2020 by Evolved Energy Research 5
fischer-tropsch diesel continues, but with higher marginal abatement costs due to supply
 constraints driving higher-cost biomass feedstocks. Power-to-liquids and electric boilers,
 both of which depend on linkages to other sectors that face the same higher marginal
 abatement costs, are large contributors to emissions reductions in this range as well.

 • $180 per ton and above
 Deployment of direct air capture with sequestration plays a central role at costs
 exceeding $180/ton, where deployment could drive large-scale emission reductions. The
 abatement cost estimates for direct air capture with sequestration are primarily driven
 by the availability and cost of zero-carbon electricity, which depends on the interaction
 of electricity decarbonization measures with those supporting renewable resource
 integration.
 Across the range of marginal abatement costs, this updated curve provides deeper insights than
 traditional MAC approaches into the suite of measures needed to achieve large emission
 reductions. These advantages become increasingly clear as abatement costs rise and the scale of
 measure deployment creates new dynamics that influence the next phase of deployment. Based
 on these insights, key takeaways for policymakers include:

 • Significant emissions reductions are available at low or even negative costs if non-cost
 barriers can be addressed.5 Under a supportive policy framework, zero-emissions
 vehicles, building efficiency and electrification, and electricity decarbonization measures
 (such as wind and solar deployment and nuclear relicensing) could save over two
 gigatons of CO2 in 2050 – roughly 50% of the way to net-zero CO2 emissions from
 industry and energy use – at marginal abatement costs ranging from negative to very
 modest costs (less than $60 per ton).
 • Decarbonization beyond these initial two-plus gigatons will require further coordinated
 measure deployment. In the transportation sector, zero-emissions-vehicle deployment
 expands to more challenging vehicle classes and consumer segments. In the power
 sector, additional electricity decarbonization becomes more expensive due to
 integration needs and diminishing marginal output potential. Effective policy
 formulations will anticipate the need for both low-cost and higher-cost measures to
 meet ambitous decarbonization goals and focus on enabling the high levels of electric
 vehicle and renewables deployment that are required. Policy interventions, like
 streamlined transmission siting rules and efficient electricity rate design, will be
 essential for achieving these measures’ full potential.
 • Fuels decarbonization, including hydrogen and liquids fuels, could save a little over one
 gigaton of CO2 by 2050 – roughly 20% of the way to net-zero CO2 emissions from
 industry and energy use – but will require the deployment of technologies that are not
 yet commercial or not currently deployed at a significant scale. Support for these

 5
 Examples of non-cost barriers include lack of consumer awareness or incentive structures. These can be
 addressed with targeted policy or programs, such as electric efficiency incentive programs.

© 2020 by Evolved Energy Research 6
technologies today, through research and development, early-stage commercialization,
 and ultimately large-scale deployment, will be important to achieve net-zero emissions.
 • Direct air capture (DAC) has a potentially significant role as a backstop technology. Cost-
 effective deployment of DAC could begin well before emissions from the U.S. energy
 and industry system are close to net-zero. The possibility of DAC playing this role should
 be anticipated, and policy should support near-term commercialization so the
 technology is available to be deployed at scale when it becomes economical for
 decarbonization (i.e., at higher levels of electricity decarbonization and marginal
 abatement costs).
 A systems-level approach to MAC curves can be a valuable addition to the toolkit of policymakers
 who are formulating ambitious decarbonization policy. Our methodology improves on traditional
 MAC approaches to better estimate the cost and performance of measures over a range of
 marginal abatement costs as the energy system transforms. This type of analysis highlights the
 importance of the coordinated deployment of measures. It can help policymakers understand
 how measures must build upon one another to unlock deeper reductions on a path to net-zero
 emissions. Additional results from the analysis, discussed in the body of the paper, offer insights
 into the necessary scale and timing of measure deployment, illustrating how the energy system
 evolves at different marginal abatement costs in 2030, 2040 and 2050. This new MAC approach
 can serve as a foundation for developing decarbonization roadmaps, playing a central role in
 informing R&D, market transformation priorities, and measure deployment strategies to reduce
 emissions at the least cost.

© 2020 by Evolved Energy Research 7
Introduction
 This paper proposes a novel methodology for constructing marginal abatement cost (MAC)
 curves and presents initial results, which offers insights on the cooperative and differentiated
 roles of carbon abatement measures as the economy deeply decarbonizes through 2050. This
 new approach seeks to build on the fluency policymakers have with MAC curves by addressing
 some of the limitations of traditional MAC methodologies when analyzing systems that approach
 or achieve net-zero CO2 emissions by mid-century. Our initial implementation of this new
 approach examines measures for reducing CO2 emissions from energy and industry in the US, but
 future work can adapt this analysis to incorporate more sectors and non-CO2 emission reduction
 measures.6
 For policymakers seeking to understand the relative costs and impact of the menu of carbon
 abatement strategies, the MAC curve has become one of the preferred tools. Traditional MAC
 analyses assess a group of emission reduction measures and provide a sequence of abatement
 actions ordered by increasing cost based on the analysis of each measure’s marginal cost and
 emission reduction potential. The primary result from these analyses is a MAC curve, which
 distills the calculations from the analysis into a single figure that shows both the total abatement
 potential and marginal abatement cost of each measure.
 MAC curves often appear deceptively simple, obscuring the nuances and limitations in the
 analysis behind the chart. While well-executed and appropriately caveated MAC curves can make
 for an effective communication tool, there are significant intrinsic limitations to traditional
 methodologies, including difficulty capturing cross-measure interactive effects and estimating
 context-specific measure costs. These underlying limitations become more problematic when
 analyzing emission reduction targets that could be compatible with the Paris Agreement, which
 will require a sustained effort over multiple decades along with many measures working together
 in coordination. Our new methodology can address these limitations and capture the dynamics
 between critical measures for achieving deep decarbonization.
 The next section of the paper addresses the compelling features of traditional MAC curves. The
 following section lays out the intrinsic limits of current MAC approaches that make them ill-suited
 for supporting ambitious emission reductions. We then provide an overview of the new
 methodology, with a more detailed formulation in the appendix. And the final section of the
 paper presents the results, including key insights for policymakers.

 6
 This initial demonstration of our methodology focuses on energy and industry CO 2 emissions since they represent
 more than 80% of current US greenhouse gas emissions (https://www.epa.gov/sites/production/files/2020-
 04/documents/us-ghg-inventory-2020-main-text.pdf). Our MAC approach offers distinct advantages for assessing
 measures in the system that produces energy and industry CO2 as it has strong interactive effects between
 measures, and the order of deployment can be critical. Measures for other sectors, like agriculture and other land
 uses, and for reducing other greenhouse gases could be incorporated into future analyses with additional
 modeling tools or results from other analyses, such as https://www.epa.gov/global-mitigation-non-co2-
 greenhouse-gases.

© 2020 by Evolved Energy Research 8
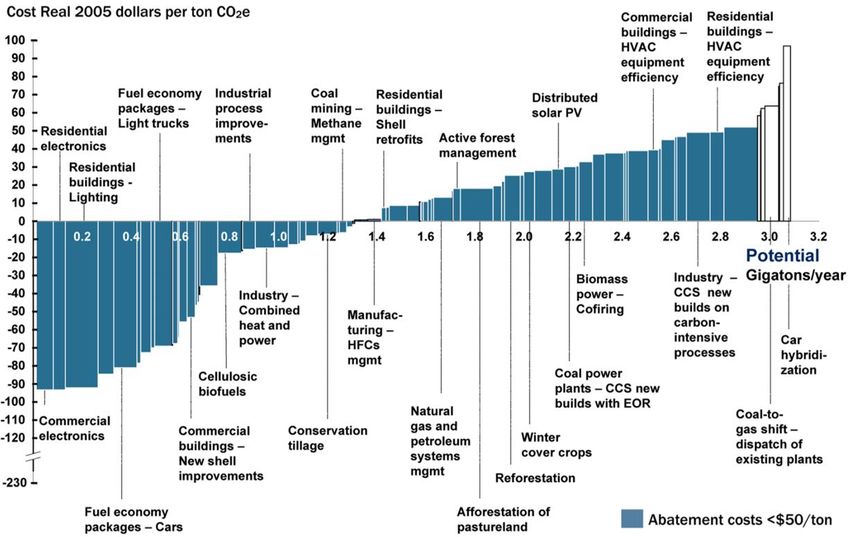
The Power of MAC curves
 To date, MAC curves have served as a starting point for comparing different measures and
 technologies on an equivalent emission reduction basis. These curves have figured prominently
 in climate policy discussions. They have remained a compelling means of presenting measure
 reductions and cost (or savings) since the inception of this form of curve nearly forty years ago.7
 Since then, MAC curves in an emission reduction context have primarily been used to inform
 decisions about prioritizing between a wide array of options when achieving modest reductions
 over a near to medium term.
 Figure 2 – 2030 marginal abatement cost curve from McKinsey & Company’s 2007 study “Reducing US
 greenhouse gas emissions: How much at what cost?”

 Traditional MAC curves all follow a similar form as Figure 2, which shows one of the best-known
 examples of a MAC curve from a 2007 McKinsey & Company analysis.8 These curves order all the
 measures included in the analysis along the x-axis, where the width of each measure indicates
 the estimated emission reduction and the height along the y-axis represents the measures’
 estimated MAC. Measures with a negative marginal cost are, in theory, cost-effective at a
 marginal abatement cost of zero; they would reduce emissions and save money if they can be

 7
 Meier, A., J. Wright, et al. (1981). "Supply Curves of Conserved Energy for California's Residential Sector." Energy -
 - The International Journal 7: 347-358
 8
 https://www.mckinsey.com/business-functions/sustainability/our-insights/reducing-us-greenhouse-gas-
 emissions

© 2020 by Evolved Energy Research 9
deployed. The area swept by the curve through the targeted emission reductions estimates the
 policy cost to achieve those reductions.
 The structure of the curve is both simple and accessible, even for audiences that are not fluent
 with the details of the MAC analysis that generated the results. MAC curves have also had success
 in helping readers better understand the relative costs and scale of reduction potential for
 different measures.
 While traditional MAC curves directly present potential abatement and associated cost, they do
 not necessarily show the reader what order measures should be adopted. The curve’s apparent
 simplicity can leave some readers to infer, incorrectly,9 that the figure is a supply curve.
 Interpreting a MAC curve as a supply curve suggests that it shows the preferred order of adoption
 and that measures should be deployed sequentially by abatement cost, moving from the left side
 of the curve to the right. Many factors beyond marginal cost influence the order of measure
 deployment that will lead to decarbonization at the least cost, including interactive effects
 between measures and the time needed to develop mature markets to deliver technologies at
 scale.

 9
 Vogt-Schilb, Adrien & Hallegatte, Stéphane. (2011). “When Starting with the Most Expensive Option Makes
 Sense: Use and Misuse of Marginal Abatement Cost Curves.” The World Bank, Sustainable Development Network.

© 2020 by Evolved Energy Research 10
Traditional MAC Curve Limitations
 There are structural issues with traditional MAC methodologies that make them ill-suited for
 analyzing the multi-decade effort needed for deep decarbonization. Previous work has identified
 some of the limitations of traditional MAC curves.10 We summarize the issues for ambitious
 decarbonization into three main categories:
 1. Traditional MAC methodologies fail to capture critical interactions between measures
 and across sectors, neglecting how the order of deployment influences the costs and
 emission reductions of subsequent measures (e.g., the cost and emission reductions
 from electric vehicles (EVs) depends on their level of adoption as well as the
 simultaneous deployment of clean electricity resources);
 2. Traditional MAC curves poorly address how a measure’s costs are highly context-specific
 (e.g., early solar PV additions might be a low or even negative cost measure, but at
 higher levels of deployment, the measure will require supporting resources, like storage
 or new transmission, which increases the cost of additional deployment). Typically these
 approaches struggle to represent how different levels of a measure's deployment
 influence its cost or provide limited insights on how the scale of deployment shapes the
 least-cost mix of measures;
 3. Traditional MAC approaches typically exclude measures that can be critical components
 for deep decarbonization but only become cost-effective once there is significant
 deployment of other measures (e.g., electric boilers are often excluded as a measure
 because they tend to increase emissions in today’s energy system, but they have the
 potential to decrease emissions if the electricity grid becomes cleaner).
 These issues make traditional MAC curves poorly suited to address important questions about
 how measures interact as emissions decline and how to scale and sequence investments for deep
 emission reductions at the lowest cost.
 The failure to capture interactive effects is illustrated most acutely with methodologies that
 assess measures in isolation. This approach can work for systems with limited interactive effects
 between measures. These are systems where the order of measure deployment has little or no
 impact on the marginal cost or achieving reductions (minimal ‘path-dependency’). While this can
 be useful for simple systems, in practice, cross-sectoral interactions are the rule and not the
 exception for energy systems. The path-dependency of measures becomes more pronounced as
 emissions from the energy system decline, further complicating the application of traditional
 MAC approaches to deep decarbonization.
 Updates to this MAC approach have used a pre-determined order for applying measures
 (sometimes using the isolated deployment methodology above), where each subsequent
 measure assumes the deployment of all others before it. This approach captures some degree of

 10
 Kesicki, F. and Ekins, P. (2011). “Marginal Abatement Cost Curves: a Call for Caution.” Climate Policy. Vol. 12,
 Issue 2. 219-236. https://doi.org/10.1080/14693062.2011.582347

© 2020 by Evolved Energy Research 11
interactivity. However, with marginal cost and abatement potential being path-dependent, the
 pre-determined order heavily influences the results, and determining the sequence of measures
 can be as much art as science. For example, if electric vehicles come after the deployment of
 renewables, the grid is cleaner and more carbon gets abated. By contrast, if electric vehicles come
 before the deployment of renewables, abatement from electric vehicles will appear smaller.
 Questions of allocating emission reductions are present in all MAC analyses, but because these
 approaches cannot deploy more than one measure at once, they face significant allocation
 challenges, and their results are difficult to interpret.
 Not being able to model the deployment of concurrent measures at a single abatement cost is
 tied to the second structural issue for traditional MAC approaches, which is an inability to address
 highly context-specific measure costs. While many measures may have initial deployments that
 are cost-effective at low MAC, as their deployment increases their MAC rises. The reason for
 these increasing costs is the diminishing marginal returns of abatement measures. All emission
 abatement measures in an energy system show declining marginal impact and increasing
 marginal cost as their deployment grows. This is because all energy commodities exist on a supply
 curve where scarcity in an underlying resource (land for renewables, available biomass, oil wells)
 drives an increasing marginal cost with increasing volume.11
 In a net-zero energy system with high renewable deployment, multiple terawatts of wind and
 solar might be deployed. However, this deployment will be accompanied by other measures that
 interact with renewable generation (e.g., electrification, deployment of batteries, construction
 of transmission). To properly assess cost and emission reductions, these measures need to be
 considered as a system that can fully account for cross-measure interactions and diminishing
 marginal returns. Instead, traditional MAC curves assess one measure (e.g., solar PV) and deploy
 its full potential before moving to the next measure. By neglecting cross-measure interactions
 and simplifying diminishing marginal returns, these analyses create an illusion of a definite
 sequence of deployment that implies policy priorities for ordering measures. In reality, measure
 deployment is more complicated; as increasing amounts of solar are deployed, its marginal value
 as a measure decreases and its marginal costs increase. As more electrification occurs demand
 for clean electricity increases raising the marginal value of new additions, this in turn creates
 room for more solar additions, making new solar deployment economical.
 A partial solution to the diminishing marginal returns problem for traditional MAC curves is to
 break a single measure into multiple sub-measures, each representing a smaller portion of the
 total deployment. However, this often makes interpretation of the curve more complicated and
 does not necessarily provide new information about how and which measures should be
 deployed together. Our new methodology expands on this idea of sub-measures by allowing all
 measures to increase (or decrease) deployment at a single marginal abatement cost and re-

 11
 This ignores ‘technological learning’ whereby greater deployment leads to cost reductions. This does not dispute
 the fact that all energy commodities exist on a supply curve but merely creates a countervailing trend within some
 resources after introducing a time dimension.

© 2020 by Evolved Energy Research 12
envisioning the resulting MAC curve to provide digestible information about concurrent measure
 deployment.
 The final major limitation of traditional approaches is the exclusion of measures that can provide
 meaningful emission reductions once there is deployment of other measures at-scale. Traditional
 MAC methodologies assess measures against a mostly static counterfactual, which means
 measures are compared against a fossil-dominated counterfactual. This disadvantages measures
 that can only cost-effectively reduce emissions when the energy system has already started to
 decarbonize.
 For example, electric boilers are often not included as an emissions abatement measure using a
 traditional MAC curve because deploying the measure today or in a system that looks a lot like
 today tends to increase emissions. However, electric boilers have significant potential to
 decrease emissions once the electricity grid becomes cleaner. Even modified MAC approaches
 that assume a sequence of measure deployment to capture some of the path-dependent effects
 can have issues with these kinds of measures, as the modelers may assume an order of measure
 deployment that never gives these measures an opportunity to become cost-effective. This
 structural issue with traditional approaches ends up excluding measures, limiting what they can
 tell us about which measures become cost-effective and how changes in the energy system drive
 these economics.
 The limitations discussed above muddy the effectiveness of traditional MAC curves to inform
 policymakers. Addressing them can improve the accuracy of cost and emissions reduction
 estimates while also providing clearer insights about the most cost-effective order and bundling
 of measure deployment within a complex system.
 The methodology presented in this white paper tries to embrace the aspects of MAC curves that
 make them so compelling (e.g., simplicity, accessibility) while also addressing these limitations.
 By utilizing the latest energy optimization models, our approach creates a MAC analysis that is
 more sophisticated and better suited for informing policy decisions around achieving deep
 decarbonization.

© 2020 by Evolved Energy Research 13
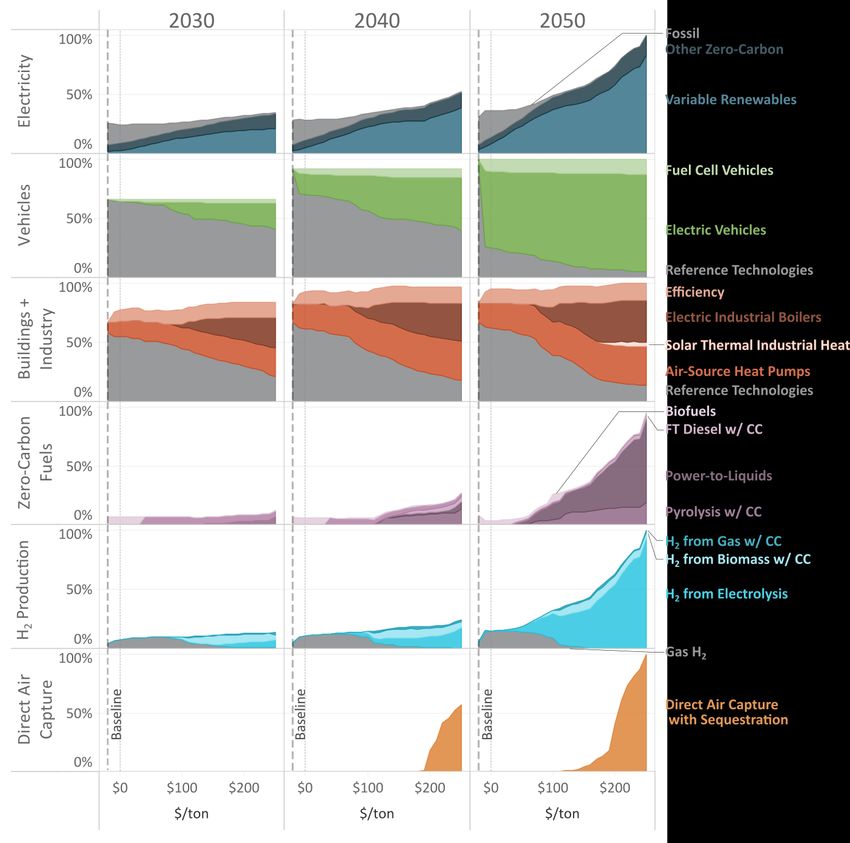
A MAC Methodology for Deep Decarbonization
 The core of our MAC methodology is a comparison of least-cost systems over multiple years at
 different marginal abatement costs. The MAC curve from this approach offers deeper insights
 over a much longer time horizon than traditional approaches, assessing 2030, 2040 and 2050
 over a range of marginal abatement costs. By comparing how changes in the marginal abatement
 cost affect the deployment of all measures, rather than stitching together the changes from
 examining a single measure at a time, this approach can address the limitations of traditional
 MAC methods and capture the dynamics within a system as it evolves to reach low, or even
 negative, levels of emissions.
 Developing a MAC curve based on incremental changes in the least-cost energy system as cost
 increases contrasts significantly with previous MAC analyses. Many past studies have focused on
 narrow scopes and near-term abatement decisions. Generally, these have focused on addressing
 one or more of the following categories: retrospective or near-term prospective evaluation of
 the cost of specific policies,12 characterizing the incremental addition of a select set of measures
 within a narrowly defined set of scenarios,13 or exploring the retrofit of particular resources
 within the existing energy system.14
 Compared to these other approaches, our methodology provides broader insights into the MAC
 of different measures over a 30-year time horizon by more explicitly incorporating path-
 dependent, cross-sector interactions, the diminishing returns of marginal measures, and
 considering measures that become cost-effective when other measures are deployed at scale. By
 addressing the limitations of previous approaches, this methodology provides better estimates
 of cost and emission reductions while also making the timing and optimal order of measure
 deployment an explicit result. With these methodological improvements, this approach can
 better internalize the complicated dynamics of decarbonizing the energy system at a level
 compatible with ambitious climate targets.15
 Implementing this approach requires a different overall structure than previous MAC analysis.
 Whereas previous MAC work considered the change in cost and emissions associated with

 12
 For a recent example, including a meta-analysis of studies in this category, see: Gillingham, Kenneth, and James
 H. Stock. 2018. "The Cost of Reducing Greenhouse Gas Emissions." Journal of Economic Perspectives, 32 (4): 53-72.
 13
 For a recent example, see: Friedmann , S. Julio, and Zhiyuan Fan, Zachary Byrum, Emeka Ochu, Amar Bhardwaj,
 Hadia Sheerazi. 2020 “Levelized Cost of Carbon Abatement: An Improved Cost-Assessment Methodology For A
 Net-Zero Emissions World.”
 14
 For a recent example, see the CCUS economics portion of: National Petroleum Council. 2019. “Meeting the Dual
 Challenge: A Roadmap to At-Scale Deployment of Carbon Capture, Use, and Storage in the United States.”
 https://dualchallenge.npc.org/downloads.php.
 15
 While our new methodology addresses key limitations for using a MAC curve to understand deep
 decarbonization strategies, as with other MAC implementations it does not represent the non-financial costs that
 impede the adoption of measures, including measures that would reduce costs (represent a savings) while also
 reducing emissions.

© 2020 by Evolved Energy Research 14
implementing a single measure, this methodology considers all the system changes driven by
 changes in the marginal abatement cost. Under this approach, each incremental change in the
 marginal abatement cost drives measure deployment from a broader set of available measures.
 This requires a two-step process:
 (1) Modeling the least-cost systems over the range of marginal abatement costs to find the
 changes in emssions and in measure deployment; and
 (2) Allocating emission reductions to each measure, where reductions are allocated based
 on which measure is most proximal to the cause of the reductions.
 The appendix expands on these two steps with a detailed discussion of the methodology,
 including the modeling requirements for the methodology's first step. While this approach
 requires more steps than a traditional MAC analysis, its implementation adds a small amount of
 complexity compared to traditional approaches but yields more insightful results. Key insights
 from this new methodology include:

 • The impact of cross-measure interactions as energy-consuming sectors increasingly
 rely on electricity. Tighter coupling of energy-using sectors to the electricity sector,
 through electrification of transportation, buildings, and industry, along with hydrogen
 from electrolysis, will create new dynamics in the energy system. Large-scale energy
 conversion loads, like electrolysis for hydrogen production and industrial electric boilers
 for steam production, can have significant cross-measure interactions by supporting
 electricity balancing for high renewable systems and lowering marginal abatement
 costs for additional renewable deployment. Our approach captures these systems-level,
 sector-coupling interactive effects, and the results reflect better estimates of MAC for
 all measures in addition to capturing the differing costs of deploying a measure under
 different contexts.
 • The dynamics of cost-effective fuel-switching. The cost-effectiveness of fuel-switching
 measures (e.g., light-duty electric vehicles, air-source heat pumps, medium-duty fuel-
 cell vehicles) depends on various factors as the energy system transforms, including
 how measure costs evolve and the cost of the low-carbon fuel that substitutes for the
 conventional fuel. Other measures—including low-carbon electricity, hydrogen, and
 decarbonized fuel measures—play a significant role in determining the cost-
 effectiveness of fuel-switching. Understanding when fuel-switching measures become
 an economical option for decarbonization can only be done by assessing a range of
 measures at a system-wide level. Our approach is built around the needed systems-
 level analysis to consider the many factors shaping the economics of fuel-switching.
 • Flexilibity’s role in a reliable electricity system. Ensuring reliable hourly operation of
 the electricity system as emissions decline will require a changing set of resources with
 different utilization. An increasing share of variable renewable energy production
 technologies will create new dynamics in the electricity system. These dynamics will
 increase the value of flexibility and quick responses to system needs and, at the same
 time, lower the value of inflexible technologies. These changes impact the MAC

© 2020 by Evolved Energy Research 15
estimates of many different measures. For renewable generation measures increasing
 needs for integration resources like battery storage and transmission resulting in higher
 marginal abatement costs. For measures that depend on the availablity of zero-carbon
 electricity (e.g., electrficaiton of industrial heat and electrolysis), their ability to offer
 flexiblity to a high renewable system can improve their economics. A robust assessment
 of MAC and emission reductions requires need to address these flexibility dynamics.
 Our approach captures this, and ensures that MAC estimates reflect the costs of
 maintaining reliability in a high renewable electricity system.
 • Balancing tradeoffs between regional resource constraints and the cost of moving
 energy between regions. Every geographical region faces resource constraints for
 renewable generation, geological carbon sequestration, and biomass feedstocks. A key
 planning question for deep decarbonization is how to manage the tradeoffs of meeting
 a region’s energy demand with potentially higher cost local resources or investing in the
 ability to transfer energy into the region (e.g., new electricity transmission, new
 pipelines, or biomass transportation costs). Our approach considers these regional
 constraints and finds the tradeoffs that enable decarbonization at the least cost, 16
 factoring the cost of energy transfers into the MAC of measures (e.g., the cost of
 incremental deployment of renewable measures reflects when new transmission
 upgrades are required).
 • The optimal order and timing of measure investments. Over the next thirty years,
 declining resource costs and the range of potential marginal abatement costs can
 significantly impact the timing and order of measure deployment for the system, which
 is a critical component of effective climate policy. Our approach accounts for declining
 resource cost dynamics by modeling mutlipe years for each MAC, sheding light on
 difficult questions around the order and timing of measure deployment. These aspects
 of our new MAC approach are captured in additional results that suppliment the re-
 envisioned MAC curve, see the Additional Results and Insights section.
 The analysis for this white paper includes a baseline scenario in addition to the range of least-
 cost systems at each marginal abatement cost. This scenario reflects what measure deployment
 looks like in the absence of policy intervention. The transition from the baseline scenario to the
 initial step in the range of marginal abatement costs shows how some measures are cost-
 effective even at negative marginal abatement costs if enabling policy is in place.

 16
 Regional results are not shown in this initial demonstration of our new MAC approach. One example of where
 this insight can been found in the results presented here is the deployment of new advanced nuclear, which
 becomes cost-effective as a measure when regions with limited renewable resource potential face higher MAC and
 make tradeoffs between importing more clean electricity or building new nuclear.

© 2020 by Evolved Energy Research 16
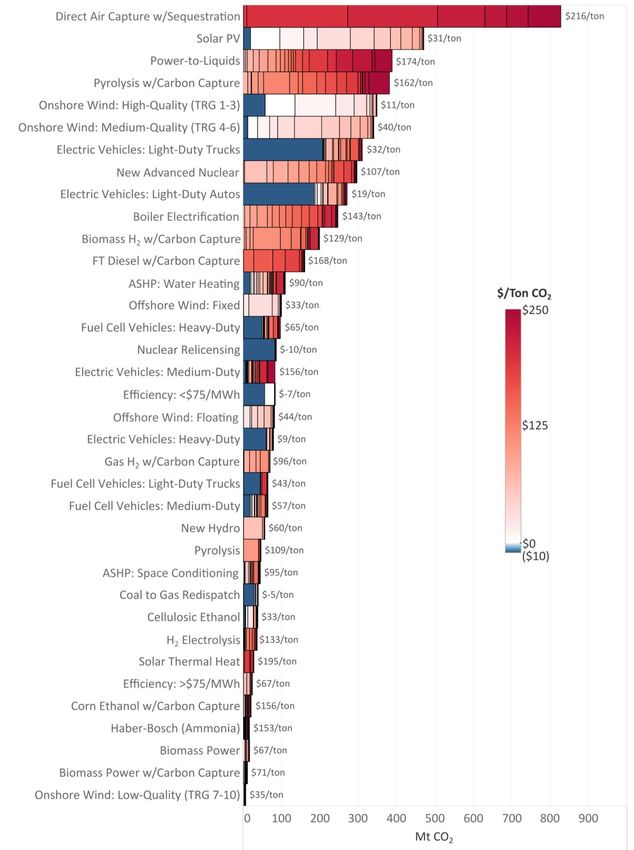
MAC Curve 2.0
 Figure 3 shows a MAC curve of measures to reduce US energy and industry CO 2 emissions
 developed with the methodology presented in this whitepaper. Rather than showing MAC
 against emission reductions like a traditional MAC curve, this curve plots reductions against MAC
 to make it easier to follow emission reductions for measures across multiple MAC. Color
 corresponds to a category of measures, and individual wedges provide measure level detail.
 Figure 3 – A 2050 MAC curve for US energy and industry CO2 where emission reductions are relative to a
 baseline scenario. The MAC ranges on the chart (e.g., I., II.) are addressed in the following section.

 I. II. III. IV. V. VI.
 Click on the text of a
 measure for its description.

© 2020 by Evolved Energy Research 17
Figure 3 shows how emissions decline as more measures become cost-effective at higher
 marginal abatement costs.17 At the high end of the cost range in the figure,18 the measures
 included in this analysis could, if deployed in coordination, collectively lower emissions to net-
 negative CO2 levels. The left-most point on the x-axis represents emissions from the baseline
 scenario.
 The chart illustrates how our systems-level approach makes three critical improvements over
 traditional MAC approaches: multiple measures can be deployed at any marginal abatement cost,
 which means a measure’s emission reduction potential depends on the deployment of other
 measures; deployment of each measure takes place over a range of marginal abatement costs
 depending on what is going on in the rest of the energy system rather than at a single cost level,
 which shows the importance of coordinated deployment for achieving the least-cost mix of
 measures; and the curve provides robust insights about how these measures could collectively
 reduce 2050 CO2 emissions to net-zero, or even to net-negative levels by also including measures
 that only become cost-effective once there is significant deployment of other measures.

 Insights by Marginal Abatement Cost Range
 The curve in Figure 3 shows measure costs and emission reduction potential, just as traditional
 MAC curves do, but also illustrates how an increasing marginal abatement cost will drive system-
 wide effects and the relative strengths of our updated MAC methodology. To demonstrate how
 these are represented in the curve, the x-axis of Figure 3 has been divided into six different cost
 ranges. The following section discusses key insights for each range along the curve and explains
 the dynamics of additional emissions reduction in these cost ranges.

 17
 The structure of the chart is analogous to climate stabilization wedges charts popularized by Stephen Pacala and
 Robert Socolow (https://science.sciencemag.org/content/305/5686/968), but this MAC curve shows reductions
 against marginal abatement cost rather than reductions against time.
 18
 This range of marginal abatement costs fits with recent studies of achieving net-zero energy and industry CO2
 emissions for the US by 2050 at modest cost, where annual energy system costs as a percentage of GDP are
 comparable or lower than recent energy system costs, including a paper on US Carbon-Neutral Pathways, and the
 Princeton University Net-Zero America study. As a specific example from the Princeton study, several scenarios
 achieve net-zero greenhouse gas emissions by 2050 at a modest incremental cost in the range of 1-3% of GDP. All
 these scenarios have 2050 marginal abatement costs in the range of $250 to above $350 per ton, with the
 differences driven by assumptions about the availability of key technologies.

© 2020 by Evolved Energy Research 18
Figure 4 – The change in measure emission reductions over range I, which spans the Baseline to a
 marginal abatement cost of $0 per ton (including negative costs), representing a decrease of 1
 gigaton.

 I. Measures within this range are cost-effective at marginal abatement costs at or less than
 $0 per ton and represent emissions reductions that can be achieved at a cost savings. We
 do not assume these are achieved in our baseline because they may still require
 additional policy support. Though cost-effective across many vehicle classes, electric
 vehicles still need support in the form of enabling policies (EV charger investment,
 efficient electricity rate design, etc.). Electric efficiency may also not be deployed without
 incentive or awareness programs, even when such investments are cost-effective. Finally,
 as heat pump technology improves, these measures may still necessitate market
 transformation programs in areas where they are not prevalent today or not understood
 to be cost-effective. Specifically, some regions where older technologies were not cost-
 effective, like the Northeast, may require policy support even if future measure
 deployment is cost-effective. In electricity, negative cost reductions are available through
 the deployment of high-quality solar PV and onshore wind resources. Nuclear relicensing
 for the existing fleet up to 80 years is a negative cost measure that may not be achieved
 given existing market and incentive structures. Together, the measures in this range
 represent more than a gigaton of annual emission reductions that could be achieved at
 cost savings if the non-cost barriers that prevent their adoption can be addressed. While
 other MAC approaches also find negative cost measures, a fundamental improvement in
 our approach is tracking the continued deployment of these measures at higher MAC. Our
 systems-level approach offers insights on how changing energy system dynamics make it
 cost-effective to deploy more of these measures at higher abatement costs.

© 2020 by Evolved Energy Research 19
Figure 5 – The change in measure emission reductions over range II, which spans marginal abatement
 costs of $0 to $60 per ton, representing a decrease of roughly 1.3 gigatons.

 II. In this range, $0-$60/ton, electricity decarbonization represents the majority of modest
 cost emissions reductions. Roughly one gigaton of annual reductions in CO2 is available by
 2050 at modest marginal abatement costs. Even current technology costs suggest an
 approaching tipping point where aggressive electricity decarbonization policy becomes a
 low-cost means of reducing emissions. This decarbonization is achieved with the
 additional deployment of solar PV and onshore wind as well as offshore wind (which
 increases from effectively no deployment). Whereas traditional MAC approaches can
 present complications in understanding if the order measures were assessed is driving a
 similar result, our methodology directly resolves this issue and provides more robust
 findings that account for cross-measure interactions.

© 2020 by Evolved Energy Research 20
Figure 6 – The change in measure emission reductions over range III, which spans marginal abatement
 costs of $60 to $90 per ton, representing a decrease of half a gigaton.

 III. Additional electricity decarbonization is available in the $60-$90/ton range. Higher
 marginal cost measures result from lower energy production for the same installed
 capacity as the supply of the highest-quality and lowest-cost resources is exhausted, along
 with growing integration needs as renewable penetration increases. These integration
 solutions take the form of battery storage, new transmission, electric boilers, hydrogen
 electrolysis, and power-to-liquids. The interactions of these measures with the increasing
 deployment of electricity decarbonization measures drive their cost-effectiveness. The
 same dynamics that slow the deployment of renewables, principally the oversupply of
 renewable energy in some hours, improve the economics of these integration measures.
 The ability to capture how cross-measure interactions impact the costs and emission
 reductions from all measures represents an improvement over traditional MAC
 approaches. Market structures that encourage investment in these types of integration
 solutions that do not currently exist at scale and are not supported in electricity markets
 today will be imperative to achieving renewables at this scale. Deployment of new
 advanced nuclear power becomes cost-effective at this level, providing electricity in areas
 with constrained renewable resources. Additional heat pump deployment in regions with
 less conducive climates to heat pump performance and electric efficiency also become
 available in this range.

© 2020 by Evolved Energy Research 21
Figure 7 – The change in measure emission reductions over range IV, which spans marginal abatement
 costs of $90 to $150 per ton, representing a decrease of roughly 0.9 gigatons.

 IV. Zero-carbon fuels make more significant emissions contributions from $90-$150/ton with
 the increased deployment of biofuels, specifically biomass pyrolysis and fischer-tropsch
 diesel (increasing from no deployment). Biomass H2 with carbon capture contributes to
 the decarbonization of hydrogen supplies that would be produced from natural gas
 reformation at lower marginal abatement costs. Reformation with carbon capture also
 contributes to hydrogen decarbonization to supply industry as well as the growing use of
 hydrogen in transportation applications (fuel-cell medium-duty and heavy-duty trucks).
 Decarbonization of industrial heat with electric boilers contributes to additional emissions
 reductions due to its ability to link the supply of steam, which otherwise would come from
 natural gas boilers, to the electricity sector. This linkage, referred to as “sector-coupling,”
 lowers industrial emissions while also helping to integrate more renewables on the
 electricity grid. Additional power-to-liquids is also deployed in this range to displace liquid
 fossil fuels. At marginal abatement costs of this level and above, our methodology
 provides marked improvements over traditional approaches since interactive effects
 between measures become a significant driver of MAC and emission reductions of each
 incremental measure.

© 2020 by Evolved Energy Research 22
Figure 8 – The change in measure emission reductions over range V, which spans marginal abatement
 costs of $150 to $180 per ton, representing a decrease of 0.4 gigatons.

 V. Zero-carbon fuels in the form of additional biomass pyrolysis and fischer-tropsch facilities
 become the major emission reduction driver at $150-$180/ton. This set of biofuel
 measures is more expensive due to the rising costs of zero-carbon feedstocks driven by
 supply constraints. Additional electric boilers and power-to-liquids, both of which depend
 on linkages to other sectors that all face the same higher marginal abatement costs, are
 also significant contributors to emissions reductions in this cost range. As with the
 previous range of costs, the improvements in our methodology enable the analysis to
 generate these insights. Traditional MAC approaches cannot determine when the shift in
 focus from electricity to fuel decarbonization occurs because this depends on how costs
 change with a lower emission electricity grid. These measures only become cost-effective
 once there is already large-scale deployment of other measures. Traditional MAC
 approaches rely on assessing measures against counterfactuals that have higher emissions
 and do not reflect the same large-scale deployment of other measures on the system.

© 2020 by Evolved Energy Research 23
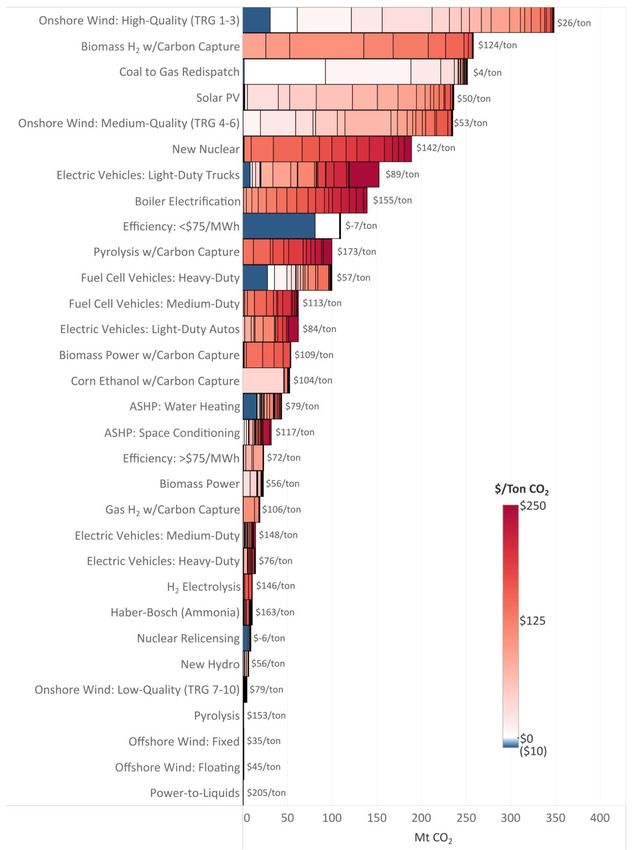
Figure 9 – The change in measure emission reductions over range VI, which spans marginal abatement
 costs of $180 per ton or above, representing a decrease of roughly 1.3 gigatons.

 VI. Direct air capture plays a central role at costs exceeding $180/ton, where direct air
 capture with carbon sequestration is deployed. Direct air capture for utilization (power-
 to-liquids) is deployed at lower costs as well as in this range, but for additional emission
 reductions through sequestration, marginal costs need to approach $200/ton to deploy
 these measures. The abatement cost estimates for direct air capture with sequestration
 are primarily driven by the availability and cost of zero-carbon electricity, which depends
 on the interaction of electricity decarbonization measures with measures that support the
 integration of renewable generation. Without a systems-level approach, it is difficult to
 assess the MAC of direct air capture with sequestration under very-low or even net-
 negative CO2 emissions. Within this cost range, industrial solar thermal heat also becomes
 an option to displace natural gas usage in certain regions with high solar insolation.

 Key Takeaways from the New Curve for Policymakers
 We represent a curve with emission reductions measures in excess of what is needed to achieve
 net-zero energy and industrial CO2 in 2050. Net-zero energy and industrial CO2 is consistent with
 a net-zero economy for all emissions (including non-energy, non-CO2 emissions).19 It is an
 important caveat to note that the curve represented here, despite achieving net-zero emissions,
 is not exhaustive of the potential pathways for doing so. Specifically, significant reductions may
 be available from measures that are not represented in our analysis, such as carbon capture in
 industries like cement as well as iron and steel; additional process heating electrification may be
 available in industry; and there are additional efficiency, electrification, and fuel-switching
 reductions that may be available in off-road transportation (aviation, freight rail, shipping, etc.).

 19
 https://agupubs.onlinelibrary.wiley.com/doi/full/10.1029/2020AV000284

© 2020 by Evolved Energy Research 24
You can also read