March Quarter 2021 - Clean ...
←
→
Page content transcription
If your browser does not render page correctly, please read the page content below

March Quarter 2021
                     1
Table of Contents
Report objective                                                      3

Report disclaimer                                                     3

Executive summary                                                     5

1.     Australian carbon credit units                                 8

       1.1.   Supply and demand balance                                8
       1.2.   Factors impacting supply                                10
       1.3.   Factors impacting demand                                13
       1.4.   Key dates                                               18

2.     Large-scale generation certificates                            19

       2.1.   Supply and demand balance                               19
       2.2.   Factors impacting supply                                20
       2.3.   Factors affecting demand                                26
       2.4.   Market trading                                          26
       2.5.   Key dates                                               32

3.     Small-scale technology certificates                            33

       3.1.   Supply and demand balance                               33
       3.2.   Factors impacting supply                                34
       3.3.   Factors impacting demand                                37
       3.4.   Market trading                                          38
       3.5.   Spot price                                              38
       3.6.   Key dates                                               41

4.     Voluntary private and state and territory government markets   42

       4.1.   Domestic carbon market                                  42
       4.2.   Growth in voluntary market                              43
       4.3.   Prices                                                  46
       4.4.   Other units                                             47

5.     Emissions reduction                                            49

       5.1.   National emissions reduction                            49
       5.2.   National Greenhouse and Energy Reporting data release   50

Glossary                                                              52

                                                                           2
Report objective
Carbon markets play a key role in Australia’s efforts to reduce emissions. The Clean Energy Regulator has
prepared this report to support the effective operation of Australia’s carbon markets.

This report consolidates information across the three national carbon markets the Clean Energy
Regulator administers for the March Quarter 2021 (January 2021 to March 2021) and provides
information on supply and demand trends and opportunities to inform market decisions.

Report disclaimer
All figures are sourced from the Clean Energy Regulator unless otherwise referenced. All statements in
this report reflect current policy settings, other than in specific instances where the Government has
announced or is consulting on proposed policy changes.

This Quarterly Carbon Market report represents the views of the Clean Energy Regulator at the date of
publication. The Clean Energy Regulator is providing this information to the market to increase market
transparency, help identify genuine low-cost carbon abatement opportunities, and assist entities that
produce or need to source units and certificates under the schemes the Clean Energy Regulator
administers. The Clean Energy Regulator has used its best endeavours to ensure the quality of the
information in this document but cannot guarantee its accuracy or completeness. The Quarterly Carbon
Market report is not legal, business or financial advice. You should obtain your own independent
professional advice in light of your particular circumstances on the state of these markets before making
any investment decisions. Neither the Clean Energy Regulator nor the Commonwealth of Australia will
accept liability for any direct, incidental or consequential loss or damage resulting from the Quarterly
Carbon Market report, the information provided through Quarterly Carbon Market report, or the
availability or non-availability of the Quarterly Carbon Market report.

Version history

   Version               Date                                      Changes
 1.00             21 June 2021

                                                                                                      3
4
Executive summary                                                           These matters are further discussed in Chapter
                                                                            2. The Clean Energy Regulator will continue to
                                                                            monitor and report on investments in future
Results from Quarter 1 2021 confirmed that
                                                                            reports.
carbon markets are on track for a growth year in
2021, consistent with the expectations                                      In Quarter 1 2021, the supply of small-scale
published in the December Quarter 2020                                      technology certificates (STCs) and large-scale
Quarterly Carbon Market report.                                             generation certificates (LGCs) hit record levels,
                                                                            up 14% and 24% respectively on Quarter 1
The Large-scale Renewable Energy Target of
                                                                            2020.
33,000 gigawatt hours (GWh) was met at the
end of January 2021 with eligible generation                                Quarter 1 2021 saw 44 projects registered
from 1 February 2020 to 31 January 2021                                     under the Emissions Reduction Fund (ERF), the
reaching an estimated 33,100 GWh.                                           largest Quarter 1 result in the scheme. This
                                                                            follows the record quarterly supply of Australian
The schemes administered by the Clean Energy
                                                                            carbon credit units (ACCUs) of 5.2 million in
Regulator are expected to reduce carbon
                                                                            Quarter 4 2020. ACCU supply in Quarter 1 was
dioxide equivalent (CO2-e) emissions by 57
                                                                            3.1 million, down 14% on Quarter 1 2020,
million tonnes in 2021, up 7% from the 53
                                                                            however claims for a further 2.5 million ACCUs
million tonnes delivered in 2020. This is
                                                                            were under assessment at the end of the
considered a conservative estimate as, for
                                                                            quarter. Total supply for the 2021 calendar year
additional renewable energy, it is estimated
                                                                            remains on track to reach 17 million, up from 16
using the average emissions intensity of the grid
                                                                            million in 2020.
which is falling rapidly. An alternative estimate
would use the weighted average emissions                                    Private demand for ACCUs and LGCs also
intensity of the thermal generation displaced by                            showed strong growth with the highest Quarter
additional renewable energy. Preliminary                                    1 surrenders on record, up 39% compared with
analysis shows this could result in a higher                                Quarter 1 2020. Climate Active demand
emissions reduction estimate of circa 75 million                            accounted for 67% of ACCU cancellations from
tonnes. 1 See Chapter 5 for more information.                               across the economy with the air transport
                                                                            sector particularly active this Quarter. Demand
At the end of the quarter, there were 118 power
                                                                            from corporates with commitments to use
station accreditation applications on hand with
                                                                            renewable energy increased LGC surrenders.
a combined capacity of 875 MW. While no
major large-scale renewable energy project
                                                                            Emissions Reduction Fund (ERF) Auction
reached financial close in Quarter 1 2021,
probable projects (projects backed by a power
                                                                            12 contracted solid volume
purchase agreement but yet to reach financial                               Auction 12, held on 12 and 13 April 2021,
close) continued to grow to 3.7 gigawatts (GW)                              contracted 6.8 million tonnes of forward carbon
– the highest level ever tracked by the Clean                               abatement from 10 contracts at an average
Energy Regulator. PPAs are clear evidence of                                price of $15.99 per tonne, for a total
commercial drivers and have been a good lead                                commitment of $108 million.
indicator of financial close announcements.
                                                                            Optional delivery contracts dominated at
Hence, the Clean Energy Regulator maintains an                              Auction 12, accounting for 98% of the
expectation of between 2 and 3 GW of large-
scale renewables capacity reaching financial
close in 2021. This is a similar level to 2020. The
downside risk to this range is the difficulty, time
and costs in getting connection approvals which
may delay projects reaching financial close.

1 Using the weighted average emissions intensity of displaced coal and gas generation in the National Electricity Market (NEM) could result in
significantly higher emissions reductions. A preliminary estimate by the Clean Energy Regulator, assuming 1 megawatt-hour (MWh) of additional
renewable generation displaces 1 MWh of non-renewable generation, predicts a reduction of over 70 million tonnes of CO2-e in 2021. This
estimate is calculated from Quarter 1 2021 generation and emissions data sourced from OpenNEM.
                                                                                                                                             5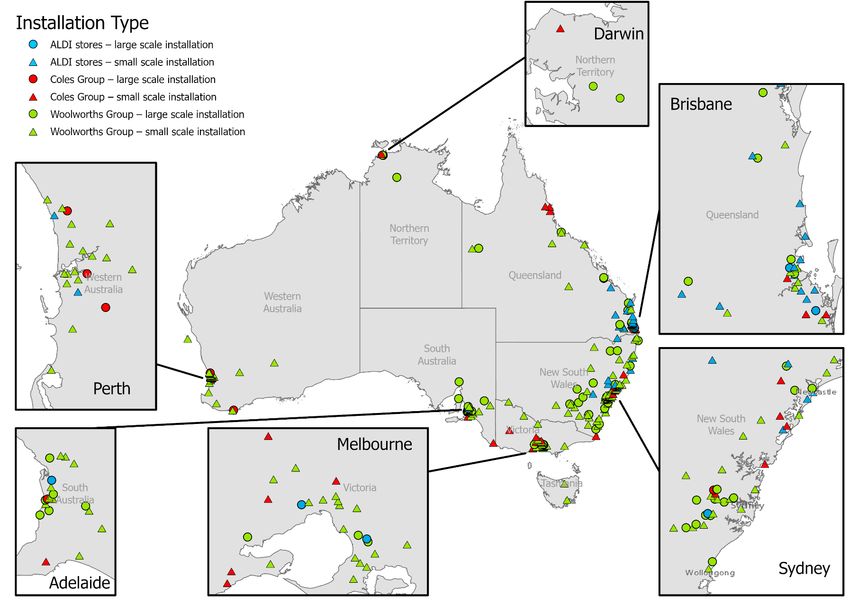
contracted volume. 2 The average price paid for                                Australia leads world in renewables
the optional delivery contract was $15.97, an                                  investment
increase of 14% from the price at Auction 11.
More detail can be found in Chapter 1.                                         Following the Clean Energy Regulator’s
                                                                               announcement of a record 7 GW of renewables
Strong trading in the ACCU market                                              capacity added in 2020, the International
                                                                               Renewable Energy Agency (IRENA) confirmed
The ACCU market saw the highest trading                                        Australia’s position as a world leader in the
activity on record with 1.6 million ACCUs                                      deployment of renewables. 5 IRENA’s Renewable
transacted through 97 transactions. 3 This is a                                Capacity Statistics 2021 report indicates that, in
significant increase in both the volume of units                               total across 2018, 2019 and 2020, Australia has
and number of transactions from Quarter 1                                      added the highest wind and solar capacity per
2020 (950,000 ACCUs transacted through 60                                      capita of any developed nation at 578 watts per
transactions).                                                                 person. For wind and solar investment in 2020
                                                                               alone, Australia added 260 watts per person,
This is positive evidence of an increasingly
                                                                               the second highest per capita capacity and
vibrant carbon market owing to ACCU demand
                                                                               fourth overall 6 for total capacity added. 7
from sources other than demand to meet
contract deliveries from the Clean Energy
                                                                               Rooftop solar continues to grow
Regulator’s auctions.
                                                                               Quarter 1 2021 saw continued growth in
LGC market supply and demand to                                                rooftop solar with an estimated 792 MW
remain tight                                                                   installed, up 28% on Quarter 1 2020.
LGC supply grew in Quarter 1 2021 with 9.2                                     Given the strong Quarter 1 result, the Clean
million, up 24% on Quarter 1 2020. Supply                                      Energy Regulator now expects between 3.5 and
remains on track to exceed the minimum 37                                      4 GW of rooftop solar capacity to be added in
million LGCs expected at the start of 2021.                                    2021 under the Small-scale Renewable Energy
                                                                               Scheme (SRES). 8
However, the market for LGCs is expected to
remain tight through to 2023 as 16 million LGCs                                Combined with an additional 300 to 325 MW of
are needed to redeem $1 billion in shortfall                                   mid-scale rooftop capacity in the Large-scale
revenue under the 3-year rule and voluntary                                    Renewable Energy Target (LRET), the total
demand continues to ramp up. 4                                                 capacity of rooftop solar could exceed 4 GW in
                                                                               2021.
More details are available in Chapter 2.
                                                                               During the quarter, there was increased
                                                                               attention on the ability of the network to
                                                                               accommodate continued high levels of rooftop

2An optional delivery contract is an agreement that gives proponents the right, but not the obligation, to sell up to a nominated quantity of
ACCUs to the Commonwealth at a fixed price. Under these, the Clean Energy Regulator is essentially underpinning the project proceeding with
the project proponent able to find alternative buyers or sell to the Regulator.

3 The Clean Energy Regulator tracks transactions between unrelated parties (not part of the same corporate entity) in the Australian National
Registry of Emissions Units (ANREU). This may result in a higher number of transactions if an ACCU is transferred through multiple parties before
being surrendered. However, consistently measuring this gives a good indication of the level of trading activity in the market. Full data and
methodology can be found in Chapter 1. This data excludes transactions to surrender units against contracts under the ERF.
4 There is a commercial incentive for Renewable Energy Target (RET) liable entities to redeem shortfall charges within the allowable period as (a)

the shortfall charge of $65 per certificate is not tax effective and (b) spot LGC prices are approximately $33 and redeeming shortfall charge is tax
effective. For more information see the Clean Energy Regulator’s website.
5 For more information see the December Quarter 2020 Quarterly Carbon Market report.
6 Behind China, the United States and Vietnam.
7 The watts per capita analysis is calculated using global population statistics sourced from CIA World Factbook.
8
  In the December Quarter 2020 Quarterly Carbon Market report, the estimated range for rooftop solar photovoltaic (PV) capacity was 3 to 4
GW.
                                                                                                                                               6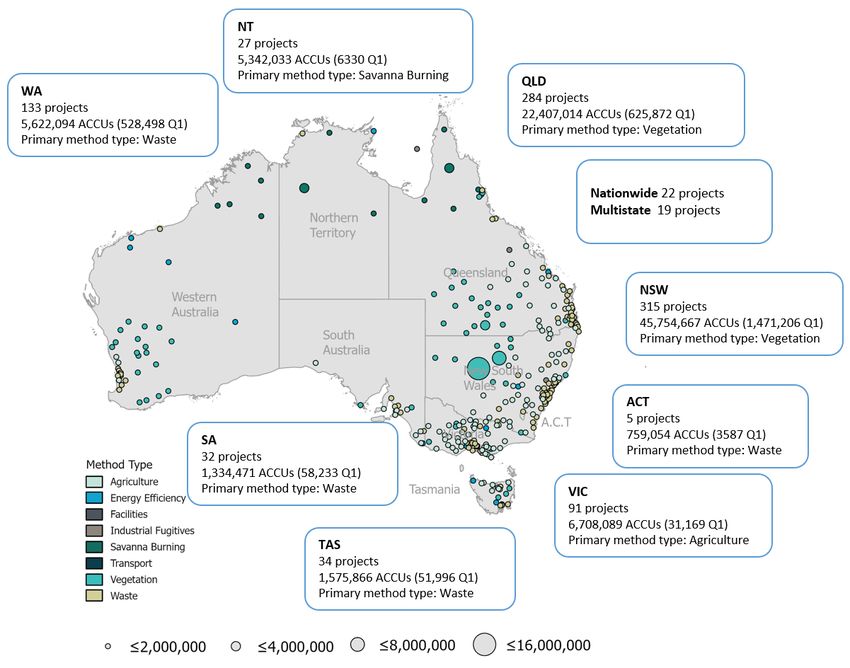
solar photovoltaic (PV) uptake as this is leading                             The Clean Energy Regulator is co-designing with
to record low levels of minimum demand. 9                                     industry the pilot of the Corporate Emissions
                                                                              Reduction Transparency report (CERT) for
In response to these concerns, a number of new                                National Greenhouse and Energy Reporters. The
initiatives were implemented or proposed by                                   CERT guidelines to opt into the pilot are
the AEMC and state governments.                                               anticipated to be available towards the end of
                                                                              2021.
These are discussed in more detail in Chapter 3
on STCs.                                                                      Unit and certificate prices
Supply of STCs in Quarter 1 2021 was 12.5                                     The combination of increased trading and high
million certificates, up 14% on Quarter 1 2020. A                             levels of private demand saw ACCU spot prices
surplus of at least 9.3 million certificates is now                           increase to, and maintain, a new high of $18.50
expected at the end of the 2021 compliance                                    from mid-February to the end of the quarter, up
year.                                                                         from $16.55 at the end of Quarter 4 2020.
Solid growth in voluntary use of ACCUs                                        STC spot prices were higher at the close of
and LGCs                                                                      Quarter 1 at $38.85, an increase of $0.85
                                                                              compared to the Quarter 4 2020 closing price of
Total voluntary private and state and territory                               $38.00. Prices increased to $39.40 following the
demand for LGCs and ACCUs grew from 384,000                                   announcement of the 2021 STP on 3 March
units and certificates in Quarter 1 2020 to                                   2021, before falling as the market saw increased
532,000 units and certificates in Quarter 1 2021.                             STC supply and a likely strong surplus of STCs for
                                                                              the full year at a similar level to 2020.
•       358,000 LGCs were voluntarily surrendered
        in Quarter 1 2021, up 33% on Quarter 1                                The LGC spot price decreased from $40.00 at
        2020.                                                                 end of Quarter 4 2020 to $33.25 at end of
•       174,000 ACCUs were voluntarily cancelled in                           Quarter 1 2021. A decline in price is typical
        Quarter 1 2021, up 52% on Quarter 1 2020.                             following the end of the compliance year on 14
                                                                              February (see Table ES.1).
Announcements of corporate commitments to
                                                                              The Clean Energy Regulator will continue to
reduce emissions continued in Quarter 1 2021
                                                                              monitor price trends during the year given the
with supermarket giant Coles Group committing
                                                                              supply and demand factors discussed earlier in
to net-zero emissions by 2050. Along with
                                                                              this Executive Summary.
Woolworths Group and ALDI Australia, all large
supermarket chains in Australia now have an
emissions reduction target. More information                                  Table ES.1 Price trend, Q1 2021
on their respective targets and mitigation                                      Certificate     Spot price AUD       Quarterly
strategies can be found in Chapter 4.                                           type                                 trend
                                                                                                (31 March 2021) 10
To support growth in the carbon market and
streamline voluntary private sector action to                                   ACCU            $18.50               +$1.95
reduce emissions, the Clean Energy Regulator is                                 LGC             $33.25               -$6.75
seeking a partner or partners to facilitate the
emergence of an exchange traded market for                                      STC             $38.85               +$0.85
carbon offset units. An expression of interest
was published on AusTender in April 2021.

9
    Both low voltage distribution networks and the high voltage transmission networks.
10   Data sourced from Jarden and TFS Green.
                                                                                                                              7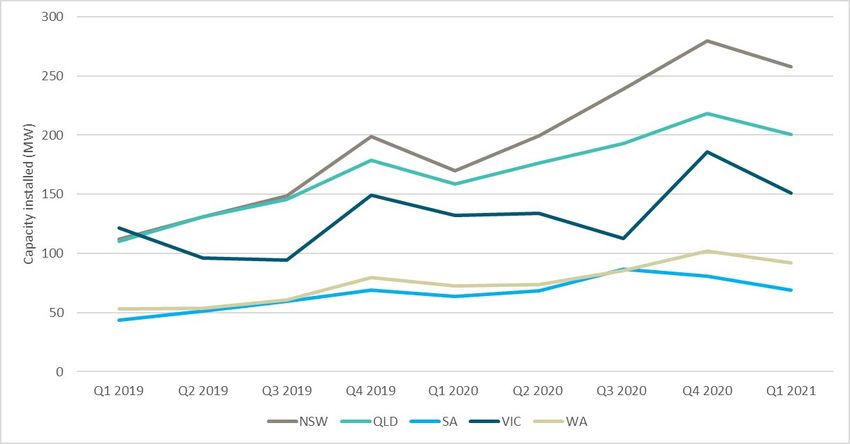
1.        Australian carbon credit units

               • ERF Auction 12 secured 6.8 million tonnes of forward carbon abatement from 10
                 contracts and 10 projects at an average price of $15.99 per tonne, for a total
                 commitment of $108 million.
                   o    Orica secured a contract for 3.4 million ACCUs to improve the emissions
                        intensity of its operations – the first contract awarded for a project under the
                        facilities method.
                   o    Optional delivery contracts were preferred to fixed delivery contracts, with 6.6
                        million tonnes of abatement committed from 9 contracts.
              •    44 new projects were registered in the quarter, potentially delivering up to 13
                   million tonnes of abatement over their project lifetime.
              •    Safeguard demand for the 2019–20 compliance year (88,325 ACCUs) was higher
                   than for 2018-19 (58,731 ACCUs).
              •    Spot prices increased from $16.55 at the end of Quarter 4 2020 to $18.50 at the
                   end of Quarter 1 2021.

1.1. Supply and demand balance
Quarter 1 2021 saw ACCU supply increase by 3.1                               As a result, the balance of ACCUs held in the
million units while demand from ERF contract                                 Australian National Registry of Emissions Units
deliveries, safeguard surrender and voluntary                                (ANREU) decreased slightly to 7.8 million at the
surrender was similar at 3.2 million ACCUs (see                              end of the quarter (see Table 1.1). 11
Figure 1.1).

Figure 1.1 ACCU supply and demand balance (millions), Q1 2019 to Q4 2021

11
   The 7.8 million ACCUs available in ANREU accounts may not be available for sale as a portion of these ACCUs may be held or banked for future
needs (e.g. for delivery under contract, future safeguard mechanism liability or voluntary cancellation).
                                                                                                                                           8
Table 1.1 Balance of supply and demand at Quarter 1 2021 close 12
Balance/supply of ACCUs from Quarter 4 2020 7,882,590
ACCUs issued Quarter 1 2021 3,107,328
Emissions Reduction Fund contract deliveries -2,925,362
Safeguard surrender 13 -88,325
Voluntary surrender -174,489
ACCU relinquishment 14 0
Net balance at the end of Quarter 1 2021 7,801,742
ACCUs held in ANREU accounts by the category
‘project proponent’ decreased by 0.8 million as
project proponents delivered against ERF
contracts or transferred units to other entities
(see Figure 1.2). 15 Holdings by 'business and
government enterprises’ increased by 0.5
million reaching a new peak of 1.8 million
ACCUs, likely accumulated to meet future
safeguard and voluntary demand. Holdings by
the ‘intermediary’ group increased by 0.3
million and reached a peak of 1.5 million ACCUs
– a sign of increasing liquidity in the market.
Figure 1.2 Breakdown of ACCU holdings by market participation (millions), Q1 2018 to Q1 2021 16
12
Within a specified period, supply of ACCUs refers to ACCUs issued. Demand of ACCUs incorporates three sources including Commonwealth
ERF contract deliveries, safeguard mechanism surrenders and state and territory and private sector voluntary cancellation.
13 Safeguard mechanism surrender does not include deemed surrender. A ‘deemed surrender’ occurs when ACCUs issued under an ERF project
at a safeguard facility, in a particular year, are delivered to the Commonwealth under an ERF contract.
14
For more information see ACCU relinquishments.
15 ‘Project proponents’ refer to accounts where the account holder is connected to one or multiple ERF projects. ‘Business and government
enterprise’ refer to accounts where the account holders do not have direct link to ERF projects, and include safeguard entities, voluntary
participants, local government entities that are accumulating for voluntary or compliance purposes. ‘Intermediary’ refer to accounts where
account holder’s primary operation is to facilitate trading of units between the supply and demand sides of the market.
16 Data is accurate as at last day of the quarter.
91.2. Factors impacting supply
Crediting ACCUs were under assessment at the end of the
quarter. Supply for 2021 remains on track to
Following a record quarterly supply of 5.2 reach 17 million units.
million ACCUs in Quarter 4 2020, supply in
Quarter 1 2021 moderated to 3.1 million ACCUs. Vegetation and waste projects continued to
This was 14% lower than ACCU supply in dominate ACCU supply with 59% and 27% of
Quarter 1 2020, however a further 2.5 million total units issued in the quarter respectively
(see Figure 1.3).
Figure 1.3: ACCUs issued per method type (millions), Q1 2019 to Q1 2021
Quarter 1 2021 saw 15 projects credited for the Table 1.2 Crediting status of projects as at end of Q1 2021
first time contributing 570,000 ACCUs to supply, Crediting status No. of projects
most of which came from Western Australian
Human-Induced Regeneration projects. Projects generating ACCUs 520
During the quarter, total issuances under the Projects yet to receive
442
scheme passed 90 million ACCUs. Since 2018, ACCUs 17
ACCU supply has increased year on year at an Conditionally registered 323
average rate of 10% (see Figure 1.4). This rate is
expected to continue as the current pipeline of Unconditionally registered 119
projects (see Table 1.2) enter their crediting
phase and additional supply sources are realised
from new and existing methods. Supply from
these projects is expected to support the
growing voluntary demand for ACCUs and assist
with market liquidity. More information on
voluntary participation is available in Chapter 4.
17
Projects generally take one to two years from when they are registered before they are issued their first ACCUs. Once projects are registered,
they have a crediting period between 7 to 25 years depending on the method.
10Figure 1.4 Annual ACCU issuances, 2012 to 2021
Projects
Quarter 1 2021 saw 44 projects registered, the Quarter 1 2021 saw the first project registered
largest Quarter 1 registration in the scheme and under the facilities method since 2018, and
more than double the number of projects subsequently secure a contract at Auction 12 for
registered in Quarter 1 2020 (20 projects; see 3.4 million ACCUs. The project registered by
Figure 1.5). Collectively these new projects are Orica Australia aims to reduce emissions
estimated to deliver up to 13 million tonnes of intensity of operations at the Kooragang Island
abatement over their lifetime. facility by installing new energy efficient
equipment. Including this project, a total of 3
projects have been registered under the
facilities method to date.
Figure 1.5 New registered projects per method type, Q1 2019 to Q1 2021
11The Department of Agriculture, Water and the Growth in the soil carbon sector continued in
Environment launched its Carbon + Biodiversity the quarter, accounting for half the projects
Pilot during Quarter 1 2021. The Australian registered under the ERF (22 projects). Given
Government has committed $23.5 million for the Government’s recent announcement of
this program. Under this program, farmers will additional funding for farmers to improve soil
receive payments for on-farm biodiversity health, the Clean Energy Regulator will continue
outcomes in addition to any ACCU revenue to monitor these initiatives.
generated by the ERF projects. This is likely to
encourage new project registrations under the NSW accounted for nearly half the ACCU supply
environmental plantings method. this quarter, with majority of this coming from
vegetation projects (see Figure 1.6).
Figure 1.6 Total number of ACCUs issued per method type by location, Q1 2021 and scheme to-date
Investment builds The Clean Energy Regulator is developing a
carbon capture and storage (CCS) method under
Interest in the ACCU market continues to build the ERF for activities that capture and store
with private equity firm Adamantem Capital carbon in secure geological formations. CCS
acquiring a majority share in project developer technology has the potential to underpin new
Climate Friendly. This follows Shell’s acquisition low emissions industries (including hydrogen)
of Select Carbon, and global investment firm and reduce emissions from other economically
KKR’s investment in GreenCollar in 2020. important, hard-to-abate industries such as
cement production and steel manufacture.
The government has committed $50 million for
the development of carbon capture, use and
storage (CCUS) technology.
121.3. Factors impacting demand
Total demand for ACCUs in Quarter 1 2021 was In contrast, demand from voluntary
3.2 million, 6% lower than the same quarter in cancellations and safeguard surrender increased
2020 (see Figure 1.7). This was primarily due to by 52% and 55%, respectively, compared to
lower demand from ERF contracts as Quarter 1 2020.
proponents chose to deliver over 400,000
ACCUs early (Quarter 4 2020). At the end of the Quarter 1 typically sees safeguard demand
Quarter 1 2021, deliveries against realised as safeguard entities that have chosen
Commonwealth contracts were ahead of to use ACCUs to meet their safeguard
schedule at 105.6%. obligations must surrender them by the end of
February. Further information on this is included
in the ‘Safeguard mechanism surrender’ section
below.
Figure 1.7 Actual and estimated demand for ACCUs (millions), Q1 2019 to Q4 2021 18
New sources of demand are emerging. The NSW
government issued an expression of interest for
the supply of carbon credits to offset emissions
of New South Wales light vehicles under their
Net Zero Plan – stage one: 2020-2030. This
initiative aims to use ACCUs sourced primarily
from New South Wales-based projects with a
view to extending the initiative to projects
elsewhere, should demand allow it. This tender
closed on 14 April 2021.
18 Estimated demand is comprised of demand from scheduled delivery against Commonwealth contracts as at 31 December 2020 and estimated
voluntary demand. Scheduled delivery against Commonwealth contracts include optional delivery contracts. ACCUs contracted against an
optional delivery contract may not be delivered to the Commonwealth.
13Commonwealth demand
Demand from scheduled deliveries for 2021 was ERF auction 12 added 6.8 million tonnes to total
12.1 million units. Early delivery against contract potential demand, 95% of which is scheduled to
schedules could increase total 2021 demand be delivered in 2024 and beyond.
beyond this volume. 19 Demand is expected to
rise to a peak of 18.4 million in 2022 (see Figure
1.8).
Figure 1.8 Commonwealth delivery for current portfolio of projects (volume of ACCUs, millions), 2015 to 2033 20
Voluntary cancellations Figure 1.9). While the volume of carbon
abatement purchased is similar to Auction 11 (7
Voluntary private and state and territory ACCU million tonnes), the number of contracts
cancellations in Quarter 1 2021 totaled 174,000, awarded fell – from 33 at Auction 11 to 10
a 52% increase from Quarter 1 2020. Surrender contracts for Auction 12.
against the Climate Active initiative accounted
for 67% of the cancelled volume. There was a clear market preference for the
optional delivery contract with all but one of the
The Clean Energy Regulator estimates that more contracts being optional delivery, representing
than a million ACCUs will be cancelled 98% (6.6 million tonnes of carbon abatement) of
voluntarily in 2021. More information on the the contracted volume.
voluntary carbon market is in Chapter 5.
The price paid for the single fixed delivery
ERF Auction 12 contract was $17 per unit, an increase of 9%
from Auction 11, albeit for a comparatively
The Clean Energy Regulator held ERF Auction 12 smaller volume of 149,000 ACCUs.
on 12-13 April 2021, contracting to purchase
6.8 million tonnes of carbon abatement. A total The price of the fixed delivery contract was
of 10 contracts were awarded for 10 projects at higher than the average price paid for optional
an average price of $15.99 per tonne, an delivery contracts ($15.97). This is expected as
increase of $0.25 from ERF Auction 11 (see the optional contract provides sellers the
19 Commonwealth contract holders can make early deliveries against their contracts including, with the consent of the agency, against
milestones due in future financial years
20 This graph shows Auction 12 scheduled delivery data added to the delivery schedule as at 31 March 2021.
14security of being able to deliver abatement to Continuing on from Auction 11, Western
the Commonwealth at the contracted price Australia secured the highest number of
while also allowing flexibility to choose to sell contracted projects within a single state with 5
some or all ACCUs elsewhere. Sellers are willing of the 10 contracts, accounting for 2.2 million
to accept a lower price for the greater flexibility tonnes of abatement. All 5 contracted projects
offered. are under the vegetation methods.
With 3.4 million tonnes of abatement, Orica The WA Government’s allowance of carbon
Australia’s Kooragang Island facility project farming to be undertaken on pastoral lands has
secured the largest contract, as discussed in the seen an increasing number of projects
‘Projects’ section above. commencing abatement activities, and
subsequent increasing participation in the ERF
New South Wales-based projects represented and auction process.
4.2 million tonnes of contracted abatement.
Figure 1.9 ERF Auction results
15A list of all safeguard entities, their annual
Safeguard mechanism surrender emissions and whether they surrendered ACCUs
is provided in the safeguard baselines table on
A total of 88,325 ACCUs were surrendered for the Clean Energy Regulator website.
the 2019-20 compliance year, a 55% increase
from the 2018-19 surrender volume. 21 Market trading
Safeguard surrender volume is expected to In Quarter 1 2021 market activity reached
grow over the next three years, with the Clean record levels with nearly 1.6 million ACCUs
Energy Regulator estimating between 1.1 and transacted through 97 transactions (see Figure
1.2 million ACCUs will be surrendered by 1.10). This is an increase of 62% in transaction
facilities with multi-year monitoring periods number and 66% in volume from Quarter 1
over this period. 22 While this is a significant 2020.
increase on the volume of ACCUs surrendered
under safeguard to date (679,000 ACCUs, The increased level of activity is due to a
excluding deemed surrenders), it may not combination of demand stemming from
translate to additional demand, as units may safeguard surrender, and private and state and
already be held by entities for this potential territory government sectors wishing to acquire
future demand, as discussed in the ‘Supply and and voluntarily cancel ACCUs.
demand balance’ section above.
Figure 1.10 ACCU market transactions (excluding ERF transactions), Q1 2019 to Q1 2021 23
21 Does not include deemed surrender.
22 This estimate is indicative only as it relies on projections of emissions and baselines for the facilities over a three-year period.
23 ACCU market transactions refer to the transfer of ACCUs between separate entities or groups and does not include issuances and surrenders
of ACCUs. Transactions involving the transfer of ACCUs between project proponents, between project proponents and project developers, and
between accounts belonging to the same company and/or subsidiaries are excluded.
16Spot price slightly to $18.35 at the end of April. 24 April also
saw a forward ACCU trade recorded for
The ACCU spot price increased from $16.55 at February 2022 delivery of 15,000 ACCUs at
the end of Quarter 4 2020 to a record high of $18.70. More forward trades are expected to
$18.50 at the end of Quarter 1 2021 (see Figure emerge as the market continues to mature.
1.11).
Reported parcel size of trades during the
In mid-January, sellers were offering units at quarter averaged 20,000 ACCUs – twice the size
$19 against purchase bids at $17. Prices settled of average parcel sizes traded during 2020.
at $18.50 in mid-February before moderating
Figure 1.11 ACCU spot prices ($AUD), Q1 2021 25
Expression of interest open for the development of an Australian carbon
exchange
The Clean Energy Regulator has called for expressions of interest to accelerate the
emergence of an exchange traded market for emissions offsets, in effect an Australian
carbon exchange. The exchange will make trading of ACCUs simpler and reduce
transaction costs, supporting rapidly increasing voluntary demand from the corporate
sector.
The expression of interest closed on 20 June 2021.
24 Data sourced from Jarden and TFS Green.
25
Data sourced from Jarden and TFS Green.
171.4. Key dates
Date Event Significance
24-25 June 2021 8th Annual Australasian This annual event, hosted by the Carbon Market
Emissions Reduction Institute, will showcase world-leading knowledge
Summit 2021 sharing, commercial interactions and capacity building,
helping delegates to manage climate risk and
opportunities.
1 November 2021 26 National Greenhouse Deadline for NGER reporters and safeguard entities to
and Energy Reporting submit:
(NGER) and safeguard
• 2020-21 NGER data, and
application deadline
• Calculated and production adjusted baseline
applications (for baselines commencing 1 July
2020).
26
The usual NGER and safeguard application deadline is 31 October following the end of the financial year. In 2021 the deadline has been
extended to 1 November, as 31 October falls on a weekend.
182. Large-scale generation certificates
• The Large-scale Renewable Energy Target of 33,000 gigawatt hours (GWh)
was met, on a rolling 12-month basis, at the end of January 2021.
• 165 MW of new large-scale renewable energy capacity was accredited in
Quarter 1 2021, compared to 698 MW in Quarter 1 2020.
o This was expected as several large power stations accredited in late
Quarter 4 2020 were originally estimated to reach accreditation in
Quarter 1 2021.
o Between 2 and 2.5 GW is still expected to be accredited in 2021.
• 19 MW of new projects reached financial close during the quarter and the
pipeline of probable projects with a PPA grew to 3.7 GW, a positive indicator
for further financial close announcements in 2021.
o The financial close announcements for the full year is expected to be
in the 2 to 3 GW range.
• The Renewable Power Percentage (RPP) was set on 3 March 2021 at 18.54%
for the 2021 assessment year. Liable entities will collectively be required to
surrender 32.6 million LGCs on or before 14 February 2022.
• Additional voluntary demand of at least 5 million LGCs to meet corporate and
state and territory government commitments, and 3.4 million LGCs for
shortfall refunds, is expected over the 2021 assessment year.
• LGC spot prices decreased 17% from $40 at the end of Quarter 4 2020, to
$33.25 at the end of Quarter 1 2021.
• The Clean Energy Regulator expects supply of 37 to 40 million LGCs in 2021.
2.1. Supply and demand balance An estimated 43 million to 46 million LGCs are
expected to be available for surrender for the
The Large-scale Renewable Energy Target of 2021 assessment year. This includes 6.1 million
33,000 gigawatt hours (GWh) was met at the LGCs carried forward from previous years with
end of January 2021. Eligible generation from 1 37 to 40 million LGCs expected to be validated
February 2020 to 31 January 2021 reached an in 2021.
estimated 33,100 GWh. 27 More information on
the pathway to achieving the target will be The 2021 RPP was set at 18.54%, requiring liable
available in the 2020 annual statement – Large- entities to surrender approximately 32.6 million
scale renewable energy target met which is LGCs to meet LRET obligations for 2021. In
scheduled to be tabled in Parliament in June addition to the legislated demand, voluntary
2021. demand in 2021 of at least 5 million LGCs to
meet corporate and state and territory
government commitments and a further 3.4
million LGCs for shortfall refunds is expected.
27
Generation estimate calculated from power station data collected by the Clean Energy Regulator, supplemented with generation data from
utility-scale power stations from NEMReview and estimates for mid-scale power stations.
19This increased demand from voluntary ambition the lower bound supply estimate of 37 million
is expected to keep supply and demand balance LGCs.
tight for the year.
However, given the arbitrage opportunity owing
Table 2.1 shows the LGC balance if no shortfall is to lower forward LGC prices, material shortfall
taken for the 2021 assessment year based on charge is expected to be taken for the 2021
compliance year.
Table 2.1 Estimated LGC supply and demand balance in 2021 assessment year (millions)
Supply Demand
LGCs available from previous assessment yearsa +6.1 million
2021 LGC supplyb (available for 2021 surrender) +37 million
Legislated demand for 2021c -32.6 million
Shortfall charge refundsd -3.4 million
ACT Government schemed -2.3 million
Other Voluntary surrendersd -2.7 million
Estimated total balance for 2021 assessment year +2.1 million
Notes:
a
Number reflects the LGCs that were created prior to 2021 but were still registered as available in the REC Registry as at 15 February 2021.
b Numbers based on the lower bound range estimate of 37 million LGC supply in 2021
c
Number assumes no shortfall is taken for the 2021 assessment year
d These values are estimates for 2021 and could vary significantly based on commercial decisions
2.2. Factors impacting supply
LGC supply Quarter 1 2021 saw renewable electricity
LGCs validated in Quarter 1 2021 totalled 9.2 generation account for 29.6% of total NEM
million, a 24% increase on the 7.4 million LGCs generation, an increase of 5.6 percentage points
validated in Quarter 1 2020 (see Figure 2.1). At over the 24% achieved in Quarter 1 2020.
the end of Quarter 1 2021, there were 14 The Australian Energy Market Operator (AEMO)
million LGCs in the REC Registry. released final Marginal Loss Factors (MLFs) for
This increase in 2021 reflects newly accredited FY 21-22 on 1 April 2021. MLFs in New South
power stations ramping to reach full generating Wales, South Australia and Tasmania decreased
capacity, and a reduction in the number of slightly from their FY 20-21 level while on
curtailment events across the National average MLFs across Queensland have
Electricity Market (NEM). That is, existing power increased. In Victoria, MLFs for solar power
stations have spent more hours generating stations increased moderately overall whilst
electricity and at a higher capacity. In particular, wind power station MLFs decreased slightly
curtailment was reduced due to removal of the overall.
generation constraint for a number of West Overall, the effect of these MLF changes in FY 22
Murray solar farms in 2020, a notable issue for is expected to reduce generation by less than
the grid mentioned in previous Quarterly half a percent.
Carbon Market reports. 28
28 For more information see AEMO’s Q1 2021 Quarterly Energy Dynamics.
20Figure 2.1 LGCs validated by technology type (millions), Q1 2019 to Q1 2021
The Clean Energy Regulator expects to accredit
Accreditation 2 to 2.5 GW of large-scale capacity in 2021. At
In Quarter 1 2021, 39 power stations were the close of Quarter 1, there were 118 power
accredited, with a cumulative capacity of 165 station accreditation applications on hand with
MW (see Table 2.2 and Figure 2.2). a combined capacity of 875 MW.
Table 2.2 Power station accreditation capacity (MW) and
This result is consistent with accreditation levels count by state (MW), Quarter 1 2021
foreshadowed in the December Quarter 2020
Quarterly Carbon Market report, as several Capacity (MW) Count
large power stations the Clean Energy Regulator ACT 0 0
had expected to begin scheduled generation in NSW 45 14
2021 commenced generating in late 2020.
NT 0 0
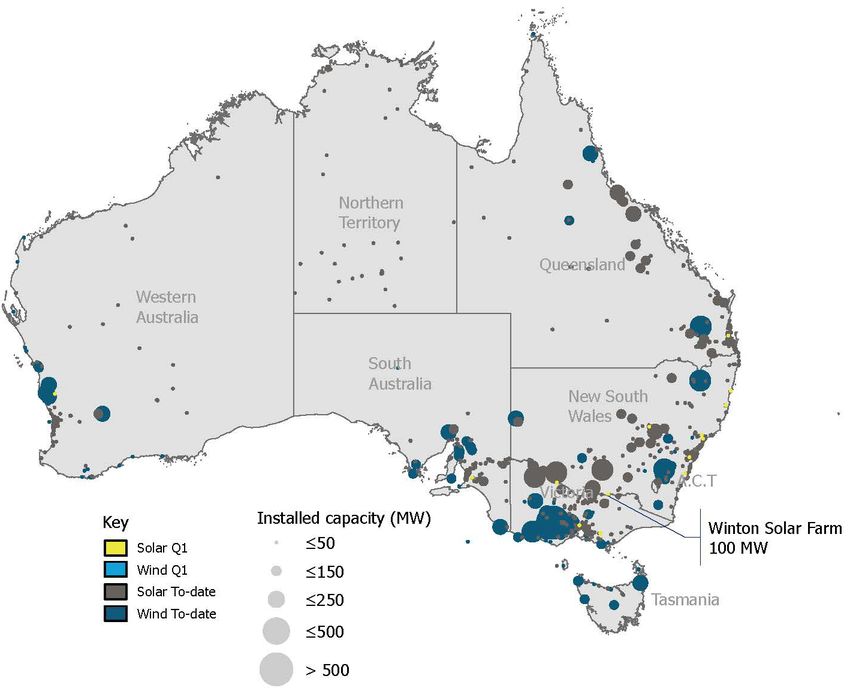
Winton Solar Farm (100 MW) located in Victoria QLD 3 7
was the largest power station accredited in
SA 0 2
Quarter 1 2021.
TAS 0 0
In addition, 11 power stations owned by 113 12
VIC
supermarkets were accredited throughout the
quarter, with a combined capacity of 3 MW. For WA 3 4
more information on supermarket support for Total 165 39
renewable electricity, see Chapter 4 on Note: Totals may not sum due to rounding
voluntary demand.
21Figure 2.2 Wind and solar power stations accredited capacity by location (MW), Q1 2021 and scheme to-date
Committed and probable projects differ greatly from project to project. This
includes the cost, speed and timing of
In Quarter 1 2021, 19 MW of capacity reached connection approvals.
financial close. Announcements on projects
reaching financial close are uneven from quarter There is still strong willingness from all parties
to quarter (see Figure 2.3) as they involve to PPAs to get projects to financial close,
separate commercial negotiations, with however these processes must consider
financing highly sensitive to many factors that connection arrangements.
22Figure 2.3 Capacity committed per quarter and 4 quarter moving average (MW), Q1 2016 to Q1 2021
The inconsistency of financial close capacity projects with a combined capacity of 490 MW.
reaching financial close from quarter to quarter PPAs have proven to be a very reliable indicator
is expected to become more pronounced of future financial close announcements.
moving forward as a result of the increasing
trend towards very large and gigawatt-scale The record level of capacity in the PPA
projects, discussed previously in the September (probable) category gives the Clean Energy
Quarter 2020 Quarterly Carbon Market report. Regulator confidence to maintain its estimate
that between 2 and 3 GW of capacity can still
Figure 2.4 shows the trend in financial close reach financial close in 2021. The Clean Energy
announcements on a calendar year basis. There Regulator considers it too early to be calling an
was a pullback in investment in 2019 after the ‘investment stall’ as some are doing.
boom to reach the 2020 large-scale renewable
energy target. However, the 2.1 GW reaching While there are strong commercial drivers to
financial close in that year was still more than 5 get projects with PPAs to financial close, the key
times the pre boom average of 400 MW per downside risk will be the increasing cost,
annum prior to 2016. 2020 saw an increase to uncertainty and delays in grid connection
2.7 GW reaching financial close. approvals. At some stage investment may stall if
delivery of transmission and interconnector
The Clean Energy Regulator’s pipeline of upgrades is not sped up.
projects with a power purchase agreement
(PPA) reached a record 3.7 GW at the end of The Clean Energy Regulator will continue to
Quarter 1 2021 following the addition of 2 new update on this in future reports.
23Figure 2.4 Capacity committed annually (MW), 2016 to 2021
24Yallourn early closure a potential driver for Hence, it is reasonable to assume added
additional renewables generation capacity is needed over and above
the existing large-scale wind and solar projects
In early March 2021, EnergyAustralia announced and rooftop solar additions before mid-2028.
plans for the Yallourn coal-fired power station
to retire in mid-2028, 4 years earlier than Given current grid constraints and assuming no
initially planned. Generation from the Yallourn other early closure of coal-fired power station,
power station has been declining on average there is a range of renewable energy options to
5.2% per year since 2016, which coincides with meet the additional generation requirement.
the influx of new renewable capacity added to There is great potential for onshore wind in
the grid. In 2020, Yallourn generated around Tasmania at almost offshore wind capacity
9.2 terawatt hours (TWh) of electricity. 29 This factors in some locations. However, little of this
decline in generation is in line with decreases can be realised until at least the first 750 MW
seen at other brown coal power stations. Marinus Link is built, currently planned for
completion in 2028-29 after the Yallourn
In announcing the early closure, EnergyAustralia closure. 31 Another extended outage of Basslink
has given the market time to respond to the is a risk that must be considered.
anticipated supply deficit without placing
pressure on electricity prices. To assist the There is also a 2 GW offshore wind project, Star
transition, EnergyAustralia will build a 350 MW, of the South, planned to be built off the
four-hour utility-scale battery by 2026. Gippsland coast. 32 If the project is feasible and
meets approval requirements it could be
To replace the current level of generation from operating at full capacity by 2030.
Yallourn, the Clean Energy Regulator estimates
an additional 3.7 to 6.5 GW of renewable Other brown coal generators are operating at
capacity would be required, depending on the lower than historical capacity factors owing to
mix of energy sources. 30 the ongoing influx of renewable energy, and
they may be able to partially offset the lost
The Clean Energy Regulator is tracking a further generation from Yallourn. However, it has been
1.2 GW of renewable capacity with PPA or reported that brown coal plants continue to
financial close in Victoria. Rooftop solar capacity have material outages and the remaining plants
additions in Victoria is likely to be 660 to 760 will be 7 years older by mid-2028. 33
MW in 2021 and, if that rate continues, could
make a material contribution to additional Renewable Energy Zones in Victoria are at an
capacity and generation – even at a lower early stage of development. This may be the
capacity factor of 15%. only option that could be delivered, enabling
more large-scale onshore wind and solar in
If that 1.2 GW of large-scale projects is built, Victoria, prior to the mid-2028 exit deadline for
and if Victoria continues to add around 700 MW Yallourn – unless Star of the South or Marinus
of rooftop solar per annum to mid-2028, total Link timelines can be brought forward.
capacity of circa 6.1 GW may be almost enough
to replace the energy generated in 2020 by All of this points to a need for flexibility and
Yallourn. However, this renewable energy would some level of ‘insurance’ in ensuring reliability
need to be firmed. Additionally, this assumes and security. There is currently a great deal of
electricity demand remains flat. debate regarding the preference for large
batteries or gas-powered generation, including
Excluding the possibility of the loss of a large whether large batteries can provide the firming
load source, it is generally expected that the system needs in such a fast transition to
material fuel switching to electricity will start to variable renewable energy.
occur well before mid-2028.
29 Data sourced from NEMReview.
30 This assumes a capacity factor of 0.35 for wind power stations and a capacity factor of 0.2 for solar power stations.
31 This project has not reached financial close.
32
This project has not reached financial close.
33 For more information see AEP Elical’s assessment of ageing coal-fired generation reliability report.
25It is possible the firming needs will be more than 2.3. Factors affecting demand
the 350 MW battery announced by
EnergyAustralia and other batteries currently Voluntary private and state and territory
proposed in Victoria.
government demand
Batteries have exceeded expectations in
Quarter 1 2021 saw 358,000 LGCs voluntarily
relation to the speed at which they can respond
surrendered, a 33% increase on Quarter 1 2020
to a sudden drop in frequency in the grid and
surrenders. Supported by this heightened
the timeframe to commission new builds.
interest, voluntary surrenders in 2021 look on
However, like pumped hydro they are a net
track to reach a record 5 million LGCs.
load. That is, they require excess generation to
charge and discharge between 10% and 20% For a detailed breakdown of voluntary
less energy than is required to charge. surrenders and the outlook for 2021, see
Chapter 4.
Snowy Hydro states that Snowy 2.0, a new
pumped hydro system, is expected to generate
its first power in 2025 with progressive
2.4. Market trading
commissioning of the 6 generation units. If this Over the quarter, the LGC spot price decreased
project is delivered on time with all associated by 17%, from $40.00 at the end of Quarter 4
transmission, and with sufficient additional 2020 to $33.25 at the close of Quarter 1 2021.
generation to pump, then this could provide After holding value early in the quarter as liable
significant flexible capacity to firm variable entities sought LGCs for the February surrender,
renewables for Victoria. spot prices then declined over February and
The Clean Energy Regulator’s analysis shows March to parity with the Cal21 prices.
that timing is critical in considering these The forward prices for LGCs created in future
options. Gas power generation can provide years have steadily increased since late 2019
some insurance in a fast transition to variable (see Figure 2.5). For example, the future market
renewables as it can be built in a relatively short for LGCs created in 2023 (Cal23s) increased
time frame, start up quickly and provide from $9.60 at the end of Quarter 1 2020 to
ongoing generation if needed. Gas plants are $18.00 at the end of Quarter 1 2021. 34
typically the last to be dispatched by AEMO
unless ordered on for system security reasons. Possible reasons are that the market may not
Consequently, they only operate when the have, in the past, fully recognised the
system actually needs additional generation. cumulative level of shortfall charge to be
redeemed over a number or years; or
Diversification of types of flexible capacity may anticipated such a rapid increase in voluntary
be useful in a fast transition with many demand for LGCs to prove use of renewable
uncertainties. energy.
More detail on the characteristics of different The forward LGC market still shows future prices
types of flexible capacity can be found in the are lower than the current spot price, as future
Clean Energy Regulator’s submission to the supply may eventually outpace future demand.
House of Representatives Inquiry into the So, while the overall price trend is down, it will
current circumstances, and the future need and be interesting to see the price point where the
potential for dispatchable energy generation market finds a floor and how that might relate
and storage capability in Australia. to the ACCU price.
34 Data sourced from TFS Green.
26Figure 2.5 LGC spot and forward prices ($AUD), Q4 2019 to Q1 2021
27The changing supply and demand outlook for LGCs
This section explores the historical supply and demand dynamics for LGCs observed from
2015 through to 2020 and provides preliminary insights on how these dynamics are
expected to evolve from 2020 onwards.
LGC supply and demand dynamics 2015-2020
In mid-2015, the large-scale generation target was set at 33,000 GWh of additional
renewable generation in 2020 with that annual demand continuing each year until 2030.
In the 2015 calendar year, eligible generation was only 15,200 GWh, and the challenge to
meet the 2020 target was significant – a 117% increase in annual generation over five
years. The Clean Energy Regulator estimated an additional 6.4 GW of installed capacity
would be required to meet the demand for LGCs through to 2020. 35 However, only 1.2 GW
reached financial close in 2016 with most of that coming in Quarter 4 of the year. There
was always going to be a LGC supply issue given the required 3 GW of capacity reaching
financial close was not achieved.
Hence, the steep trajectory to the 2020 target resulted in the LGC price rising quickly
through 2016, with spot prices peaking around $89.50 in October 2016 as the market
foresaw future scarcity. Forward prices exceeded spot prices over this period, indicating
an anticipated supply deficit market outlook. 36 This provided a very strong investment
signal for new build to meet the target. By the end of 2016, the market had begun to
respond to the settled policy and a healthy pipeline of potential projects with a combined
capacity of 1.5GW had emerged. Newly committed power station announcements with a
high proportion of solar projects, typically with faster construction times than windfarms,
improved the future outlook for supply of LGCs, but was not sufficient to cover the future
supply shortfall resulting from well less than 3 GW reaching financial close in 2016.
In early 2017, the Hazelwood coal fired power station closed with only 5 months’ notice,
resulting in wholesale electricity prices increasing from an average of $52 per MWh in
2016 to $96 per MWh in 2017. 37 This resulted in the total build signal (LGCs and wholesale
electricity price) reaching almost $190 per MWh. This supported a very large 3.6 GW of
projects reaching financial close in that year.
2018 saw the strong pipeline of committed projects transitioning to completion, and more
financial close announcements flowing (5 GW in 2018). Consequently, LGC supply began to
increase and future supply adequacy concerns were allayed. LGC spot and forward prices
then declined steeply. 38 The growing confidence in the industry also saw a market shift as
forward LGC prices fell below the spot price, and have remained lower, indicating market
expectations that future supply would exceed future demand (see Figure 2.6).
35 The Clean Energy Regulator said that 3 GW needed to reach financial close in 2016, 2 GW in 2017 and 1 GW in 2018 to both meet the target in
2020 and provide sufficient LGC liquidity in the market to meet all intervening years’ targets.
36 RenewEconomy, Renewable energy market hurtles towards a penalty price, April 2016.
37
For more information see the Australian Energy Regulator’s Hazelwood advice wholesale performance monitoring report.
38 LGC spot prices dropped from $85 to around $47 over the course of 2018.
28On 17 July 2018 the Clean Energy Regulator announced that it had no concerns if market
participants took shortfall charge as it had become clear that sufficient capacity would be
built to meet the 2020 target, but LGC supply to meet some annual targets will be
insufficient. On 17 December 2019, the Treasurer advised that the tax law would be
amended to ensure the redemption of shortfall through surrender of LGCs within the
allowable 3-year period would be tax neutral. These two steps made it clear that a
commercial decision to take shortfall and redeem in the future at a lower cost and when
more LGCs would be available would not raise difficulties.
Figure 2.6 Historical LGC and forward prices ($AUD), Quarter 1 2015 to Quarter 1 2021
Future supply and demand dynamics to 2025
Beyond 2020, the supply and demand dynamics for LGCs is expected to materially shift.
Supply of LGCs is expected to continue to increase well beyond the 33,000 GWh target.
Additional demand to the legislated demand is being driven by entities seeking shortfall
charge refunds and rapid growth in voluntary demand. These drivers are likely to be price
sensitive and may compete with other available carbon units that can be used to meet
corporate emissions reduction goals.
Drivers of supply
The supply of LGCs is expected to remain strong moving forward, with 37 to 40 million
LGCs expected in 2021. This supply will grow further in future years, as most of the 6.9 GW
of projects tracked on the committed and probable pipeline should continue to progress
towards completion. Beyond these, there are numerous gigawatt-scale projects, and other
renewable energy initiatives such as renewable energy zones, that should drive renewable
investment for years to come. As mentioned earlier in this chapter, the risk to ongoing
large-scale renewables projects being built largely relates to the pace of transmission and
interconnector upgrades.
29Redeeming shortfall charge
Liable entities have used the shortfall redemption mechanism since 2018 to shift their
demand for LGCs into future years. However, this has led to a material deficit of LGCs
accumulating over time (see Figure 2.7) as 16 million LGCs are eligible for shortfall charge
refunds over the coming years with $1 billion in consolidated revenue.
Figure 2.7 LGC shortfall charge claimed and unclaimed, 2014 to 2020
This accumulated shortfall demand brings the effective balance of LGCs after the 2020
surrender date to a 6.8 million LGC deficit (see Table 2.3). This shortfall demand is
expected to be realised as liable entities have a strong economic incentive to surrender
LGCs and recoup shortfall charges. This incentive was further clarified by the taxation
amendment which will ensure no tax is payable on the shortfall charge refund amount of
$65, this mirrors the arrangement where no deduction can be taken for shortfall
payments. This amendment is an announced yet unenacted measure.
Table 2.3 Effective LGC supply demand balance 2020, after including shortfall
Supply Demand
LGCs available from previous assessment years +7.4 million
2020 LGC supply available for surrender +33.2 million
LGCs surrendered on 15 February 2021 -26.9 million
Shortfall charge refunds -1.05 million
Voluntary surrenders -4 million
Total balance in Rec Registry at 16 February 2021a +9.2 million
LGCs that can be redeemed under the 3-year rule - 16 million
Effective balance after including shortfall -6.8 million
a This value includes LGCs created in early 2021
30Surrendering LGCs to redeem paid shortfall is currently an attractive proposition. Based on
the 31 March 2021 LGC spot prices of $33, a liable entity surrendering an LGC in 2021
against a prior year shortfall would receive a refund of the $65 shortfall charge that is non
assessable income for tax purposes which, after removing the cost of the LGCs, would see
net $32 return to the liable entity.
Given current market conditions, refunding shortfall will remain attractive for the
foreseeable future. The Clean Energy Regulator expects that entities seeking shortfall
charge refunds will remain a material demand for LGCs over the next few years. This will
be a feature of the market moving forward as long as forward prices continue to track
below spot prices.
Potential growth in voluntary demand
Voluntary demand and its potential for growth is the most significant watch point of the
LGC market beyond 2020. The voluntary demand growth rate of 33% year on year in
Quarter 1 2021 and the very large 2020 voluntary demand surrender result of 4 million
LGCs are a positive sign for growth in this sector. Other initiatives such as the Guarantee of
Origin for hydrogen and the Corporate Emissions Reduction Transparency report may
accelerate the growing voluntary ambition and further increase demand for LGCs.
For more information see Chapter 4 on voluntary demand.
LGC-ACCU price convergence
The forward price of LGCs continues to track below the spot price of LGCs, indicating
market expectations that LGC prices will continue to trend down. The decline of LGC prices
is expected to eventually lead to LGC prices reaching parity with ACCU prices in terms of
value per tonne of carbon abatement.
312.5. Key dates
Date Event Significance
14 February 2022 Lodgement of energy This will be the final date for liable entities to:
acquisition statement
• lodge their energy acquisition statement(s) and
and surrender of LGCs
surrender LGCs for the assessment year, and
Submit Electricity
• pay any applicable shortfall charges for the
Generation Returns
assessment year.
32You can also read